Bahamian vs Immigrants from Haiti Births to Unmarried Women
COMPARE
Bahamian
Immigrants from Haiti
Births to Unmarried Women
Births to Unmarried Women Comparison
Bahamians
Immigrants from Haiti
40.8%
BIRTHS TO UNMARRIED WOMEN
0.0/ 100
METRIC RATING
321st/ 347
METRIC RANK
38.9%
BIRTHS TO UNMARRIED WOMEN
0.0/ 100
METRIC RATING
305th/ 347
METRIC RANK
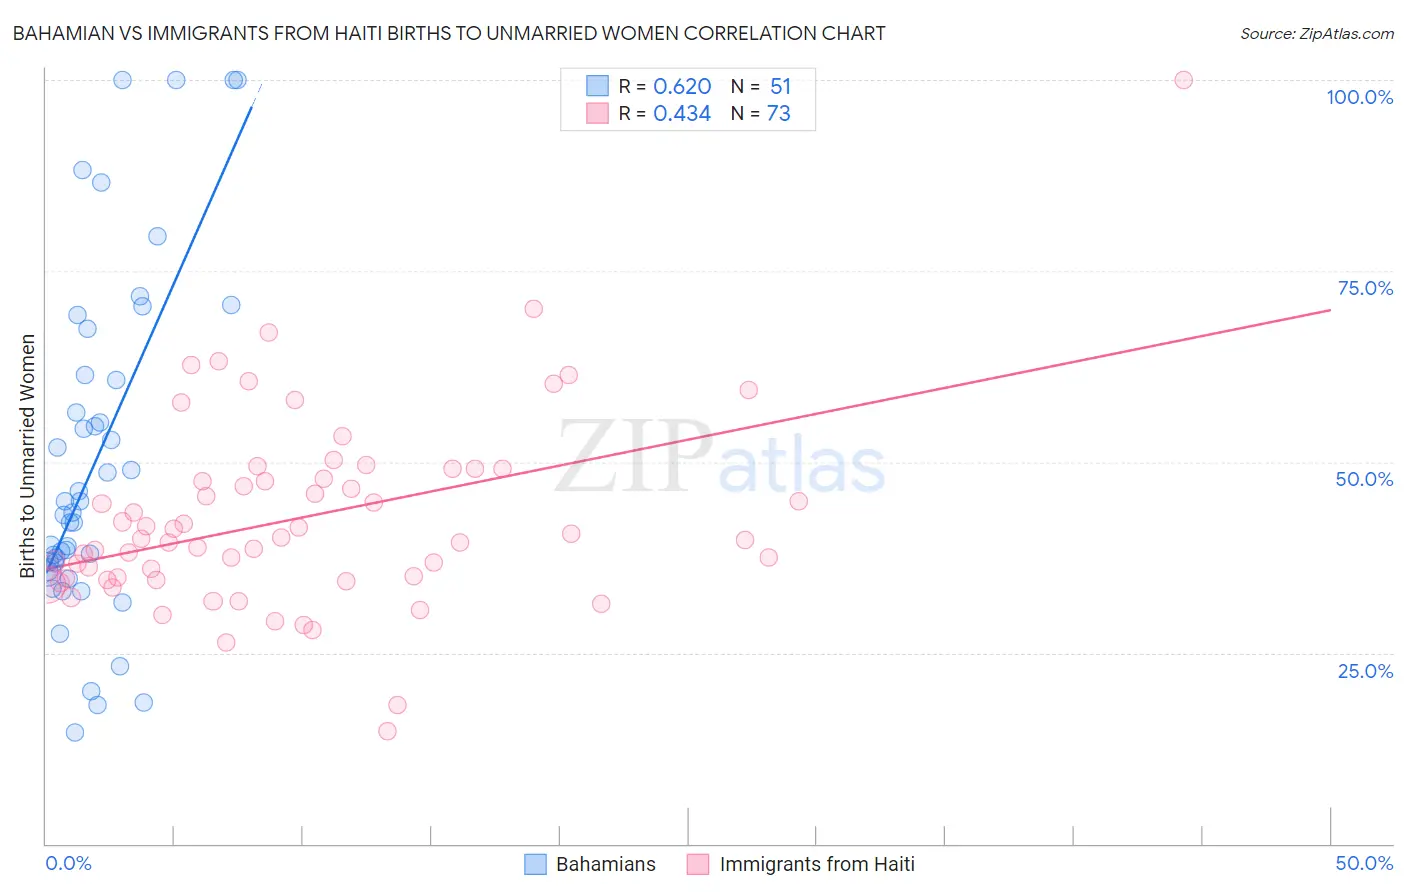
Bahamian vs Immigrants from Haiti Births to Unmarried Women Correlation Chart
The statistical analysis conducted on geographies consisting of 110,519,656 people shows a significant positive correlation between the proportion of Bahamians and percentage of births to unmarried women in the United States with a correlation coefficient (R) of 0.620 and weighted average of 40.8%. Similarly, the statistical analysis conducted on geographies consisting of 215,750,595 people shows a moderate positive correlation between the proportion of Immigrants from Haiti and percentage of births to unmarried women in the United States with a correlation coefficient (R) of 0.434 and weighted average of 38.9%, a difference of 4.9%.
Births to Unmarried Women Correlation Summary
| Measurement | Bahamian | Immigrants from Haiti |
| Minimum | 14.6% | 14.8% |
| Maximum | 100.0% | 100.0% |
| Range | 85.4% | 85.2% |
| Mean | 50.1% | 42.7% |
| Median | 43.3% | 39.9% |
| Interquartile 25% (IQ1) | 35.7% | 34.7% |
| Interquartile 75% (IQ3) | 61.4% | 48.5% |
| Interquartile Range (IQR) | 25.6% | 13.8% |
| Standard Deviation (Sample) | 22.3% | 12.8% |
| Standard Deviation (Population) | 22.1% | 12.7% |
Demographics Similar to Bahamians and Immigrants from Haiti by Births to Unmarried Women
In terms of births to unmarried women, the demographic groups most similar to Bahamians are Cajun (41.0%, a difference of 0.49%), Sioux (41.0%, a difference of 0.56%), Crow (40.4%, a difference of 1.0%), Yakama (40.3%, a difference of 1.1%), and Immigrants from Bahamas (40.1%, a difference of 1.6%). Similarly, the demographic groups most similar to Immigrants from Haiti are Yaqui (38.8%, a difference of 0.10%), Immigrants from Jamaica (38.8%, a difference of 0.15%), Central American Indian (39.0%, a difference of 0.29%), Immigrants from Honduras (39.3%, a difference of 1.2%), and Aleut (39.3%, a difference of 1.3%).
| Demographics | Rating | Rank | Births to Unmarried Women |
| Immigrants | Jamaica | 0.0 /100 | #303 | Tragic 38.8% |
| Yaqui | 0.0 /100 | #304 | Tragic 38.8% |
| Immigrants | Haiti | 0.0 /100 | #305 | Tragic 38.9% |
| Central American Indians | 0.0 /100 | #306 | Tragic 39.0% |
| Immigrants | Honduras | 0.0 /100 | #307 | Tragic 39.3% |
| Aleuts | 0.0 /100 | #308 | Tragic 39.3% |
| Cubans | 0.0 /100 | #309 | Tragic 39.4% |
| Immigrants | Dominica | 0.0 /100 | #310 | Tragic 39.5% |
| Immigrants | Azores | 0.0 /100 | #311 | Tragic 39.6% |
| U.S. Virgin Islanders | 0.0 /100 | #312 | Tragic 39.6% |
| Africans | 0.0 /100 | #313 | Tragic 39.7% |
| Immigrants | Caribbean | 0.0 /100 | #314 | Tragic 39.8% |
| Dominicans | 0.0 /100 | #315 | Tragic 39.8% |
| Apache | 0.0 /100 | #316 | Tragic 39.9% |
| Immigrants | Dominican Republic | 0.0 /100 | #317 | Tragic 40.1% |
| Immigrants | Bahamas | 0.0 /100 | #318 | Tragic 40.1% |
| Yakama | 0.0 /100 | #319 | Tragic 40.3% |
| Crow | 0.0 /100 | #320 | Tragic 40.4% |
| Bahamians | 0.0 /100 | #321 | Tragic 40.8% |
| Cajuns | 0.0 /100 | #322 | Tragic 41.0% |
| Sioux | 0.0 /100 | #323 | Tragic 41.0% |