Zimbabwean vs Bolivian College, Under 1 year

COMPARE

Zimbabwean
Race
Ancestry
AfghanAfricanAlaska NativeAlaskan AthabascanAlbanianAleutAlsatianAmericanApacheArabArapahoArgentineanArmenianAssyrian/Chaldean/SyriacAustralianAustrianBahamianBangladeshiBarbadianBasqueBelgianBelizeanBermudanBhutaneseBlackfeetBrazilianBritishBritish West IndianBulgarianBurmeseCajunCambodianCanadianCape VerdeanCarpatho RusynCelticCentral AmericanCentral American IndianCherokeeCheyenneChickasawChileanChineseChippewaChoctawColombianColvilleComancheCosta RicanCreeCreekCroatianCrowCubanCypriotCzechCzechoslovakianDanishDelawareDominicanDutchDutch West IndianEastern EuropeanEcuadorianEgyptianEnglishEstonianEthiopianEuropeanFijianFilipinoFinnishFrenchFrench American IndianFrench CanadianGermanGerman RussianGhanaianGreekGuamanian/ChamorroGuatemalanGuyaneseHaitianHmongHonduranHopiHoumaHungarianIcelanderIndian (Asian)IndonesianInupiatIranianIraqiIrishIroquoisIsraeliItalianJamaicanJapaneseJordanianKenyanKiowaKoreanLaotianLatvianLebaneseLiberianLithuanianLumbeeLuxembourgerMacedonianMalaysianMalteseMarshalleseMenomineeMexicanMexican American IndianMongolianMoroccanNative HawaiianNavajoNepaleseNew ZealanderNicaraguanNigerianNorthern EuropeanNorwegianOkinawanOsageOttawaPaiutePakistaniPalestinianPanamanianParaguayanPennsylvania GermanPeruvianPimaPolishPortuguesePotawatomiPuebloPuerto RicanPuget Sound SalishRomanianRussianSalvadoranSamoanScandinavianScotch-IrishScottishSeminoleSenegaleseSerbianShoshoneSierra LeoneanSiouxSlavicSlovakSloveneSomaliSouth AfricanSouth AmericanSouth American IndianSoviet UnionSpaniardSpanishSpanish AmericanSpanish American IndianSri LankanSubsaharan AfricanSudaneseSwedishSwissSyrianTaiwaneseThaiTlingit-HaidaTohono O'OdhamTonganTrinidadian and TobagonianTsimshianTurkishU.S. Virgin IslanderUgandanUkrainianUruguayanUteVenezuelanVietnameseWelshWest IndianYakamaYaquiYugoslavianYumanYup'ikZimbabwean
Immigration
NonimmigrantsImmigrantsAfghanistanAfricaAlbaniaArgentinaArmeniaAsiaAustraliaAustriaBahamasBangladeshBarbadosBelarusBelgiumBelizeBoliviaBosnia and HerzegovinaBrazilBulgariaBurma/MyanmarCabo VerdeCambodiaCameroonCanadaCaribbeanCentral AmericaChileChinaColombiaCongoCosta RicaCroatiaCubaCzechoslovakiaDenmarkDominicaDominican RepublicEastern AfricaEastern AsiaEastern EuropeEcuadorEgyptEl SalvadorEnglandEritreaEthiopiaEuropeFijiFranceGermanyGhanaGreeceGrenadaGuatemalaGuyanaHaitiHondurasHong KongHungaryIndiaIndonesiaIranIraqIrelandIsraelItalyJamaicaJapanJordanKazakhstanKenyaKoreaKuwaitLaosLatin AmericaLatviaLebanonLiberiaLithuaniaMalaysiaMexicoMicronesiaMiddle AfricaMoldovaMoroccoNepalNetherlandsNicaraguaNigeriaNorth AmericaNorth MacedoniaNorthern AfricaNorthern EuropeNorwayOceaniaPakistanPanamaPeruPhilippinesPolandPortugalRomaniaRussiaSaudi ArabiaScotlandSenegalSerbiaSierra LeoneSingaporeSomaliaSouth AfricaSouth AmericaSouth Central AsiaSouth Eastern AsiaSouthern EuropeSpainSri LankaSt. Vincent and the GrenadinesSudanSwedenSwitzerlandSyriaTaiwanThailandTrinidad and TobagoTurkeyUgandaUkraineUruguayUzbekistanVenezuelaVietnamWest IndiesWestern AfricaWestern AsiaWestern EuropeYemenZaireZimbabweAzores
Bolivian
Race
Ancestry
AfghanAfricanAlaska NativeAlaskan AthabascanAlbanianAleutAlsatianAmericanApacheArabArapahoArgentineanArmenianAssyrian/Chaldean/SyriacAustralianAustrianBahamianBangladeshiBarbadianBasqueBelgianBelizeanBermudanBhutaneseBlackfeetBolivianBrazilianBritishBritish West IndianBulgarianBurmeseCajunCambodianCanadianCape VerdeanCarpatho RusynCelticCentral AmericanCentral American IndianCherokeeCheyenneChickasawChileanChineseChippewaChoctawColombianColvilleComancheCosta RicanCreeCreekCroatianCrowCubanCypriotCzechCzechoslovakianDanishDelawareDominicanDutchDutch West IndianEastern EuropeanEcuadorianEgyptianEnglishEstonianEthiopianEuropeanFijianFilipinoFinnishFrenchFrench American IndianFrench CanadianGermanGerman RussianGhanaianGreekGuamanian/ChamorroGuatemalanGuyaneseHaitianHmongHonduranHopiHoumaHungarianIcelanderIndian (Asian)IndonesianInupiatIranianIraqiIrishIroquoisIsraeliItalianJamaicanJapaneseJordanianKenyanKiowaKoreanLaotianLatvianLebaneseLiberianLithuanianLumbeeLuxembourgerMacedonianMalaysianMalteseMarshalleseMenomineeMexicanMexican American IndianMongolianMoroccanNative HawaiianNavajoNepaleseNew ZealanderNicaraguanNigerianNorthern EuropeanNorwegianOkinawanOsageOttawaPaiutePakistaniPalestinianPanamanianParaguayanPennsylvania GermanPeruvianPimaPolishPortuguesePotawatomiPuebloPuerto RicanPuget Sound SalishRomanianRussianSalvadoranSamoanScandinavianScotch-IrishScottishSeminoleSenegaleseSerbianShoshoneSierra LeoneanSiouxSlavicSlovakSloveneSomaliSouth AfricanSouth AmericanSouth American IndianSoviet UnionSpaniardSpanishSpanish AmericanSpanish American IndianSri LankanSubsaharan AfricanSudaneseSwedishSwissSyrianTaiwaneseThaiTlingit-HaidaTohono O'OdhamTonganTrinidadian and TobagonianTsimshianTurkishU.S. Virgin IslanderUgandanUkrainianUruguayanUteVenezuelanVietnameseWelshWest IndianYakamaYaquiYugoslavianYumanYup'ik
Immigration
NonimmigrantsImmigrantsAfghanistanAfricaAlbaniaArgentinaArmeniaAsiaAustraliaAustriaBahamasBangladeshBarbadosBelarusBelgiumBelizeBoliviaBosnia and HerzegovinaBrazilBulgariaBurma/MyanmarCabo VerdeCambodiaCameroonCanadaCaribbeanCentral AmericaChileChinaColombiaCongoCosta RicaCroatiaCubaCzechoslovakiaDenmarkDominicaDominican RepublicEastern AfricaEastern AsiaEastern EuropeEcuadorEgyptEl SalvadorEnglandEritreaEthiopiaEuropeFijiFranceGermanyGhanaGreeceGrenadaGuatemalaGuyanaHaitiHondurasHong KongHungaryIndiaIndonesiaIranIraqIrelandIsraelItalyJamaicaJapanJordanKazakhstanKenyaKoreaKuwaitLaosLatin AmericaLatviaLebanonLiberiaLithuaniaMalaysiaMexicoMicronesiaMiddle AfricaMoldovaMoroccoNepalNetherlandsNicaraguaNigeriaNorth AmericaNorth MacedoniaNorthern AfricaNorthern EuropeNorwayOceaniaPakistanPanamaPeruPhilippinesPolandPortugalRomaniaRussiaSaudi ArabiaScotlandSenegalSerbiaSierra LeoneSingaporeSomaliaSouth AfricaSouth AmericaSouth Central AsiaSouth Eastern AsiaSouthern EuropeSpainSri LankaSt. Vincent and the GrenadinesSudanSwedenSwitzerlandSyriaTaiwanThailandTrinidad and TobagoTurkeyUgandaUkraineUruguayUzbekistanVenezuelaVietnamWest IndiesWestern AfricaWestern AsiaWestern EuropeYemenZaireZimbabweAzores
College, Under 1 year
Income
Poverty
Unemployment
Labor Participation
Family Structure
Vehicle Availability
Education Level
Disability

College, Under 1 year Comparison

Zimbabweans

Bolivians

Exceptional
Exceptional
69.9%
COLLEGE, UNDER 1 YEAR
99.8/ 100
METRIC RATING
50th/ 347
METRIC RANK
68.7%
COLLEGE, UNDER 1 YEAR
99.0/ 100
METRIC RATING
72nd/ 347
METRIC RANK

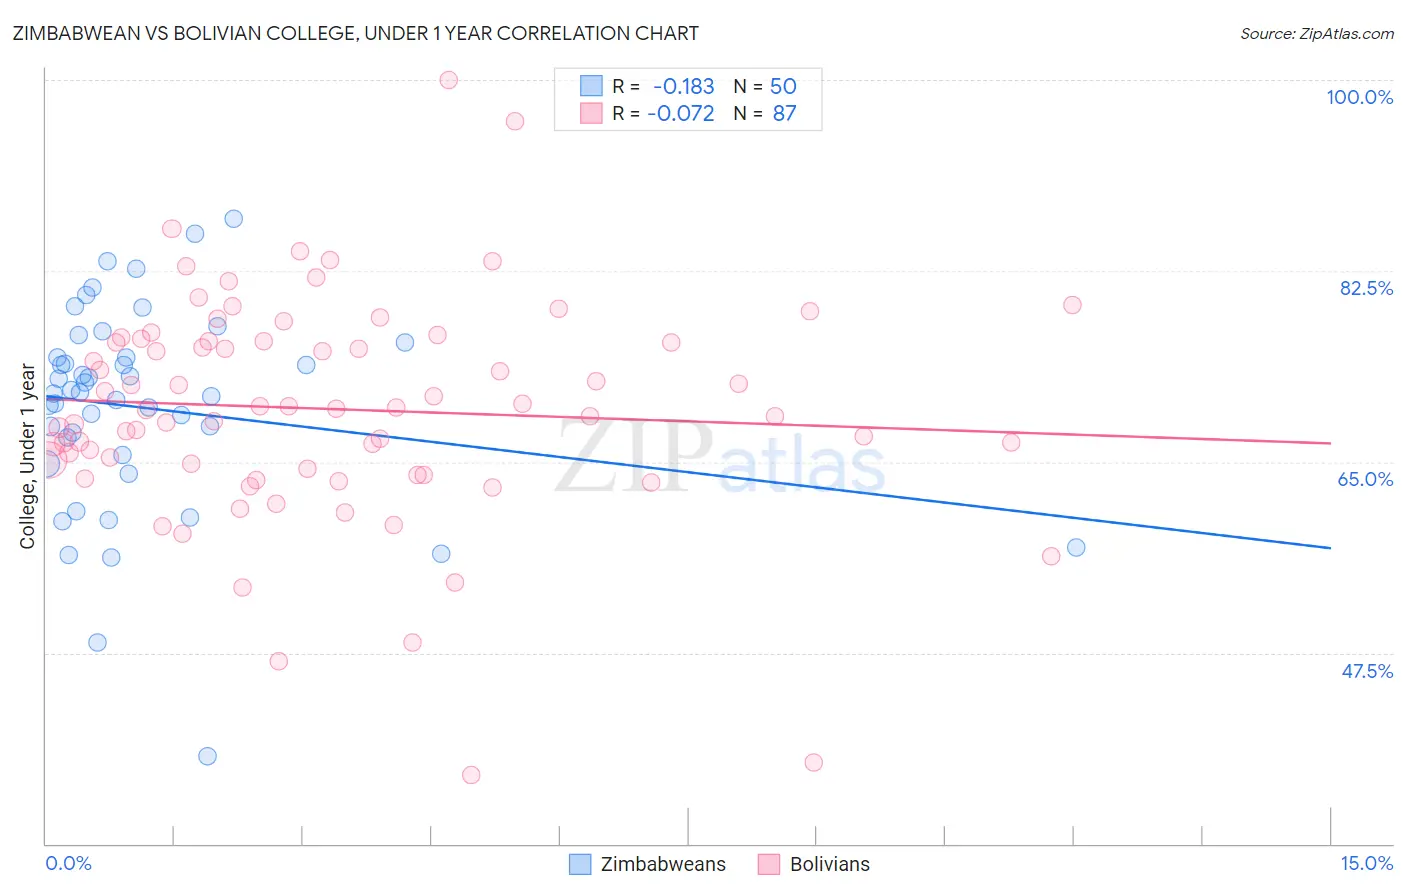
Zimbabwean vs Bolivian College, Under 1 year Correlation Chart

The statistical analysis conducted on geographies consisting of 69,203,226 people shows a poor negative correlation between the proportion of Zimbabweans and percentage of population with at least college, under 1 year education in the United States with a correlation coefficient (R) of -0.183 and weighted average of 69.9%. Similarly, the statistical analysis conducted on geographies consisting of 184,667,998 people shows a slight negative correlation between the proportion of Bolivians and percentage of population with at least college, under 1 year education in the United States with a correlation coefficient (R) of -0.072 and weighted average of 68.7%, a difference of 1.7%.
Zimbabwean vs Bolivian College, Under 1 year

College, Under 1 year Correlation Summary

MeasurementZimbabweanBolivian
Minimum38.0%36.3%
Maximum87.3%100.0%
Range49.3%63.7%
Mean69.9%69.8%
Median71.3%69.8%
Interquartile 25% (IQ1)65.6%64.4%
Interquartile 75% (IQ3)74.6%76.1%
Interquartile Range (IQR)9.0%11.7%
Standard Deviation (Sample)9.4%10.3%
Standard Deviation (Population)9.3%10.3%

Similar Demographics by College, Under 1 year

Demographics Similar to Zimbabweans by College, Under 1 year

In terms of college, under 1 year, the demographic groups most similar to Zimbabweans are Mongolian (69.9%, a difference of 0.040%), Immigrants from Russia (69.9%, a difference of 0.060%), Immigrants from Austria (70.0%, a difference of 0.12%), Immigrants from Netherlands (70.0%, a difference of 0.16%), and Immigrants from Bulgaria (70.0%, a difference of 0.22%).
DemographicsRating | RankCollege, Under 1 year
Israelis
99.9
/100
|
#43
Exceptional
70.2%
New Zealanders
99.9
/100
|
#44
Exceptional
70.2%
Immigrants | Norway
99.9
/100
|
#45
Exceptional
70.2%
Immigrants | Latvia
99.9
/100
|
#46
Exceptional
70.1%
Immigrants | Bulgaria
99.8
/100
|
#47
Exceptional
70.0%
Immigrants | Netherlands
99.8
/100
|
#48
Exceptional
70.0%
Immigrants | Austria
99.8
/100
|
#49
Exceptional
70.0%
Zimbabweans
99.8
/100
|
#50
Exceptional
69.9%
Mongolians
99.8
/100
|
#51
Exceptional
69.9%
Immigrants | Russia
99.8
/100
|
#52
Exceptional
69.9%
South Africans
99.7
/100
|
#53
Exceptional
69.7%
Immigrants | Czechoslovakia
99.7
/100
|
#54
Exceptional
69.6%
Maltese
99.7
/100
|
#55
Exceptional
69.5%
Immigrants | Scotland
99.6
/100
|
#56
Exceptional
69.4%
Asians
99.6
/100
|
#57
Exceptional
69.4%

Demographics Similar to Bolivians by College, Under 1 year

In terms of college, under 1 year, the demographic groups most similar to Bolivians are Immigrants from Europe (68.8%, a difference of 0.040%), Immigrants from England (68.7%, a difference of 0.040%), Lithuanian (68.8%, a difference of 0.060%), Swedish (68.7%, a difference of 0.090%), and Immigrants from Romania (68.9%, a difference of 0.22%).
DemographicsRating | RankCollege, Under 1 year
Immigrants | Moldova
99.3
/100
|
#65
Exceptional
69.0%
Immigrants | North America
99.3
/100
|
#66
Exceptional
69.0%
Immigrants | Zimbabwe
99.2
/100
|
#67
Exceptional
68.9%
Immigrants | Indonesia
99.2
/100
|
#68
Exceptional
68.9%
Immigrants | Romania
99.2
/100
|
#69
Exceptional
68.9%
Lithuanians
99.1
/100
|
#70
Exceptional
68.8%
Immigrants | Europe
99.1
/100
|
#71
Exceptional
68.8%
Bolivians
99.0
/100
|
#72
Exceptional
68.7%
Immigrants | England
99.0
/100
|
#73
Exceptional
68.7%
Swedes
98.9
/100
|
#74
Exceptional
68.7%
Immigrants | Western Europe
98.6
/100
|
#75
Exceptional
68.5%
Laotians
98.6
/100
|
#76
Exceptional
68.5%
British
98.6
/100
|
#77
Exceptional
68.5%
Danes
98.6
/100
|
#78
Exceptional
68.5%
Greeks
98.6
/100
|
#79
Exceptional
68.5%