Subsaharan African vs Immigrants from Brazil College, Under 1 year

COMPARE

Subsaharan African
Race
Ancestry
AfghanAfricanAlaska NativeAlaskan AthabascanAlbanianAleutAlsatianAmericanApacheArabArapahoArgentineanArmenianAssyrian/Chaldean/SyriacAustralianAustrianBahamianBangladeshiBarbadianBasqueBelgianBelizeanBermudanBhutaneseBlackfeetBolivianBrazilianBritishBritish West IndianBulgarianBurmeseCajunCambodianCanadianCape VerdeanCarpatho RusynCelticCentral AmericanCentral American IndianCherokeeCheyenneChickasawChileanChineseChippewaChoctawColombianColvilleComancheCosta RicanCreeCreekCroatianCrowCubanCypriotCzechCzechoslovakianDanishDelawareDominicanDutchDutch West IndianEastern EuropeanEcuadorianEgyptianEnglishEstonianEthiopianEuropeanFijianFilipinoFinnishFrenchFrench American IndianFrench CanadianGermanGerman RussianGhanaianGreekGuamanian/ChamorroGuatemalanGuyaneseHaitianHmongHonduranHopiHoumaHungarianIcelanderIndian (Asian)IndonesianInupiatIranianIraqiIrishIroquoisIsraeliItalianJamaicanJapaneseJordanianKenyanKiowaKoreanLaotianLatvianLebaneseLiberianLithuanianLumbeeLuxembourgerMacedonianMalaysianMalteseMarshalleseMenomineeMexicanMexican American IndianMongolianMoroccanNative HawaiianNavajoNepaleseNew ZealanderNicaraguanNigerianNorthern EuropeanNorwegianOkinawanOsageOttawaPaiutePakistaniPalestinianPanamanianParaguayanPennsylvania GermanPeruvianPimaPolishPortuguesePotawatomiPuebloPuerto RicanPuget Sound SalishRomanianRussianSalvadoranSamoanScandinavianScotch-IrishScottishSeminoleSenegaleseSerbianShoshoneSierra LeoneanSiouxSlavicSlovakSloveneSomaliSouth AfricanSouth AmericanSouth American IndianSoviet UnionSpaniardSpanishSpanish AmericanSpanish American IndianSri LankanSubsaharan AfricanSudaneseSwedishSwissSyrianTaiwaneseThaiTlingit-HaidaTohono O'OdhamTonganTrinidadian and TobagonianTsimshianTurkishU.S. Virgin IslanderUgandanUkrainianUruguayanUteVenezuelanVietnameseWelshWest IndianYakamaYaquiYugoslavianYumanYup'ikZimbabwean
Immigration
NonimmigrantsImmigrantsAfghanistanAfricaAlbaniaArgentinaArmeniaAsiaAustraliaAustriaBahamasBangladeshBarbadosBelarusBelgiumBelizeBoliviaBosnia and HerzegovinaBulgariaBurma/MyanmarCabo VerdeCambodiaCameroonCanadaCaribbeanCentral AmericaChileChinaColombiaCongoCosta RicaCroatiaCubaCzechoslovakiaDenmarkDominicaDominican RepublicEastern AfricaEastern AsiaEastern EuropeEcuadorEgyptEl SalvadorEnglandEritreaEthiopiaEuropeFijiFranceGermanyGhanaGreeceGrenadaGuatemalaGuyanaHaitiHondurasHong KongHungaryIndiaIndonesiaIranIraqIrelandIsraelItalyJamaicaJapanJordanKazakhstanKenyaKoreaKuwaitLaosLatin AmericaLatviaLebanonLiberiaLithuaniaMalaysiaMexicoMicronesiaMiddle AfricaMoldovaMoroccoNepalNetherlandsNicaraguaNigeriaNorth AmericaNorth MacedoniaNorthern AfricaNorthern EuropeNorwayOceaniaPakistanPanamaPeruPhilippinesPolandPortugalRomaniaRussiaSaudi ArabiaScotlandSenegalSerbiaSierra LeoneSingaporeSomaliaSouth AfricaSouth AmericaSouth Central AsiaSouth Eastern AsiaSouthern EuropeSpainSri LankaSt. Vincent and the GrenadinesSudanSwedenSwitzerlandSyriaTaiwanThailandTrinidad and TobagoTurkeyUgandaUkraineUruguayUzbekistanVenezuelaVietnamWest IndiesWestern AfricaWestern AsiaWestern EuropeYemenZaireZimbabweAzores
Immigrants from Brazil
Race
Ancestry
AfghanAfricanAlaska NativeAlaskan AthabascanAlbanianAleutAlsatianAmericanApacheArabArapahoArgentineanArmenianAssyrian/Chaldean/SyriacAustralianAustrianBahamianBangladeshiBarbadianBasqueBelgianBelizeanBermudanBhutaneseBlackfeetBolivianBrazilianBritishBritish West IndianBulgarianBurmeseCajunCambodianCanadianCape VerdeanCarpatho RusynCelticCentral AmericanCentral American IndianCherokeeCheyenneChickasawChileanChineseChippewaChoctawColombianColvilleComancheCosta RicanCreeCreekCroatianCrowCubanCypriotCzechCzechoslovakianDanishDelawareDominicanDutchDutch West IndianEastern EuropeanEcuadorianEgyptianEnglishEstonianEthiopianEuropeanFijianFilipinoFinnishFrenchFrench American IndianFrench CanadianGermanGerman RussianGhanaianGreekGuamanian/ChamorroGuatemalanGuyaneseHaitianHmongHonduranHopiHoumaHungarianIcelanderIndian (Asian)IndonesianInupiatIranianIraqiIrishIroquoisIsraeliItalianJamaicanJapaneseJordanianKenyanKiowaKoreanLaotianLatvianLebaneseLiberianLithuanianLumbeeLuxembourgerMacedonianMalaysianMalteseMarshalleseMenomineeMexicanMexican American IndianMongolianMoroccanNative HawaiianNavajoNepaleseNew ZealanderNicaraguanNigerianNorthern EuropeanNorwegianOkinawanOsageOttawaPaiutePakistaniPalestinianPanamanianParaguayanPennsylvania GermanPeruvianPimaPolishPortuguesePotawatomiPuebloPuerto RicanPuget Sound SalishRomanianRussianSalvadoranSamoanScandinavianScotch-IrishScottishSeminoleSenegaleseSerbianShoshoneSierra LeoneanSiouxSlavicSlovakSloveneSomaliSouth AfricanSouth AmericanSouth American IndianSoviet UnionSpaniardSpanishSpanish AmericanSpanish American IndianSri LankanSudaneseSwedishSwissSyrianTaiwaneseThaiTlingit-HaidaTohono O'OdhamTonganTrinidadian and TobagonianTsimshianTurkishU.S. Virgin IslanderUgandanUkrainianUruguayanUteVenezuelanVietnameseWelshWest IndianYakamaYaquiYugoslavianYumanYup'ikZimbabwean
Immigration
NonimmigrantsImmigrantsAfghanistanAfricaAlbaniaArgentinaArmeniaAsiaAustraliaAustriaBahamasBangladeshBarbadosBelarusBelgiumBelizeBoliviaBosnia and HerzegovinaBrazilBulgariaBurma/MyanmarCabo VerdeCambodiaCameroonCanadaCaribbeanCentral AmericaChileChinaColombiaCongoCosta RicaCroatiaCubaCzechoslovakiaDenmarkDominicaDominican RepublicEastern AfricaEastern AsiaEastern EuropeEcuadorEgyptEl SalvadorEnglandEritreaEthiopiaEuropeFijiFranceGermanyGhanaGreeceGrenadaGuatemalaGuyanaHaitiHondurasHong KongHungaryIndiaIndonesiaIranIraqIrelandIsraelItalyJamaicaJapanJordanKazakhstanKenyaKoreaKuwaitLaosLatin AmericaLatviaLebanonLiberiaLithuaniaMalaysiaMexicoMicronesiaMiddle AfricaMoldovaMoroccoNepalNetherlandsNicaraguaNigeriaNorth AmericaNorth MacedoniaNorthern AfricaNorthern EuropeNorwayOceaniaPakistanPanamaPeruPhilippinesPolandPortugalRomaniaRussiaSaudi ArabiaScotlandSenegalSerbiaSierra LeoneSingaporeSomaliaSouth AfricaSouth AmericaSouth Central AsiaSouth Eastern AsiaSouthern EuropeSpainSri LankaSt. Vincent and the GrenadinesSudanSwedenSwitzerlandSyriaTaiwanThailandTrinidad and TobagoTurkeyUgandaUkraineUruguayUzbekistanVenezuelaVietnamWest IndiesWestern AfricaWestern AsiaWestern EuropeYemenZaireZimbabweAzores
College, Under 1 year
Income
Poverty
Unemployment
Labor Participation
Family Structure
Vehicle Availability
Education Level
Disability

College, Under 1 year Comparison

Sub-Saharan Africans

Immigrants from Brazil

Tragic
Excellent
63.2%
COLLEGE, UNDER 1 YEAR
4.4/ 100
METRIC RATING
224th/ 347
METRIC RANK
66.9%
COLLEGE, UNDER 1 YEAR
88.3/ 100
METRIC RATING
133rd/ 347
METRIC RANK

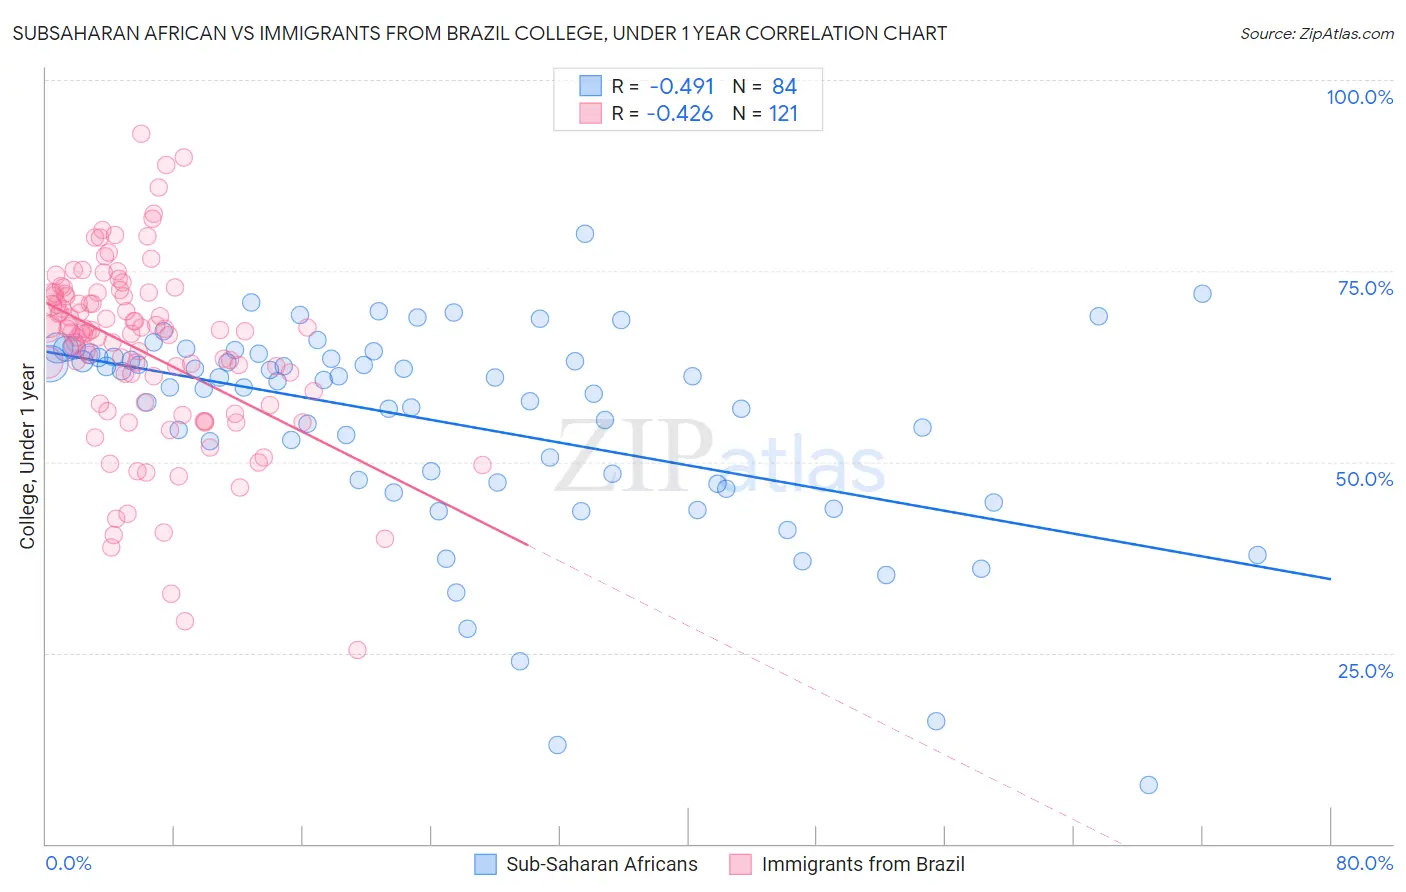
Subsaharan African vs Immigrants from Brazil College, Under 1 year Correlation Chart

The statistical analysis conducted on geographies consisting of 508,213,731 people shows a moderate negative correlation between the proportion of Sub-Saharan Africans and percentage of population with at least college, under 1 year education in the United States with a correlation coefficient (R) of -0.491 and weighted average of 63.2%. Similarly, the statistical analysis conducted on geographies consisting of 343,021,697 people shows a moderate negative correlation between the proportion of Immigrants from Brazil and percentage of population with at least college, under 1 year education in the United States with a correlation coefficient (R) of -0.426 and weighted average of 66.9%, a difference of 5.8%.
Subsaharan African vs Immigrants from Brazil College, Under 1 year

College, Under 1 year Correlation Summary

MeasurementSubsaharan AfricanImmigrants from Brazil
Minimum7.7%25.4%
Maximum79.8%93.0%
Range72.1%67.7%
Mean55.3%64.6%
Median60.7%67.0%
Interquartile 25% (IQ1)47.4%57.5%
Interquartile 75% (IQ3)63.9%71.9%
Interquartile Range (IQR)16.5%14.4%
Standard Deviation (Sample)13.7%12.0%
Standard Deviation (Population)13.6%11.9%

Similar Demographics by College, Under 1 year

Demographics Similar to Sub-Saharan Africans by College, Under 1 year

In terms of college, under 1 year, the demographic groups most similar to Sub-Saharan Africans are Immigrants from Costa Rica (63.2%, a difference of 0.030%), Immigrants from Peru (63.1%, a difference of 0.10%), Immigrants from Colombia (63.1%, a difference of 0.12%), Immigrants from Senegal (63.3%, a difference of 0.15%), and Cree (63.3%, a difference of 0.20%).
DemographicsRating | RankCollege, Under 1 year
Immigrants | Uruguay
5.8
/100
|
#217
Tragic
63.4%
Immigrants | Panama
5.7
/100
|
#218
Tragic
63.4%
Immigrants | Fiji
5.7
/100
|
#219
Tragic
63.4%
Portuguese
5.6
/100
|
#220
Tragic
63.4%
Cree
5.2
/100
|
#221
Tragic
63.3%
Immigrants | Senegal
5.0
/100
|
#222
Tragic
63.3%
Immigrants | Costa Rica
4.5
/100
|
#223
Tragic
63.2%
Sub-Saharan Africans
4.4
/100
|
#224
Tragic
63.2%
Immigrants | Peru
4.0
/100
|
#225
Tragic
63.1%
Immigrants | Colombia
4.0
/100
|
#226
Tragic
63.1%
Immigrants | Ghana
3.7
/100
|
#227
Tragic
63.1%
Samoans
3.3
/100
|
#228
Tragic
63.0%
Liberians
3.2
/100
|
#229
Tragic
63.0%
Immigrants | Nonimmigrants
3.0
/100
|
#230
Tragic
62.9%
Immigrants | Western Africa
2.4
/100
|
#231
Tragic
62.8%

Demographics Similar to Immigrants from Brazil by College, Under 1 year

In terms of college, under 1 year, the demographic groups most similar to Immigrants from Brazil are Polish (66.9%, a difference of 0.010%), Finnish (66.9%, a difference of 0.030%), Iraqi (66.8%, a difference of 0.030%), Canadian (66.8%, a difference of 0.040%), and Ugandan (66.8%, a difference of 0.050%).
DemographicsRating | RankCollege, Under 1 year
Alsatians
91.3
/100
|
#126
Exceptional
67.1%
Czechs
90.8
/100
|
#127
Exceptional
67.1%
Scottish
90.2
/100
|
#128
Exceptional
67.0%
Immigrants | Eastern Africa
89.5
/100
|
#129
Excellent
67.0%
Immigrants | Syria
89.0
/100
|
#130
Excellent
66.9%
Finns
88.6
/100
|
#131
Excellent
66.9%
Poles
88.4
/100
|
#132
Excellent
66.9%
Immigrants | Brazil
88.3
/100
|
#133
Excellent
66.9%
Iraqis
88.0
/100
|
#134
Excellent
66.8%
Canadians
87.9
/100
|
#135
Excellent
66.8%
Ugandans
87.8
/100
|
#136
Excellent
66.8%
Immigrants | Chile
87.4
/100
|
#137
Excellent
66.8%
Immigrants | Italy
86.9
/100
|
#138
Excellent
66.8%
Venezuelans
85.9
/100
|
#139
Excellent
66.7%
Slavs
85.9
/100
|
#140
Excellent
66.7%