Paraguayan vs Immigrants from Western Europe GED/Equivalency

COMPARE

Paraguayan
Race
Ancestry
AfghanAfricanAlaska NativeAlaskan AthabascanAlbanianAleutAlsatianAmericanApacheArabArapahoArgentineanArmenianAssyrian/Chaldean/SyriacAustralianAustrianBahamianBangladeshiBarbadianBasqueBelgianBelizeanBermudanBhutaneseBlackfeetBolivianBrazilianBritishBritish West IndianBulgarianBurmeseCajunCambodianCanadianCape VerdeanCarpatho RusynCelticCentral AmericanCentral American IndianCherokeeCheyenneChickasawChileanChineseChippewaChoctawColombianColvilleComancheCosta RicanCreeCreekCroatianCrowCubanCypriotCzechCzechoslovakianDanishDelawareDominicanDutchDutch West IndianEastern EuropeanEcuadorianEgyptianEnglishEstonianEthiopianEuropeanFijianFilipinoFinnishFrenchFrench American IndianFrench CanadianGermanGerman RussianGhanaianGreekGuamanian/ChamorroGuatemalanGuyaneseHaitianHmongHonduranHopiHoumaHungarianIcelanderIndian (Asian)IndonesianInupiatIranianIraqiIrishIroquoisIsraeliItalianJamaicanJapaneseJordanianKenyanKiowaKoreanLaotianLatvianLebaneseLiberianLithuanianLumbeeLuxembourgerMacedonianMalaysianMalteseMarshalleseMenomineeMexicanMexican American IndianMongolianMoroccanNative HawaiianNavajoNepaleseNew ZealanderNicaraguanNigerianNorthern EuropeanNorwegianOkinawanOsageOttawaPaiutePakistaniPalestinianPanamanianParaguayanPennsylvania GermanPeruvianPimaPolishPortuguesePotawatomiPuebloPuerto RicanPuget Sound SalishRomanianRussianSalvadoranSamoanScandinavianScotch-IrishScottishSeminoleSenegaleseSerbianShoshoneSierra LeoneanSiouxSlavicSlovakSloveneSomaliSouth AfricanSouth AmericanSouth American IndianSoviet UnionSpaniardSpanishSpanish AmericanSpanish American IndianSri LankanSubsaharan AfricanSudaneseSwedishSwissSyrianTaiwaneseThaiTlingit-HaidaTohono O'OdhamTonganTrinidadian and TobagonianTsimshianTurkishU.S. Virgin IslanderUgandanUkrainianUruguayanUteVenezuelanVietnameseWelshWest IndianYakamaYaquiYugoslavianYumanYup'ikZimbabwean
Immigration
NonimmigrantsImmigrantsAfghanistanAfricaAlbaniaArgentinaArmeniaAsiaAustraliaAustriaBahamasBangladeshBarbadosBelarusBelgiumBelizeBoliviaBosnia and HerzegovinaBrazilBulgariaBurma/MyanmarCabo VerdeCambodiaCameroonCanadaCaribbeanCentral AmericaChileChinaColombiaCongoCosta RicaCroatiaCubaCzechoslovakiaDenmarkDominicaDominican RepublicEastern AfricaEastern AsiaEastern EuropeEcuadorEgyptEl SalvadorEnglandEritreaEthiopiaEuropeFijiFranceGermanyGhanaGreeceGrenadaGuatemalaGuyanaHaitiHondurasHong KongHungaryIndiaIndonesiaIranIraqIrelandIsraelItalyJamaicaJapanJordanKazakhstanKenyaKoreaKuwaitLaosLatin AmericaLatviaLebanonLiberiaLithuaniaMalaysiaMexicoMicronesiaMiddle AfricaMoldovaMoroccoNepalNetherlandsNicaraguaNigeriaNorth AmericaNorth MacedoniaNorthern AfricaNorthern EuropeNorwayOceaniaPakistanPanamaPeruPhilippinesPolandPortugalRomaniaRussiaSaudi ArabiaScotlandSenegalSerbiaSierra LeoneSingaporeSomaliaSouth AfricaSouth AmericaSouth Central AsiaSouth Eastern AsiaSouthern EuropeSpainSri LankaSt. Vincent and the GrenadinesSudanSwedenSwitzerlandSyriaTaiwanThailandTrinidad and TobagoTurkeyUgandaUkraineUruguayUzbekistanVenezuelaVietnamWest IndiesWestern AfricaWestern AsiaYemenZaireZimbabweAzores
Immigrants from Western Europe
Race
Ancestry
AfghanAfricanAlaska NativeAlaskan AthabascanAlbanianAleutAlsatianAmericanApacheArabArapahoArgentineanArmenianAssyrian/Chaldean/SyriacAustralianAustrianBahamianBangladeshiBarbadianBasqueBelgianBelizeanBermudanBhutaneseBlackfeetBolivianBrazilianBritishBritish West IndianBulgarianBurmeseCajunCambodianCanadianCape VerdeanCarpatho RusynCelticCentral AmericanCentral American IndianCherokeeCheyenneChickasawChileanChineseChippewaChoctawColombianColvilleComancheCosta RicanCreeCreekCroatianCrowCubanCypriotCzechCzechoslovakianDanishDelawareDominicanDutchDutch West IndianEastern EuropeanEcuadorianEgyptianEnglishEstonianEthiopianEuropeanFijianFilipinoFinnishFrenchFrench American IndianFrench CanadianGermanGerman RussianGhanaianGreekGuamanian/ChamorroGuatemalanGuyaneseHaitianHmongHonduranHopiHoumaHungarianIcelanderIndian (Asian)IndonesianInupiatIranianIraqiIrishIroquoisIsraeliItalianJamaicanJapaneseJordanianKenyanKiowaKoreanLaotianLatvianLebaneseLiberianLithuanianLumbeeLuxembourgerMacedonianMalaysianMalteseMarshalleseMenomineeMexicanMexican American IndianMongolianMoroccanNative HawaiianNavajoNepaleseNew ZealanderNicaraguanNigerianNorthern EuropeanNorwegianOkinawanOsageOttawaPaiutePakistaniPalestinianPanamanianPennsylvania GermanPeruvianPimaPolishPortuguesePotawatomiPuebloPuerto RicanPuget Sound SalishRomanianRussianSalvadoranSamoanScandinavianScotch-IrishScottishSeminoleSenegaleseSerbianShoshoneSierra LeoneanSiouxSlavicSlovakSloveneSomaliSouth AfricanSouth AmericanSouth American IndianSoviet UnionSpaniardSpanishSpanish AmericanSpanish American IndianSri LankanSubsaharan AfricanSudaneseSwedishSwissSyrianTaiwaneseThaiTlingit-HaidaTohono O'OdhamTonganTrinidadian and TobagonianTsimshianTurkishU.S. Virgin IslanderUgandanUkrainianUruguayanUteVenezuelanVietnameseWelshWest IndianYakamaYaquiYugoslavianYumanYup'ikZimbabwean
Immigration
NonimmigrantsImmigrantsAfghanistanAfricaAlbaniaArgentinaArmeniaAsiaAustraliaAustriaBahamasBangladeshBarbadosBelarusBelgiumBelizeBoliviaBosnia and HerzegovinaBrazilBulgariaBurma/MyanmarCabo VerdeCambodiaCameroonCanadaCaribbeanCentral AmericaChileChinaColombiaCongoCosta RicaCroatiaCubaCzechoslovakiaDenmarkDominicaDominican RepublicEastern AfricaEastern AsiaEastern EuropeEcuadorEgyptEl SalvadorEnglandEritreaEthiopiaEuropeFijiFranceGermanyGhanaGreeceGrenadaGuatemalaGuyanaHaitiHondurasHong KongHungaryIndiaIndonesiaIranIraqIrelandIsraelItalyJamaicaJapanJordanKazakhstanKenyaKoreaKuwaitLaosLatin AmericaLatviaLebanonLiberiaLithuaniaMalaysiaMexicoMicronesiaMiddle AfricaMoldovaMoroccoNepalNetherlandsNicaraguaNigeriaNorth AmericaNorth MacedoniaNorthern AfricaNorthern EuropeNorwayOceaniaPakistanPanamaPeruPhilippinesPolandPortugalRomaniaRussiaSaudi ArabiaScotlandSenegalSerbiaSierra LeoneSingaporeSomaliaSouth AfricaSouth AmericaSouth Central AsiaSouth Eastern AsiaSouthern EuropeSpainSri LankaSt. Vincent and the GrenadinesSudanSwedenSwitzerlandSyriaTaiwanThailandTrinidad and TobagoTurkeyUgandaUkraineUruguayUzbekistanVenezuelaVietnamWest IndiesWestern AfricaWestern AsiaWestern EuropeYemenZaireZimbabweAzores
GED/Equivalency
Income
Poverty
Unemployment
Labor Participation
Family Structure
Vehicle Availability
Education Level
Disability

GED/Equivalency Comparison

Paraguayans

Immigrants from Western Europe

Excellent
Exceptional
86.5%
GED/EQUIVALENCY
84.1/ 100
METRIC RATING
140th/ 347
METRIC RANK
87.3%
GED/EQUIVALENCY
97.3/ 100
METRIC RATING
97th/ 347
METRIC RANK

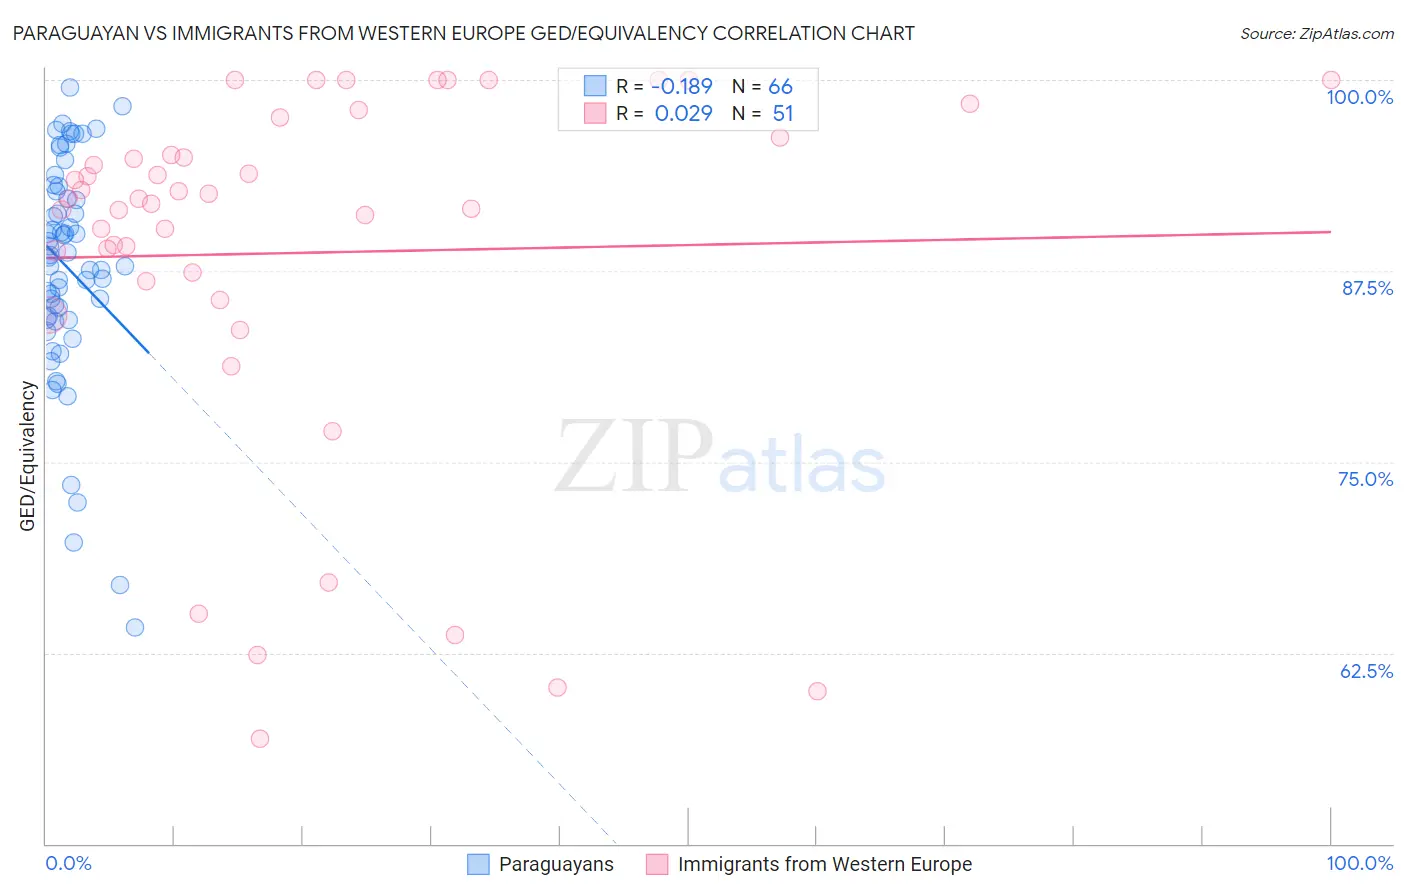
Paraguayan vs Immigrants from Western Europe GED/Equivalency Correlation Chart

The statistical analysis conducted on geographies consisting of 95,114,201 people shows a poor negative correlation between the proportion of Paraguayans and percentage of population with at least ged/equivalency education in the United States with a correlation coefficient (R) of -0.189 and weighted average of 86.5%. Similarly, the statistical analysis conducted on geographies consisting of 494,080,521 people shows no correlation between the proportion of Immigrants from Western Europe and percentage of population with at least ged/equivalency education in the United States with a correlation coefficient (R) of 0.029 and weighted average of 87.3%, a difference of 0.98%.
Paraguayan vs Immigrants from Western Europe GED/Equivalency

GED/Equivalency Correlation Summary

MeasurementParaguayanImmigrants from Western Europe
Minimum64.2%56.9%
Maximum99.5%100.0%
Range35.3%43.1%
Mean87.7%88.7%
Median88.5%92.2%
Interquartile 25% (IQ1)84.4%86.8%
Interquartile 75% (IQ3)92.7%96.2%
Interquartile Range (IQR)8.3%9.4%
Standard Deviation (Sample)7.3%11.9%
Standard Deviation (Population)7.3%11.8%

Similar Demographics by GED/Equivalency

Demographics Similar to Paraguayans by GED/Equivalency

In terms of ged/equivalency, the demographic groups most similar to Paraguayans are Immigrants from Malaysia (86.5%, a difference of 0.030%), Laotian (86.5%, a difference of 0.030%), Immigrants from Indonesia (86.4%, a difference of 0.060%), Immigrants from Pakistan (86.4%, a difference of 0.060%), and Bolivian (86.4%, a difference of 0.070%).
DemographicsRating | RankGED/Equivalency
Tsimshian
88.3
/100
|
#133
Excellent
86.6%
Albanians
87.7
/100
|
#134
Excellent
86.6%
Immigrants | Asia
87.4
/100
|
#135
Excellent
86.6%
Chileans
86.9
/100
|
#136
Excellent
86.6%
Arabs
86.7
/100
|
#137
Excellent
86.6%
Immigrants | Argentina
86.5
/100
|
#138
Excellent
86.6%
Immigrants | Malaysia
85.0
/100
|
#139
Excellent
86.5%
Paraguayans
84.1
/100
|
#140
Excellent
86.5%
Laotians
83.2
/100
|
#141
Excellent
86.5%
Immigrants | Indonesia
82.4
/100
|
#142
Excellent
86.4%
Immigrants | Pakistan
82.4
/100
|
#143
Excellent
86.4%
Bolivians
82.1
/100
|
#144
Excellent
86.4%
Pakistanis
80.4
/100
|
#145
Excellent
86.4%
Basques
79.5
/100
|
#146
Good
86.4%
Immigrants | Northern Africa
79.3
/100
|
#147
Good
86.3%

Demographics Similar to Immigrants from Western Europe by GED/Equivalency

In terms of ged/equivalency, the demographic groups most similar to Immigrants from Western Europe are Czechoslovakian (87.4%, a difference of 0.070%), Immigrants from Croatia (87.3%, a difference of 0.070%), Immigrants from Belarus (87.3%, a difference of 0.070%), Immigrants from Greece (87.4%, a difference of 0.090%), and Palestinian (87.3%, a difference of 0.090%).
DemographicsRating | RankGED/Equivalency
Welsh
97.9
/100
|
#90
Exceptional
87.4%
Immigrants | Eastern Asia
97.9
/100
|
#91
Exceptional
87.4%
Israelis
97.8
/100
|
#92
Exceptional
87.4%
Immigrants | North Macedonia
97.8
/100
|
#93
Exceptional
87.4%
Immigrants | Russia
97.8
/100
|
#94
Exceptional
87.4%
Immigrants | Greece
97.7
/100
|
#95
Exceptional
87.4%
Czechoslovakians
97.6
/100
|
#96
Exceptional
87.4%
Immigrants | Western Europe
97.3
/100
|
#97
Exceptional
87.3%
Immigrants | Croatia
96.9
/100
|
#98
Exceptional
87.3%
Immigrants | Belarus
96.9
/100
|
#99
Exceptional
87.3%
Palestinians
96.8
/100
|
#100
Exceptional
87.3%
Syrians
96.6
/100
|
#101
Exceptional
87.2%
Lebanese
96.2
/100
|
#102
Exceptional
87.2%
Jordanians
96.1
/100
|
#103
Exceptional
87.2%
Immigrants | Hungary
96.0
/100
|
#104
Exceptional
87.2%