Immigrants from Ukraine vs Slavic College, 1 year or more
COMPARE
Immigrants from Ukraine
Slavic
College, 1 year or more
College, 1 year or more Comparison
Immigrants from Ukraine
Slavs
61.9%
COLLEGE, 1 YEAR OR MORE
95.8/ 100
METRIC RATING
107th/ 347
METRIC RANK
60.6%
COLLEGE, 1 YEAR OR MORE
81.1/ 100
METRIC RATING
145th/ 347
METRIC RANK
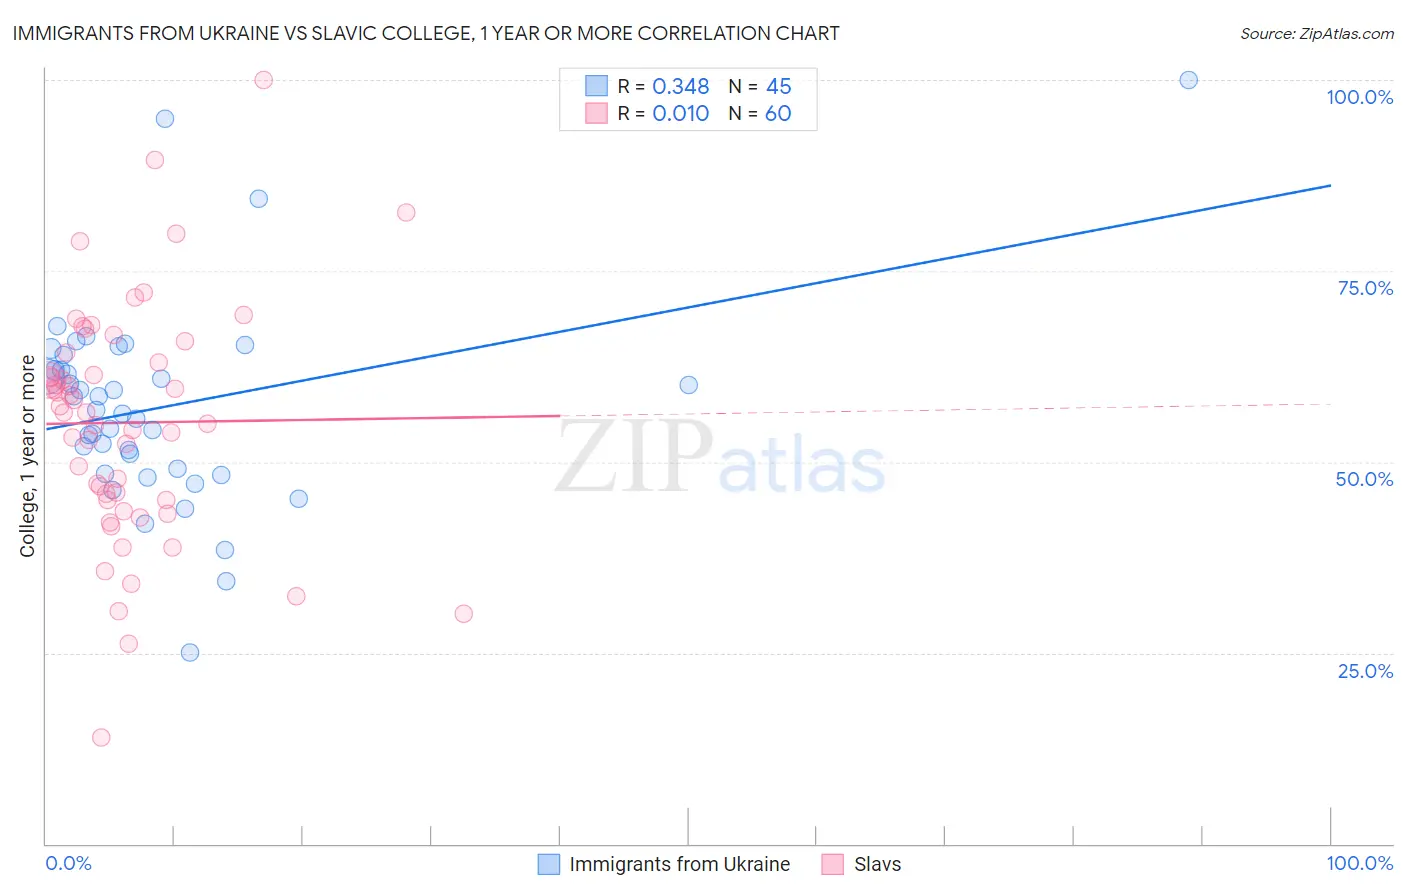
Immigrants from Ukraine vs Slavic College, 1 year or more Correlation Chart
The statistical analysis conducted on geographies consisting of 289,712,941 people shows a mild positive correlation between the proportion of Immigrants from Ukraine and percentage of population with at least college, 1 year or more education in the United States with a correlation coefficient (R) of 0.348 and weighted average of 61.9%. Similarly, the statistical analysis conducted on geographies consisting of 270,867,316 people shows no correlation between the proportion of Slavs and percentage of population with at least college, 1 year or more education in the United States with a correlation coefficient (R) of 0.010 and weighted average of 60.6%, a difference of 2.2%.
College, 1 year or more Correlation Summary
| Measurement | Immigrants from Ukraine | Slavic |
| Minimum | 25.0% | 14.0% |
| Maximum | 100.0% | 100.0% |
| Range | 75.0% | 86.0% |
| Mean | 57.2% | 55.1% |
| Median | 56.8% | 56.5% |
| Interquartile 25% (IQ1) | 48.8% | 45.0% |
| Interquartile 75% (IQ3) | 63.0% | 63.6% |
| Interquartile Range (IQR) | 14.2% | 18.6% |
| Standard Deviation (Sample) | 13.4% | 15.6% |
| Standard Deviation (Population) | 13.2% | 15.4% |
Similar Demographics by College, 1 year or more
Demographics Similar to Immigrants from Ukraine by College, 1 year or more
In terms of college, 1 year or more, the demographic groups most similar to Immigrants from Ukraine are Syrian (61.9%, a difference of 0.020%), Immigrants from Northern Africa (61.9%, a difference of 0.020%), European (61.8%, a difference of 0.040%), Macedonian (61.8%, a difference of 0.040%), and Austrian (61.8%, a difference of 0.10%).
| Demographics | Rating | Rank | College, 1 year or more |
| Icelanders | 96.8 /100 | #100 | Exceptional 62.1% |
| Swedes | 96.8 /100 | #101 | Exceptional 62.1% |
| Luxembourgers | 96.7 /100 | #102 | Exceptional 62.1% |
| Afghans | 96.4 /100 | #103 | Exceptional 62.0% |
| Chileans | 96.4 /100 | #104 | Exceptional 62.0% |
| Immigrants | Nepal | 96.3 /100 | #105 | Exceptional 62.0% |
| Palestinians | 96.3 /100 | #106 | Exceptional 62.0% |
| Immigrants | Ukraine | 95.8 /100 | #107 | Exceptional 61.9% |
| Syrians | 95.7 /100 | #108 | Exceptional 61.9% |
| Immigrants | Northern Africa | 95.7 /100 | #109 | Exceptional 61.9% |
| Europeans | 95.6 /100 | #110 | Exceptional 61.8% |
| Macedonians | 95.6 /100 | #111 | Exceptional 61.8% |
| Austrians | 95.4 /100 | #112 | Exceptional 61.8% |
| Ukrainians | 95.2 /100 | #113 | Exceptional 61.8% |
| Danes | 94.8 /100 | #114 | Exceptional 61.7% |
Demographics Similar to Slavs by College, 1 year or more
In terms of college, 1 year or more, the demographic groups most similar to Slavs are Czech (60.6%, a difference of 0.070%), Scottish (60.5%, a difference of 0.070%), Canadian (60.6%, a difference of 0.14%), Polish (60.7%, a difference of 0.15%), and Immigrants from Kenya (60.5%, a difference of 0.16%).
| Demographics | Rating | Rank | College, 1 year or more |
| Taiwanese | 84.3 /100 | #138 | Excellent 60.7% |
| Immigrants | Eritrea | 84.3 /100 | #139 | Excellent 60.7% |
| Iraqis | 83.3 /100 | #140 | Excellent 60.7% |
| Immigrants | Afghanistan | 83.1 /100 | #141 | Excellent 60.7% |
| Poles | 82.8 /100 | #142 | Excellent 60.7% |
| Canadians | 82.7 /100 | #143 | Excellent 60.6% |
| Czechs | 81.9 /100 | #144 | Excellent 60.6% |
| Slavs | 81.1 /100 | #145 | Excellent 60.6% |
| Scottish | 80.2 /100 | #146 | Excellent 60.5% |
| Immigrants | Kenya | 79.1 /100 | #147 | Good 60.5% |
| Kenyans | 79.0 /100 | #148 | Good 60.5% |
| Brazilians | 79.0 /100 | #149 | Good 60.5% |
| Immigrants | Sudan | 77.8 /100 | #150 | Good 60.4% |
| Albanians | 77.8 /100 | #151 | Good 60.4% |
| Immigrants | Germany | 76.1 /100 | #152 | Good 60.3% |