Immigrants from Ukraine vs Immigrants from Caribbean College, Under 1 year

COMPARE

Immigrants from Ukraine
Race
Ancestry
AfghanAfricanAlaska NativeAlaskan AthabascanAlbanianAleutAlsatianAmericanApacheArabArapahoArgentineanArmenianAssyrian/Chaldean/SyriacAustralianAustrianBahamianBangladeshiBarbadianBasqueBelgianBelizeanBermudanBhutaneseBlackfeetBolivianBrazilianBritishBritish West IndianBulgarianBurmeseCajunCambodianCanadianCape VerdeanCarpatho RusynCelticCentral AmericanCentral American IndianCherokeeCheyenneChickasawChileanChineseChippewaChoctawColombianColvilleComancheCosta RicanCreeCreekCroatianCrowCubanCypriotCzechCzechoslovakianDanishDelawareDominicanDutchDutch West IndianEastern EuropeanEcuadorianEgyptianEnglishEstonianEthiopianEuropeanFijianFilipinoFinnishFrenchFrench American IndianFrench CanadianGermanGerman RussianGhanaianGreekGuamanian/ChamorroGuatemalanGuyaneseHaitianHmongHonduranHopiHoumaHungarianIcelanderIndian (Asian)IndonesianInupiatIranianIraqiIrishIroquoisIsraeliItalianJamaicanJapaneseJordanianKenyanKiowaKoreanLaotianLatvianLebaneseLiberianLithuanianLumbeeLuxembourgerMacedonianMalaysianMalteseMarshalleseMenomineeMexicanMexican American IndianMongolianMoroccanNative HawaiianNavajoNepaleseNew ZealanderNicaraguanNigerianNorthern EuropeanNorwegianOkinawanOsageOttawaPaiutePakistaniPalestinianPanamanianParaguayanPennsylvania GermanPeruvianPimaPolishPortuguesePotawatomiPuebloPuerto RicanPuget Sound SalishRomanianRussianSalvadoranSamoanScandinavianScotch-IrishScottishSeminoleSenegaleseSerbianShoshoneSierra LeoneanSiouxSlavicSlovakSloveneSomaliSouth AfricanSouth AmericanSouth American IndianSoviet UnionSpaniardSpanishSpanish AmericanSpanish American IndianSri LankanSubsaharan AfricanSudaneseSwedishSwissSyrianTaiwaneseThaiTlingit-HaidaTohono O'OdhamTonganTrinidadian and TobagonianTsimshianTurkishU.S. Virgin IslanderUgandanUkrainianUruguayanUteVenezuelanVietnameseWelshWest IndianYakamaYaquiYugoslavianYumanYup'ikZimbabwean
Immigration
NonimmigrantsImmigrantsAfghanistanAfricaAlbaniaArgentinaArmeniaAsiaAustraliaAustriaBahamasBangladeshBarbadosBelarusBelgiumBelizeBoliviaBosnia and HerzegovinaBrazilBulgariaBurma/MyanmarCabo VerdeCambodiaCameroonCanadaCentral AmericaChileChinaColombiaCongoCosta RicaCroatiaCubaCzechoslovakiaDenmarkDominicaDominican RepublicEastern AfricaEastern AsiaEastern EuropeEcuadorEgyptEl SalvadorEnglandEritreaEthiopiaEuropeFijiFranceGermanyGhanaGreeceGrenadaGuatemalaGuyanaHaitiHondurasHong KongHungaryIndiaIndonesiaIranIraqIrelandIsraelItalyJamaicaJapanJordanKazakhstanKenyaKoreaKuwaitLaosLatin AmericaLatviaLebanonLiberiaLithuaniaMalaysiaMexicoMicronesiaMiddle AfricaMoldovaMoroccoNepalNetherlandsNicaraguaNigeriaNorth AmericaNorth MacedoniaNorthern AfricaNorthern EuropeNorwayOceaniaPakistanPanamaPeruPhilippinesPolandPortugalRomaniaRussiaSaudi ArabiaScotlandSenegalSerbiaSierra LeoneSingaporeSomaliaSouth AfricaSouth AmericaSouth Central AsiaSouth Eastern AsiaSouthern EuropeSpainSri LankaSt. Vincent and the GrenadinesSudanSwedenSwitzerlandSyriaTaiwanThailandTrinidad and TobagoTurkeyUgandaUkraineUruguayUzbekistanVenezuelaVietnamWest IndiesWestern AfricaWestern AsiaWestern EuropeYemenZaireZimbabweAzores
Immigrants from Caribbean
Race
Ancestry
AfghanAfricanAlaska NativeAlaskan AthabascanAlbanianAleutAlsatianAmericanApacheArabArapahoArgentineanArmenianAssyrian/Chaldean/SyriacAustralianAustrianBahamianBangladeshiBarbadianBasqueBelgianBelizeanBermudanBhutaneseBlackfeetBolivianBrazilianBritishBritish West IndianBulgarianBurmeseCajunCambodianCanadianCape VerdeanCarpatho RusynCelticCentral AmericanCentral American IndianCherokeeCheyenneChickasawChileanChineseChippewaChoctawColombianColvilleComancheCosta RicanCreeCreekCroatianCrowCubanCypriotCzechCzechoslovakianDanishDelawareDominicanDutchDutch West IndianEastern EuropeanEcuadorianEgyptianEnglishEstonianEthiopianEuropeanFijianFilipinoFinnishFrenchFrench American IndianFrench CanadianGermanGerman RussianGhanaianGreekGuamanian/ChamorroGuatemalanGuyaneseHaitianHmongHonduranHopiHoumaHungarianIcelanderIndian (Asian)IndonesianInupiatIranianIraqiIrishIroquoisIsraeliItalianJamaicanJapaneseJordanianKenyanKiowaKoreanLaotianLatvianLebaneseLiberianLithuanianLumbeeLuxembourgerMacedonianMalaysianMalteseMarshalleseMenomineeMexicanMexican American IndianMongolianMoroccanNative HawaiianNavajoNepaleseNew ZealanderNicaraguanNigerianNorthern EuropeanNorwegianOkinawanOsageOttawaPaiutePakistaniPalestinianPanamanianParaguayanPennsylvania GermanPeruvianPimaPolishPortuguesePotawatomiPuebloPuerto RicanPuget Sound SalishRomanianRussianSalvadoranSamoanScandinavianScotch-IrishScottishSeminoleSenegaleseSerbianShoshoneSierra LeoneanSiouxSlavicSlovakSloveneSomaliSouth AfricanSouth AmericanSouth American IndianSoviet UnionSpaniardSpanishSpanish AmericanSpanish American IndianSri LankanSubsaharan AfricanSudaneseSwedishSwissSyrianTaiwaneseThaiTlingit-HaidaTohono O'OdhamTonganTrinidadian and TobagonianTsimshianTurkishU.S. Virgin IslanderUgandanUkrainianUruguayanUteVenezuelanVietnameseWelshWest IndianYakamaYaquiYugoslavianYumanYup'ikZimbabwean
Immigration
NonimmigrantsImmigrantsAfghanistanAfricaAlbaniaArgentinaArmeniaAsiaAustraliaAustriaBahamasBangladeshBarbadosBelarusBelgiumBelizeBoliviaBosnia and HerzegovinaBrazilBulgariaBurma/MyanmarCabo VerdeCambodiaCameroonCanadaCaribbeanCentral AmericaChileChinaColombiaCongoCosta RicaCroatiaCubaCzechoslovakiaDenmarkDominicaDominican RepublicEastern AfricaEastern AsiaEastern EuropeEcuadorEgyptEl SalvadorEnglandEritreaEthiopiaEuropeFijiFranceGermanyGhanaGreeceGrenadaGuatemalaGuyanaHaitiHondurasHong KongHungaryIndiaIndonesiaIranIraqIrelandIsraelItalyJamaicaJapanJordanKazakhstanKenyaKoreaKuwaitLaosLatin AmericaLatviaLebanonLiberiaLithuaniaMalaysiaMexicoMicronesiaMiddle AfricaMoldovaMoroccoNepalNetherlandsNicaraguaNigeriaNorth AmericaNorth MacedoniaNorthern AfricaNorthern EuropeNorwayOceaniaPakistanPanamaPeruPhilippinesPolandPortugalRomaniaRussiaSaudi ArabiaScotlandSenegalSerbiaSierra LeoneSingaporeSomaliaSouth AfricaSouth AmericaSouth Central AsiaSouth Eastern AsiaSouthern EuropeSpainSri LankaSt. Vincent and the GrenadinesSudanSwedenSwitzerlandSyriaTaiwanThailandTrinidad and TobagoTurkeyUgandaUruguayUzbekistanVenezuelaVietnamWest IndiesWestern AfricaWestern AsiaWestern EuropeYemenZaireZimbabweAzores
College, Under 1 year
Income
Poverty
Unemployment
Labor Participation
Family Structure
Vehicle Availability
Education Level
Disability

College, Under 1 year Comparison

Immigrants from Ukraine

Immigrants from Caribbean

Exceptional
Tragic
67.5%
COLLEGE, UNDER 1 YEAR
94.7/ 100
METRIC RATING
118th/ 347
METRIC RANK
56.6%
COLLEGE, UNDER 1 YEAR
0.0/ 100
METRIC RATING
322nd/ 347
METRIC RANK

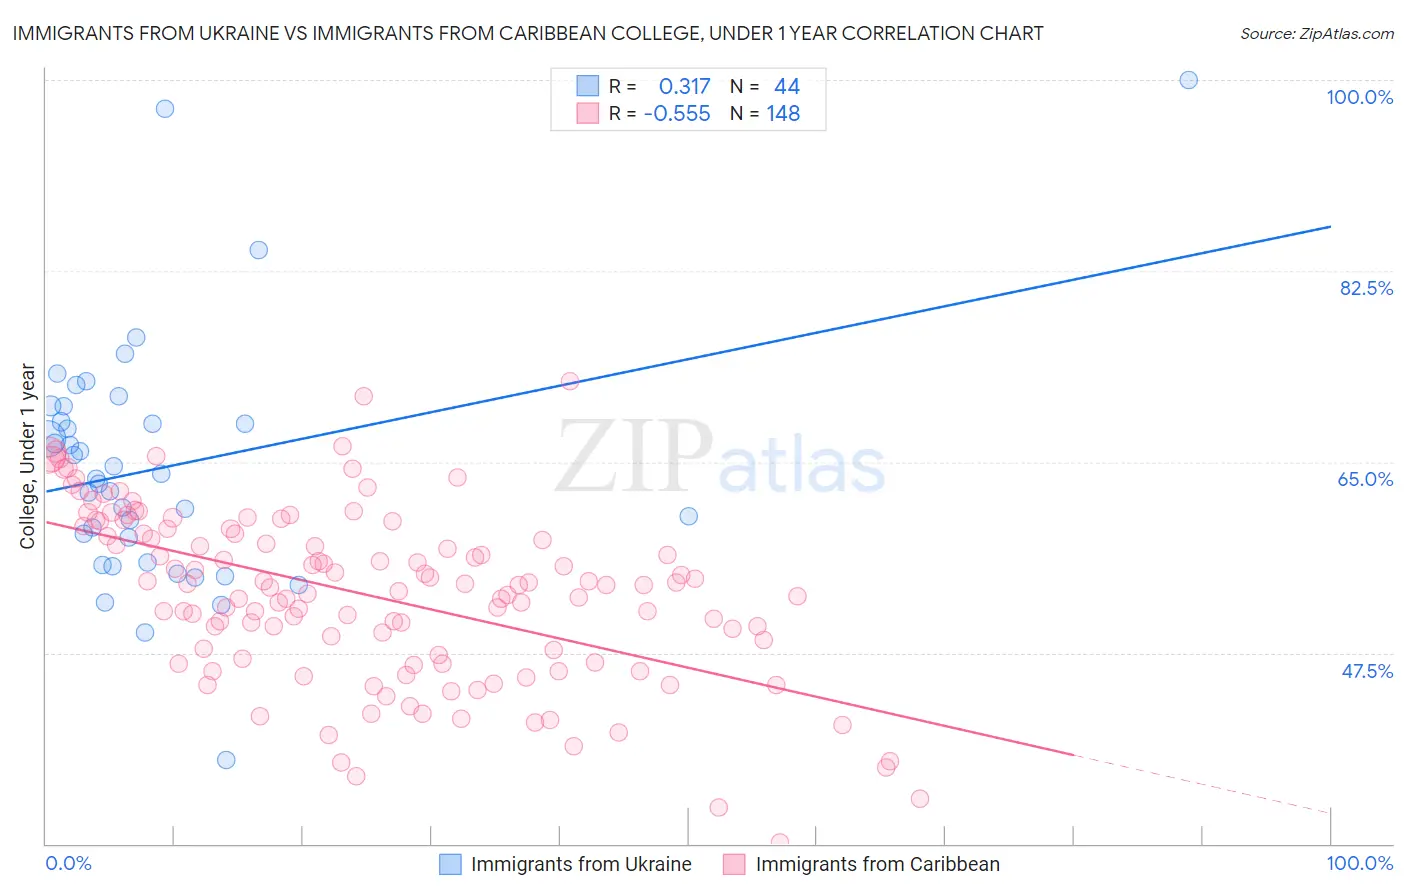
Immigrants from Ukraine vs Immigrants from Caribbean College, Under 1 year Correlation Chart

The statistical analysis conducted on geographies consisting of 289,712,789 people shows a mild positive correlation between the proportion of Immigrants from Ukraine and percentage of population with at least college, under 1 year education in the United States with a correlation coefficient (R) of 0.317 and weighted average of 67.5%. Similarly, the statistical analysis conducted on geographies consisting of 450,062,086 people shows a substantial negative correlation between the proportion of Immigrants from Caribbean and percentage of population with at least college, under 1 year education in the United States with a correlation coefficient (R) of -0.555 and weighted average of 56.6%, a difference of 19.3%.
Immigrants from Ukraine vs Immigrants from Caribbean College, Under 1 year

College, Under 1 year Correlation Summary

MeasurementImmigrants from UkraineImmigrants from Caribbean
Minimum37.7%30.2%
Maximum100.0%72.4%
Range62.3%42.2%
Mean64.5%52.8%
Median63.6%53.7%
Interquartile 25% (IQ1)56.9%47.1%
Interquartile 75% (IQ3)69.4%58.6%
Interquartile Range (IQR)12.5%11.5%
Standard Deviation (Sample)11.3%7.9%
Standard Deviation (Population)11.2%7.9%

Similar Demographics by College, Under 1 year

Demographics Similar to Immigrants from Ukraine by College, Under 1 year

In terms of college, under 1 year, the demographic groups most similar to Immigrants from Ukraine are Lebanese (67.5%, a difference of 0.010%), Pakistani (67.5%, a difference of 0.030%), Immigrants from Nepal (67.5%, a difference of 0.040%), Basque (67.6%, a difference of 0.13%), and Chilean (67.6%, a difference of 0.14%).
DemographicsRating | RankCollege, Under 1 year
Ukrainians
95.8
/100
|
#111
Exceptional
67.7%
Macedonians
95.7
/100
|
#112
Exceptional
67.6%
Syrians
95.6
/100
|
#113
Exceptional
67.6%
Chileans
95.3
/100
|
#114
Exceptional
67.6%
Basques
95.2
/100
|
#115
Exceptional
67.6%
Immigrants | Nepal
94.9
/100
|
#116
Exceptional
67.5%
Pakistanis
94.8
/100
|
#117
Exceptional
67.5%
Immigrants | Ukraine
94.7
/100
|
#118
Exceptional
67.5%
Lebanese
94.6
/100
|
#119
Exceptional
67.5%
Serbians
93.9
/100
|
#120
Exceptional
67.4%
Slovenes
93.3
/100
|
#121
Exceptional
67.3%
Immigrants | Jordan
92.8
/100
|
#122
Exceptional
67.3%
Immigrants | Northern Africa
92.7
/100
|
#123
Exceptional
67.2%
Arabs
92.6
/100
|
#124
Exceptional
67.2%
Italians
91.8
/100
|
#125
Exceptional
67.2%

Demographics Similar to Immigrants from Caribbean by College, Under 1 year

In terms of college, under 1 year, the demographic groups most similar to Immigrants from Caribbean are Native/Alaskan (56.6%, a difference of 0.13%), Immigrants from Honduras (56.5%, a difference of 0.18%), Immigrants from El Salvador (56.4%, a difference of 0.31%), Guatemalan (56.8%, a difference of 0.39%), and Immigrants from Latin America (56.3%, a difference of 0.41%).
DemographicsRating | RankCollege, Under 1 year
Hondurans
0.0
/100
|
#315
Tragic
57.1%
Menominee
0.0
/100
|
#316
Tragic
57.0%
Hispanics or Latinos
0.0
/100
|
#317
Tragic
57.0%
Immigrants | Haiti
0.0
/100
|
#318
Tragic
56.9%
Puerto Ricans
0.0
/100
|
#319
Tragic
56.8%
Guatemalans
0.0
/100
|
#320
Tragic
56.8%
Natives/Alaskans
0.0
/100
|
#321
Tragic
56.6%
Immigrants | Caribbean
0.0
/100
|
#322
Tragic
56.6%
Immigrants | Honduras
0.0
/100
|
#323
Tragic
56.5%
Immigrants | El Salvador
0.0
/100
|
#324
Tragic
56.4%
Immigrants | Latin America
0.0
/100
|
#325
Tragic
56.3%
Navajo
0.0
/100
|
#326
Tragic
56.3%
Immigrants | Guatemala
0.0
/100
|
#327
Tragic
56.2%
Cape Verdeans
0.0
/100
|
#328
Tragic
56.0%
Immigrants | Cuba
0.0
/100
|
#329
Tragic
55.7%