Immigrants from Spain vs Kenyan College, Under 1 year

COMPARE

Immigrants from Spain
Race
Ancestry
AfghanAfricanAlaska NativeAlaskan AthabascanAlbanianAleutAlsatianAmericanApacheArabArapahoArgentineanArmenianAssyrian/Chaldean/SyriacAustralianAustrianBahamianBangladeshiBarbadianBasqueBelgianBelizeanBermudanBhutaneseBlackfeetBolivianBrazilianBritishBritish West IndianBulgarianBurmeseCajunCambodianCanadianCape VerdeanCarpatho RusynCelticCentral AmericanCentral American IndianCherokeeCheyenneChickasawChileanChineseChippewaChoctawColombianColvilleComancheCosta RicanCreeCreekCroatianCrowCubanCypriotCzechCzechoslovakianDanishDelawareDominicanDutchDutch West IndianEastern EuropeanEcuadorianEgyptianEnglishEstonianEthiopianEuropeanFijianFilipinoFinnishFrenchFrench American IndianFrench CanadianGermanGerman RussianGhanaianGreekGuamanian/ChamorroGuatemalanGuyaneseHaitianHmongHonduranHopiHoumaHungarianIcelanderIndian (Asian)IndonesianInupiatIranianIraqiIrishIroquoisIsraeliItalianJamaicanJapaneseJordanianKiowaKoreanLaotianLatvianLebaneseLiberianLithuanianLumbeeLuxembourgerMacedonianMalaysianMalteseMarshalleseMenomineeMexicanMexican American IndianMongolianMoroccanNative HawaiianNavajoNepaleseNew ZealanderNicaraguanNigerianNorthern EuropeanNorwegianOkinawanOsageOttawaPaiutePakistaniPalestinianPanamanianParaguayanPennsylvania GermanPeruvianPimaPolishPortuguesePotawatomiPuebloPuerto RicanPuget Sound SalishRomanianRussianSalvadoranSamoanScandinavianScotch-IrishScottishSeminoleSenegaleseSerbianShoshoneSierra LeoneanSiouxSlavicSlovakSloveneSomaliSouth AfricanSouth AmericanSouth American IndianSoviet UnionSpaniardSpanishSpanish AmericanSpanish American IndianSri LankanSubsaharan AfricanSudaneseSwedishSwissSyrianTaiwaneseThaiTlingit-HaidaTohono O'OdhamTonganTrinidadian and TobagonianTsimshianTurkishU.S. Virgin IslanderUgandanUkrainianUruguayanUteVenezuelanVietnameseWelshWest IndianYakamaYaquiYugoslavianYumanYup'ikZimbabwean
Immigration
NonimmigrantsImmigrantsAfghanistanAfricaAlbaniaArgentinaArmeniaAsiaAustraliaAustriaBahamasBangladeshBarbadosBelarusBelgiumBelizeBoliviaBosnia and HerzegovinaBrazilBulgariaBurma/MyanmarCabo VerdeCambodiaCameroonCanadaCaribbeanCentral AmericaChileChinaColombiaCongoCosta RicaCroatiaCubaCzechoslovakiaDenmarkDominicaDominican RepublicEastern AfricaEastern AsiaEastern EuropeEcuadorEgyptEl SalvadorEnglandEritreaEthiopiaEuropeFijiFranceGermanyGhanaGreeceGrenadaGuatemalaGuyanaHaitiHondurasHong KongHungaryIndiaIndonesiaIranIraqIrelandIsraelItalyJamaicaJapanJordanKazakhstanKenyaKoreaKuwaitLaosLatin AmericaLatviaLebanonLiberiaLithuaniaMalaysiaMexicoMicronesiaMiddle AfricaMoldovaMoroccoNepalNetherlandsNicaraguaNigeriaNorth AmericaNorth MacedoniaNorthern AfricaNorthern EuropeNorwayOceaniaPakistanPanamaPeruPhilippinesPolandPortugalRomaniaRussiaSaudi ArabiaScotlandSenegalSerbiaSierra LeoneSingaporeSomaliaSouth AfricaSouth AmericaSouth Central AsiaSouth Eastern AsiaSouthern EuropeSpainSri LankaSt. Vincent and the GrenadinesSudanSwedenSwitzerlandSyriaTaiwanThailandTrinidad and TobagoTurkeyUgandaUkraineUruguayUzbekistanVenezuelaVietnamWest IndiesWestern AfricaWestern AsiaWestern EuropeYemenZaireZimbabweAzores
Kenyan
Race
Ancestry
AfghanAfricanAlaska NativeAlaskan AthabascanAlbanianAleutAlsatianAmericanApacheArabArapahoArgentineanArmenianAssyrian/Chaldean/SyriacAustralianAustrianBahamianBangladeshiBarbadianBasqueBelgianBelizeanBermudanBhutaneseBlackfeetBolivianBrazilianBritishBritish West IndianBulgarianBurmeseCajunCambodianCanadianCape VerdeanCarpatho RusynCelticCentral AmericanCentral American IndianCherokeeCheyenneChickasawChileanChineseChippewaChoctawColombianColvilleComancheCosta RicanCreeCreekCroatianCrowCubanCypriotCzechCzechoslovakianDanishDelawareDominicanDutchDutch West IndianEastern EuropeanEcuadorianEgyptianEnglishEstonianEthiopianEuropeanFijianFilipinoFinnishFrenchFrench American IndianFrench CanadianGermanGerman RussianGhanaianGreekGuamanian/ChamorroGuatemalanGuyaneseHaitianHmongHonduranHopiHoumaHungarianIcelanderIndian (Asian)IndonesianInupiatIranianIraqiIrishIroquoisIsraeliItalianJamaicanJapaneseJordanianKenyanKiowaKoreanLaotianLatvianLebaneseLiberianLithuanianLumbeeLuxembourgerMacedonianMalaysianMalteseMarshalleseMenomineeMexicanMexican American IndianMongolianMoroccanNative HawaiianNavajoNepaleseNew ZealanderNicaraguanNigerianNorthern EuropeanNorwegianOkinawanOsageOttawaPaiutePakistaniPalestinianPanamanianParaguayanPennsylvania GermanPeruvianPimaPolishPortuguesePotawatomiPuebloPuerto RicanPuget Sound SalishRomanianRussianSalvadoranSamoanScandinavianScotch-IrishScottishSeminoleSenegaleseSerbianShoshoneSierra LeoneanSiouxSlavicSlovakSloveneSomaliSouth AfricanSouth AmericanSouth American IndianSoviet UnionSpaniardSpanishSpanish AmericanSpanish American IndianSri LankanSubsaharan AfricanSudaneseSwedishSwissSyrianTaiwaneseThaiTlingit-HaidaTohono O'OdhamTonganTrinidadian and TobagonianTsimshianTurkishU.S. Virgin IslanderUgandanUkrainianUruguayanUteVenezuelanVietnameseWelshWest IndianYakamaYaquiYugoslavianYumanYup'ikZimbabwean
Immigration
NonimmigrantsImmigrantsAfghanistanAfricaAlbaniaArgentinaArmeniaAsiaAustraliaAustriaBahamasBangladeshBarbadosBelarusBelgiumBelizeBoliviaBosnia and HerzegovinaBrazilBulgariaBurma/MyanmarCabo VerdeCambodiaCameroonCanadaCaribbeanCentral AmericaChileChinaColombiaCongoCosta RicaCroatiaCubaCzechoslovakiaDenmarkDominicaDominican RepublicEastern AfricaEastern AsiaEastern EuropeEcuadorEgyptEl SalvadorEnglandEritreaEthiopiaEuropeFijiFranceGermanyGhanaGreeceGrenadaGuatemalaGuyanaHaitiHondurasHong KongHungaryIndiaIndonesiaIranIraqIrelandIsraelItalyJamaicaJapanJordanKazakhstanKenyaKoreaKuwaitLaosLatin AmericaLatviaLebanonLiberiaLithuaniaMalaysiaMexicoMicronesiaMiddle AfricaMoldovaMoroccoNepalNetherlandsNicaraguaNigeriaNorth AmericaNorth MacedoniaNorthern AfricaNorthern EuropeNorwayOceaniaPakistanPanamaPeruPhilippinesPolandPortugalRomaniaRussiaSaudi ArabiaScotlandSenegalSerbiaSierra LeoneSingaporeSomaliaSouth AfricaSouth AmericaSouth Central AsiaSouth Eastern AsiaSouthern EuropeSri LankaSt. Vincent and the GrenadinesSudanSwedenSwitzerlandSyriaTaiwanThailandTrinidad and TobagoTurkeyUgandaUkraineUruguayUzbekistanVenezuelaVietnamWest IndiesWestern AfricaWestern AsiaWestern EuropeYemenZaireZimbabweAzores
College, Under 1 year
Income
Poverty
Unemployment
Labor Participation
Family Structure
Vehicle Availability
Education Level
Disability

College, Under 1 year Comparison

Immigrants from Spain

Kenyans

Exceptional
Excellent
68.4%
COLLEGE, UNDER 1 YEAR
98.5/ 100
METRIC RATING
80th/ 347
METRIC RANK
66.5%
COLLEGE, UNDER 1 YEAR
81.7/ 100
METRIC RATING
146th/ 347
METRIC RANK

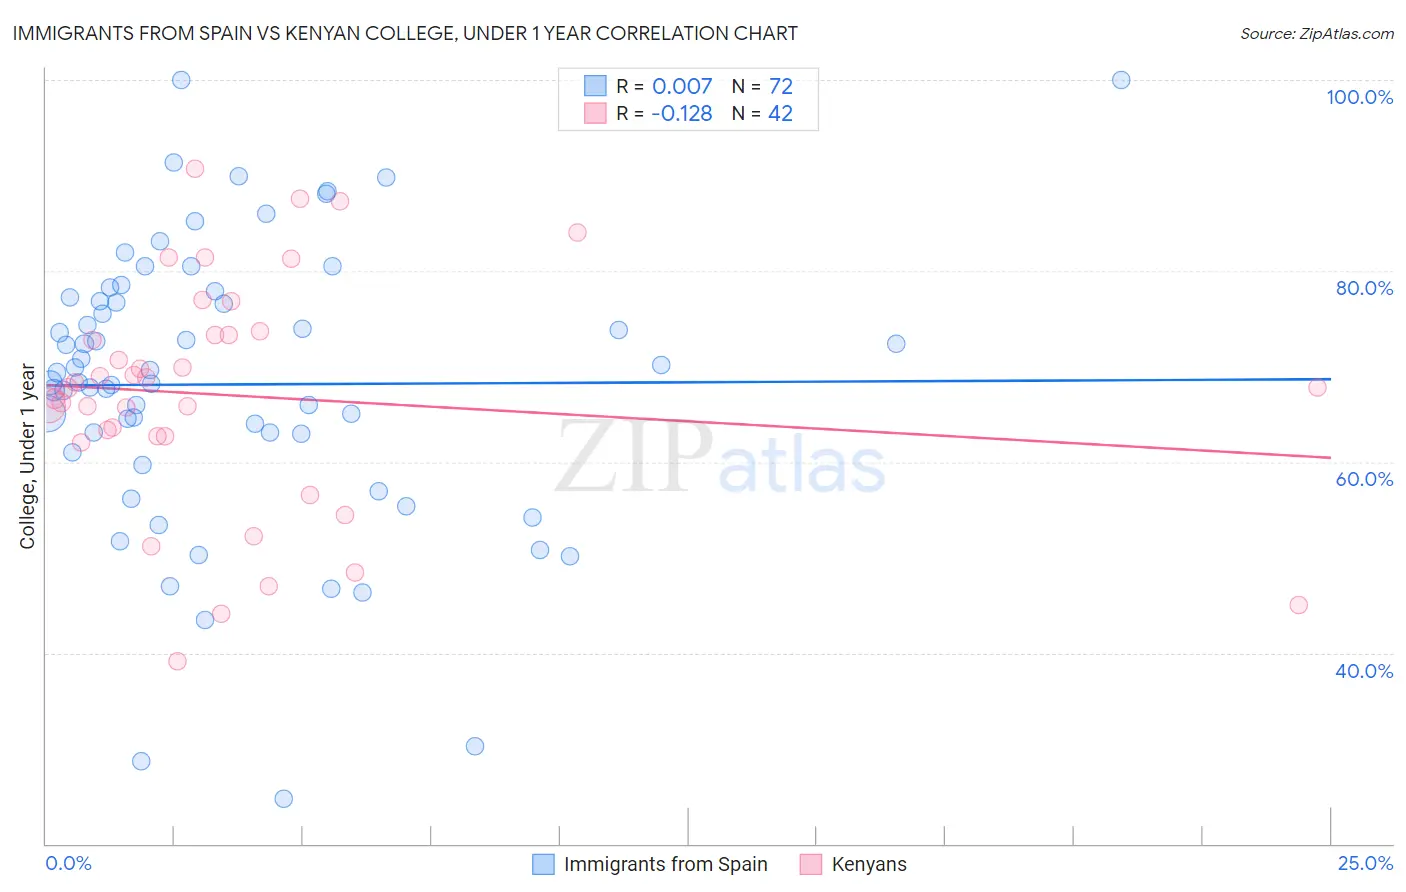
Immigrants from Spain vs Kenyan College, Under 1 year Correlation Chart

The statistical analysis conducted on geographies consisting of 239,683,397 people shows no correlation between the proportion of Immigrants from Spain and percentage of population with at least college, under 1 year education in the United States with a correlation coefficient (R) of 0.007 and weighted average of 68.4%. Similarly, the statistical analysis conducted on geographies consisting of 168,244,481 people shows a poor negative correlation between the proportion of Kenyans and percentage of population with at least college, under 1 year education in the United States with a correlation coefficient (R) of -0.128 and weighted average of 66.5%, a difference of 2.9%.
Immigrants from Spain vs Kenyan College, Under 1 year

College, Under 1 year Correlation Summary

MeasurementImmigrants from SpainKenyan
Minimum24.8%39.1%
Maximum100.0%90.7%
Range75.2%51.6%
Mean68.1%66.9%
Median68.9%67.8%
Interquartile 25% (IQ1)62.0%62.7%
Interquartile 75% (IQ3)77.0%73.3%
Interquartile Range (IQR)15.0%10.6%
Standard Deviation (Sample)15.0%12.2%
Standard Deviation (Population)14.9%12.0%

Similar Demographics by College, Under 1 year

Demographics Similar to Immigrants from Spain by College, Under 1 year

In terms of college, under 1 year, the demographic groups most similar to Immigrants from Spain are Greek (68.5%, a difference of 0.030%), Danish (68.5%, a difference of 0.040%), Immigrants from Greece (68.4%, a difference of 0.040%), British (68.5%, a difference of 0.050%), and Immigrants from Western Europe (68.5%, a difference of 0.090%).
DemographicsRating | RankCollege, Under 1 year
Immigrants | England
99.0
/100
|
#73
Exceptional
68.7%
Swedes
98.9
/100
|
#74
Exceptional
68.7%
Immigrants | Western Europe
98.6
/100
|
#75
Exceptional
68.5%
Laotians
98.6
/100
|
#76
Exceptional
68.5%
British
98.6
/100
|
#77
Exceptional
68.5%
Danes
98.6
/100
|
#78
Exceptional
68.5%
Greeks
98.6
/100
|
#79
Exceptional
68.5%
Immigrants | Spain
98.5
/100
|
#80
Exceptional
68.4%
Immigrants | Greece
98.5
/100
|
#81
Exceptional
68.4%
Norwegians
98.4
/100
|
#82
Exceptional
68.4%
Argentineans
98.4
/100
|
#83
Exceptional
68.4%
Immigrants | Hungary
98.3
/100
|
#84
Exceptional
68.3%
Egyptians
98.3
/100
|
#85
Exceptional
68.3%
Immigrants | Lebanon
98.3
/100
|
#86
Exceptional
68.3%
Chinese
98.3
/100
|
#87
Exceptional
68.3%

Demographics Similar to Kenyans by College, Under 1 year

In terms of college, under 1 year, the demographic groups most similar to Kenyans are Immigrants from Kenya (66.5%, a difference of 0.0%), Immigrants from Morocco (66.5%, a difference of 0.0%), Immigrants from Germany (66.5%, a difference of 0.020%), Immigrants from Uganda (66.5%, a difference of 0.080%), and English (66.6%, a difference of 0.090%).
DemographicsRating | RankCollege, Under 1 year
Venezuelans
85.9
/100
|
#139
Excellent
66.7%
Slavs
85.9
/100
|
#140
Excellent
66.7%
Immigrants | Afghanistan
85.1
/100
|
#141
Excellent
66.7%
English
82.9
/100
|
#142
Excellent
66.6%
Immigrants | Uganda
82.8
/100
|
#143
Excellent
66.5%
Immigrants | Germany
82.0
/100
|
#144
Excellent
66.5%
Immigrants | Kenya
81.8
/100
|
#145
Excellent
66.5%
Kenyans
81.7
/100
|
#146
Excellent
66.5%
Immigrants | Morocco
81.7
/100
|
#147
Excellent
66.5%
Taiwanese
78.6
/100
|
#148
Good
66.4%
Immigrants | Venezuela
77.9
/100
|
#149
Good
66.3%
Immigrants | Iraq
77.1
/100
|
#150
Good
66.3%
Immigrants | Sudan
76.0
/100
|
#151
Good
66.2%
Sudanese
74.1
/100
|
#152
Good
66.2%
Belgians
73.7
/100
|
#153
Good
66.2%