Immigrants from Kenya vs Immigrants from Eastern Africa College, Under 1 year
COMPARE
Immigrants from Kenya
Immigrants from Eastern Africa
College, Under 1 year
College, Under 1 year Comparison
Immigrants from Kenya
Immigrants from Eastern Africa
66.5%
COLLEGE, UNDER 1 YEAR
81.8/ 100
METRIC RATING
145th/ 347
METRIC RANK
67.0%
COLLEGE, UNDER 1 YEAR
89.5/ 100
METRIC RATING
129th/ 347
METRIC RANK
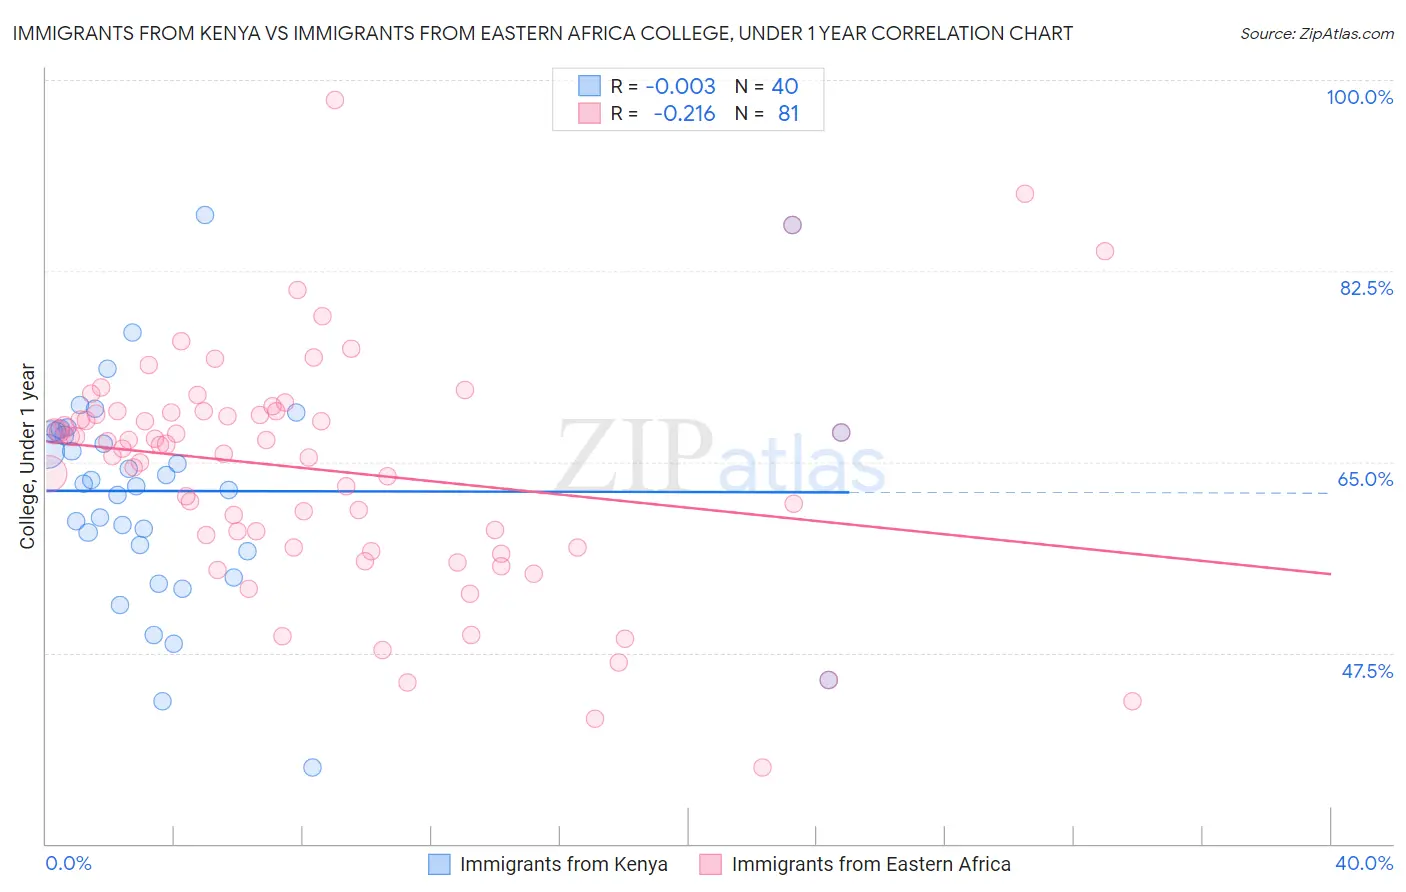
Immigrants from Kenya vs Immigrants from Eastern Africa College, Under 1 year Correlation Chart
The statistical analysis conducted on geographies consisting of 218,085,582 people shows no correlation between the proportion of Immigrants from Kenya and percentage of population with at least college, under 1 year education in the United States with a correlation coefficient (R) of -0.003 and weighted average of 66.5%. Similarly, the statistical analysis conducted on geographies consisting of 355,150,980 people shows a weak negative correlation between the proportion of Immigrants from Eastern Africa and percentage of population with at least college, under 1 year education in the United States with a correlation coefficient (R) of -0.216 and weighted average of 67.0%, a difference of 0.70%.
College, Under 1 year Correlation Summary
| Measurement | Immigrants from Kenya | Immigrants from Eastern Africa |
| Minimum | 37.0% | 37.0% |
| Maximum | 87.6% | 98.2% |
| Range | 50.6% | 61.2% |
| Mean | 62.3% | 64.2% |
| Median | 63.2% | 66.5% |
| Interquartile 25% (IQ1) | 57.1% | 57.2% |
| Interquartile 75% (IQ3) | 67.8% | 69.5% |
| Interquartile Range (IQR) | 10.7% | 12.4% |
| Standard Deviation (Sample) | 10.3% | 10.7% |
| Standard Deviation (Population) | 10.1% | 10.7% |
Demographics Similar to Immigrants from Kenya and Immigrants from Eastern Africa by College, Under 1 year
In terms of college, under 1 year, the demographic groups most similar to Immigrants from Kenya are Kenyan (66.5%, a difference of 0.0%), Immigrants from Germany (66.5%, a difference of 0.010%), Immigrants from Morocco (66.5%, a difference of 0.010%), Immigrants from Uganda (66.5%, a difference of 0.070%), and English (66.6%, a difference of 0.090%). Similarly, the demographic groups most similar to Immigrants from Eastern Africa are Immigrants from Syria (66.9%, a difference of 0.060%), Scottish (67.0%, a difference of 0.080%), Finnish (66.9%, a difference of 0.10%), Polish (66.9%, a difference of 0.12%), and Immigrants from Brazil (66.9%, a difference of 0.14%).
| Demographics | Rating | Rank | College, Under 1 year |
| Czechs | 90.8 /100 | #127 | Exceptional 67.1% |
| Scottish | 90.2 /100 | #128 | Exceptional 67.0% |
| Immigrants | Eastern Africa | 89.5 /100 | #129 | Excellent 67.0% |
| Immigrants | Syria | 89.0 /100 | #130 | Excellent 66.9% |
| Finns | 88.6 /100 | #131 | Excellent 66.9% |
| Poles | 88.4 /100 | #132 | Excellent 66.9% |
| Immigrants | Brazil | 88.3 /100 | #133 | Excellent 66.9% |
| Iraqis | 88.0 /100 | #134 | Excellent 66.8% |
| Canadians | 87.9 /100 | #135 | Excellent 66.8% |
| Ugandans | 87.8 /100 | #136 | Excellent 66.8% |
| Immigrants | Chile | 87.4 /100 | #137 | Excellent 66.8% |
| Immigrants | Italy | 86.9 /100 | #138 | Excellent 66.8% |
| Venezuelans | 85.9 /100 | #139 | Excellent 66.7% |
| Slavs | 85.9 /100 | #140 | Excellent 66.7% |
| Immigrants | Afghanistan | 85.1 /100 | #141 | Excellent 66.7% |
| English | 82.9 /100 | #142 | Excellent 66.6% |
| Immigrants | Uganda | 82.8 /100 | #143 | Excellent 66.5% |
| Immigrants | Germany | 82.0 /100 | #144 | Excellent 66.5% |
| Immigrants | Kenya | 81.8 /100 | #145 | Excellent 66.5% |
| Kenyans | 81.7 /100 | #146 | Excellent 66.5% |
| Immigrants | Morocco | 81.7 /100 | #147 | Excellent 66.5% |