Immigrants from Germany vs Nonimmigrants College, 1 year or more

COMPARE

Immigrants from Germany
Race
Ancestry
AfghanAfricanAlaska NativeAlaskan AthabascanAlbanianAleutAlsatianAmericanApacheArabArapahoArgentineanArmenianAssyrian/Chaldean/SyriacAustralianAustrianBahamianBangladeshiBarbadianBasqueBelgianBelizeanBermudanBhutaneseBlackfeetBolivianBrazilianBritishBritish West IndianBulgarianBurmeseCajunCambodianCanadianCape VerdeanCarpatho RusynCelticCentral AmericanCentral American IndianCherokeeCheyenneChickasawChileanChineseChippewaChoctawColombianColvilleComancheCosta RicanCreeCreekCroatianCrowCubanCypriotCzechCzechoslovakianDanishDelawareDominicanDutchDutch West IndianEastern EuropeanEcuadorianEgyptianEnglishEstonianEthiopianEuropeanFijianFilipinoFinnishFrenchFrench American IndianFrench CanadianGermanGerman RussianGhanaianGreekGuamanian/ChamorroGuatemalanGuyaneseHaitianHmongHonduranHopiHoumaHungarianIcelanderIndian (Asian)IndonesianInupiatIranianIraqiIrishIroquoisIsraeliItalianJamaicanJapaneseJordanianKenyanKiowaKoreanLaotianLatvianLebaneseLiberianLithuanianLumbeeLuxembourgerMacedonianMalaysianMalteseMarshalleseMenomineeMexicanMexican American IndianMongolianMoroccanNative HawaiianNavajoNepaleseNew ZealanderNicaraguanNigerianNorthern EuropeanNorwegianOkinawanOsageOttawaPaiutePakistaniPalestinianPanamanianParaguayanPennsylvania GermanPeruvianPimaPolishPortuguesePotawatomiPuebloPuerto RicanPuget Sound SalishRomanianRussianSalvadoranSamoanScandinavianScotch-IrishScottishSeminoleSenegaleseSerbianShoshoneSierra LeoneanSiouxSlavicSlovakSloveneSomaliSouth AfricanSouth AmericanSouth American IndianSoviet UnionSpaniardSpanishSpanish AmericanSpanish American IndianSri LankanSubsaharan AfricanSudaneseSwedishSwissSyrianTaiwaneseThaiTlingit-HaidaTohono O'OdhamTonganTrinidadian and TobagonianTsimshianTurkishU.S. Virgin IslanderUgandanUkrainianUruguayanUteVenezuelanVietnameseWelshWest IndianYakamaYaquiYugoslavianYumanYup'ikZimbabwean
Immigration
ImmigrantsAfghanistanAfricaAlbaniaArgentinaArmeniaAsiaAustraliaAustriaBahamasBangladeshBarbadosBelarusBelgiumBelizeBoliviaBosnia and HerzegovinaBrazilBulgariaBurma/MyanmarCabo VerdeCambodiaCameroonCanadaCaribbeanCentral AmericaChileChinaColombiaCongoCosta RicaCroatiaCubaCzechoslovakiaDenmarkDominicaDominican RepublicEastern AfricaEastern AsiaEastern EuropeEcuadorEgyptEl SalvadorEnglandEritreaEthiopiaEuropeFijiFranceGermanyGhanaGreeceGrenadaGuatemalaGuyanaHaitiHondurasHong KongHungaryIndiaIndonesiaIranIraqIrelandIsraelItalyJamaicaJapanJordanKazakhstanKenyaKoreaKuwaitLaosLatin AmericaLatviaLebanonLiberiaLithuaniaMalaysiaMexicoMicronesiaMiddle AfricaMoldovaMoroccoNepalNetherlandsNicaraguaNigeriaNorth AmericaNorth MacedoniaNorthern AfricaNorthern EuropeNorwayOceaniaPakistanPanamaPeruPhilippinesPolandPortugalRomaniaRussiaSaudi ArabiaScotlandSenegalSerbiaSierra LeoneSingaporeSomaliaSouth AfricaSouth AmericaSouth Central AsiaSouth Eastern AsiaSouthern EuropeSpainSri LankaSt. Vincent and the GrenadinesSudanSwedenSwitzerlandSyriaTaiwanThailandTrinidad and TobagoTurkeyUgandaUkraineUruguayUzbekistanVenezuelaVietnamWest IndiesWestern AfricaWestern AsiaWestern EuropeYemenZaireZimbabweAzores
Nonimmigrants
Race
Ancestry
AfghanAfricanAlaska NativeAlaskan AthabascanAlbanianAleutAlsatianAmericanApacheArabArapahoArgentineanArmenianAssyrian/Chaldean/SyriacAustralianAustrianBahamianBangladeshiBarbadianBasqueBelgianBelizeanBermudanBhutaneseBlackfeetBolivianBrazilianBritishBritish West IndianBulgarianBurmeseCajunCambodianCanadianCape VerdeanCarpatho RusynCelticCentral AmericanCentral American IndianCherokeeCheyenneChickasawChileanChineseChippewaChoctawColombianColvilleComancheCosta RicanCreeCreekCroatianCrowCubanCypriotCzechCzechoslovakianDanishDelawareDominicanDutchDutch West IndianEastern EuropeanEcuadorianEgyptianEnglishEstonianEthiopianEuropeanFijianFilipinoFinnishFrenchFrench American IndianFrench CanadianGermanGerman RussianGhanaianGreekGuamanian/ChamorroGuatemalanGuyaneseHaitianHmongHonduranHopiHoumaHungarianIcelanderIndian (Asian)IndonesianInupiatIranianIraqiIrishIroquoisIsraeliItalianJamaicanJapaneseJordanianKenyanKiowaKoreanLaotianLatvianLebaneseLiberianLithuanianLumbeeLuxembourgerMacedonianMalaysianMalteseMarshalleseMenomineeMexicanMexican American IndianMongolianMoroccanNative HawaiianNavajoNepaleseNew ZealanderNicaraguanNigerianNorthern EuropeanNorwegianOkinawanOsageOttawaPaiutePakistaniPalestinianPanamanianParaguayanPennsylvania GermanPeruvianPimaPolishPortuguesePotawatomiPuebloPuerto RicanPuget Sound SalishRomanianRussianSalvadoranSamoanScandinavianScotch-IrishScottishSeminoleSenegaleseSerbianShoshoneSierra LeoneanSiouxSlavicSlovakSloveneSomaliSouth AfricanSouth AmericanSouth American IndianSoviet UnionSpaniardSpanishSpanish AmericanSpanish American IndianSri LankanSubsaharan AfricanSudaneseSwedishSwissSyrianTaiwaneseThaiTlingit-HaidaTohono O'OdhamTonganTrinidadian and TobagonianTsimshianTurkishU.S. Virgin IslanderUgandanUkrainianUruguayanUteVenezuelanVietnameseWelshWest IndianYakamaYaquiYugoslavianYumanYup'ikZimbabwean
Immigration
NonimmigrantsImmigrantsAfghanistanAfricaAlbaniaArgentinaArmeniaAsiaAustraliaAustriaBahamasBangladeshBarbadosBelarusBelgiumBelizeBoliviaBosnia and HerzegovinaBrazilBulgariaBurma/MyanmarCabo VerdeCambodiaCameroonCanadaCaribbeanCentral AmericaChileChinaColombiaCongoCosta RicaCroatiaCubaCzechoslovakiaDenmarkDominicaDominican RepublicEastern AfricaEastern AsiaEastern EuropeEcuadorEgyptEl SalvadorEnglandEritreaEthiopiaEuropeFijiFranceGhanaGreeceGrenadaGuatemalaGuyanaHaitiHondurasHong KongHungaryIndiaIndonesiaIranIraqIrelandIsraelItalyJamaicaJapanJordanKazakhstanKenyaKoreaKuwaitLaosLatin AmericaLatviaLebanonLiberiaLithuaniaMalaysiaMexicoMicronesiaMiddle AfricaMoldovaMoroccoNepalNetherlandsNicaraguaNigeriaNorth AmericaNorth MacedoniaNorthern AfricaNorthern EuropeNorwayOceaniaPakistanPanamaPeruPhilippinesPolandPortugalRomaniaRussiaSaudi ArabiaScotlandSenegalSerbiaSierra LeoneSingaporeSomaliaSouth AfricaSouth AmericaSouth Central AsiaSouth Eastern AsiaSouthern EuropeSpainSri LankaSt. Vincent and the GrenadinesSudanSwedenSwitzerlandSyriaTaiwanThailandTrinidad and TobagoTurkeyUgandaUkraineUruguayUzbekistanVenezuelaVietnamWest IndiesWestern AfricaWestern AsiaWestern EuropeYemenZaireZimbabweAzores
College, 1 year or more
Income
Poverty
Unemployment
Labor Participation
Family Structure
Vehicle Availability
Education Level
Disability

College, 1 year or more Comparison

Immigrants from Germany

Nonimmigrants

Good
Tragic
60.3%
COLLEGE, 1 YEAR OR MORE
76.1/ 100
METRIC RATING
152nd/ 347
METRIC RANK
56.5%
COLLEGE, 1 YEAR OR MORE
2.5/ 100
METRIC RATING
233rd/ 347
METRIC RANK

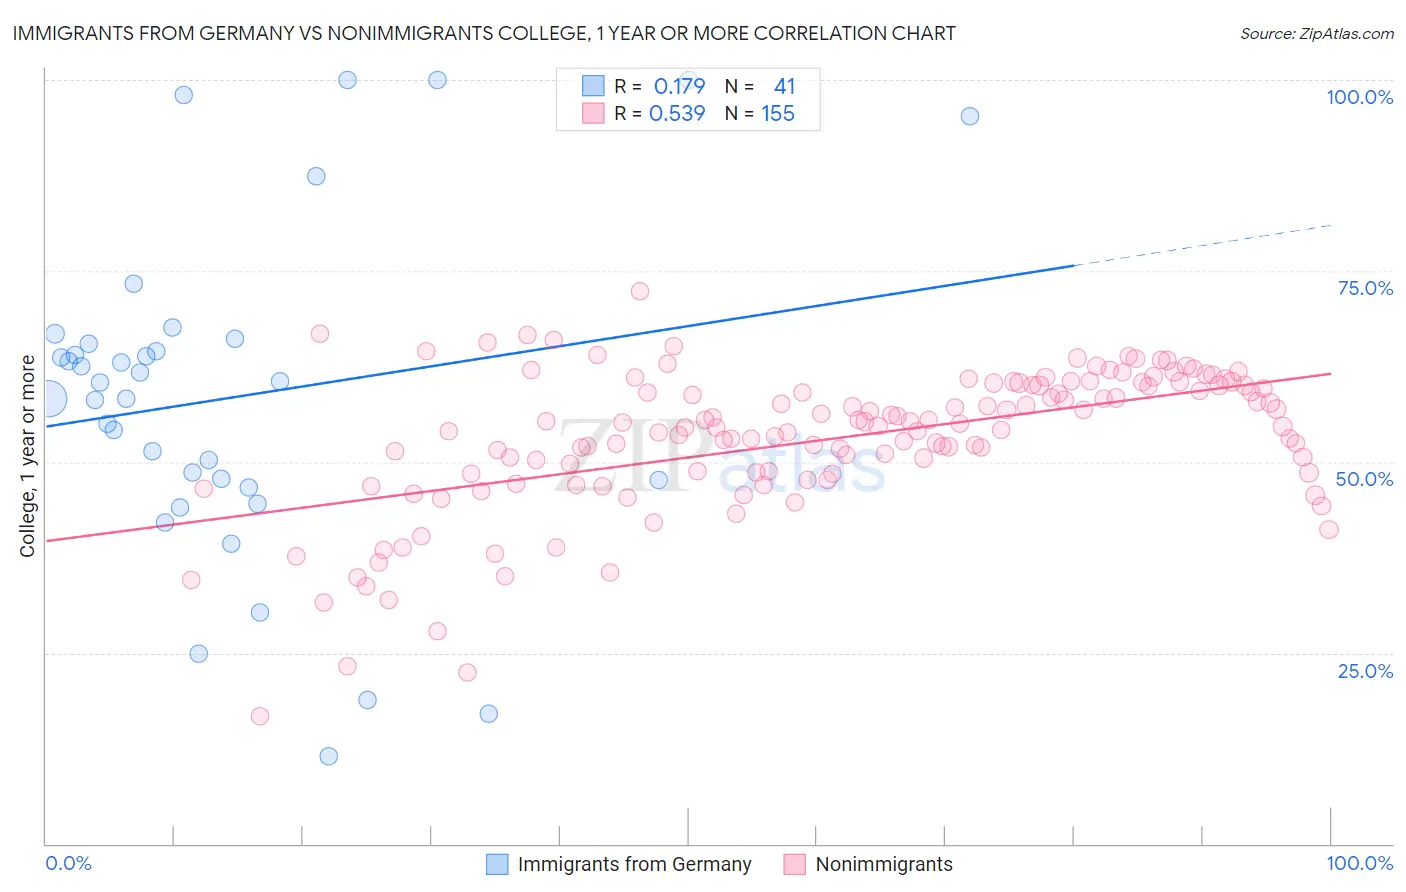
Immigrants from Germany vs Nonimmigrants College, 1 year or more Correlation Chart

The statistical analysis conducted on geographies consisting of 463,883,930 people shows a poor positive correlation between the proportion of Immigrants from Germany and percentage of population with at least college, 1 year or more education in the United States with a correlation coefficient (R) of 0.179 and weighted average of 60.3%. Similarly, the statistical analysis conducted on geographies consisting of 585,276,448 people shows a substantial positive correlation between the proportion of Nonimmigrants and percentage of population with at least college, 1 year or more education in the United States with a correlation coefficient (R) of 0.539 and weighted average of 56.5%, a difference of 6.8%.
Immigrants from Germany vs Nonimmigrants College, 1 year or more

College, 1 year or more Correlation Summary

MeasurementImmigrants from GermanyNonimmigrants
Minimum11.4%16.7%
Maximum100.0%72.4%
Range88.6%55.7%
Mean58.4%52.9%
Median60.4%54.6%
Interquartile 25% (IQ1)47.2%48.5%
Interquartile 75% (IQ3)65.8%60.0%
Interquartile Range (IQR)18.6%11.5%
Standard Deviation (Sample)21.6%9.4%
Standard Deviation (Population)21.4%9.4%

Similar Demographics by College, 1 year or more

Demographics Similar to Immigrants from Germany by College, 1 year or more

In terms of college, 1 year or more, the demographic groups most similar to Immigrants from Germany are Immigrants from Sudan (60.4%, a difference of 0.13%), Albanian (60.4%, a difference of 0.13%), Sierra Leonean (60.2%, a difference of 0.14%), Kenyan (60.5%, a difference of 0.22%), and Brazilian (60.5%, a difference of 0.22%).
DemographicsRating | RankCollege, 1 year or more
Slavs
81.1
/100
|
#145
Excellent
60.6%
Scottish
80.2
/100
|
#146
Excellent
60.5%
Immigrants | Kenya
79.1
/100
|
#147
Good
60.5%
Kenyans
79.0
/100
|
#148
Good
60.5%
Brazilians
79.0
/100
|
#149
Good
60.5%
Immigrants | Sudan
77.8
/100
|
#150
Good
60.4%
Albanians
77.8
/100
|
#151
Good
60.4%
Immigrants | Germany
76.1
/100
|
#152
Good
60.3%
Sierra Leoneans
74.1
/100
|
#153
Good
60.2%
Sudanese
73.0
/100
|
#154
Good
60.2%
Moroccans
72.9
/100
|
#155
Good
60.2%
Finns
72.9
/100
|
#156
Good
60.2%
Immigrants | Armenia
68.8
/100
|
#157
Good
60.0%
English
67.2
/100
|
#158
Good
60.0%
Immigrants | Iraq
67.0
/100
|
#159
Good
60.0%

Demographics Similar to Nonimmigrants by College, 1 year or more

In terms of college, 1 year or more, the demographic groups most similar to Nonimmigrants are Immigrants from Bangladesh (56.6%, a difference of 0.090%), Immigrants from Burma/Myanmar (56.6%, a difference of 0.15%), Liberian (56.7%, a difference of 0.34%), Spanish American (56.3%, a difference of 0.45%), and West Indian (56.3%, a difference of 0.45%).
DemographicsRating | RankCollege, 1 year or more
Immigrants | Western Africa
4.6
/100
|
#226
Tragic
57.0%
Immigrants | Immigrants
4.4
/100
|
#227
Tragic
57.0%
Immigrants | Fiji
4.0
/100
|
#228
Tragic
56.9%
Cree
3.6
/100
|
#229
Tragic
56.8%
Liberians
3.1
/100
|
#230
Tragic
56.7%
Immigrants | Burma/Myanmar
2.7
/100
|
#231
Tragic
56.6%
Immigrants | Bangladesh
2.6
/100
|
#232
Tragic
56.6%
Immigrants | Nonimmigrants
2.5
/100
|
#233
Tragic
56.5%
Spanish Americans
1.8
/100
|
#234
Tragic
56.3%
West Indians
1.8
/100
|
#235
Tragic
56.3%
Iroquois
1.7
/100
|
#236
Tragic
56.2%
Samoans
1.6
/100
|
#237
Tragic
56.2%
Barbadians
1.3
/100
|
#238
Tragic
56.0%
Puget Sound Salish
1.1
/100
|
#239
Tragic
55.9%
Trinidadians and Tobagonians
1.1
/100
|
#240
Tragic
55.8%