Immigrants from Bulgaria vs Immigrants College, Under 1 year

COMPARE

Immigrants from Bulgaria
Race
Ancestry
AfghanAfricanAlaska NativeAlaskan AthabascanAlbanianAleutAlsatianAmericanApacheArabArapahoArgentineanArmenianAssyrian/Chaldean/SyriacAustralianAustrianBahamianBangladeshiBarbadianBasqueBelgianBelizeanBermudanBhutaneseBlackfeetBolivianBrazilianBritishBritish West IndianBulgarianBurmeseCajunCambodianCanadianCape VerdeanCarpatho RusynCelticCentral AmericanCentral American IndianCherokeeCheyenneChickasawChileanChineseChippewaChoctawColombianColvilleComancheCosta RicanCreeCreekCroatianCrowCubanCypriotCzechCzechoslovakianDanishDelawareDominicanDutchDutch West IndianEastern EuropeanEcuadorianEgyptianEnglishEstonianEthiopianEuropeanFijianFilipinoFinnishFrenchFrench American IndianFrench CanadianGermanGerman RussianGhanaianGreekGuamanian/ChamorroGuatemalanGuyaneseHaitianHmongHonduranHopiHoumaHungarianIcelanderIndian (Asian)IndonesianInupiatIranianIraqiIrishIroquoisIsraeliItalianJamaicanJapaneseJordanianKenyanKiowaKoreanLaotianLatvianLebaneseLiberianLithuanianLumbeeLuxembourgerMacedonianMalaysianMalteseMarshalleseMenomineeMexicanMexican American IndianMongolianMoroccanNative HawaiianNavajoNepaleseNew ZealanderNicaraguanNigerianNorthern EuropeanNorwegianOkinawanOsageOttawaPaiutePakistaniPalestinianPanamanianParaguayanPennsylvania GermanPeruvianPimaPolishPortuguesePotawatomiPuebloPuerto RicanPuget Sound SalishRomanianRussianSalvadoranSamoanScandinavianScotch-IrishScottishSeminoleSenegaleseSerbianShoshoneSierra LeoneanSiouxSlavicSlovakSloveneSomaliSouth AfricanSouth AmericanSouth American IndianSoviet UnionSpaniardSpanishSpanish AmericanSpanish American IndianSri LankanSubsaharan AfricanSudaneseSwedishSwissSyrianTaiwaneseThaiTlingit-HaidaTohono O'OdhamTonganTrinidadian and TobagonianTsimshianTurkishU.S. Virgin IslanderUgandanUkrainianUruguayanUteVenezuelanVietnameseWelshWest IndianYakamaYaquiYugoslavianYumanYup'ikZimbabwean
Immigration
NonimmigrantsAfghanistanAfricaAlbaniaArgentinaArmeniaAsiaAustraliaAustriaBahamasBangladeshBarbadosBelarusBelgiumBelizeBoliviaBosnia and HerzegovinaBrazilBulgariaBurma/MyanmarCabo VerdeCambodiaCameroonCanadaCaribbeanCentral AmericaChileChinaColombiaCongoCosta RicaCroatiaCubaCzechoslovakiaDenmarkDominicaDominican RepublicEastern AfricaEastern AsiaEastern EuropeEcuadorEgyptEl SalvadorEnglandEritreaEthiopiaEuropeFijiFranceGermanyGhanaGreeceGrenadaGuatemalaGuyanaHaitiHondurasHong KongHungaryIndiaIndonesiaIranIraqIrelandIsraelItalyJamaicaJapanJordanKazakhstanKenyaKoreaKuwaitLaosLatin AmericaLatviaLebanonLiberiaLithuaniaMalaysiaMexicoMicronesiaMiddle AfricaMoldovaMoroccoNepalNetherlandsNicaraguaNigeriaNorth AmericaNorth MacedoniaNorthern AfricaNorthern EuropeNorwayOceaniaPakistanPanamaPeruPhilippinesPolandPortugalRomaniaRussiaSaudi ArabiaScotlandSenegalSerbiaSierra LeoneSingaporeSomaliaSouth AfricaSouth AmericaSouth Central AsiaSouth Eastern AsiaSouthern EuropeSpainSri LankaSt. Vincent and the GrenadinesSudanSwedenSwitzerlandSyriaTaiwanThailandTrinidad and TobagoTurkeyUgandaUkraineUruguayUzbekistanVenezuelaVietnamWest IndiesWestern AfricaWestern AsiaWestern EuropeYemenZaireZimbabweAzores
Immigrants
Race
Ancestry
AfghanAfricanAlaska NativeAlaskan AthabascanAlbanianAleutAlsatianAmericanApacheArabArapahoArgentineanArmenianAssyrian/Chaldean/SyriacAustralianAustrianBahamianBangladeshiBarbadianBasqueBelgianBelizeanBermudanBhutaneseBlackfeetBolivianBrazilianBritishBritish West IndianBulgarianBurmeseCajunCambodianCanadianCape VerdeanCarpatho RusynCelticCentral AmericanCentral American IndianCherokeeCheyenneChickasawChileanChineseChippewaChoctawColombianColvilleComancheCosta RicanCreeCreekCroatianCrowCubanCypriotCzechCzechoslovakianDanishDelawareDominicanDutchDutch West IndianEastern EuropeanEcuadorianEgyptianEnglishEstonianEthiopianEuropeanFijianFilipinoFinnishFrenchFrench American IndianFrench CanadianGermanGerman RussianGhanaianGreekGuamanian/ChamorroGuatemalanGuyaneseHaitianHmongHonduranHopiHoumaHungarianIcelanderIndian (Asian)IndonesianInupiatIranianIraqiIrishIroquoisIsraeliItalianJamaicanJapaneseJordanianKenyanKiowaKoreanLaotianLatvianLebaneseLiberianLithuanianLumbeeLuxembourgerMacedonianMalaysianMalteseMarshalleseMenomineeMexicanMexican American IndianMongolianMoroccanNative HawaiianNavajoNepaleseNew ZealanderNicaraguanNigerianNorthern EuropeanNorwegianOkinawanOsageOttawaPaiutePakistaniPalestinianPanamanianParaguayanPennsylvania GermanPeruvianPimaPolishPortuguesePotawatomiPuebloPuerto RicanPuget Sound SalishRomanianRussianSalvadoranSamoanScandinavianScotch-IrishScottishSeminoleSenegaleseSerbianShoshoneSierra LeoneanSiouxSlavicSlovakSloveneSomaliSouth AfricanSouth AmericanSouth American IndianSoviet UnionSpaniardSpanishSpanish AmericanSpanish American IndianSri LankanSubsaharan AfricanSudaneseSwedishSwissSyrianTaiwaneseThaiTlingit-HaidaTohono O'OdhamTonganTrinidadian and TobagonianTsimshianTurkishU.S. Virgin IslanderUgandanUkrainianUruguayanUteVenezuelanVietnameseWelshWest IndianYakamaYaquiYugoslavianYumanYup'ikZimbabwean
Immigration
NonimmigrantsImmigrantsAfghanistanAfricaAlbaniaArgentinaArmeniaAsiaAustraliaAustriaBahamasBangladeshBarbadosBelarusBelgiumBelizeBoliviaBosnia and HerzegovinaBrazilBurma/MyanmarCabo VerdeCambodiaCameroonCanadaCaribbeanCentral AmericaChileChinaColombiaCongoCosta RicaCroatiaCubaCzechoslovakiaDenmarkDominicaDominican RepublicEastern AfricaEastern AsiaEastern EuropeEcuadorEgyptEl SalvadorEnglandEritreaEthiopiaEuropeFijiFranceGermanyGhanaGreeceGrenadaGuatemalaGuyanaHaitiHondurasHong KongHungaryIndiaIndonesiaIranIraqIrelandIsraelItalyJamaicaJapanJordanKazakhstanKenyaKoreaKuwaitLaosLatin AmericaLatviaLebanonLiberiaLithuaniaMalaysiaMexicoMicronesiaMiddle AfricaMoldovaMoroccoNepalNetherlandsNicaraguaNigeriaNorth AmericaNorth MacedoniaNorthern AfricaNorthern EuropeNorwayOceaniaPakistanPanamaPeruPhilippinesPolandPortugalRomaniaRussiaSaudi ArabiaScotlandSenegalSerbiaSierra LeoneSingaporeSomaliaSouth AfricaSouth AmericaSouth Central AsiaSouth Eastern AsiaSouthern EuropeSpainSri LankaSt. Vincent and the GrenadinesSudanSwedenSwitzerlandSyriaTaiwanThailandTrinidad and TobagoTurkeyUgandaUkraineUruguayUzbekistanVenezuelaVietnamWest IndiesWestern AfricaWestern AsiaWestern EuropeYemenZaireZimbabweAzores
College, Under 1 year
Income
Poverty
Unemployment
Labor Participation
Family Structure
Vehicle Availability
Education Level
Disability

College, Under 1 year Comparison

Immigrants from Bulgaria

Immigrants

Exceptional
Tragic
70.0%
COLLEGE, UNDER 1 YEAR
99.8/ 100
METRIC RATING
47th/ 347
METRIC RANK
62.5%
COLLEGE, UNDER 1 YEAR
1.7/ 100
METRIC RATING
236th/ 347
METRIC RANK

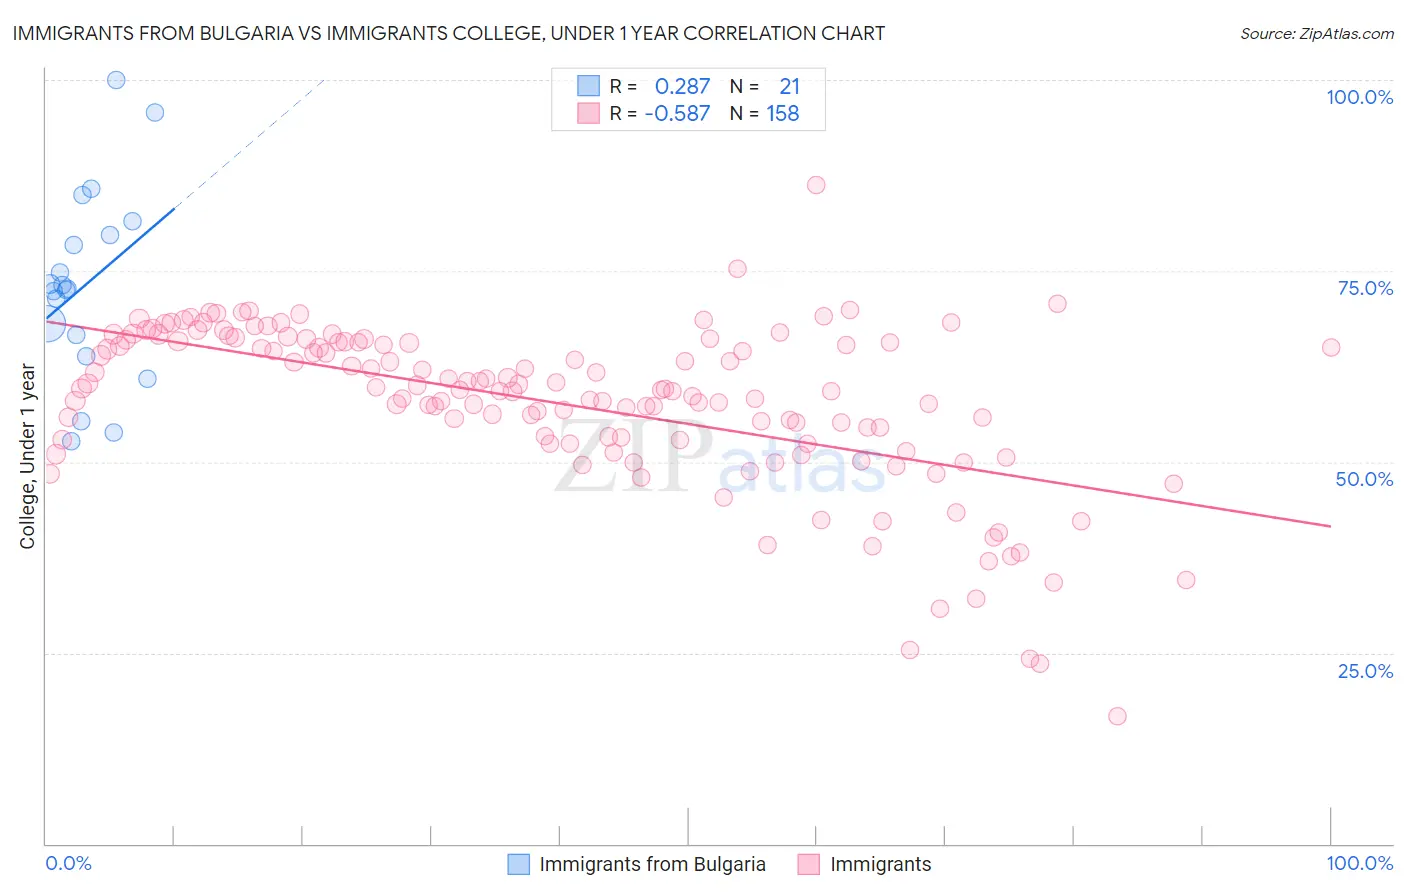
Immigrants from Bulgaria vs Immigrants College, Under 1 year Correlation Chart

The statistical analysis conducted on geographies consisting of 172,550,092 people shows a weak positive correlation between the proportion of Immigrants from Bulgaria and percentage of population with at least college, under 1 year education in the United States with a correlation coefficient (R) of 0.287 and weighted average of 70.0%. Similarly, the statistical analysis conducted on geographies consisting of 577,770,427 people shows a substantial negative correlation between the proportion of Immigrants and percentage of population with at least college, under 1 year education in the United States with a correlation coefficient (R) of -0.587 and weighted average of 62.5%, a difference of 12.1%.
Immigrants from Bulgaria vs Immigrants College, Under 1 year

College, Under 1 year Correlation Summary

MeasurementImmigrants from BulgariaImmigrants
Minimum52.7%16.7%
Maximum100.0%86.3%
Range47.3%69.7%
Mean73.2%57.6%
Median72.6%59.4%
Interquartile 25% (IQ1)65.2%52.9%
Interquartile 75% (IQ3)80.6%65.7%
Interquartile Range (IQR)15.4%12.8%
Standard Deviation (Sample)12.4%10.9%
Standard Deviation (Population)12.1%10.8%

Similar Demographics by College, Under 1 year

Demographics Similar to Immigrants from Bulgaria by College, Under 1 year

In terms of college, under 1 year, the demographic groups most similar to Immigrants from Bulgaria are Immigrants from Netherlands (70.0%, a difference of 0.060%), Immigrants from Austria (70.0%, a difference of 0.10%), Immigrants from Latvia (70.1%, a difference of 0.11%), Zimbabwean (69.9%, a difference of 0.22%), and Immigrants from Norway (70.2%, a difference of 0.23%).
DemographicsRating | RankCollege, Under 1 year
Immigrants | Turkey
99.9
/100
|
#40
Exceptional
70.3%
Immigrants | Kuwait
99.9
/100
|
#41
Exceptional
70.3%
Immigrants | Lithuania
99.9
/100
|
#42
Exceptional
70.3%
Israelis
99.9
/100
|
#43
Exceptional
70.2%
New Zealanders
99.9
/100
|
#44
Exceptional
70.2%
Immigrants | Norway
99.9
/100
|
#45
Exceptional
70.2%
Immigrants | Latvia
99.9
/100
|
#46
Exceptional
70.1%
Immigrants | Bulgaria
99.8
/100
|
#47
Exceptional
70.0%
Immigrants | Netherlands
99.8
/100
|
#48
Exceptional
70.0%
Immigrants | Austria
99.8
/100
|
#49
Exceptional
70.0%
Zimbabweans
99.8
/100
|
#50
Exceptional
69.9%
Mongolians
99.8
/100
|
#51
Exceptional
69.9%
Immigrants | Russia
99.8
/100
|
#52
Exceptional
69.9%
South Africans
99.7
/100
|
#53
Exceptional
69.7%
Immigrants | Czechoslovakia
99.7
/100
|
#54
Exceptional
69.6%

Demographics Similar to Immigrants by College, Under 1 year

In terms of college, under 1 year, the demographic groups most similar to Immigrants are Immigrants from Burma/Myanmar (62.5%, a difference of 0.030%), French American Indian (62.4%, a difference of 0.12%), Spanish American (62.6%, a difference of 0.13%), Chippewa (62.6%, a difference of 0.18%), and Iroquois (62.6%, a difference of 0.21%).
DemographicsRating | RankCollege, Under 1 year
Liberians
3.2
/100
|
#229
Tragic
63.0%
Immigrants | Nonimmigrants
3.0
/100
|
#230
Tragic
62.9%
Immigrants | Western Africa
2.4
/100
|
#231
Tragic
62.8%
Osage
2.2
/100
|
#232
Tragic
62.7%
Iroquois
2.0
/100
|
#233
Tragic
62.6%
Chippewa
2.0
/100
|
#234
Tragic
62.6%
Spanish Americans
1.9
/100
|
#235
Tragic
62.6%
Immigrants | Immigrants
1.7
/100
|
#236
Tragic
62.5%
Immigrants | Burma/Myanmar
1.6
/100
|
#237
Tragic
62.5%
French American Indians
1.5
/100
|
#238
Tragic
62.4%
Nepalese
1.1
/100
|
#239
Tragic
62.2%
Aleuts
1.1
/100
|
#240
Tragic
62.2%
Ottawa
1.1
/100
|
#241
Tragic
62.2%
Malaysians
1.1
/100
|
#242
Tragic
62.2%
Hawaiians
1.1
/100
|
#243
Tragic
62.1%