Immigrants from Belarus vs Immigrants from Italy College, Under 1 year
COMPARE
Immigrants from Belarus
Immigrants from Italy
College, Under 1 year
College, Under 1 year Comparison
Immigrants from Belarus
Immigrants from Italy
69.2%
COLLEGE, UNDER 1 YEAR
99.5/ 100
METRIC RATING
62nd/ 347
METRIC RANK
66.8%
COLLEGE, UNDER 1 YEAR
86.9/ 100
METRIC RATING
138th/ 347
METRIC RANK
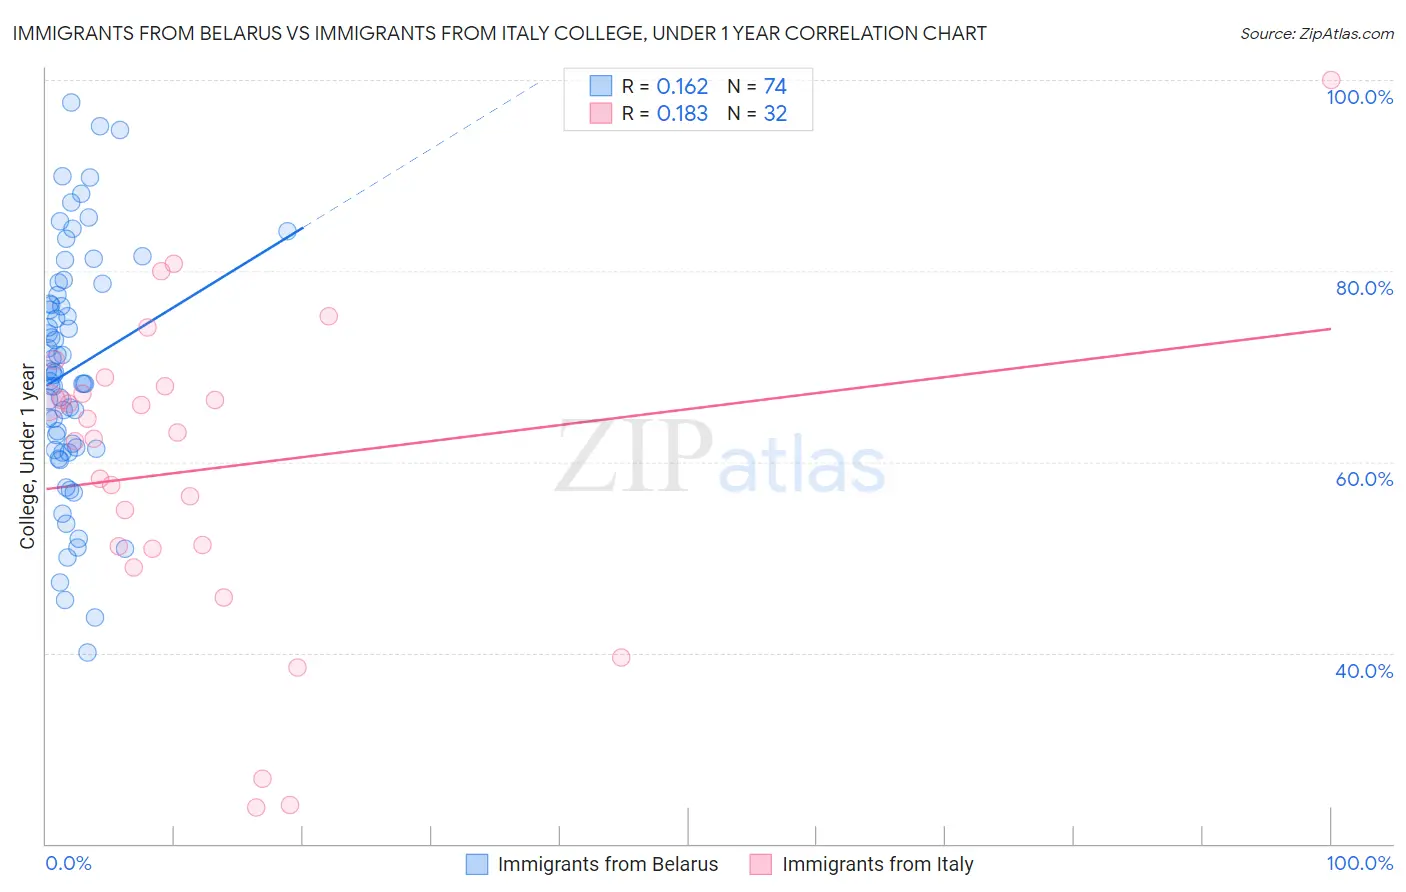
Immigrants from Belarus vs Immigrants from Italy College, Under 1 year Correlation Chart
The statistical analysis conducted on geographies consisting of 150,205,158 people shows a poor positive correlation between the proportion of Immigrants from Belarus and percentage of population with at least college, under 1 year education in the United States with a correlation coefficient (R) of 0.162 and weighted average of 69.2%. Similarly, the statistical analysis conducted on geographies consisting of 324,223,988 people shows a poor positive correlation between the proportion of Immigrants from Italy and percentage of population with at least college, under 1 year education in the United States with a correlation coefficient (R) of 0.183 and weighted average of 66.8%, a difference of 3.6%.
College, Under 1 year Correlation Summary
| Measurement | Immigrants from Belarus | Immigrants from Italy |
| Minimum | 40.0% | 23.8% |
| Maximum | 97.7% | 100.0% |
| Range | 57.6% | 76.2% |
| Mean | 69.6% | 59.2% |
| Median | 69.2% | 62.7% |
| Interquartile 25% (IQ1) | 61.3% | 51.0% |
| Interquartile 75% (IQ3) | 77.5% | 67.5% |
| Interquartile Range (IQR) | 16.2% | 16.5% |
| Standard Deviation (Sample) | 12.6% | 16.6% |
| Standard Deviation (Population) | 12.5% | 16.4% |
Similar Demographics by College, Under 1 year
Demographics Similar to Immigrants from Belarus by College, Under 1 year
In terms of college, under 1 year, the demographic groups most similar to Immigrants from Belarus are Immigrants from Kazakhstan (69.2%, a difference of 0.0%), Immigrants from Asia (69.2%, a difference of 0.040%), Immigrants from Serbia (69.3%, a difference of 0.13%), Immigrants from Canada (69.1%, a difference of 0.13%), and Northern European (69.0%, a difference of 0.17%).
| Demographics | Rating | Rank | College, Under 1 year |
| Maltese | 99.7 /100 | #55 | Exceptional 69.5% |
| Immigrants | Scotland | 99.6 /100 | #56 | Exceptional 69.4% |
| Asians | 99.6 /100 | #57 | Exceptional 69.4% |
| Immigrants | Malaysia | 99.6 /100 | #58 | Exceptional 69.3% |
| Immigrants | Serbia | 99.5 /100 | #59 | Exceptional 69.3% |
| Immigrants | Asia | 99.5 /100 | #60 | Exceptional 69.2% |
| Immigrants | Kazakhstan | 99.5 /100 | #61 | Exceptional 69.2% |
| Immigrants | Belarus | 99.5 /100 | #62 | Exceptional 69.2% |
| Immigrants | Canada | 99.4 /100 | #63 | Exceptional 69.1% |
| Northern Europeans | 99.4 /100 | #64 | Exceptional 69.0% |
| Immigrants | Moldova | 99.3 /100 | #65 | Exceptional 69.0% |
| Immigrants | North America | 99.3 /100 | #66 | Exceptional 69.0% |
| Immigrants | Zimbabwe | 99.2 /100 | #67 | Exceptional 68.9% |
| Immigrants | Indonesia | 99.2 /100 | #68 | Exceptional 68.9% |
| Immigrants | Romania | 99.2 /100 | #69 | Exceptional 68.9% |
Demographics Similar to Immigrants from Italy by College, Under 1 year
In terms of college, under 1 year, the demographic groups most similar to Immigrants from Italy are Immigrants from Chile (66.8%, a difference of 0.050%), Ugandan (66.8%, a difference of 0.080%), Canadian (66.8%, a difference of 0.090%), Iraqi (66.8%, a difference of 0.10%), and Venezuelan (66.7%, a difference of 0.10%).
| Demographics | Rating | Rank | College, Under 1 year |
| Finns | 88.6 /100 | #131 | Excellent 66.9% |
| Poles | 88.4 /100 | #132 | Excellent 66.9% |
| Immigrants | Brazil | 88.3 /100 | #133 | Excellent 66.9% |
| Iraqis | 88.0 /100 | #134 | Excellent 66.8% |
| Canadians | 87.9 /100 | #135 | Excellent 66.8% |
| Ugandans | 87.8 /100 | #136 | Excellent 66.8% |
| Immigrants | Chile | 87.4 /100 | #137 | Excellent 66.8% |
| Immigrants | Italy | 86.9 /100 | #138 | Excellent 66.8% |
| Venezuelans | 85.9 /100 | #139 | Excellent 66.7% |
| Slavs | 85.9 /100 | #140 | Excellent 66.7% |
| Immigrants | Afghanistan | 85.1 /100 | #141 | Excellent 66.7% |
| English | 82.9 /100 | #142 | Excellent 66.6% |
| Immigrants | Uganda | 82.8 /100 | #143 | Excellent 66.5% |
| Immigrants | Germany | 82.0 /100 | #144 | Excellent 66.5% |
| Immigrants | Kenya | 81.8 /100 | #145 | Excellent 66.5% |