Egyptian vs Serbian College, 1 year or more

COMPARE

Egyptian
Race
Ancestry
AfghanAfricanAlaska NativeAlaskan AthabascanAlbanianAleutAlsatianAmericanApacheArabArapahoArgentineanArmenianAssyrian/Chaldean/SyriacAustralianAustrianBahamianBangladeshiBarbadianBasqueBelgianBelizeanBermudanBhutaneseBlackfeetBolivianBrazilianBritishBritish West IndianBulgarianBurmeseCajunCambodianCanadianCape VerdeanCarpatho RusynCelticCentral AmericanCentral American IndianCherokeeCheyenneChickasawChileanChineseChippewaChoctawColombianColvilleComancheCosta RicanCreeCreekCroatianCrowCubanCypriotCzechCzechoslovakianDanishDelawareDominicanDutchDutch West IndianEastern EuropeanEcuadorianEgyptianEnglishEstonianEthiopianEuropeanFijianFilipinoFinnishFrenchFrench American IndianFrench CanadianGermanGerman RussianGhanaianGreekGuamanian/ChamorroGuatemalanGuyaneseHaitianHmongHonduranHopiHoumaHungarianIcelanderIndian (Asian)IndonesianInupiatIranianIraqiIrishIroquoisIsraeliItalianJamaicanJapaneseJordanianKenyanKiowaKoreanLaotianLatvianLebaneseLiberianLithuanianLumbeeLuxembourgerMacedonianMalaysianMalteseMarshalleseMenomineeMexicanMexican American IndianMongolianMoroccanNative HawaiianNavajoNepaleseNew ZealanderNicaraguanNigerianNorthern EuropeanNorwegianOkinawanOsageOttawaPaiutePakistaniPalestinianPanamanianParaguayanPennsylvania GermanPeruvianPimaPolishPortuguesePotawatomiPuebloPuerto RicanPuget Sound SalishRomanianRussianSalvadoranSamoanScandinavianScotch-IrishScottishSeminoleSenegaleseShoshoneSierra LeoneanSiouxSlavicSlovakSloveneSomaliSouth AfricanSouth AmericanSouth American IndianSoviet UnionSpaniardSpanishSpanish AmericanSpanish American IndianSri LankanSubsaharan AfricanSudaneseSwedishSwissSyrianTaiwaneseThaiTlingit-HaidaTohono O'OdhamTonganTrinidadian and TobagonianTsimshianTurkishU.S. Virgin IslanderUgandanUkrainianUruguayanUteVenezuelanVietnameseWelshWest IndianYakamaYaquiYugoslavianYumanYup'ikZimbabwean
Immigration
NonimmigrantsImmigrantsAfghanistanAfricaAlbaniaArgentinaArmeniaAsiaAustraliaAustriaBahamasBangladeshBarbadosBelarusBelgiumBelizeBoliviaBosnia and HerzegovinaBrazilBulgariaBurma/MyanmarCabo VerdeCambodiaCameroonCanadaCaribbeanCentral AmericaChileChinaColombiaCongoCosta RicaCroatiaCubaCzechoslovakiaDenmarkDominicaDominican RepublicEastern AfricaEastern AsiaEastern EuropeEcuadorEgyptEl SalvadorEnglandEritreaEthiopiaEuropeFijiFranceGermanyGhanaGreeceGrenadaGuatemalaGuyanaHaitiHondurasHong KongHungaryIndiaIndonesiaIranIraqIrelandIsraelItalyJamaicaJapanJordanKazakhstanKenyaKoreaKuwaitLaosLatin AmericaLatviaLebanonLiberiaLithuaniaMalaysiaMexicoMicronesiaMiddle AfricaMoldovaMoroccoNepalNetherlandsNicaraguaNigeriaNorth AmericaNorth MacedoniaNorthern AfricaNorthern EuropeNorwayOceaniaPakistanPanamaPeruPhilippinesPolandPortugalRomaniaRussiaSaudi ArabiaScotlandSenegalSerbiaSierra LeoneSingaporeSomaliaSouth AfricaSouth AmericaSouth Central AsiaSouth Eastern AsiaSouthern EuropeSpainSri LankaSt. Vincent and the GrenadinesSudanSwedenSwitzerlandSyriaTaiwanThailandTrinidad and TobagoTurkeyUgandaUkraineUruguayUzbekistanVenezuelaVietnamWest IndiesWestern AfricaWestern AsiaWestern EuropeYemenZaireZimbabweAzores
Serbian
Race
Ancestry
AfghanAfricanAlaska NativeAlaskan AthabascanAlbanianAleutAlsatianAmericanApacheArabArapahoArgentineanArmenianAssyrian/Chaldean/SyriacAustralianAustrianBahamianBangladeshiBarbadianBasqueBelgianBelizeanBermudanBhutaneseBlackfeetBolivianBrazilianBritishBritish West IndianBulgarianBurmeseCajunCambodianCanadianCape VerdeanCarpatho RusynCelticCentral AmericanCentral American IndianCherokeeCheyenneChickasawChileanChineseChippewaChoctawColombianColvilleComancheCosta RicanCreeCreekCroatianCrowCubanCypriotCzechCzechoslovakianDanishDelawareDominicanDutchDutch West IndianEastern EuropeanEcuadorianEnglishEstonianEthiopianEuropeanFijianFilipinoFinnishFrenchFrench American IndianFrench CanadianGermanGerman RussianGhanaianGreekGuamanian/ChamorroGuatemalanGuyaneseHaitianHmongHonduranHopiHoumaHungarianIcelanderIndian (Asian)IndonesianInupiatIranianIraqiIrishIroquoisIsraeliItalianJamaicanJapaneseJordanianKenyanKiowaKoreanLaotianLatvianLebaneseLiberianLithuanianLumbeeLuxembourgerMacedonianMalaysianMalteseMarshalleseMenomineeMexicanMexican American IndianMongolianMoroccanNative HawaiianNavajoNepaleseNew ZealanderNicaraguanNigerianNorthern EuropeanNorwegianOkinawanOsageOttawaPaiutePakistaniPalestinianPanamanianParaguayanPennsylvania GermanPeruvianPimaPolishPortuguesePotawatomiPuebloPuerto RicanPuget Sound SalishRomanianRussianSalvadoranSamoanScandinavianScotch-IrishScottishSeminoleSenegaleseSerbianShoshoneSierra LeoneanSiouxSlavicSlovakSloveneSomaliSouth AfricanSouth AmericanSouth American IndianSoviet UnionSpaniardSpanishSpanish AmericanSpanish American IndianSri LankanSubsaharan AfricanSudaneseSwedishSwissSyrianTaiwaneseThaiTlingit-HaidaTohono O'OdhamTonganTrinidadian and TobagonianTsimshianTurkishU.S. Virgin IslanderUgandanUkrainianUruguayanUteVenezuelanVietnameseWelshWest IndianYakamaYaquiYugoslavianYumanYup'ikZimbabwean
Immigration
NonimmigrantsImmigrantsAfghanistanAfricaAlbaniaArgentinaArmeniaAsiaAustraliaAustriaBahamasBangladeshBarbadosBelarusBelgiumBelizeBoliviaBosnia and HerzegovinaBrazilBulgariaBurma/MyanmarCabo VerdeCambodiaCameroonCanadaCaribbeanCentral AmericaChileChinaColombiaCongoCosta RicaCroatiaCubaCzechoslovakiaDenmarkDominicaDominican RepublicEastern AfricaEastern AsiaEastern EuropeEcuadorEgyptEl SalvadorEnglandEritreaEthiopiaEuropeFijiFranceGermanyGhanaGreeceGrenadaGuatemalaGuyanaHaitiHondurasHong KongHungaryIndiaIndonesiaIranIraqIrelandIsraelItalyJamaicaJapanJordanKazakhstanKenyaKoreaKuwaitLaosLatin AmericaLatviaLebanonLiberiaLithuaniaMalaysiaMexicoMicronesiaMiddle AfricaMoldovaMoroccoNepalNetherlandsNicaraguaNigeriaNorth AmericaNorth MacedoniaNorthern AfricaNorthern EuropeNorwayOceaniaPakistanPanamaPeruPhilippinesPolandPortugalRomaniaRussiaSaudi ArabiaScotlandSenegalSerbiaSierra LeoneSingaporeSomaliaSouth AfricaSouth AmericaSouth Central AsiaSouth Eastern AsiaSouthern EuropeSpainSri LankaSt. Vincent and the GrenadinesSudanSwedenSwitzerlandSyriaTaiwanThailandTrinidad and TobagoTurkeyUgandaUkraineUruguayUzbekistanVenezuelaVietnamWest IndiesWestern AfricaWestern AsiaWestern EuropeYemenZaireZimbabweAzores
College, 1 year or more
Income
Poverty
Unemployment
Labor Participation
Family Structure
Vehicle Availability
Education Level
Disability

College, 1 year or more Comparison

Egyptians

Serbians

Exceptional
Exceptional
63.1%
COLLEGE, 1 YEAR OR MORE
99.0/ 100
METRIC RATING
72nd/ 347
METRIC RANK
61.4%
COLLEGE, 1 YEAR OR MORE
92.2/ 100
METRIC RATING
123rd/ 347
METRIC RANK

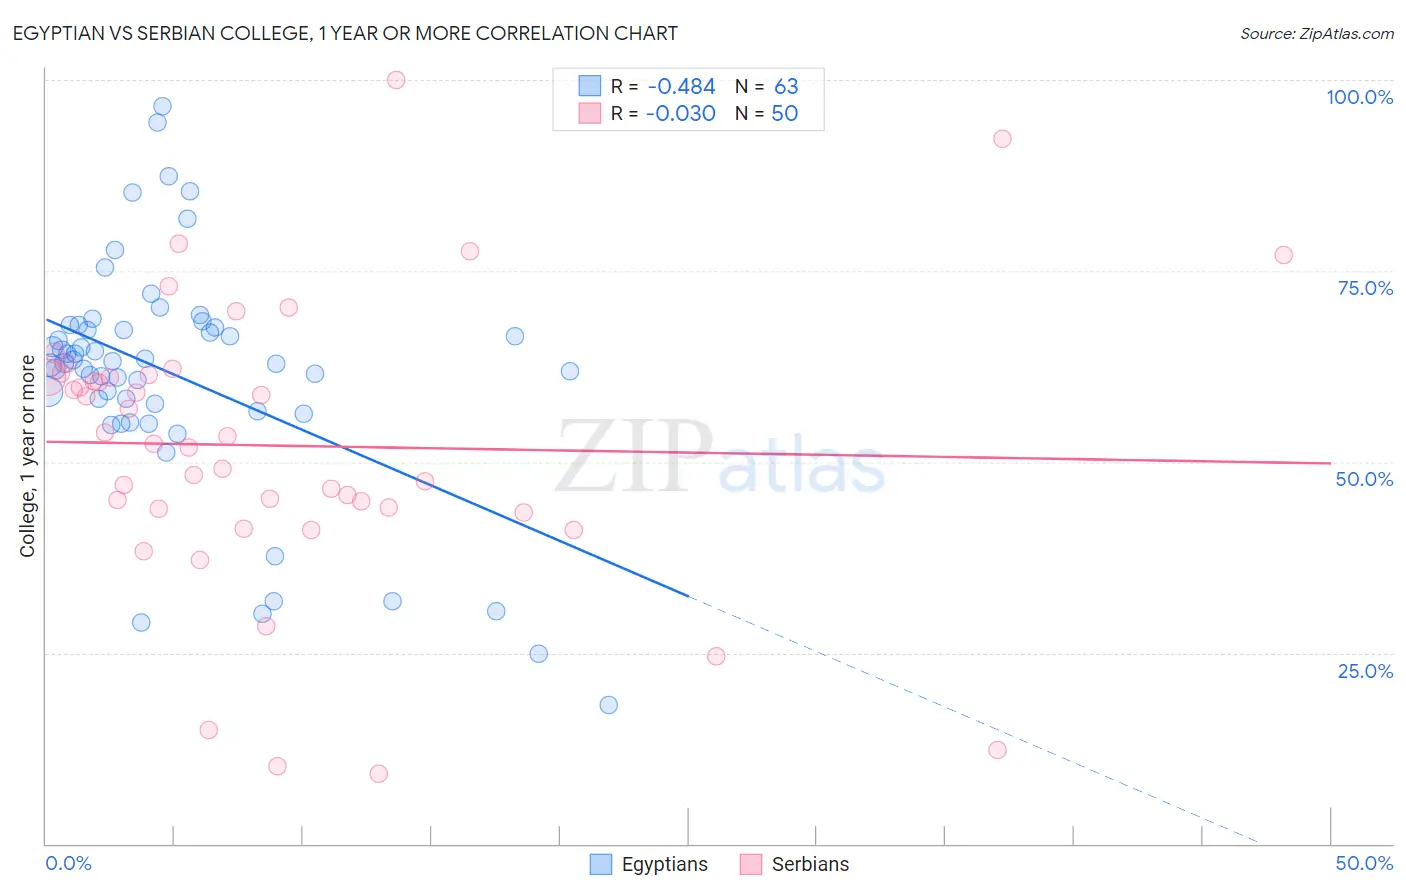
Egyptian vs Serbian College, 1 year or more Correlation Chart

The statistical analysis conducted on geographies consisting of 276,926,367 people shows a moderate negative correlation between the proportion of Egyptians and percentage of population with at least college, 1 year or more education in the United States with a correlation coefficient (R) of -0.484 and weighted average of 63.1%. Similarly, the statistical analysis conducted on geographies consisting of 267,640,905 people shows no correlation between the proportion of Serbians and percentage of population with at least college, 1 year or more education in the United States with a correlation coefficient (R) of -0.030 and weighted average of 61.4%, a difference of 2.8%.
Egyptian vs Serbian College, 1 year or more

College, 1 year or more Correlation Summary

MeasurementEgyptianSerbian
Minimum18.2%9.2%
Maximum96.6%100.0%
Range78.4%90.8%
Mean61.3%52.1%
Median62.9%52.9%
Interquartile 25% (IQ1)56.7%43.9%
Interquartile 75% (IQ3)67.5%61.3%
Interquartile Range (IQR)10.9%17.4%
Standard Deviation (Sample)15.4%18.8%
Standard Deviation (Population)15.3%18.6%

Similar Demographics by College, 1 year or more

Demographics Similar to Egyptians by College, 1 year or more

In terms of college, 1 year or more, the demographic groups most similar to Egyptians are Immigrants from Moldova (63.0%, a difference of 0.010%), Immigrants from North America (63.0%, a difference of 0.030%), Immigrants from Canada (63.1%, a difference of 0.060%), Armenian (63.0%, a difference of 0.12%), and Paraguayan (62.9%, a difference of 0.22%).
DemographicsRating | RankCollege, 1 year or more
Maltese
99.3
/100
|
#65
Exceptional
63.4%
Immigrants | Europe
99.3
/100
|
#66
Exceptional
63.3%
Immigrants | Romania
99.3
/100
|
#67
Exceptional
63.3%
Immigrants | Greece
99.3
/100
|
#68
Exceptional
63.3%
Immigrants | Zimbabwe
99.3
/100
|
#69
Exceptional
63.3%
Argentineans
99.2
/100
|
#70
Exceptional
63.2%
Immigrants | Canada
99.1
/100
|
#71
Exceptional
63.1%
Egyptians
99.0
/100
|
#72
Exceptional
63.1%
Immigrants | Moldova
99.0
/100
|
#73
Exceptional
63.0%
Immigrants | North America
99.0
/100
|
#74
Exceptional
63.0%
Armenians
98.9
/100
|
#75
Exceptional
63.0%
Paraguayans
98.8
/100
|
#76
Exceptional
62.9%
Ethiopians
98.8
/100
|
#77
Exceptional
62.9%
Immigrants | Lebanon
98.8
/100
|
#78
Exceptional
62.9%
Northern Europeans
98.8
/100
|
#79
Exceptional
62.9%

Demographics Similar to Serbians by College, 1 year or more

In terms of college, 1 year or more, the demographic groups most similar to Serbians are Immigrants from Chile (61.4%, a difference of 0.010%), Venezuelan (61.3%, a difference of 0.030%), Immigrants from Jordan (61.4%, a difference of 0.10%), Immigrants from Syria (61.3%, a difference of 0.11%), and Alsatian (61.3%, a difference of 0.15%).
DemographicsRating | RankCollege, 1 year or more
Lebanese
94.1
/100
|
#116
Exceptional
61.6%
Arabs
93.9
/100
|
#117
Exceptional
61.6%
Immigrants | Brazil
93.9
/100
|
#118
Exceptional
61.6%
Assyrians/Chaldeans/Syriacs
93.3
/100
|
#119
Exceptional
61.5%
Pakistanis
93.2
/100
|
#120
Exceptional
61.5%
Immigrants | Jordan
92.7
/100
|
#121
Exceptional
61.4%
Immigrants | Chile
92.3
/100
|
#122
Exceptional
61.4%
Serbians
92.2
/100
|
#123
Exceptional
61.4%
Venezuelans
92.1
/100
|
#124
Exceptional
61.3%
Immigrants | Syria
91.6
/100
|
#125
Exceptional
61.3%
Alsatians
91.3
/100
|
#126
Exceptional
61.3%
Immigrants | Eastern Africa
91.1
/100
|
#127
Exceptional
61.2%
Immigrants | Italy
91.1
/100
|
#128
Exceptional
61.2%
Ugandans
90.7
/100
|
#129
Exceptional
61.2%
Italians
89.5
/100
|
#130
Excellent
61.1%