Czech vs Immigrants from Yemen GED/Equivalency

COMPARE

Czech
Race
Ancestry
AfghanAfricanAlaska NativeAlaskan AthabascanAlbanianAleutAlsatianAmericanApacheArabArapahoArgentineanArmenianAssyrian/Chaldean/SyriacAustralianAustrianBahamianBangladeshiBarbadianBasqueBelgianBelizeanBermudanBhutaneseBlackfeetBolivianBrazilianBritishBritish West IndianBulgarianBurmeseCajunCambodianCanadianCape VerdeanCarpatho RusynCelticCentral AmericanCentral American IndianCherokeeCheyenneChickasawChileanChineseChippewaChoctawColombianColvilleComancheCosta RicanCreeCreekCroatianCrowCubanCypriotCzechCzechoslovakianDanishDelawareDominicanDutchDutch West IndianEastern EuropeanEcuadorianEgyptianEnglishEstonianEthiopianEuropeanFijianFilipinoFinnishFrenchFrench American IndianFrench CanadianGermanGerman RussianGhanaianGreekGuamanian/ChamorroGuatemalanGuyaneseHaitianHmongHonduranHopiHoumaHungarianIcelanderIndian (Asian)IndonesianInupiatIranianIraqiIrishIroquoisIsraeliItalianJamaicanJapaneseJordanianKenyanKiowaKoreanLaotianLatvianLebaneseLiberianLithuanianLumbeeLuxembourgerMacedonianMalaysianMalteseMarshalleseMenomineeMexicanMexican American IndianMongolianMoroccanNative HawaiianNavajoNepaleseNew ZealanderNicaraguanNigerianNorthern EuropeanNorwegianOkinawanOsageOttawaPaiutePakistaniPalestinianPanamanianParaguayanPennsylvania GermanPeruvianPimaPolishPortuguesePotawatomiPuebloPuerto RicanPuget Sound SalishRomanianRussianSalvadoranSamoanScandinavianScotch-IrishScottishSeminoleSenegaleseSerbianShoshoneSierra LeoneanSiouxSlavicSlovakSloveneSomaliSouth AfricanSouth AmericanSouth American IndianSoviet UnionSpaniardSpanishSpanish AmericanSpanish American IndianSri LankanSubsaharan AfricanSudaneseSwedishSwissSyrianTaiwaneseThaiTlingit-HaidaTohono O'OdhamTonganTrinidadian and TobagonianTsimshianTurkishU.S. Virgin IslanderUgandanUkrainianUruguayanUteVenezuelanVietnameseWelshWest IndianYakamaYaquiYugoslavianYumanYup'ikZimbabwean
Immigration
NonimmigrantsImmigrantsAfghanistanAfricaAlbaniaArgentinaArmeniaAsiaAustraliaAustriaBahamasBangladeshBarbadosBelarusBelgiumBelizeBoliviaBosnia and HerzegovinaBrazilBulgariaBurma/MyanmarCabo VerdeCambodiaCameroonCanadaCaribbeanCentral AmericaChileChinaColombiaCongoCosta RicaCroatiaCubaCzechoslovakiaDenmarkDominicaDominican RepublicEastern AfricaEastern AsiaEastern EuropeEcuadorEgyptEl SalvadorEnglandEritreaEthiopiaEuropeFijiFranceGermanyGhanaGreeceGrenadaGuatemalaGuyanaHaitiHondurasHong KongHungaryIndiaIndonesiaIranIraqIrelandIsraelItalyJamaicaJapanJordanKazakhstanKenyaKoreaKuwaitLaosLatin AmericaLatviaLebanonLiberiaLithuaniaMalaysiaMexicoMicronesiaMiddle AfricaMoldovaMoroccoNepalNetherlandsNicaraguaNigeriaNorth AmericaNorth MacedoniaNorthern AfricaNorthern EuropeNorwayOceaniaPakistanPanamaPeruPhilippinesPolandPortugalRomaniaRussiaSaudi ArabiaScotlandSenegalSerbiaSierra LeoneSingaporeSomaliaSouth AfricaSouth AmericaSouth Central AsiaSouth Eastern AsiaSouthern EuropeSpainSri LankaSt. Vincent and the GrenadinesSudanSwedenSwitzerlandSyriaTaiwanThailandTrinidad and TobagoTurkeyUgandaUkraineUruguayUzbekistanVenezuelaVietnamWest IndiesWestern AfricaWestern AsiaWestern EuropeZaireZimbabweAzores
Immigrants from Yemen
Race
Ancestry
AfghanAfricanAlaska NativeAlaskan AthabascanAlbanianAleutAlsatianAmericanApacheArabArapahoArgentineanArmenianAssyrian/Chaldean/SyriacAustralianAustrianBahamianBangladeshiBarbadianBasqueBelgianBelizeanBermudanBhutaneseBlackfeetBolivianBrazilianBritishBritish West IndianBulgarianBurmeseCajunCambodianCanadianCape VerdeanCarpatho RusynCelticCentral AmericanCentral American IndianCherokeeCheyenneChickasawChileanChineseChippewaChoctawColombianColvilleComancheCosta RicanCreeCreekCroatianCrowCubanCypriotCzechoslovakianDanishDelawareDominicanDutchDutch West IndianEastern EuropeanEcuadorianEgyptianEnglishEstonianEthiopianEuropeanFijianFilipinoFinnishFrenchFrench American IndianFrench CanadianGermanGerman RussianGhanaianGreekGuamanian/ChamorroGuatemalanGuyaneseHaitianHmongHonduranHopiHoumaHungarianIcelanderIndian (Asian)IndonesianInupiatIranianIraqiIrishIroquoisIsraeliItalianJamaicanJapaneseJordanianKenyanKiowaKoreanLaotianLatvianLebaneseLiberianLithuanianLumbeeLuxembourgerMacedonianMalaysianMalteseMarshalleseMenomineeMexicanMexican American IndianMongolianMoroccanNative HawaiianNavajoNepaleseNew ZealanderNicaraguanNigerianNorthern EuropeanNorwegianOkinawanOsageOttawaPaiutePakistaniPalestinianPanamanianParaguayanPennsylvania GermanPeruvianPimaPolishPortuguesePotawatomiPuebloPuerto RicanPuget Sound SalishRomanianRussianSalvadoranSamoanScandinavianScotch-IrishScottishSeminoleSenegaleseSerbianShoshoneSierra LeoneanSiouxSlavicSlovakSloveneSomaliSouth AfricanSouth AmericanSouth American IndianSoviet UnionSpaniardSpanishSpanish AmericanSpanish American IndianSri LankanSubsaharan AfricanSudaneseSwedishSwissSyrianTaiwaneseThaiTlingit-HaidaTohono O'OdhamTonganTrinidadian and TobagonianTsimshianTurkishU.S. Virgin IslanderUgandanUkrainianUruguayanUteVenezuelanVietnameseWelshWest IndianYakamaYaquiYugoslavianYumanYup'ikZimbabwean
Immigration
NonimmigrantsImmigrantsAfghanistanAfricaAlbaniaArgentinaArmeniaAsiaAustraliaAustriaBahamasBangladeshBarbadosBelarusBelgiumBelizeBoliviaBosnia and HerzegovinaBrazilBulgariaBurma/MyanmarCabo VerdeCambodiaCameroonCanadaCaribbeanCentral AmericaChileChinaColombiaCongoCosta RicaCroatiaCubaCzechoslovakiaDenmarkDominicaDominican RepublicEastern AfricaEastern AsiaEastern EuropeEcuadorEgyptEl SalvadorEnglandEritreaEthiopiaEuropeFijiFranceGermanyGhanaGreeceGrenadaGuatemalaGuyanaHaitiHondurasHong KongHungaryIndiaIndonesiaIranIraqIrelandIsraelItalyJamaicaJapanJordanKazakhstanKenyaKoreaKuwaitLaosLatin AmericaLatviaLebanonLiberiaLithuaniaMalaysiaMexicoMicronesiaMiddle AfricaMoldovaMoroccoNepalNetherlandsNicaraguaNigeriaNorth AmericaNorth MacedoniaNorthern AfricaNorthern EuropeNorwayOceaniaPakistanPanamaPeruPhilippinesPolandPortugalRomaniaRussiaSaudi ArabiaScotlandSenegalSerbiaSierra LeoneSingaporeSomaliaSouth AfricaSouth AmericaSouth Central AsiaSouth Eastern AsiaSouthern EuropeSpainSri LankaSt. Vincent and the GrenadinesSudanSwedenSwitzerlandSyriaTaiwanThailandTrinidad and TobagoTurkeyUgandaUkraineUruguayUzbekistanVenezuelaVietnamWest IndiesWestern AfricaWestern AsiaWestern EuropeYemenZaireZimbabweAzores
GED/Equivalency
Income
Poverty
Unemployment
Labor Participation
Family Structure
Vehicle Availability
Education Level
Disability

GED/Equivalency Comparison

Czechs

Immigrants from Yemen

Exceptional
Tragic
88.1%
GED/EQUIVALENCY
99.5/ 100
METRIC RATING
45th/ 347
METRIC RANK
77.9%
GED/EQUIVALENCY
0.0/ 100
METRIC RATING
337th/ 347
METRIC RANK

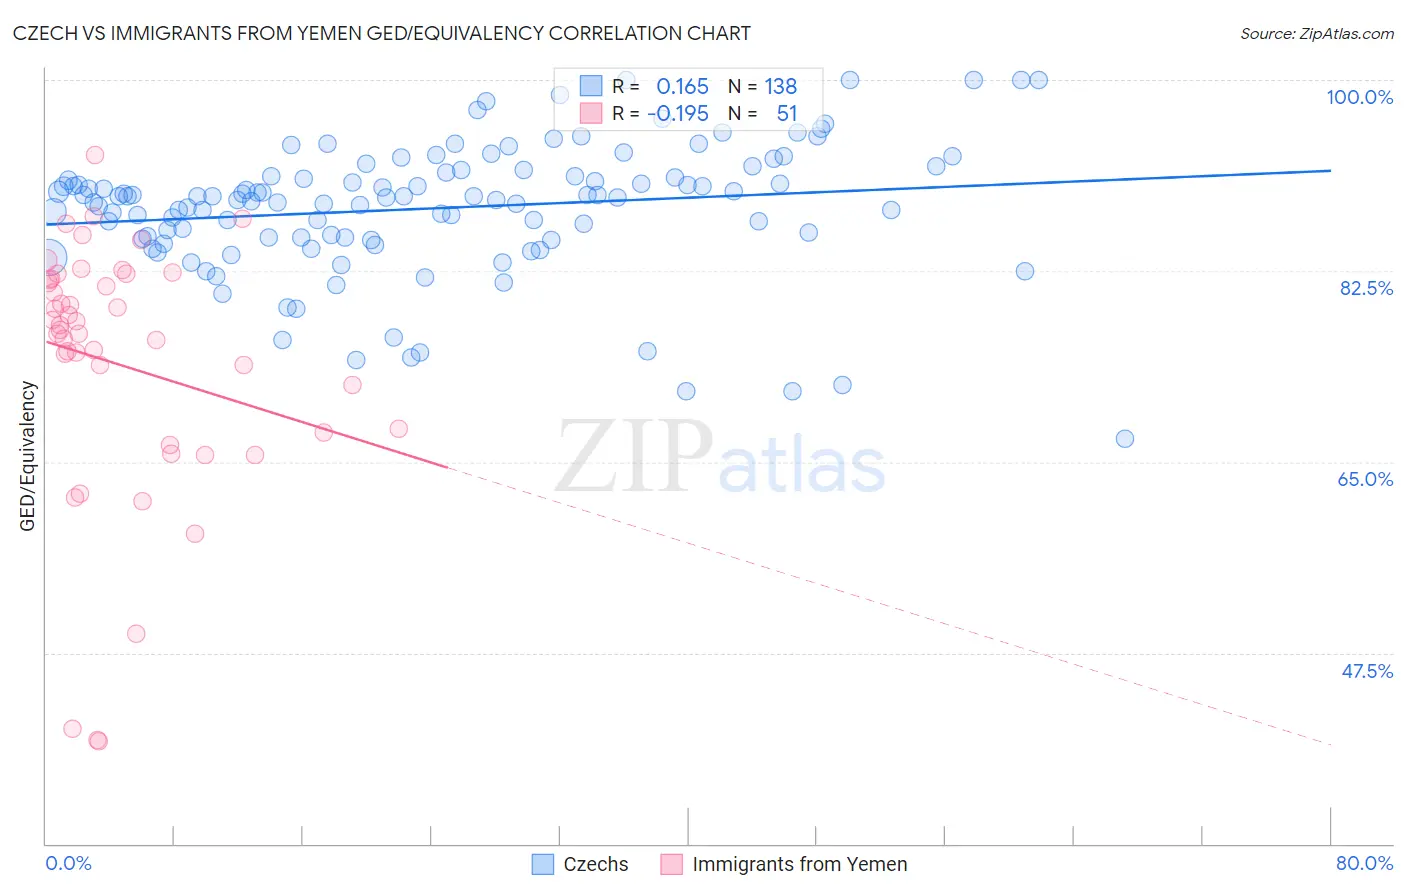
Czech vs Immigrants from Yemen GED/Equivalency Correlation Chart

The statistical analysis conducted on geographies consisting of 484,813,898 people shows a poor positive correlation between the proportion of Czechs and percentage of population with at least ged/equivalency education in the United States with a correlation coefficient (R) of 0.165 and weighted average of 88.1%. Similarly, the statistical analysis conducted on geographies consisting of 82,433,611 people shows a poor negative correlation between the proportion of Immigrants from Yemen and percentage of population with at least ged/equivalency education in the United States with a correlation coefficient (R) of -0.195 and weighted average of 77.9%, a difference of 13.0%.
Czech vs Immigrants from Yemen GED/Equivalency

GED/Equivalency Correlation Summary

MeasurementCzechImmigrants from Yemen
Minimum67.2%39.4%
Maximum100.0%93.1%
Range32.8%53.7%
Mean88.2%73.9%
Median89.3%77.0%
Interquartile 25% (IQ1)85.5%67.7%
Interquartile 75% (IQ3)91.2%81.8%
Interquartile Range (IQR)5.7%14.1%
Standard Deviation (Sample)6.0%12.0%
Standard Deviation (Population)6.0%11.9%

Similar Demographics by GED/Equivalency

Demographics Similar to Czechs by GED/Equivalency

In terms of ged/equivalency, the demographic groups most similar to Czechs are Immigrants from Switzerland (88.1%, a difference of 0.020%), Immigrants from Latvia (88.1%, a difference of 0.030%), Greek (88.1%, a difference of 0.030%), Macedonian (88.1%, a difference of 0.040%), and Australian (88.1%, a difference of 0.040%).
DemographicsRating | RankGED/Equivalency
Burmese
99.7
/100
|
#38
Exceptional
88.3%
Immigrants | Israel
99.6
/100
|
#39
Exceptional
88.2%
Italians
99.6
/100
|
#40
Exceptional
88.2%
Finns
99.6
/100
|
#41
Exceptional
88.2%
Cambodians
99.6
/100
|
#42
Exceptional
88.2%
Immigrants | Scotland
99.6
/100
|
#43
Exceptional
88.2%
Macedonians
99.5
/100
|
#44
Exceptional
88.1%
Czechs
99.5
/100
|
#45
Exceptional
88.1%
Immigrants | Switzerland
99.5
/100
|
#46
Exceptional
88.1%
Immigrants | Latvia
99.5
/100
|
#47
Exceptional
88.1%
Greeks
99.5
/100
|
#48
Exceptional
88.1%
Australians
99.5
/100
|
#49
Exceptional
88.1%
Immigrants | Korea
99.5
/100
|
#50
Exceptional
88.1%
Immigrants | Netherlands
99.4
/100
|
#51
Exceptional
88.0%
Zimbabweans
99.4
/100
|
#52
Exceptional
88.0%

Demographics Similar to Immigrants from Yemen by GED/Equivalency

In terms of ged/equivalency, the demographic groups most similar to Immigrants from Yemen are Immigrants from Guatemala (77.9%, a difference of 0.020%), Immigrants from Dominican Republic (78.0%, a difference of 0.060%), Immigrants from El Salvador (77.6%, a difference of 0.41%), Tohono O'odham (77.5%, a difference of 0.56%), and Mexican (77.4%, a difference of 0.65%).
DemographicsRating | RankGED/Equivalency
Immigrants | Cabo Verde
0.0
/100
|
#330
Tragic
78.9%
Immigrants | Honduras
0.0
/100
|
#331
Tragic
78.7%
Immigrants | Azores
0.0
/100
|
#332
Tragic
78.7%
Salvadorans
0.0
/100
|
#333
Tragic
78.6%
Guatemalans
0.0
/100
|
#334
Tragic
78.5%
Immigrants | Latin America
0.0
/100
|
#335
Tragic
78.5%
Immigrants | Dominican Republic
0.0
/100
|
#336
Tragic
78.0%
Immigrants | Yemen
0.0
/100
|
#337
Tragic
77.9%
Immigrants | Guatemala
0.0
/100
|
#338
Tragic
77.9%
Immigrants | El Salvador
0.0
/100
|
#339
Tragic
77.6%
Tohono O'odham
0.0
/100
|
#340
Tragic
77.5%
Mexicans
0.0
/100
|
#341
Tragic
77.4%
Pima
0.0
/100
|
#342
Tragic
76.4%
Immigrants | Central America
0.0
/100
|
#343
Tragic
76.4%
Spanish American Indians
0.0
/100
|
#344
Tragic
76.3%