Cuban vs Immigrants from Eastern Asia College, Under 1 year

COMPARE

Cuban
Race
Ancestry
AfghanAfricanAlaska NativeAlaskan AthabascanAlbanianAleutAlsatianAmericanApacheArabArapahoArgentineanArmenianAssyrian/Chaldean/SyriacAustralianAustrianBahamianBangladeshiBarbadianBasqueBelgianBelizeanBermudanBhutaneseBlackfeetBolivianBrazilianBritishBritish West IndianBulgarianBurmeseCajunCambodianCanadianCape VerdeanCarpatho RusynCelticCentral AmericanCentral American IndianCherokeeCheyenneChickasawChileanChineseChippewaChoctawColombianColvilleComancheCosta RicanCreeCreekCroatianCrowCubanCypriotCzechCzechoslovakianDanishDelawareDominicanDutchDutch West IndianEastern EuropeanEcuadorianEgyptianEnglishEstonianEthiopianEuropeanFijianFilipinoFinnishFrenchFrench American IndianFrench CanadianGermanGerman RussianGhanaianGreekGuamanian/ChamorroGuatemalanGuyaneseHaitianHmongHonduranHopiHoumaHungarianIcelanderIndian (Asian)IndonesianInupiatIranianIraqiIrishIroquoisIsraeliItalianJamaicanJapaneseJordanianKenyanKiowaKoreanLaotianLatvianLebaneseLiberianLithuanianLumbeeLuxembourgerMacedonianMalaysianMalteseMarshalleseMenomineeMexicanMexican American IndianMongolianMoroccanNative HawaiianNavajoNepaleseNew ZealanderNicaraguanNigerianNorthern EuropeanNorwegianOkinawanOsageOttawaPaiutePakistaniPalestinianPanamanianParaguayanPennsylvania GermanPeruvianPimaPolishPortuguesePotawatomiPuebloPuerto RicanPuget Sound SalishRomanianRussianSalvadoranSamoanScandinavianScotch-IrishScottishSeminoleSenegaleseSerbianShoshoneSierra LeoneanSiouxSlavicSlovakSloveneSomaliSouth AfricanSouth AmericanSouth American IndianSoviet UnionSpaniardSpanishSpanish AmericanSpanish American IndianSri LankanSubsaharan AfricanSudaneseSwedishSwissSyrianTaiwaneseThaiTlingit-HaidaTohono O'OdhamTonganTrinidadian and TobagonianTsimshianTurkishU.S. Virgin IslanderUgandanUkrainianUruguayanUteVenezuelanVietnameseWelshWest IndianYakamaYaquiYugoslavianYumanYup'ikZimbabwean
Immigration
NonimmigrantsImmigrantsAfghanistanAfricaAlbaniaArgentinaArmeniaAsiaAustraliaAustriaBahamasBangladeshBarbadosBelarusBelgiumBelizeBoliviaBosnia and HerzegovinaBrazilBulgariaBurma/MyanmarCabo VerdeCambodiaCameroonCanadaCaribbeanCentral AmericaChileChinaColombiaCongoCosta RicaCroatiaCubaCzechoslovakiaDenmarkDominicaDominican RepublicEastern AfricaEastern EuropeEcuadorEgyptEl SalvadorEnglandEritreaEthiopiaEuropeFijiFranceGermanyGhanaGreeceGrenadaGuatemalaGuyanaHaitiHondurasHong KongHungaryIndiaIndonesiaIranIraqIrelandIsraelItalyJamaicaJapanJordanKazakhstanKenyaKoreaKuwaitLaosLatin AmericaLatviaLebanonLiberiaLithuaniaMalaysiaMexicoMicronesiaMiddle AfricaMoldovaMoroccoNepalNetherlandsNicaraguaNigeriaNorth AmericaNorth MacedoniaNorthern AfricaNorthern EuropeNorwayOceaniaPakistanPanamaPeruPhilippinesPolandPortugalRomaniaRussiaSaudi ArabiaScotlandSenegalSerbiaSierra LeoneSingaporeSomaliaSouth AfricaSouth AmericaSouth Central AsiaSouth Eastern AsiaSouthern EuropeSpainSri LankaSt. Vincent and the GrenadinesSudanSwedenSwitzerlandSyriaTaiwanThailandTrinidad and TobagoTurkeyUgandaUkraineUruguayUzbekistanVenezuelaVietnamWest IndiesWestern AfricaWestern AsiaWestern EuropeYemenZaireZimbabweAzores
Immigrants from Eastern Asia
Race
Ancestry
AfghanAfricanAlaska NativeAlaskan AthabascanAlbanianAleutAlsatianAmericanApacheArabArapahoArgentineanArmenianAssyrian/Chaldean/SyriacAustralianAustrianBahamianBangladeshiBarbadianBasqueBelgianBelizeanBermudanBhutaneseBlackfeetBolivianBrazilianBritishBritish West IndianBulgarianBurmeseCajunCambodianCanadianCape VerdeanCarpatho RusynCelticCentral AmericanCentral American IndianCherokeeCheyenneChickasawChileanChineseChippewaChoctawColombianColvilleComancheCosta RicanCreeCreekCroatianCrowCypriotCzechCzechoslovakianDanishDelawareDominicanDutchDutch West IndianEastern EuropeanEcuadorianEgyptianEnglishEstonianEthiopianEuropeanFijianFilipinoFinnishFrenchFrench American IndianFrench CanadianGermanGerman RussianGhanaianGreekGuamanian/ChamorroGuatemalanGuyaneseHaitianHmongHonduranHopiHoumaHungarianIcelanderIndian (Asian)IndonesianInupiatIranianIraqiIrishIroquoisIsraeliItalianJamaicanJapaneseJordanianKenyanKiowaKoreanLaotianLatvianLebaneseLiberianLithuanianLumbeeLuxembourgerMacedonianMalaysianMalteseMarshalleseMenomineeMexicanMexican American IndianMongolianMoroccanNative HawaiianNavajoNepaleseNew ZealanderNicaraguanNigerianNorthern EuropeanNorwegianOkinawanOsageOttawaPaiutePakistaniPalestinianPanamanianParaguayanPennsylvania GermanPeruvianPimaPolishPortuguesePotawatomiPuebloPuerto RicanPuget Sound SalishRomanianRussianSalvadoranSamoanScandinavianScotch-IrishScottishSeminoleSenegaleseSerbianShoshoneSierra LeoneanSiouxSlavicSlovakSloveneSomaliSouth AfricanSouth AmericanSouth American IndianSoviet UnionSpaniardSpanishSpanish AmericanSpanish American IndianSri LankanSubsaharan AfricanSudaneseSwedishSwissSyrianTaiwaneseThaiTlingit-HaidaTohono O'OdhamTonganTrinidadian and TobagonianTsimshianTurkishU.S. Virgin IslanderUgandanUkrainianUruguayanUteVenezuelanVietnameseWelshWest IndianYakamaYaquiYugoslavianYumanYup'ikZimbabwean
Immigration
NonimmigrantsImmigrantsAfghanistanAfricaAlbaniaArgentinaArmeniaAsiaAustraliaAustriaBahamasBangladeshBarbadosBelarusBelgiumBelizeBoliviaBosnia and HerzegovinaBrazilBulgariaBurma/MyanmarCabo VerdeCambodiaCameroonCanadaCaribbeanCentral AmericaChileChinaColombiaCongoCosta RicaCroatiaCubaCzechoslovakiaDenmarkDominicaDominican RepublicEastern AfricaEastern AsiaEastern EuropeEcuadorEgyptEl SalvadorEnglandEritreaEthiopiaEuropeFijiFranceGermanyGhanaGreeceGrenadaGuatemalaGuyanaHaitiHondurasHong KongHungaryIndiaIndonesiaIranIraqIrelandIsraelItalyJamaicaJapanJordanKazakhstanKenyaKoreaKuwaitLaosLatin AmericaLatviaLebanonLiberiaLithuaniaMalaysiaMexicoMicronesiaMiddle AfricaMoldovaMoroccoNepalNetherlandsNicaraguaNigeriaNorth AmericaNorth MacedoniaNorthern AfricaNorthern EuropeNorwayOceaniaPakistanPanamaPeruPhilippinesPolandPortugalRomaniaRussiaSaudi ArabiaScotlandSenegalSerbiaSierra LeoneSingaporeSomaliaSouth AfricaSouth AmericaSouth Central AsiaSouth Eastern AsiaSouthern EuropeSpainSri LankaSt. Vincent and the GrenadinesSudanSwedenSwitzerlandSyriaTaiwanThailandTrinidad and TobagoTurkeyUgandaUkraineUruguayUzbekistanVenezuelaVietnamWest IndiesWestern AfricaWestern AsiaWestern EuropeYemenZaireZimbabweAzores
College, Under 1 year
Income
Poverty
Unemployment
Labor Participation
Family Structure
Vehicle Availability
Education Level
Disability

College, Under 1 year Comparison

Cubans

Immigrants from Eastern Asia

Tragic
Exceptional
58.6%
COLLEGE, UNDER 1 YEAR
0.0/ 100
METRIC RATING
299th/ 347
METRIC RANK
71.3%
COLLEGE, UNDER 1 YEAR
100.0/ 100
METRIC RATING
22nd/ 347
METRIC RANK

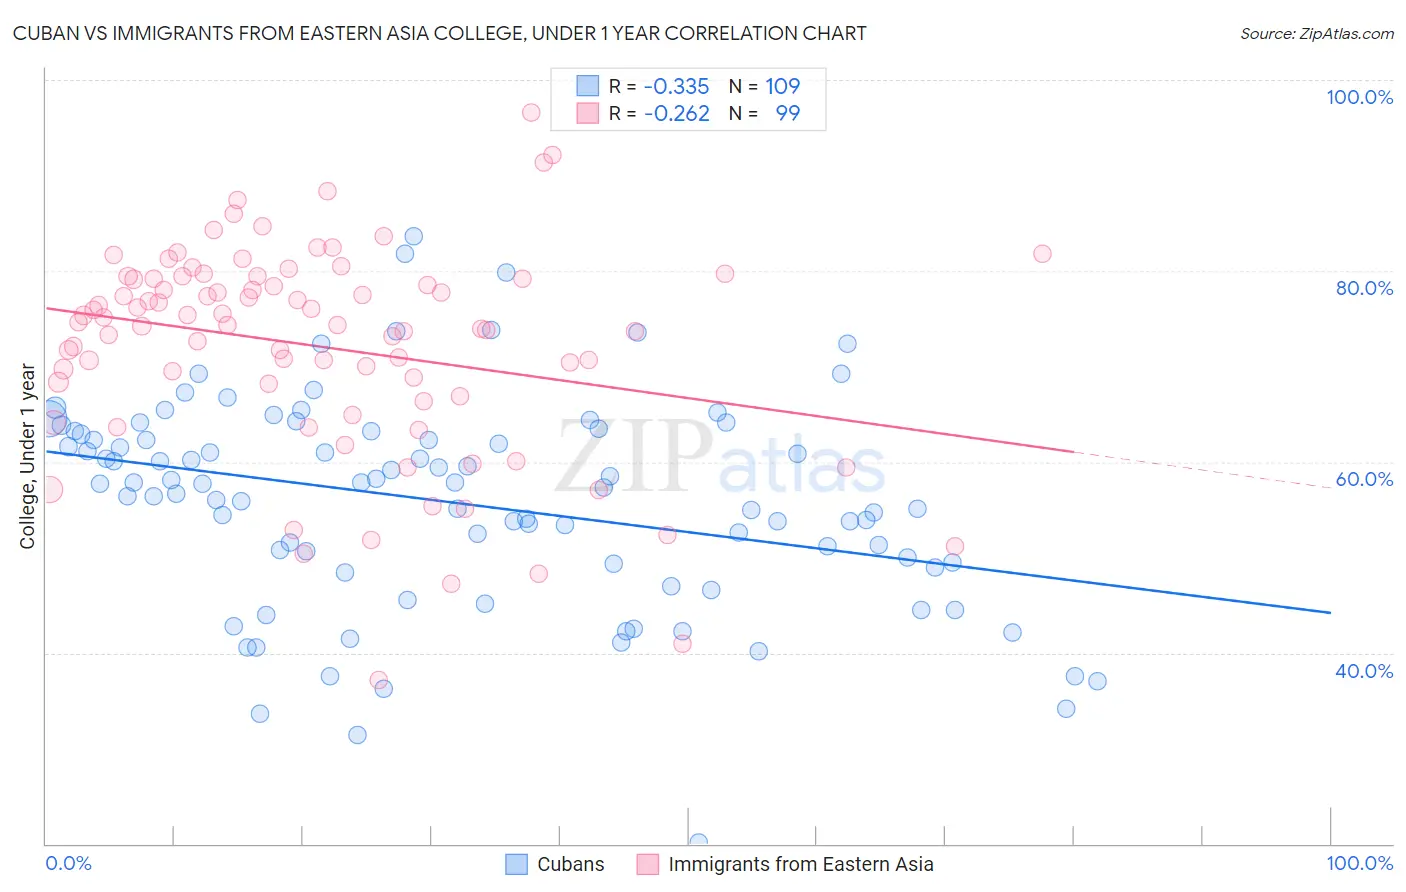
Cuban vs Immigrants from Eastern Asia College, Under 1 year Correlation Chart

The statistical analysis conducted on geographies consisting of 449,373,028 people shows a mild negative correlation between the proportion of Cubans and percentage of population with at least college, under 1 year education in the United States with a correlation coefficient (R) of -0.335 and weighted average of 58.6%. Similarly, the statistical analysis conducted on geographies consisting of 499,935,420 people shows a weak negative correlation between the proportion of Immigrants from Eastern Asia and percentage of population with at least college, under 1 year education in the United States with a correlation coefficient (R) of -0.262 and weighted average of 71.3%, a difference of 21.5%.
Cuban vs Immigrants from Eastern Asia College, Under 1 year

College, Under 1 year Correlation Summary

MeasurementCubanImmigrants from Eastern Asia
Minimum20.1%37.2%
Maximum83.6%96.6%
Range63.5%59.5%
Mean55.7%72.1%
Median57.3%74.4%
Interquartile 25% (IQ1)49.1%66.9%
Interquartile 75% (IQ3)63.0%79.2%
Interquartile Range (IQR)13.9%12.4%
Standard Deviation (Sample)11.1%11.1%
Standard Deviation (Population)11.1%11.0%

Similar Demographics by College, Under 1 year

Demographics Similar to Cubans by College, Under 1 year

In terms of college, under 1 year, the demographic groups most similar to Cubans are Immigrants from Ecuador (58.7%, a difference of 0.13%), Immigrants from Guyana (58.5%, a difference of 0.26%), Guyanese (59.0%, a difference of 0.63%), Central American Indian (59.0%, a difference of 0.68%), and Immigrants from Grenada (59.1%, a difference of 0.72%).
DemographicsRating | RankCollege, Under 1 year
Nicaraguans
0.0
/100
|
#292
Tragic
59.2%
Seminole
0.0
/100
|
#293
Tragic
59.1%
Immigrants | Belize
0.0
/100
|
#294
Tragic
59.1%
Immigrants | Grenada
0.0
/100
|
#295
Tragic
59.1%
Central American Indians
0.0
/100
|
#296
Tragic
59.0%
Guyanese
0.0
/100
|
#297
Tragic
59.0%
Immigrants | Ecuador
0.0
/100
|
#298
Tragic
58.7%
Cubans
0.0
/100
|
#299
Tragic
58.6%
Immigrants | Guyana
0.0
/100
|
#300
Tragic
58.5%
Mexican American Indians
0.0
/100
|
#301
Tragic
58.1%
Apache
0.0
/100
|
#302
Tragic
58.0%
Immigrants | Dominica
0.0
/100
|
#303
Tragic
57.9%
Kiowa
0.0
/100
|
#304
Tragic
57.8%
Haitians
0.0
/100
|
#305
Tragic
57.8%
Immigrants | Portugal
0.0
/100
|
#306
Tragic
57.7%

Demographics Similar to Immigrants from Eastern Asia by College, Under 1 year

In terms of college, under 1 year, the demographic groups most similar to Immigrants from Eastern Asia are Immigrants from Northern Europe (71.1%, a difference of 0.23%), Soviet Union (71.1%, a difference of 0.24%), Immigrants from Belgium (71.5%, a difference of 0.25%), Bulgarian (71.1%, a difference of 0.25%), and Immigrants from Denmark (71.0%, a difference of 0.37%).
DemographicsRating | RankCollege, Under 1 year
Burmese
100.0
/100
|
#15
Exceptional
71.9%
Immigrants | Japan
100.0
/100
|
#16
Exceptional
71.9%
Eastern Europeans
100.0
/100
|
#17
Exceptional
71.8%
Immigrants | Switzerland
100.0
/100
|
#18
Exceptional
71.7%
Latvians
100.0
/100
|
#19
Exceptional
71.6%
Immigrants | Korea
100.0
/100
|
#20
Exceptional
71.6%
Immigrants | Belgium
100.0
/100
|
#21
Exceptional
71.5%
Immigrants | Eastern Asia
100.0
/100
|
#22
Exceptional
71.3%
Immigrants | Northern Europe
100.0
/100
|
#23
Exceptional
71.1%
Soviet Union
100.0
/100
|
#24
Exceptional
71.1%
Bulgarians
100.0
/100
|
#25
Exceptional
71.1%
Immigrants | Denmark
100.0
/100
|
#26
Exceptional
71.0%
Immigrants | Ireland
100.0
/100
|
#27
Exceptional
71.0%
Immigrants | Hong Kong
100.0
/100
|
#28
Exceptional
71.0%
Immigrants | France
100.0
/100
|
#29
Exceptional
71.0%