Bulgarian vs Sierra Leonean College, 1 year or more

COMPARE

Bulgarian
Race
Ancestry
AfghanAfricanAlaska NativeAlaskan AthabascanAlbanianAleutAlsatianAmericanApacheArabArapahoArgentineanArmenianAssyrian/Chaldean/SyriacAustralianAustrianBahamianBangladeshiBarbadianBasqueBelgianBelizeanBermudanBhutaneseBlackfeetBolivianBrazilianBritishBritish West IndianBulgarianBurmeseCajunCambodianCanadianCape VerdeanCarpatho RusynCelticCentral AmericanCentral American IndianCherokeeCheyenneChickasawChileanChineseChippewaChoctawColombianColvilleComancheCosta RicanCreeCreekCroatianCrowCubanCypriotCzechCzechoslovakianDanishDelawareDominicanDutchDutch West IndianEastern EuropeanEcuadorianEgyptianEnglishEstonianEthiopianEuropeanFijianFilipinoFinnishFrenchFrench American IndianFrench CanadianGermanGerman RussianGhanaianGreekGuamanian/ChamorroGuatemalanGuyaneseHaitianHmongHonduranHopiHoumaHungarianIcelanderIndian (Asian)IndonesianInupiatIranianIraqiIrishIroquoisIsraeliItalianJamaicanJapaneseJordanianKenyanKiowaKoreanLaotianLatvianLebaneseLiberianLithuanianLumbeeLuxembourgerMacedonianMalaysianMalteseMarshalleseMenomineeMexicanMexican American IndianMongolianMoroccanNative HawaiianNavajoNepaleseNew ZealanderNicaraguanNigerianNorthern EuropeanNorwegianOkinawanOsageOttawaPaiutePakistaniPalestinianPanamanianParaguayanPennsylvania GermanPeruvianPimaPolishPortuguesePotawatomiPuebloPuerto RicanPuget Sound SalishRomanianRussianSalvadoranSamoanScandinavianScotch-IrishScottishSeminoleSenegaleseSerbianShoshoneSiouxSlavicSlovakSloveneSomaliSouth AfricanSouth AmericanSouth American IndianSoviet UnionSpaniardSpanishSpanish AmericanSpanish American IndianSri LankanSubsaharan AfricanSudaneseSwedishSwissSyrianTaiwaneseThaiTlingit-HaidaTohono O'OdhamTonganTrinidadian and TobagonianTsimshianTurkishU.S. Virgin IslanderUgandanUkrainianUruguayanUteVenezuelanVietnameseWelshWest IndianYakamaYaquiYugoslavianYumanYup'ikZimbabwean
Immigration
NonimmigrantsImmigrantsAfghanistanAfricaAlbaniaArgentinaArmeniaAsiaAustraliaAustriaBahamasBangladeshBarbadosBelarusBelgiumBelizeBoliviaBosnia and HerzegovinaBrazilBulgariaBurma/MyanmarCabo VerdeCambodiaCameroonCanadaCaribbeanCentral AmericaChileChinaColombiaCongoCosta RicaCroatiaCubaCzechoslovakiaDenmarkDominicaDominican RepublicEastern AfricaEastern AsiaEastern EuropeEcuadorEgyptEl SalvadorEnglandEritreaEthiopiaEuropeFijiFranceGermanyGhanaGreeceGrenadaGuatemalaGuyanaHaitiHondurasHong KongHungaryIndiaIndonesiaIranIraqIrelandIsraelItalyJamaicaJapanJordanKazakhstanKenyaKoreaKuwaitLaosLatin AmericaLatviaLebanonLiberiaLithuaniaMalaysiaMexicoMicronesiaMiddle AfricaMoldovaMoroccoNepalNetherlandsNicaraguaNigeriaNorth AmericaNorth MacedoniaNorthern AfricaNorthern EuropeNorwayOceaniaPakistanPanamaPeruPhilippinesPolandPortugalRomaniaRussiaSaudi ArabiaScotlandSenegalSerbiaSierra LeoneSingaporeSomaliaSouth AfricaSouth AmericaSouth Central AsiaSouth Eastern AsiaSouthern EuropeSpainSri LankaSt. Vincent and the GrenadinesSudanSwedenSwitzerlandSyriaTaiwanThailandTrinidad and TobagoTurkeyUgandaUkraineUruguayUzbekistanVenezuelaVietnamWest IndiesWestern AfricaWestern AsiaWestern EuropeYemenZaireZimbabweAzores
Sierra Leonean
Race
Ancestry
AfghanAfricanAlaska NativeAlaskan AthabascanAlbanianAleutAlsatianAmericanApacheArabArapahoArgentineanArmenianAssyrian/Chaldean/SyriacAustralianAustrianBahamianBangladeshiBarbadianBasqueBelgianBelizeanBermudanBhutaneseBlackfeetBolivianBrazilianBritishBritish West IndianBurmeseCajunCambodianCanadianCape VerdeanCarpatho RusynCelticCentral AmericanCentral American IndianCherokeeCheyenneChickasawChileanChineseChippewaChoctawColombianColvilleComancheCosta RicanCreeCreekCroatianCrowCubanCypriotCzechCzechoslovakianDanishDelawareDominicanDutchDutch West IndianEastern EuropeanEcuadorianEgyptianEnglishEstonianEthiopianEuropeanFijianFilipinoFinnishFrenchFrench American IndianFrench CanadianGermanGerman RussianGhanaianGreekGuamanian/ChamorroGuatemalanGuyaneseHaitianHmongHonduranHopiHoumaHungarianIcelanderIndian (Asian)IndonesianInupiatIranianIraqiIrishIroquoisIsraeliItalianJamaicanJapaneseJordanianKenyanKiowaKoreanLaotianLatvianLebaneseLiberianLithuanianLumbeeLuxembourgerMacedonianMalaysianMalteseMarshalleseMenomineeMexicanMexican American IndianMongolianMoroccanNative HawaiianNavajoNepaleseNew ZealanderNicaraguanNigerianNorthern EuropeanNorwegianOkinawanOsageOttawaPaiutePakistaniPalestinianPanamanianParaguayanPennsylvania GermanPeruvianPimaPolishPortuguesePotawatomiPuebloPuerto RicanPuget Sound SalishRomanianRussianSalvadoranSamoanScandinavianScotch-IrishScottishSeminoleSenegaleseSerbianShoshoneSierra LeoneanSiouxSlavicSlovakSloveneSomaliSouth AfricanSouth AmericanSouth American IndianSoviet UnionSpaniardSpanishSpanish AmericanSpanish American IndianSri LankanSubsaharan AfricanSudaneseSwedishSwissSyrianTaiwaneseThaiTlingit-HaidaTohono O'OdhamTonganTrinidadian and TobagonianTsimshianTurkishU.S. Virgin IslanderUgandanUkrainianUruguayanUteVenezuelanVietnameseWelshWest IndianYakamaYaquiYugoslavianYumanYup'ikZimbabwean
Immigration
NonimmigrantsImmigrantsAfghanistanAfricaAlbaniaArgentinaArmeniaAsiaAustraliaAustriaBahamasBangladeshBarbadosBelarusBelgiumBelizeBoliviaBosnia and HerzegovinaBrazilBulgariaBurma/MyanmarCabo VerdeCambodiaCameroonCanadaCaribbeanCentral AmericaChileChinaColombiaCongoCosta RicaCroatiaCubaCzechoslovakiaDenmarkDominicaDominican RepublicEastern AfricaEastern AsiaEastern EuropeEcuadorEgyptEl SalvadorEnglandEritreaEthiopiaEuropeFijiFranceGermanyGhanaGreeceGrenadaGuatemalaGuyanaHaitiHondurasHong KongHungaryIndiaIndonesiaIranIraqIrelandIsraelItalyJamaicaJapanJordanKazakhstanKenyaKoreaKuwaitLaosLatin AmericaLatviaLebanonLiberiaLithuaniaMalaysiaMexicoMicronesiaMiddle AfricaMoldovaMoroccoNepalNetherlandsNicaraguaNigeriaNorth AmericaNorth MacedoniaNorthern AfricaNorthern EuropeNorwayOceaniaPakistanPanamaPeruPhilippinesPolandPortugalRomaniaRussiaSaudi ArabiaScotlandSenegalSerbiaSierra LeoneSingaporeSomaliaSouth AfricaSouth AmericaSouth Central AsiaSouth Eastern AsiaSouthern EuropeSpainSri LankaSt. Vincent and the GrenadinesSudanSwedenSwitzerlandSyriaTaiwanThailandTrinidad and TobagoTurkeyUgandaUkraineUruguayUzbekistanVenezuelaVietnamWest IndiesWestern AfricaWestern AsiaWestern EuropeYemenZaireZimbabweAzores
College, 1 year or more
Income
Poverty
Unemployment
Labor Participation
Family Structure
Vehicle Availability
Education Level
Disability

College, 1 year or more Comparison

Bulgarians

Sierra Leoneans

Exceptional
Good
65.5%
COLLEGE, 1 YEAR OR MORE
100.0/ 100
METRIC RATING
32nd/ 347
METRIC RANK
60.2%
COLLEGE, 1 YEAR OR MORE
74.1/ 100
METRIC RATING
153rd/ 347
METRIC RANK

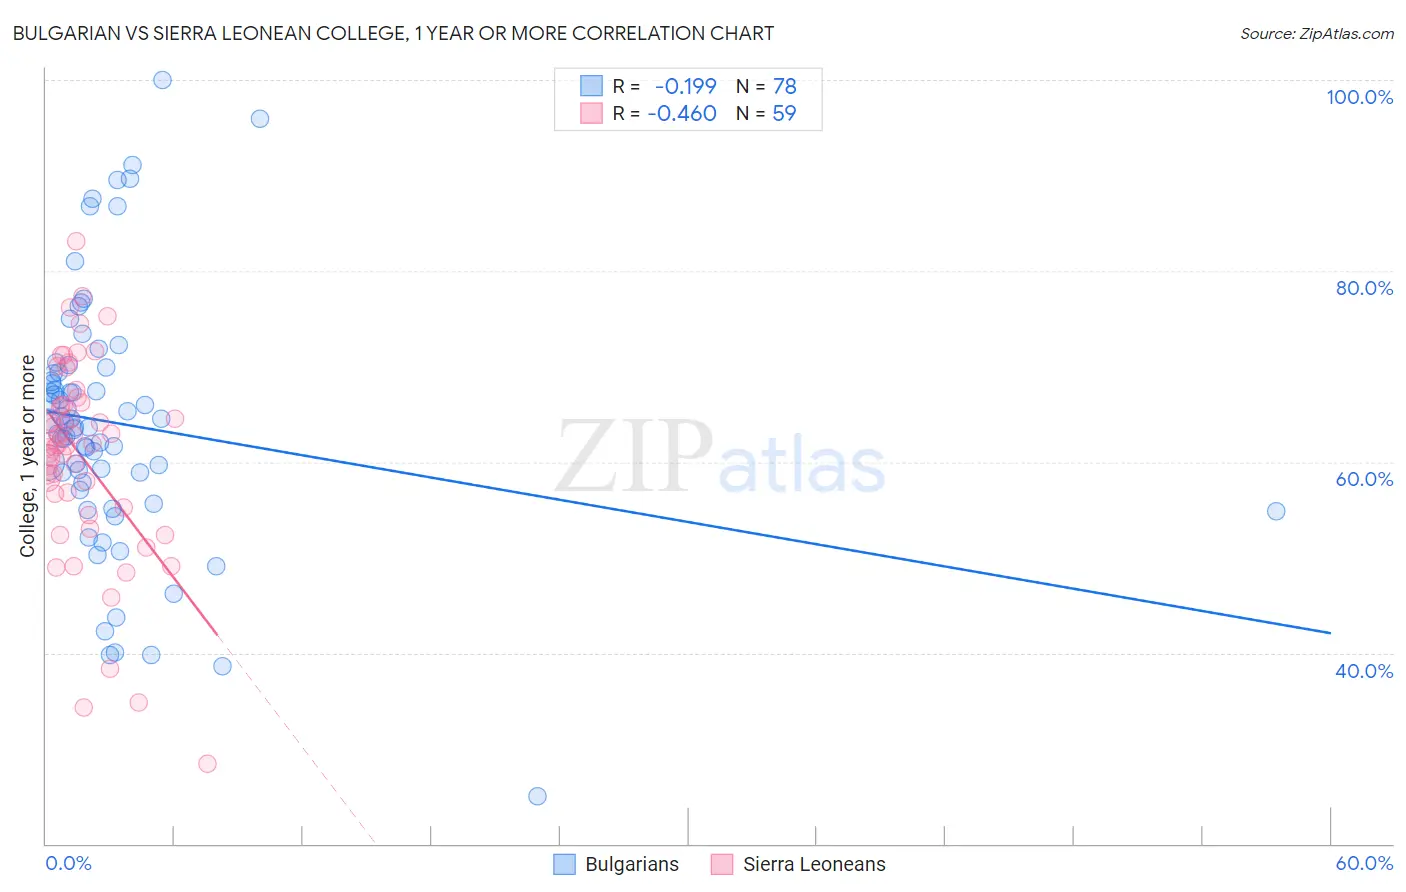
Bulgarian vs Sierra Leonean College, 1 year or more Correlation Chart

The statistical analysis conducted on geographies consisting of 205,631,725 people shows a poor negative correlation between the proportion of Bulgarians and percentage of population with at least college, 1 year or more education in the United States with a correlation coefficient (R) of -0.199 and weighted average of 65.5%. Similarly, the statistical analysis conducted on geographies consisting of 83,362,711 people shows a moderate negative correlation between the proportion of Sierra Leoneans and percentage of population with at least college, 1 year or more education in the United States with a correlation coefficient (R) of -0.460 and weighted average of 60.2%, a difference of 8.7%.
Bulgarian vs Sierra Leonean College, 1 year or more

College, 1 year or more Correlation Summary

MeasurementBulgarianSierra Leonean
Minimum25.0%28.4%
Maximum100.0%83.1%
Range75.0%54.7%
Mean64.0%60.5%
Median63.9%61.8%
Interquartile 25% (IQ1)57.8%55.2%
Interquartile 75% (IQ3)69.4%66.2%
Interquartile Range (IQR)11.5%11.0%
Standard Deviation (Sample)13.5%10.6%
Standard Deviation (Population)13.4%10.5%

Similar Demographics by College, 1 year or more

Demographics Similar to Bulgarians by College, 1 year or more

In terms of college, 1 year or more, the demographic groups most similar to Bulgarians are Turkish (65.5%, a difference of 0.050%), Immigrants from Denmark (65.6%, a difference of 0.13%), Immigrants from Sri Lanka (65.4%, a difference of 0.15%), Immigrants from Northern Europe (65.6%, a difference of 0.24%), and Israeli (65.3%, a difference of 0.27%).
DemographicsRating | RankCollege, 1 year or more
Indians (Asian)
100.0
/100
|
#25
Exceptional
66.1%
Latvians
100.0
/100
|
#26
Exceptional
66.1%
Immigrants | Ireland
100.0
/100
|
#27
Exceptional
65.9%
Immigrants | France
100.0
/100
|
#28
Exceptional
65.8%
Immigrants | Northern Europe
100.0
/100
|
#29
Exceptional
65.6%
Immigrants | Denmark
100.0
/100
|
#30
Exceptional
65.6%
Turks
100.0
/100
|
#31
Exceptional
65.5%
Bulgarians
100.0
/100
|
#32
Exceptional
65.5%
Immigrants | Sri Lanka
99.9
/100
|
#33
Exceptional
65.4%
Israelis
99.9
/100
|
#34
Exceptional
65.3%
Immigrants | Turkey
99.9
/100
|
#35
Exceptional
65.2%
Immigrants | South Africa
99.9
/100
|
#36
Exceptional
65.1%
Russians
99.9
/100
|
#37
Exceptional
65.1%
Immigrants | Saudi Arabia
99.9
/100
|
#38
Exceptional
65.0%
Estonians
99.9
/100
|
#39
Exceptional
65.0%

Demographics Similar to Sierra Leoneans by College, 1 year or more

In terms of college, 1 year or more, the demographic groups most similar to Sierra Leoneans are Sudanese (60.2%, a difference of 0.080%), Moroccan (60.2%, a difference of 0.080%), Finnish (60.2%, a difference of 0.080%), Immigrants from Germany (60.3%, a difference of 0.14%), and Immigrants from Sudan (60.4%, a difference of 0.27%).
DemographicsRating | RankCollege, 1 year or more
Scottish
80.2
/100
|
#146
Excellent
60.5%
Immigrants | Kenya
79.1
/100
|
#147
Good
60.5%
Kenyans
79.0
/100
|
#148
Good
60.5%
Brazilians
79.0
/100
|
#149
Good
60.5%
Immigrants | Sudan
77.8
/100
|
#150
Good
60.4%
Albanians
77.8
/100
|
#151
Good
60.4%
Immigrants | Germany
76.1
/100
|
#152
Good
60.3%
Sierra Leoneans
74.1
/100
|
#153
Good
60.2%
Sudanese
73.0
/100
|
#154
Good
60.2%
Moroccans
72.9
/100
|
#155
Good
60.2%
Finns
72.9
/100
|
#156
Good
60.2%
Immigrants | Armenia
68.8
/100
|
#157
Good
60.0%
English
67.2
/100
|
#158
Good
60.0%
Immigrants | Iraq
67.0
/100
|
#159
Good
60.0%
South American Indians
66.9
/100
|
#160
Good
60.0%