Assyrian/Chaldean/Syriac vs Immigrants from Northern Europe College, Under 1 year

COMPARE

Assyrian/Chaldean/Syriac
Race
Ancestry
AfghanAfricanAlaska NativeAlaskan AthabascanAlbanianAleutAlsatianAmericanApacheArabArapahoArgentineanArmenianAssyrian/Chaldean/SyriacAustralianAustrianBahamianBangladeshiBarbadianBasqueBelgianBelizeanBermudanBhutaneseBlackfeetBolivianBrazilianBritishBritish West IndianBulgarianBurmeseCajunCambodianCanadianCape VerdeanCarpatho RusynCelticCentral AmericanCentral American IndianCherokeeCheyenneChickasawChileanChineseChippewaChoctawColombianColvilleComancheCosta RicanCreeCreekCroatianCrowCubanCypriotCzechCzechoslovakianDanishDelawareDominicanDutchDutch West IndianEastern EuropeanEcuadorianEgyptianEnglishEstonianEthiopianEuropeanFijianFilipinoFinnishFrenchFrench American IndianFrench CanadianGermanGerman RussianGhanaianGreekGuamanian/ChamorroGuatemalanGuyaneseHaitianHmongHonduranHopiHoumaHungarianIcelanderIndian (Asian)IndonesianInupiatIranianIraqiIrishIroquoisIsraeliItalianJamaicanJapaneseJordanianKenyanKiowaKoreanLaotianLatvianLebaneseLiberianLithuanianLumbeeLuxembourgerMacedonianMalaysianMalteseMarshalleseMenomineeMexicanMexican American IndianMongolianMoroccanNative HawaiianNavajoNepaleseNew ZealanderNicaraguanNigerianNorthern EuropeanNorwegianOkinawanOsageOttawaPaiutePakistaniPalestinianPanamanianParaguayanPennsylvania GermanPeruvianPimaPolishPortuguesePotawatomiPuebloPuerto RicanPuget Sound SalishRomanianRussianSalvadoranSamoanScandinavianScotch-IrishScottishSeminoleSenegaleseSerbianShoshoneSierra LeoneanSiouxSlavicSlovakSloveneSomaliSouth AfricanSouth AmericanSouth American IndianSoviet UnionSpaniardSpanishSpanish AmericanSpanish American IndianSri LankanSubsaharan AfricanSudaneseSwedishSwissSyrianTaiwaneseThaiTlingit-HaidaTohono O'OdhamTonganTrinidadian and TobagonianTsimshianTurkishU.S. Virgin IslanderUgandanUkrainianUruguayanUteVenezuelanVietnameseWelshWest IndianYakamaYaquiYugoslavianYumanYup'ikZimbabwean
Immigration
NonimmigrantsImmigrantsAfghanistanAfricaAlbaniaArgentinaArmeniaAsiaAustraliaAustriaBahamasBangladeshBarbadosBelarusBelgiumBelizeBoliviaBosnia and HerzegovinaBrazilBulgariaBurma/MyanmarCabo VerdeCambodiaCameroonCanadaCaribbeanCentral AmericaChileChinaColombiaCongoCosta RicaCroatiaCubaCzechoslovakiaDenmarkDominicaDominican RepublicEastern AfricaEastern AsiaEastern EuropeEcuadorEgyptEl SalvadorEnglandEritreaEthiopiaEuropeFijiFranceGermanyGhanaGreeceGrenadaGuatemalaGuyanaHaitiHondurasHong KongHungaryIndiaIndonesiaIranIraqIrelandIsraelItalyJamaicaJapanJordanKazakhstanKenyaKoreaKuwaitLaosLatin AmericaLatviaLebanonLiberiaLithuaniaMalaysiaMexicoMicronesiaMiddle AfricaMoldovaMoroccoNepalNetherlandsNicaraguaNigeriaNorth AmericaNorth MacedoniaNorthern AfricaNorwayOceaniaPakistanPanamaPeruPhilippinesPolandPortugalRomaniaRussiaSaudi ArabiaScotlandSenegalSerbiaSierra LeoneSingaporeSomaliaSouth AfricaSouth AmericaSouth Central AsiaSouth Eastern AsiaSouthern EuropeSpainSri LankaSt. Vincent and the GrenadinesSudanSwedenSwitzerlandSyriaTaiwanThailandTrinidad and TobagoTurkeyUgandaUkraineUruguayUzbekistanVenezuelaVietnamWest IndiesWestern AfricaWestern AsiaWestern EuropeYemenZaireZimbabweAzores
Immigrants from Northern Europe
Race
Ancestry
AfghanAfricanAlaska NativeAlaskan AthabascanAlbanianAleutAlsatianAmericanApacheArabArapahoArgentineanArmenianAustralianAustrianBahamianBangladeshiBarbadianBasqueBelgianBelizeanBermudanBhutaneseBlackfeetBolivianBrazilianBritishBritish West IndianBulgarianBurmeseCajunCambodianCanadianCape VerdeanCarpatho RusynCelticCentral AmericanCentral American IndianCherokeeCheyenneChickasawChileanChineseChippewaChoctawColombianColvilleComancheCosta RicanCreeCreekCroatianCrowCubanCypriotCzechCzechoslovakianDanishDelawareDominicanDutchDutch West IndianEastern EuropeanEcuadorianEgyptianEnglishEstonianEthiopianEuropeanFijianFilipinoFinnishFrenchFrench American IndianFrench CanadianGermanGerman RussianGhanaianGreekGuamanian/ChamorroGuatemalanGuyaneseHaitianHmongHonduranHopiHoumaHungarianIcelanderIndian (Asian)IndonesianInupiatIranianIraqiIrishIroquoisIsraeliItalianJamaicanJapaneseJordanianKenyanKiowaKoreanLaotianLatvianLebaneseLiberianLithuanianLumbeeLuxembourgerMacedonianMalaysianMalteseMarshalleseMenomineeMexicanMexican American IndianMongolianMoroccanNative HawaiianNavajoNepaleseNew ZealanderNicaraguanNigerianNorthern EuropeanNorwegianOkinawanOsageOttawaPaiutePakistaniPalestinianPanamanianParaguayanPennsylvania GermanPeruvianPimaPolishPortuguesePotawatomiPuebloPuerto RicanPuget Sound SalishRomanianRussianSalvadoranSamoanScandinavianScotch-IrishScottishSeminoleSenegaleseSerbianShoshoneSierra LeoneanSiouxSlavicSlovakSloveneSomaliSouth AfricanSouth AmericanSouth American IndianSoviet UnionSpaniardSpanishSpanish AmericanSpanish American IndianSri LankanSubsaharan AfricanSudaneseSwedishSwissSyrianTaiwaneseThaiTlingit-HaidaTohono O'OdhamTonganTrinidadian and TobagonianTsimshianTurkishU.S. Virgin IslanderUgandanUkrainianUruguayanUteVenezuelanVietnameseWelshWest IndianYakamaYaquiYugoslavianYumanYup'ikZimbabwean
Immigration
NonimmigrantsImmigrantsAfghanistanAfricaAlbaniaArgentinaArmeniaAsiaAustraliaAustriaBahamasBangladeshBarbadosBelarusBelgiumBelizeBoliviaBosnia and HerzegovinaBrazilBulgariaBurma/MyanmarCabo VerdeCambodiaCameroonCanadaCaribbeanCentral AmericaChileChinaColombiaCongoCosta RicaCroatiaCubaCzechoslovakiaDenmarkDominicaDominican RepublicEastern AfricaEastern AsiaEastern EuropeEcuadorEgyptEl SalvadorEnglandEritreaEthiopiaEuropeFijiFranceGermanyGhanaGreeceGrenadaGuatemalaGuyanaHaitiHondurasHong KongHungaryIndiaIndonesiaIranIraqIrelandIsraelItalyJamaicaJapanJordanKazakhstanKenyaKoreaKuwaitLaosLatin AmericaLatviaLebanonLiberiaLithuaniaMalaysiaMexicoMicronesiaMiddle AfricaMoldovaMoroccoNepalNetherlandsNicaraguaNigeriaNorth AmericaNorth MacedoniaNorthern AfricaNorthern EuropeNorwayOceaniaPakistanPanamaPeruPhilippinesPolandPortugalRomaniaRussiaSaudi ArabiaScotlandSenegalSerbiaSierra LeoneSingaporeSomaliaSouth AfricaSouth AmericaSouth Central AsiaSouth Eastern AsiaSouthern EuropeSpainSri LankaSt. Vincent and the GrenadinesSudanSwedenSwitzerlandSyriaTaiwanThailandTrinidad and TobagoTurkeyUgandaUkraineUruguayUzbekistanVenezuelaVietnamWest IndiesWestern AfricaWestern AsiaWestern EuropeYemenZaireZimbabweAzores
College, Under 1 year
Income
Poverty
Unemployment
Labor Participation
Family Structure
Vehicle Availability
Education Level
Disability

College, Under 1 year Comparison

Assyrians/Chaldeans/Syriacs

Immigrants from Northern Europe

Exceptional
Exceptional
67.7%
COLLEGE, UNDER 1 YEAR
95.8/ 100
METRIC RATING
110th/ 347
METRIC RANK
71.1%
COLLEGE, UNDER 1 YEAR
100.0/ 100
METRIC RATING
23rd/ 347
METRIC RANK

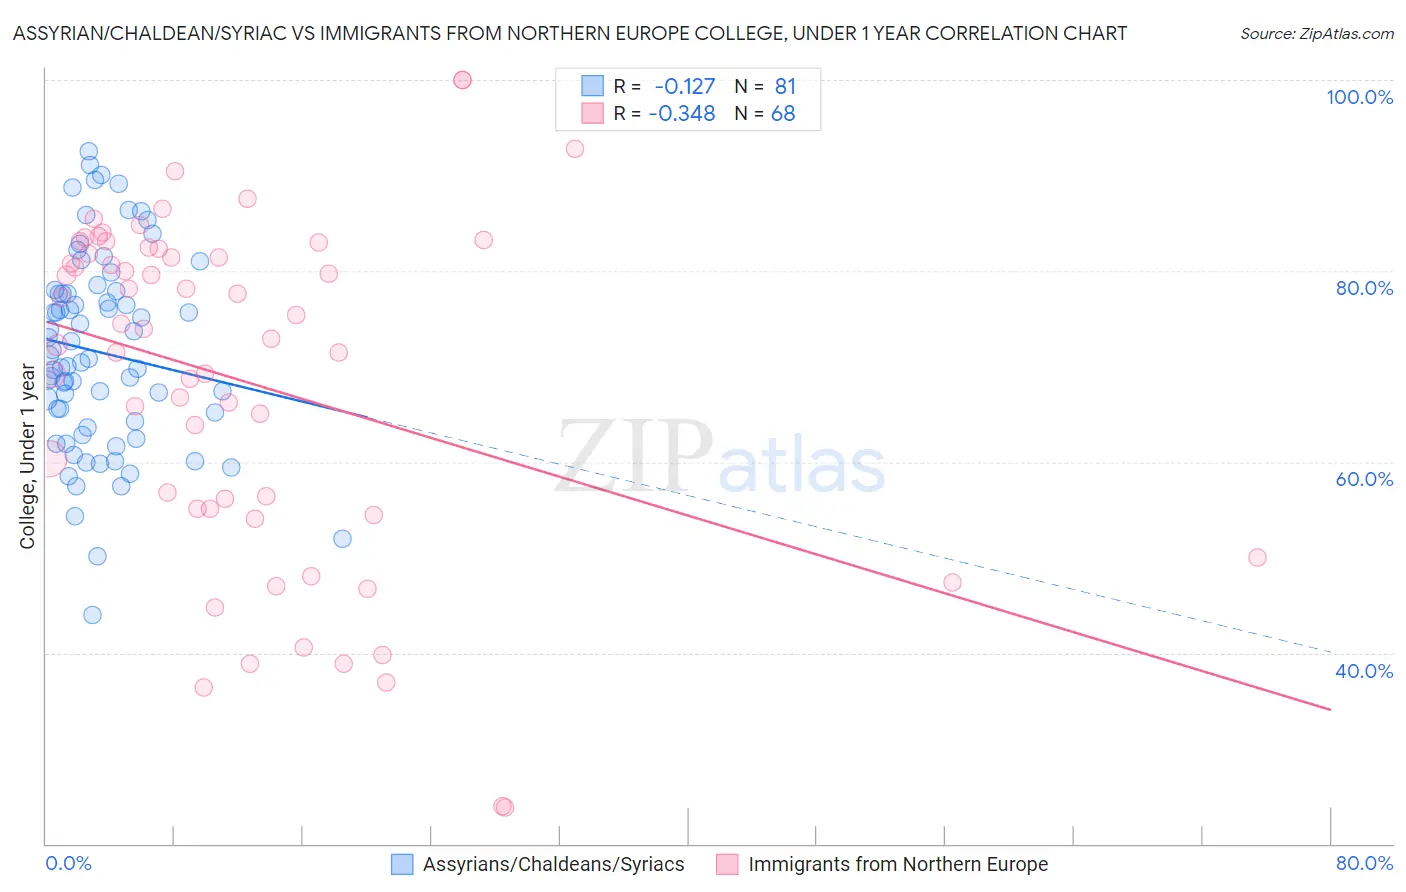
Assyrian/Chaldean/Syriac vs Immigrants from Northern Europe College, Under 1 year Correlation Chart

The statistical analysis conducted on geographies consisting of 110,318,304 people shows a poor negative correlation between the proportion of Assyrians/Chaldeans/Syriacs and percentage of population with at least college, under 1 year education in the United States with a correlation coefficient (R) of -0.127 and weighted average of 67.7%. Similarly, the statistical analysis conducted on geographies consisting of 477,223,087 people shows a mild negative correlation between the proportion of Immigrants from Northern Europe and percentage of population with at least college, under 1 year education in the United States with a correlation coefficient (R) of -0.348 and weighted average of 71.1%, a difference of 5.1%.
Assyrian/Chaldean/Syriac vs Immigrants from Northern Europe College, Under 1 year

College, Under 1 year Correlation Summary

MeasurementAssyrian/Chaldean/SyriacImmigrants from Northern Europe
Minimum44.0%23.8%
Maximum92.5%100.0%
Range48.5%76.2%
Mean71.5%68.4%
Median70.8%73.4%
Interquartile 25% (IQ1)63.9%55.1%
Interquartile 75% (IQ3)77.8%82.0%
Interquartile Range (IQR)13.9%26.9%
Standard Deviation (Sample)10.2%18.0%
Standard Deviation (Population)10.2%17.8%

Similar Demographics by College, Under 1 year

Demographics Similar to Assyrians/Chaldeans/Syriacs by College, Under 1 year

In terms of college, under 1 year, the demographic groups most similar to Assyrians/Chaldeans/Syriacs are Scandinavian (67.7%, a difference of 0.0%), Ukrainian (67.7%, a difference of 0.0%), Macedonian (67.6%, a difference of 0.020%), Syrian (67.6%, a difference of 0.040%), and Immigrants from Egypt (67.7%, a difference of 0.060%).
DemographicsRating | RankCollege, Under 1 year
Carpatho Rusyns
96.8
/100
|
#103
Exceptional
67.9%
Immigrants | Western Asia
96.6
/100
|
#104
Exceptional
67.8%
Afghans
96.6
/100
|
#105
Exceptional
67.8%
Immigrants | Croatia
96.6
/100
|
#106
Exceptional
67.8%
Austrians
96.4
/100
|
#107
Exceptional
67.8%
Immigrants | Egypt
96.0
/100
|
#108
Exceptional
67.7%
Scandinavians
95.8
/100
|
#109
Exceptional
67.7%
Assyrians/Chaldeans/Syriacs
95.8
/100
|
#110
Exceptional
67.7%
Ukrainians
95.8
/100
|
#111
Exceptional
67.7%
Macedonians
95.7
/100
|
#112
Exceptional
67.6%
Syrians
95.6
/100
|
#113
Exceptional
67.6%
Chileans
95.3
/100
|
#114
Exceptional
67.6%
Basques
95.2
/100
|
#115
Exceptional
67.6%
Immigrants | Nepal
94.9
/100
|
#116
Exceptional
67.5%
Pakistanis
94.8
/100
|
#117
Exceptional
67.5%

Demographics Similar to Immigrants from Northern Europe by College, Under 1 year

In terms of college, under 1 year, the demographic groups most similar to Immigrants from Northern Europe are Soviet Union (71.1%, a difference of 0.010%), Bulgarian (71.1%, a difference of 0.030%), Immigrants from Denmark (71.0%, a difference of 0.14%), Immigrants from Ireland (71.0%, a difference of 0.15%), and Immigrants from Hong Kong (71.0%, a difference of 0.18%).
DemographicsRating | RankCollege, Under 1 year
Immigrants | Japan
100.0
/100
|
#16
Exceptional
71.9%
Eastern Europeans
100.0
/100
|
#17
Exceptional
71.8%
Immigrants | Switzerland
100.0
/100
|
#18
Exceptional
71.7%
Latvians
100.0
/100
|
#19
Exceptional
71.6%
Immigrants | Korea
100.0
/100
|
#20
Exceptional
71.6%
Immigrants | Belgium
100.0
/100
|
#21
Exceptional
71.5%
Immigrants | Eastern Asia
100.0
/100
|
#22
Exceptional
71.3%
Immigrants | Northern Europe
100.0
/100
|
#23
Exceptional
71.1%
Soviet Union
100.0
/100
|
#24
Exceptional
71.1%
Bulgarians
100.0
/100
|
#25
Exceptional
71.1%
Immigrants | Denmark
100.0
/100
|
#26
Exceptional
71.0%
Immigrants | Ireland
100.0
/100
|
#27
Exceptional
71.0%
Immigrants | Hong Kong
100.0
/100
|
#28
Exceptional
71.0%
Immigrants | France
100.0
/100
|
#29
Exceptional
71.0%
Immigrants | China
99.9
/100
|
#30
Exceptional
70.9%