Yuman vs Black/African American Male Disability
COMPARE
Yuman
Black/African American
Male Disability
Male Disability Comparison
Yuman
Blacks/African Americans
14.7%
MALE DISABILITY
0.0/ 100
METRIC RATING
333rd/ 347
METRIC RANK
13.2%
MALE DISABILITY
0.0/ 100
METRIC RATING
304th/ 347
METRIC RANK
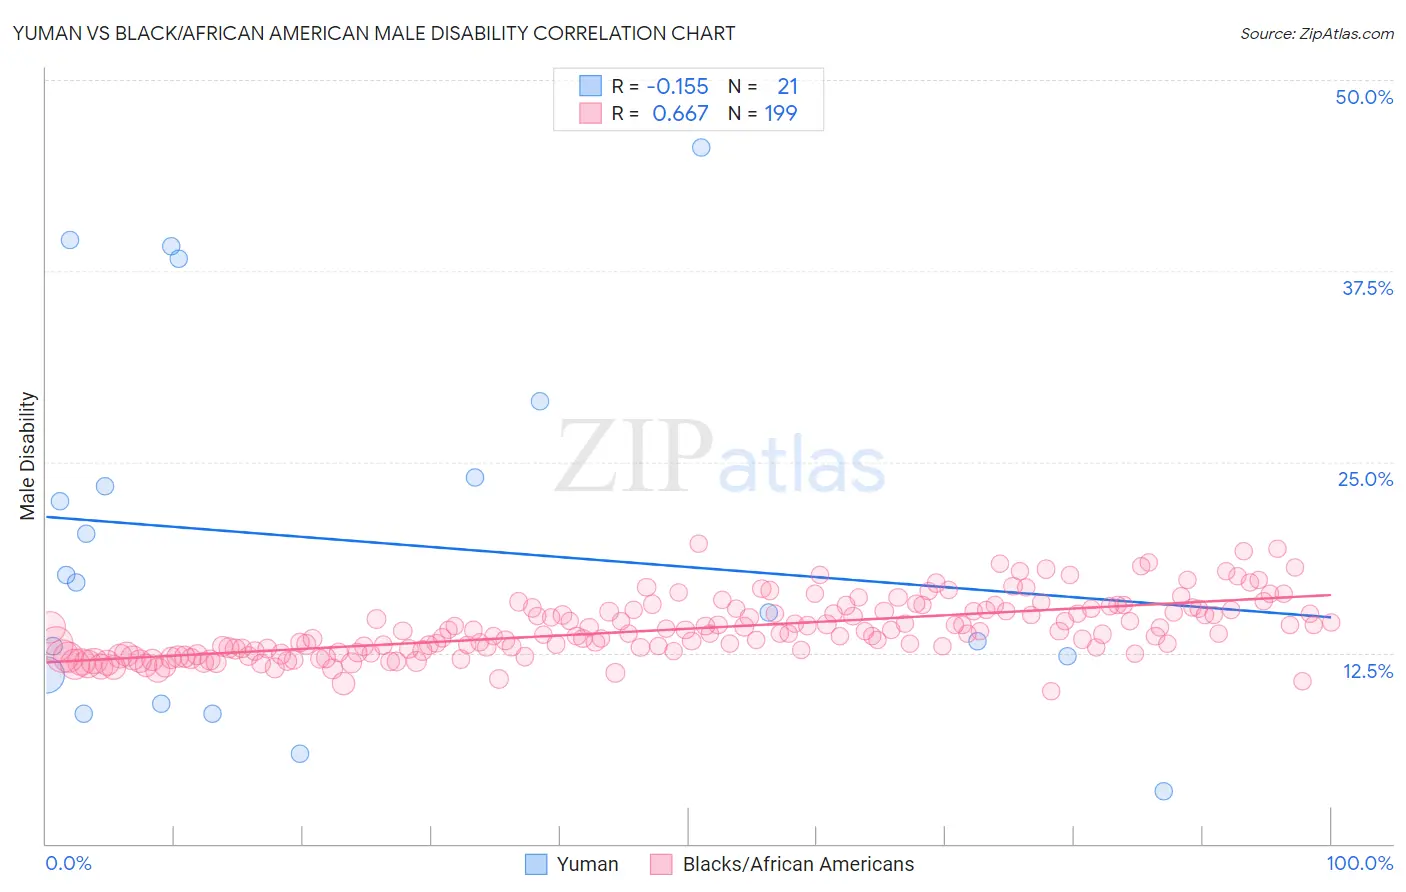
Yuman vs Black/African American Male Disability Correlation Chart
The statistical analysis conducted on geographies consisting of 40,663,251 people shows a poor negative correlation between the proportion of Yuman and percentage of males with a disability in the United States with a correlation coefficient (R) of -0.155 and weighted average of 14.7%. Similarly, the statistical analysis conducted on geographies consisting of 565,716,531 people shows a significant positive correlation between the proportion of Blacks/African Americans and percentage of males with a disability in the United States with a correlation coefficient (R) of 0.667 and weighted average of 13.2%, a difference of 11.4%.
Male Disability Correlation Summary
| Measurement | Yuman | Black/African American |
| Minimum | 3.4% | 10.0% |
| Maximum | 45.6% | 19.6% |
| Range | 42.1% | 9.6% |
| Mean | 19.8% | 14.1% |
| Median | 17.1% | 13.7% |
| Interquartile 25% (IQ1) | 10.1% | 12.6% |
| Interquartile 75% (IQ3) | 26.5% | 15.3% |
| Interquartile Range (IQR) | 16.4% | 2.7% |
| Standard Deviation (Sample) | 12.2% | 1.9% |
| Standard Deviation (Population) | 11.9% | 1.9% |
Similar Demographics by Male Disability
Demographics Similar to Yuman by Male Disability
In terms of male disability, the demographic groups most similar to Yuman are Seminole (14.7%, a difference of 0.10%), Cherokee (14.8%, a difference of 0.68%), Dutch West Indian (14.8%, a difference of 0.70%), Tohono O'odham (14.6%, a difference of 0.87%), and Alaskan Athabascan (14.9%, a difference of 1.2%).
| Demographics | Rating | Rank | Male Disability |
| Natives/Alaskans | 0.0 /100 | #326 | Tragic 14.2% |
| Potawatomi | 0.0 /100 | #327 | Tragic 14.2% |
| Chippewa | 0.0 /100 | #328 | Tragic 14.3% |
| Cajuns | 0.0 /100 | #329 | Tragic 14.4% |
| Navajo | 0.0 /100 | #330 | Tragic 14.4% |
| Tohono O'odham | 0.0 /100 | #331 | Tragic 14.6% |
| Seminole | 0.0 /100 | #332 | Tragic 14.7% |
| Yuman | 0.0 /100 | #333 | Tragic 14.7% |
| Cherokee | 0.0 /100 | #334 | Tragic 14.8% |
| Dutch West Indians | 0.0 /100 | #335 | Tragic 14.8% |
| Alaskan Athabascans | 0.0 /100 | #336 | Tragic 14.9% |
| Menominee | 0.0 /100 | #337 | Tragic 15.0% |
| Pueblo | 0.0 /100 | #338 | Tragic 15.0% |
| Chickasaw | 0.0 /100 | #339 | Tragic 15.1% |
| Lumbee | 0.0 /100 | #340 | Tragic 15.2% |
Demographics Similar to Blacks/African Americans by Male Disability
In terms of male disability, the demographic groups most similar to Blacks/African Americans are Scotch-Irish (13.2%, a difference of 0.32%), French Canadian (13.3%, a difference of 0.41%), Spanish American (13.3%, a difference of 0.61%), Arapaho (13.3%, a difference of 0.84%), and Crow (13.1%, a difference of 0.87%).
| Demographics | Rating | Rank | Male Disability |
| Inupiat | 0.0 /100 | #297 | Tragic 13.0% |
| Pennsylvania Germans | 0.0 /100 | #298 | Tragic 13.0% |
| Celtics | 0.0 /100 | #299 | Tragic 13.0% |
| Cheyenne | 0.0 /100 | #300 | Tragic 13.0% |
| French | 0.0 /100 | #301 | Tragic 13.0% |
| Crow | 0.0 /100 | #302 | Tragic 13.1% |
| Scotch-Irish | 0.0 /100 | #303 | Tragic 13.2% |
| Blacks/African Americans | 0.0 /100 | #304 | Tragic 13.2% |
| French Canadians | 0.0 /100 | #305 | Tragic 13.3% |
| Spanish Americans | 0.0 /100 | #306 | Tragic 13.3% |
| Arapaho | 0.0 /100 | #307 | Tragic 13.3% |
| French American Indians | 0.0 /100 | #308 | Tragic 13.4% |
| Blackfeet | 0.0 /100 | #309 | Tragic 13.4% |
| Immigrants | Azores | 0.0 /100 | #310 | Tragic 13.4% |
| Delaware | 0.0 /100 | #311 | Tragic 13.5% |