Sierra Leonean vs Guatemalan Male Disability
COMPARE
Sierra Leonean
Guatemalan
Male Disability
Male Disability Comparison
Sierra Leoneans
Guatemalans
10.5%
MALE DISABILITY
98.7/ 100
METRIC RATING
75th/ 347
METRIC RANK
11.1%
MALE DISABILITY
67.2/ 100
METRIC RATING
159th/ 347
METRIC RANK
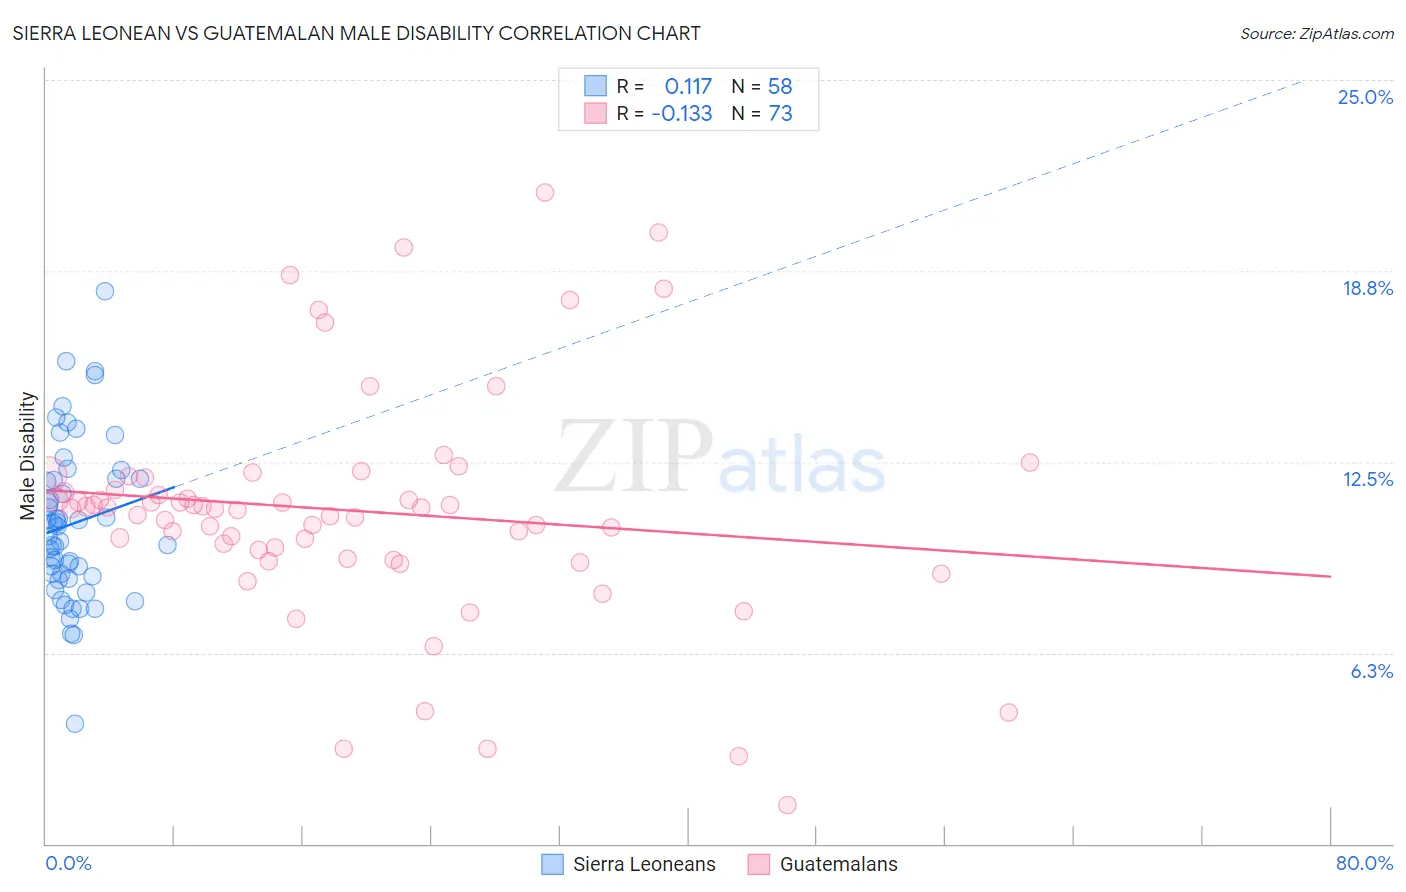
Sierra Leonean vs Guatemalan Male Disability Correlation Chart
The statistical analysis conducted on geographies consisting of 83,361,010 people shows a poor positive correlation between the proportion of Sierra Leoneans and percentage of males with a disability in the United States with a correlation coefficient (R) of 0.117 and weighted average of 10.5%. Similarly, the statistical analysis conducted on geographies consisting of 409,466,260 people shows a poor negative correlation between the proportion of Guatemalans and percentage of males with a disability in the United States with a correlation coefficient (R) of -0.133 and weighted average of 11.1%, a difference of 5.3%.
Male Disability Correlation Summary
| Measurement | Sierra Leonean | Guatemalan |
| Minimum | 3.9% | 1.3% |
| Maximum | 18.1% | 21.3% |
| Range | 14.2% | 20.1% |
| Mean | 10.5% | 10.9% |
| Median | 10.2% | 11.0% |
| Interquartile 25% (IQ1) | 8.8% | 9.5% |
| Interquartile 75% (IQ3) | 11.9% | 11.8% |
| Interquartile Range (IQR) | 3.2% | 2.3% |
| Standard Deviation (Sample) | 2.6% | 3.8% |
| Standard Deviation (Population) | 2.6% | 3.7% |
Similar Demographics by Male Disability
Demographics Similar to Sierra Leoneans by Male Disability
In terms of male disability, the demographic groups most similar to Sierra Leoneans are Immigrants from Sierra Leone (10.5%, a difference of 0.040%), Laotian (10.6%, a difference of 0.10%), Immigrants from Lebanon (10.5%, a difference of 0.12%), Immigrants from Russia (10.6%, a difference of 0.12%), and Immigrants from Lithuania (10.5%, a difference of 0.26%).
| Demographics | Rating | Rank | Male Disability |
| Colombians | 99.2 /100 | #68 | Exceptional 10.5% |
| Ecuadorians | 99.2 /100 | #69 | Exceptional 10.5% |
| Immigrants | Bulgaria | 99.1 /100 | #70 | Exceptional 10.5% |
| Immigrants | Cameroon | 99.0 /100 | #71 | Exceptional 10.5% |
| Immigrants | Serbia | 99.0 /100 | #72 | Exceptional 10.5% |
| Immigrants | Lithuania | 98.9 /100 | #73 | Exceptional 10.5% |
| Immigrants | Lebanon | 98.8 /100 | #74 | Exceptional 10.5% |
| Sierra Leoneans | 98.7 /100 | #75 | Exceptional 10.5% |
| Immigrants | Sierra Leone | 98.7 /100 | #76 | Exceptional 10.5% |
| Laotians | 98.6 /100 | #77 | Exceptional 10.6% |
| Immigrants | Russia | 98.6 /100 | #78 | Exceptional 10.6% |
| Zimbabweans | 98.4 /100 | #79 | Exceptional 10.6% |
| Immigrants | Jordan | 98.4 /100 | #80 | Exceptional 10.6% |
| Immigrants | Chile | 98.3 /100 | #81 | Exceptional 10.6% |
| Immigrants | Guyana | 98.2 /100 | #82 | Exceptional 10.6% |
Demographics Similar to Guatemalans by Male Disability
In terms of male disability, the demographic groups most similar to Guatemalans are Albanian (11.1%, a difference of 0.040%), Latvian (11.1%, a difference of 0.060%), Immigrants from West Indies (11.1%, a difference of 0.090%), Immigrants from Haiti (11.1%, a difference of 0.12%), and Immigrants from Western Africa (11.1%, a difference of 0.13%).
| Demographics | Rating | Rank | Male Disability |
| Immigrants | Albania | 74.4 /100 | #152 | Good 11.0% |
| Immigrants | Northern Europe | 73.2 /100 | #153 | Good 11.1% |
| Immigrants | Moldova | 72.8 /100 | #154 | Good 11.1% |
| Immigrants | Middle Africa | 70.9 /100 | #155 | Good 11.1% |
| Russians | 69.8 /100 | #156 | Good 11.1% |
| Immigrants | Western Africa | 69.2 /100 | #157 | Good 11.1% |
| Latvians | 68.1 /100 | #158 | Good 11.1% |
| Guatemalans | 67.2 /100 | #159 | Good 11.1% |
| Albanians | 66.5 /100 | #160 | Good 11.1% |
| Immigrants | West Indies | 65.7 /100 | #161 | Good 11.1% |
| Immigrants | Haiti | 65.3 /100 | #162 | Good 11.1% |
| Immigrants | Kenya | 63.8 /100 | #163 | Good 11.1% |
| British West Indians | 62.8 /100 | #164 | Good 11.1% |
| Luxembourgers | 61.9 /100 | #165 | Good 11.1% |
| Immigrants | Hungary | 61.2 /100 | #166 | Good 11.1% |