Immigrants from Central America vs Guatemalan Male Disability
COMPARE
Immigrants from Central America
Guatemalan
Male Disability
Male Disability Comparison
Immigrants from Central America
Guatemalans
11.3%
MALE DISABILITY
32.9/ 100
METRIC RATING
183rd/ 347
METRIC RANK
11.1%
MALE DISABILITY
67.2/ 100
METRIC RATING
159th/ 347
METRIC RANK
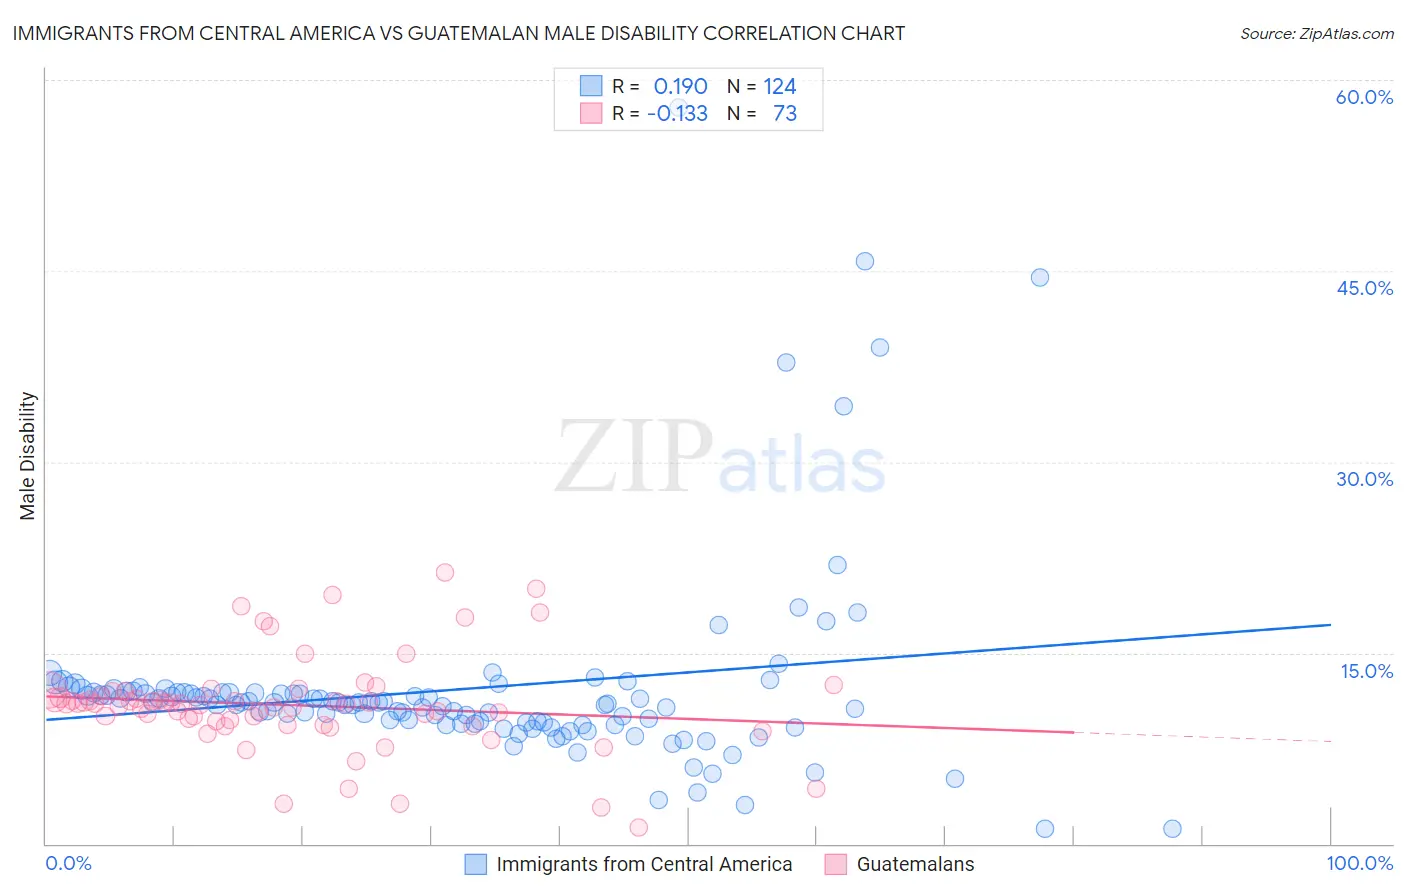
Immigrants from Central America vs Guatemalan Male Disability Correlation Chart
The statistical analysis conducted on geographies consisting of 536,294,553 people shows a poor positive correlation between the proportion of Immigrants from Central America and percentage of males with a disability in the United States with a correlation coefficient (R) of 0.190 and weighted average of 11.3%. Similarly, the statistical analysis conducted on geographies consisting of 409,466,260 people shows a poor negative correlation between the proportion of Guatemalans and percentage of males with a disability in the United States with a correlation coefficient (R) of -0.133 and weighted average of 11.1%, a difference of 2.0%.
Male Disability Correlation Summary
| Measurement | Immigrants from Central America | Guatemalan |
| Minimum | 1.2% | 1.3% |
| Maximum | 57.8% | 21.3% |
| Range | 56.6% | 20.1% |
| Mean | 12.1% | 10.9% |
| Median | 11.1% | 11.0% |
| Interquartile 25% (IQ1) | 9.5% | 9.5% |
| Interquartile 75% (IQ3) | 11.9% | 11.8% |
| Interquartile Range (IQR) | 2.4% | 2.3% |
| Standard Deviation (Sample) | 7.8% | 3.8% |
| Standard Deviation (Population) | 7.7% | 3.7% |
Similar Demographics by Male Disability
Demographics Similar to Immigrants from Central America by Male Disability
In terms of male disability, the demographic groups most similar to Immigrants from Central America are Immigrants from Belize (11.3%, a difference of 0.050%), Immigrants from Senegal (11.3%, a difference of 0.090%), Iraqi (11.3%, a difference of 0.15%), Pakistani (11.3%, a difference of 0.16%), and Immigrants from Zaire (11.4%, a difference of 0.34%).
| Demographics | Rating | Rank | Male Disability |
| Syrians | 46.6 /100 | #176 | Average 11.2% |
| Immigrants | Norway | 44.2 /100 | #177 | Average 11.3% |
| Australians | 42.2 /100 | #178 | Average 11.3% |
| Immigrants | Caribbean | 41.4 /100 | #179 | Average 11.3% |
| Hondurans | 41.1 /100 | #180 | Average 11.3% |
| Immigrants | Senegal | 34.4 /100 | #181 | Fair 11.3% |
| Immigrants | Belize | 33.7 /100 | #182 | Fair 11.3% |
| Immigrants | Central America | 32.9 /100 | #183 | Fair 11.3% |
| Iraqis | 30.5 /100 | #184 | Fair 11.3% |
| Pakistanis | 30.3 /100 | #185 | Fair 11.3% |
| Immigrants | Zaire | 27.6 /100 | #186 | Fair 11.4% |
| Immigrants | Austria | 27.3 /100 | #187 | Fair 11.4% |
| Estonians | 26.8 /100 | #188 | Fair 11.4% |
| Immigrants | Netherlands | 25.9 /100 | #189 | Fair 11.4% |
| Immigrants | Bosnia and Herzegovina | 25.4 /100 | #190 | Fair 11.4% |
Demographics Similar to Guatemalans by Male Disability
In terms of male disability, the demographic groups most similar to Guatemalans are Albanian (11.1%, a difference of 0.040%), Latvian (11.1%, a difference of 0.060%), Immigrants from West Indies (11.1%, a difference of 0.090%), Immigrants from Haiti (11.1%, a difference of 0.12%), and Immigrants from Western Africa (11.1%, a difference of 0.13%).
| Demographics | Rating | Rank | Male Disability |
| Immigrants | Albania | 74.4 /100 | #152 | Good 11.0% |
| Immigrants | Northern Europe | 73.2 /100 | #153 | Good 11.1% |
| Immigrants | Moldova | 72.8 /100 | #154 | Good 11.1% |
| Immigrants | Middle Africa | 70.9 /100 | #155 | Good 11.1% |
| Russians | 69.8 /100 | #156 | Good 11.1% |
| Immigrants | Western Africa | 69.2 /100 | #157 | Good 11.1% |
| Latvians | 68.1 /100 | #158 | Good 11.1% |
| Guatemalans | 67.2 /100 | #159 | Good 11.1% |
| Albanians | 66.5 /100 | #160 | Good 11.1% |
| Immigrants | West Indies | 65.7 /100 | #161 | Good 11.1% |
| Immigrants | Haiti | 65.3 /100 | #162 | Good 11.1% |
| Immigrants | Kenya | 63.8 /100 | #163 | Good 11.1% |
| British West Indians | 62.8 /100 | #164 | Good 11.1% |
| Luxembourgers | 61.9 /100 | #165 | Good 11.1% |
| Immigrants | Hungary | 61.2 /100 | #166 | Good 11.1% |