Russian vs Immigrants from North America Male Disability
COMPARE
Russian
Immigrants from North America
Male Disability
Male Disability Comparison
Russians
Immigrants from North America
11.1%
MALE DISABILITY
69.8/ 100
METRIC RATING
156th/ 347
METRIC RANK
11.9%
MALE DISABILITY
1.5/ 100
METRIC RATING
235th/ 347
METRIC RANK
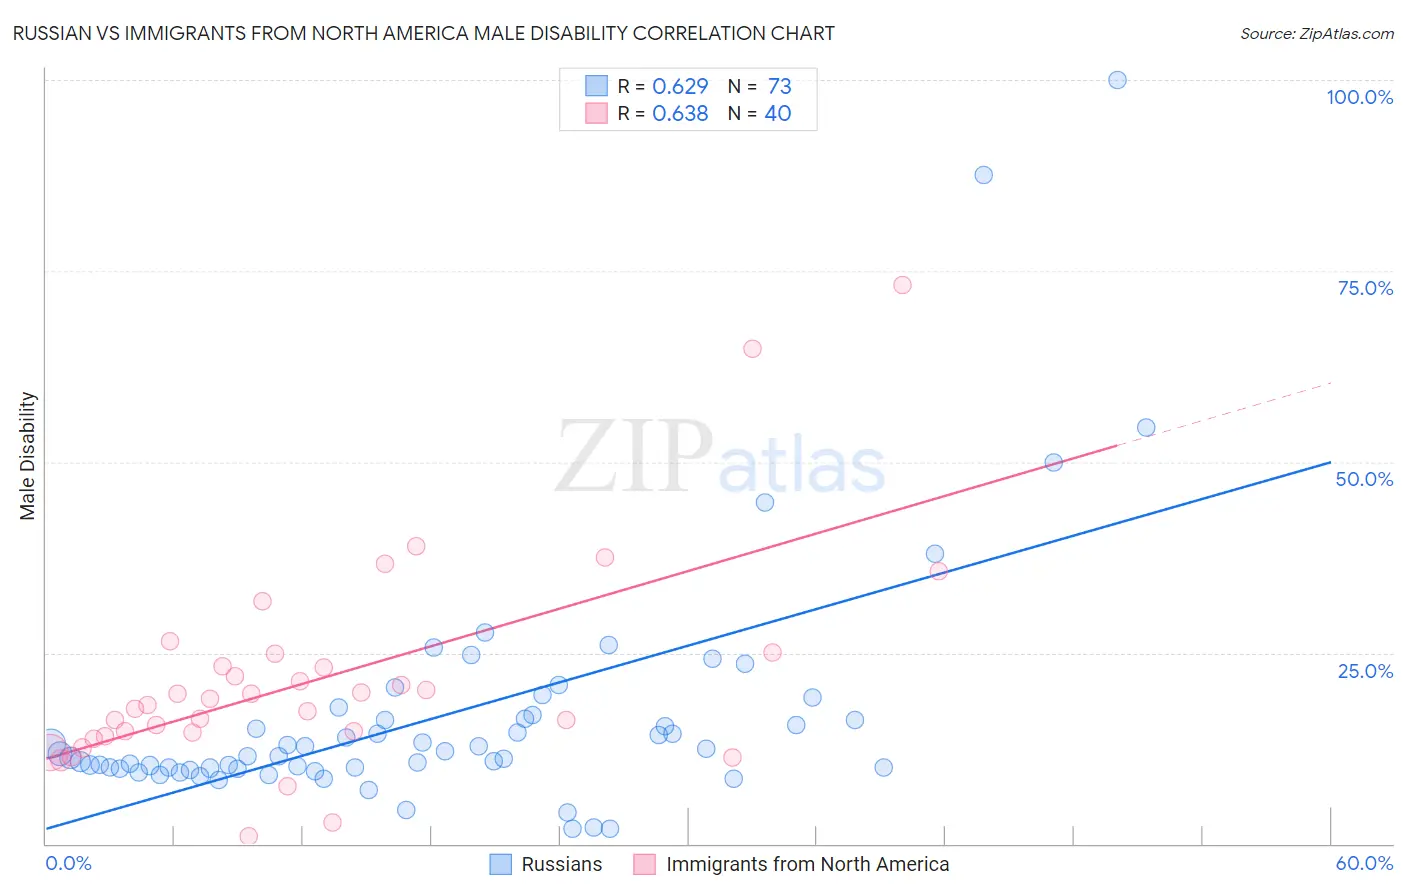
Russian vs Immigrants from North America Male Disability Correlation Chart
The statistical analysis conducted on geographies consisting of 512,092,434 people shows a significant positive correlation between the proportion of Russians and percentage of males with a disability in the United States with a correlation coefficient (R) of 0.629 and weighted average of 11.1%. Similarly, the statistical analysis conducted on geographies consisting of 462,399,243 people shows a significant positive correlation between the proportion of Immigrants from North America and percentage of males with a disability in the United States with a correlation coefficient (R) of 0.638 and weighted average of 11.9%, a difference of 7.1%.
Male Disability Correlation Summary
| Measurement | Russian | Immigrants from North America |
| Minimum | 2.0% | 1.0% |
| Maximum | 100.0% | 73.2% |
| Range | 98.0% | 72.2% |
| Mean | 16.8% | 21.6% |
| Median | 11.8% | 18.6% |
| Interquartile 25% (IQ1) | 9.9% | 14.4% |
| Interquartile 75% (IQ3) | 16.7% | 24.1% |
| Interquartile Range (IQR) | 6.8% | 9.8% |
| Standard Deviation (Sample) | 16.2% | 14.0% |
| Standard Deviation (Population) | 16.1% | 13.8% |
Similar Demographics by Male Disability
Demographics Similar to Russians by Male Disability
In terms of male disability, the demographic groups most similar to Russians are Immigrants from Western Africa (11.1%, a difference of 0.040%), Immigrants from Middle Africa (11.1%, a difference of 0.070%), Latvian (11.1%, a difference of 0.11%), Guatemalan (11.1%, a difference of 0.17%), and Immigrants from Moldova (11.1%, a difference of 0.21%).
| Demographics | Rating | Rank | Male Disability |
| Immigrants | Denmark | 76.4 /100 | #149 | Good 11.0% |
| Immigrants | Guatemala | 75.1 /100 | #150 | Good 11.0% |
| Cubans | 74.9 /100 | #151 | Good 11.0% |
| Immigrants | Albania | 74.4 /100 | #152 | Good 11.0% |
| Immigrants | Northern Europe | 73.2 /100 | #153 | Good 11.1% |
| Immigrants | Moldova | 72.8 /100 | #154 | Good 11.1% |
| Immigrants | Middle Africa | 70.9 /100 | #155 | Good 11.1% |
| Russians | 69.8 /100 | #156 | Good 11.1% |
| Immigrants | Western Africa | 69.2 /100 | #157 | Good 11.1% |
| Latvians | 68.1 /100 | #158 | Good 11.1% |
| Guatemalans | 67.2 /100 | #159 | Good 11.1% |
| Albanians | 66.5 /100 | #160 | Good 11.1% |
| Immigrants | West Indies | 65.7 /100 | #161 | Good 11.1% |
| Immigrants | Haiti | 65.3 /100 | #162 | Good 11.1% |
| Immigrants | Kenya | 63.8 /100 | #163 | Good 11.1% |
Demographics Similar to Immigrants from North America by Male Disability
In terms of male disability, the demographic groups most similar to Immigrants from North America are Immigrants from Canada (11.9%, a difference of 0.13%), U.S. Virgin Islander (11.9%, a difference of 0.14%), Carpatho Rusyn (11.9%, a difference of 0.15%), Mexican (11.8%, a difference of 0.20%), and Malaysian (11.8%, a difference of 0.24%).
| Demographics | Rating | Rank | Male Disability |
| Hispanics or Latinos | 2.3 /100 | #228 | Tragic 11.8% |
| Bermudans | 2.3 /100 | #229 | Tragic 11.8% |
| Croatians | 2.1 /100 | #230 | Tragic 11.8% |
| Dominicans | 1.8 /100 | #231 | Tragic 11.8% |
| Malaysians | 1.8 /100 | #232 | Tragic 11.8% |
| Mexicans | 1.7 /100 | #233 | Tragic 11.8% |
| Immigrants | Canada | 1.6 /100 | #234 | Tragic 11.9% |
| Immigrants | North America | 1.5 /100 | #235 | Tragic 11.9% |
| U.S. Virgin Islanders | 1.3 /100 | #236 | Tragic 11.9% |
| Carpatho Rusyns | 1.3 /100 | #237 | Tragic 11.9% |
| Yugoslavians | 1.2 /100 | #238 | Tragic 11.9% |
| Italians | 1.2 /100 | #239 | Tragic 11.9% |
| Czechs | 1.1 /100 | #240 | Tragic 11.9% |
| Bahamians | 1.1 /100 | #241 | Tragic 11.9% |
| Northern Europeans | 1.1 /100 | #242 | Tragic 11.9% |