Pima vs Russian Disability Age 18 to 34

COMPARE

Pima
Race
Ancestry
AfghanAfricanAlaska NativeAlaskan AthabascanAlbanianAleutAlsatianAmericanApacheArabArapahoArgentineanArmenianAssyrian/Chaldean/SyriacAustralianAustrianBahamianBangladeshiBarbadianBasqueBelgianBelizeanBermudanBhutaneseBlackfeetBolivianBrazilianBritishBritish West IndianBulgarianBurmeseCajunCambodianCanadianCape VerdeanCarpatho RusynCelticCentral AmericanCentral American IndianCherokeeCheyenneChickasawChileanChineseChippewaChoctawColombianColvilleComancheCosta RicanCreeCreekCroatianCrowCubanCypriotCzechCzechoslovakianDanishDelawareDominicanDutchDutch West IndianEastern EuropeanEcuadorianEgyptianEnglishEstonianEthiopianEuropeanFijianFilipinoFinnishFrenchFrench American IndianFrench CanadianGermanGerman RussianGhanaianGreekGuamanian/ChamorroGuatemalanGuyaneseHaitianHmongHonduranHopiHoumaHungarianIcelanderIndian (Asian)IndonesianInupiatIranianIraqiIrishIroquoisIsraeliItalianJamaicanJapaneseJordanianKenyanKiowaKoreanLaotianLatvianLebaneseLiberianLithuanianLumbeeLuxembourgerMacedonianMalaysianMalteseMarshalleseMenomineeMexicanMexican American IndianMongolianMoroccanNative HawaiianNavajoNepaleseNew ZealanderNicaraguanNigerianNorthern EuropeanNorwegianOkinawanOsageOttawaPaiutePakistaniPalestinianPanamanianParaguayanPennsylvania GermanPeruvianPimaPolishPortuguesePotawatomiPuebloPuerto RicanPuget Sound SalishRomanianSalvadoranSamoanScandinavianScotch-IrishScottishSeminoleSenegaleseSerbianShoshoneSierra LeoneanSiouxSlavicSlovakSloveneSomaliSouth AfricanSouth AmericanSouth American IndianSoviet UnionSpaniardSpanishSpanish AmericanSpanish American IndianSri LankanSubsaharan AfricanSudaneseSwedishSwissSyrianTaiwaneseThaiTlingit-HaidaTohono O'OdhamTonganTrinidadian and TobagonianTsimshianTurkishU.S. Virgin IslanderUgandanUkrainianUruguayanUteVenezuelanVietnameseWelshWest IndianYakamaYaquiYugoslavianYumanYup'ikZimbabwean
Immigration
NonimmigrantsImmigrantsAfghanistanAfricaAlbaniaArgentinaArmeniaAsiaAustraliaAustriaBahamasBangladeshBarbadosBelarusBelgiumBelizeBoliviaBosnia and HerzegovinaBrazilBulgariaBurma/MyanmarCabo VerdeCambodiaCameroonCanadaCaribbeanCentral AmericaChileChinaColombiaCongoCosta RicaCroatiaCubaCzechoslovakiaDenmarkDominicaDominican RepublicEastern AfricaEastern AsiaEastern EuropeEcuadorEgyptEl SalvadorEnglandEritreaEthiopiaEuropeFijiFranceGermanyGhanaGreeceGrenadaGuatemalaGuyanaHaitiHondurasHong KongHungaryIndiaIndonesiaIranIraqIrelandIsraelItalyJamaicaJapanJordanKazakhstanKenyaKoreaKuwaitLaosLatin AmericaLatviaLebanonLiberiaLithuaniaMalaysiaMexicoMicronesiaMiddle AfricaMoldovaMoroccoNepalNetherlandsNicaraguaNigeriaNorth AmericaNorth MacedoniaNorthern AfricaNorthern EuropeNorwayOceaniaPakistanPanamaPeruPhilippinesPolandPortugalRomaniaRussiaSaudi ArabiaScotlandSenegalSerbiaSierra LeoneSingaporeSomaliaSouth AfricaSouth AmericaSouth Central AsiaSouth Eastern AsiaSouthern EuropeSpainSri LankaSt. Vincent and the GrenadinesSudanSwedenSwitzerlandSyriaTaiwanThailandTrinidad and TobagoTurkeyUgandaUkraineUruguayUzbekistanVenezuelaVietnamWest IndiesWestern AfricaWestern AsiaWestern EuropeYemenZaireZimbabweAzores
Russian
Race
Ancestry
AfghanAfricanAlaska NativeAlaskan AthabascanAlbanianAleutAlsatianAmericanApacheArabArapahoArgentineanArmenianAssyrian/Chaldean/SyriacAustralianAustrianBahamianBangladeshiBarbadianBasqueBelgianBelizeanBermudanBhutaneseBlackfeetBolivianBrazilianBritishBritish West IndianBulgarianBurmeseCajunCambodianCanadianCape VerdeanCarpatho RusynCelticCentral AmericanCentral American IndianCherokeeCheyenneChickasawChileanChineseChippewaChoctawColombianColvilleComancheCosta RicanCreeCreekCroatianCrowCubanCypriotCzechCzechoslovakianDanishDelawareDominicanDutchDutch West IndianEastern EuropeanEcuadorianEgyptianEnglishEstonianEthiopianEuropeanFijianFilipinoFinnishFrenchFrench American IndianFrench CanadianGermanGerman RussianGhanaianGreekGuamanian/ChamorroGuatemalanGuyaneseHaitianHmongHonduranHopiHoumaHungarianIcelanderIndian (Asian)IndonesianInupiatIranianIraqiIrishIroquoisIsraeliItalianJamaicanJapaneseJordanianKenyanKiowaKoreanLaotianLatvianLebaneseLiberianLithuanianLumbeeLuxembourgerMacedonianMalaysianMalteseMarshalleseMenomineeMexicanMexican American IndianMongolianMoroccanNative HawaiianNavajoNepaleseNew ZealanderNicaraguanNigerianNorthern EuropeanNorwegianOkinawanOsageOttawaPaiutePakistaniPalestinianPanamanianParaguayanPennsylvania GermanPeruvianPolishPortuguesePotawatomiPuebloPuerto RicanPuget Sound SalishRomanianRussianSalvadoranSamoanScandinavianScotch-IrishScottishSeminoleSenegaleseSerbianShoshoneSierra LeoneanSiouxSlavicSlovakSloveneSomaliSouth AfricanSouth AmericanSouth American IndianSoviet UnionSpaniardSpanishSpanish AmericanSpanish American IndianSri LankanSubsaharan AfricanSudaneseSwedishSwissSyrianTaiwaneseThaiTlingit-HaidaTohono O'OdhamTonganTrinidadian and TobagonianTsimshianTurkishU.S. Virgin IslanderUgandanUkrainianUruguayanUteVenezuelanVietnameseWelshWest IndianYakamaYaquiYugoslavianYumanYup'ikZimbabwean
Immigration
NonimmigrantsImmigrantsAfghanistanAfricaAlbaniaArgentinaArmeniaAsiaAustraliaAustriaBahamasBangladeshBarbadosBelarusBelgiumBelizeBoliviaBosnia and HerzegovinaBrazilBulgariaBurma/MyanmarCabo VerdeCambodiaCameroonCanadaCaribbeanCentral AmericaChileChinaColombiaCongoCosta RicaCroatiaCubaCzechoslovakiaDenmarkDominicaDominican RepublicEastern AfricaEastern AsiaEastern EuropeEcuadorEgyptEl SalvadorEnglandEritreaEthiopiaEuropeFijiFranceGermanyGhanaGreeceGrenadaGuatemalaGuyanaHaitiHondurasHong KongHungaryIndiaIndonesiaIranIraqIrelandIsraelItalyJamaicaJapanJordanKazakhstanKenyaKoreaKuwaitLaosLatin AmericaLatviaLebanonLiberiaLithuaniaMalaysiaMexicoMicronesiaMiddle AfricaMoldovaMoroccoNepalNetherlandsNicaraguaNigeriaNorth AmericaNorth MacedoniaNorthern AfricaNorthern EuropeNorwayOceaniaPakistanPanamaPeruPhilippinesPolandPortugalRomaniaRussiaSaudi ArabiaScotlandSenegalSerbiaSierra LeoneSingaporeSomaliaSouth AfricaSouth AmericaSouth Central AsiaSouth Eastern AsiaSouthern EuropeSpainSri LankaSt. Vincent and the GrenadinesSudanSwedenSwitzerlandSyriaTaiwanThailandTrinidad and TobagoTurkeyUgandaUkraineUruguayUzbekistanVenezuelaVietnamWest IndiesWestern AfricaWestern AsiaWestern EuropeYemenZaireZimbabweAzores
Disability Age 18 to 34
Income
Poverty
Unemployment
Labor Participation
Family Structure
Vehicle Availability
Education Level
Disability

Disability Age 18 to 34 Comparison

Pima

Russians

Tragic
Good
7.7%
DISABILITY AGE 18 TO 34
0.0/ 100
METRIC RATING
301st/ 347
METRIC RANK
6.5%
DISABILITY AGE 18 TO 34
60.2/ 100
METRIC RATING
169th/ 347
METRIC RANK

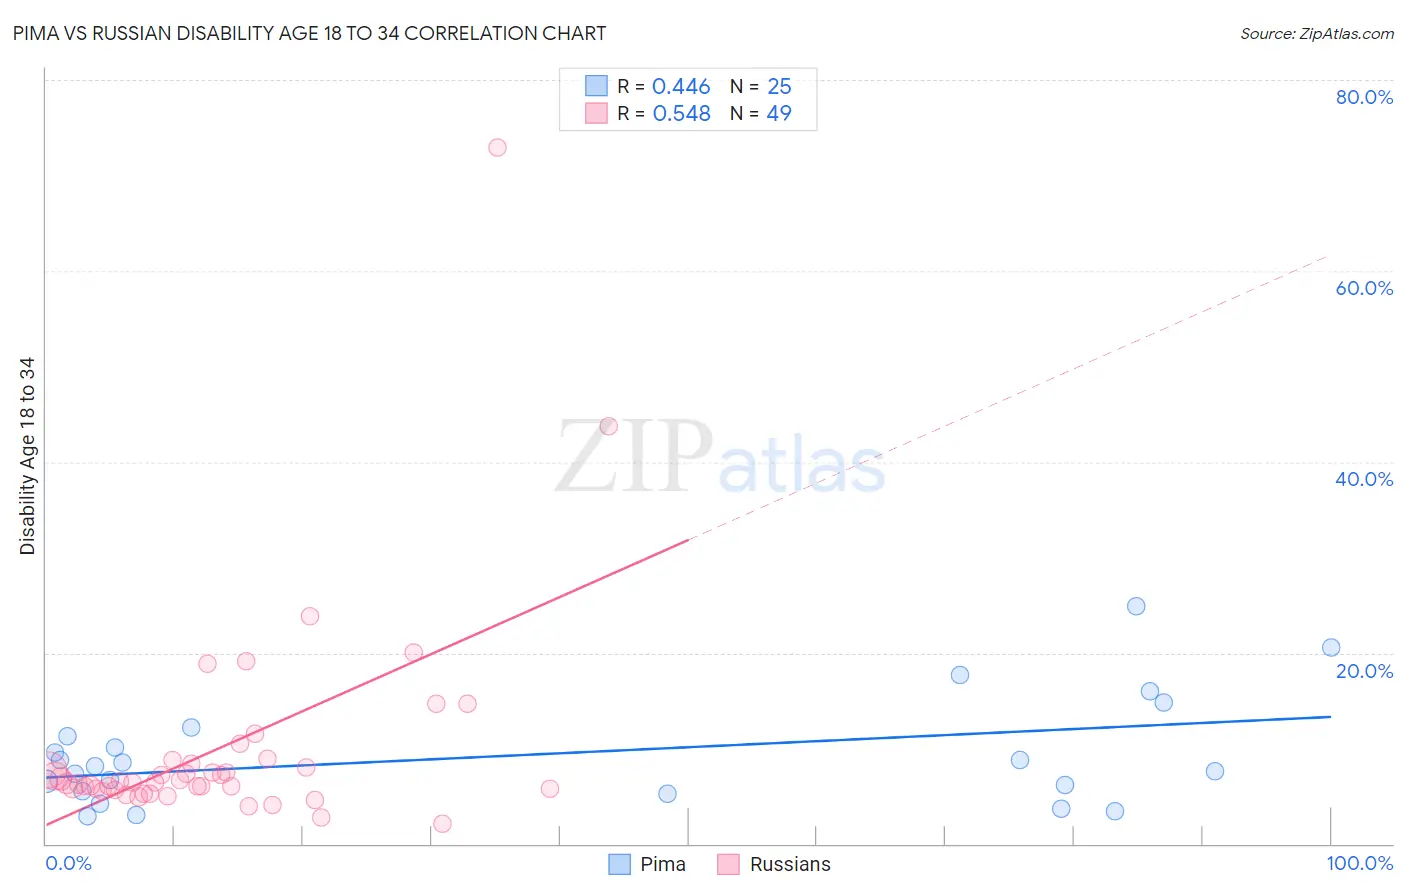
Pima vs Russian Disability Age 18 to 34 Correlation Chart

The statistical analysis conducted on geographies consisting of 61,478,935 people shows a moderate positive correlation between the proportion of Pima and percentage of population with a disability between the ages 18 and 35 in the United States with a correlation coefficient (R) of 0.446 and weighted average of 7.7%. Similarly, the statistical analysis conducted on geographies consisting of 509,184,365 people shows a substantial positive correlation between the proportion of Russians and percentage of population with a disability between the ages 18 and 35 in the United States with a correlation coefficient (R) of 0.548 and weighted average of 6.5%, a difference of 18.1%.
Pima vs Russian Disability Age 18 to 34

Disability Age 18 to 34 Correlation Summary

MeasurementPimaRussian
Minimum2.8%2.1%
Maximum24.9%72.9%
Range22.1%70.8%
Mean9.3%10.0%
Median8.1%6.4%
Interquartile 25% (IQ1)5.3%5.7%
Interquartile 75% (IQ3)11.7%8.6%
Interquartile Range (IQR)6.4%2.9%
Standard Deviation (Sample)5.7%11.4%
Standard Deviation (Population)5.5%11.3%

Similar Demographics by Disability Age 18 to 34

Demographics Similar to Pima by Disability Age 18 to 34

In terms of disability age 18 to 34, the demographic groups most similar to Pima are Scottish (7.7%, a difference of 0.060%), Welsh (7.7%, a difference of 0.070%), German (7.7%, a difference of 0.080%), Cheyenne (7.7%, a difference of 0.14%), and Dutch (7.7%, a difference of 0.31%).
DemographicsRating | RankDisability Age 18 to 34
Immigrants | Cabo Verde
0.0
/100
|
#294
Tragic
7.7%
Tlingit-Haida
0.0
/100
|
#295
Tragic
7.7%
Cape Verdeans
0.0
/100
|
#296
Tragic
7.7%
Pueblo
0.0
/100
|
#297
Tragic
7.7%
Dutch
0.0
/100
|
#298
Tragic
7.7%
Germans
0.0
/100
|
#299
Tragic
7.7%
Scottish
0.0
/100
|
#300
Tragic
7.7%
Pima
0.0
/100
|
#301
Tragic
7.7%
Welsh
0.0
/100
|
#302
Tragic
7.7%
Cheyenne
0.0
/100
|
#303
Tragic
7.7%
Shoshone
0.0
/100
|
#304
Tragic
7.8%
Menominee
0.0
/100
|
#305
Tragic
7.8%
English
0.0
/100
|
#306
Tragic
7.8%
Scotch-Irish
0.0
/100
|
#307
Tragic
7.8%
Pennsylvania Germans
0.0
/100
|
#308
Tragic
7.8%

Demographics Similar to Russians by Disability Age 18 to 34

In terms of disability age 18 to 34, the demographic groups most similar to Russians are Immigrants from Bahamas (6.6%, a difference of 0.17%), Immigrants from Moldova (6.5%, a difference of 0.21%), Immigrants from Northern Europe (6.5%, a difference of 0.29%), Bahamian (6.6%, a difference of 0.34%), and Eastern European (6.5%, a difference of 0.37%).
DemographicsRating | RankDisability Age 18 to 34
South Africans
71.7
/100
|
#162
Good
6.5%
Immigrants | Denmark
71.7
/100
|
#163
Good
6.5%
Immigrants | Nigeria
70.4
/100
|
#164
Good
6.5%
Immigrants | Hungary
69.6
/100
|
#165
Good
6.5%
Eastern Europeans
65.1
/100
|
#166
Good
6.5%
Immigrants | Northern Europe
64.1
/100
|
#167
Good
6.5%
Immigrants | Moldova
63.1
/100
|
#168
Good
6.5%
Russians
60.2
/100
|
#169
Good
6.5%
Immigrants | Bahamas
57.9
/100
|
#170
Average
6.6%
Bahamians
55.5
/100
|
#171
Average
6.6%
Ghanaians
54.7
/100
|
#172
Average
6.6%
Immigrants | Mexico
54.1
/100
|
#173
Average
6.6%
Native Hawaiians
50.0
/100
|
#174
Average
6.6%
Immigrants | Cambodia
46.5
/100
|
#175
Average
6.6%
Immigrants | Africa
45.9
/100
|
#176
Average
6.6%