Malaysian vs Immigrants from Southern Europe Female Disability
COMPARE
Malaysian
Immigrants from Southern Europe
Female Disability
Female Disability Comparison
Malaysians
Immigrants from Southern Europe
12.5%
FEMALE DISABILITY
5.0/ 100
METRIC RATING
235th/ 347
METRIC RANK
12.2%
FEMALE DISABILITY
56.3/ 100
METRIC RATING
171st/ 347
METRIC RANK
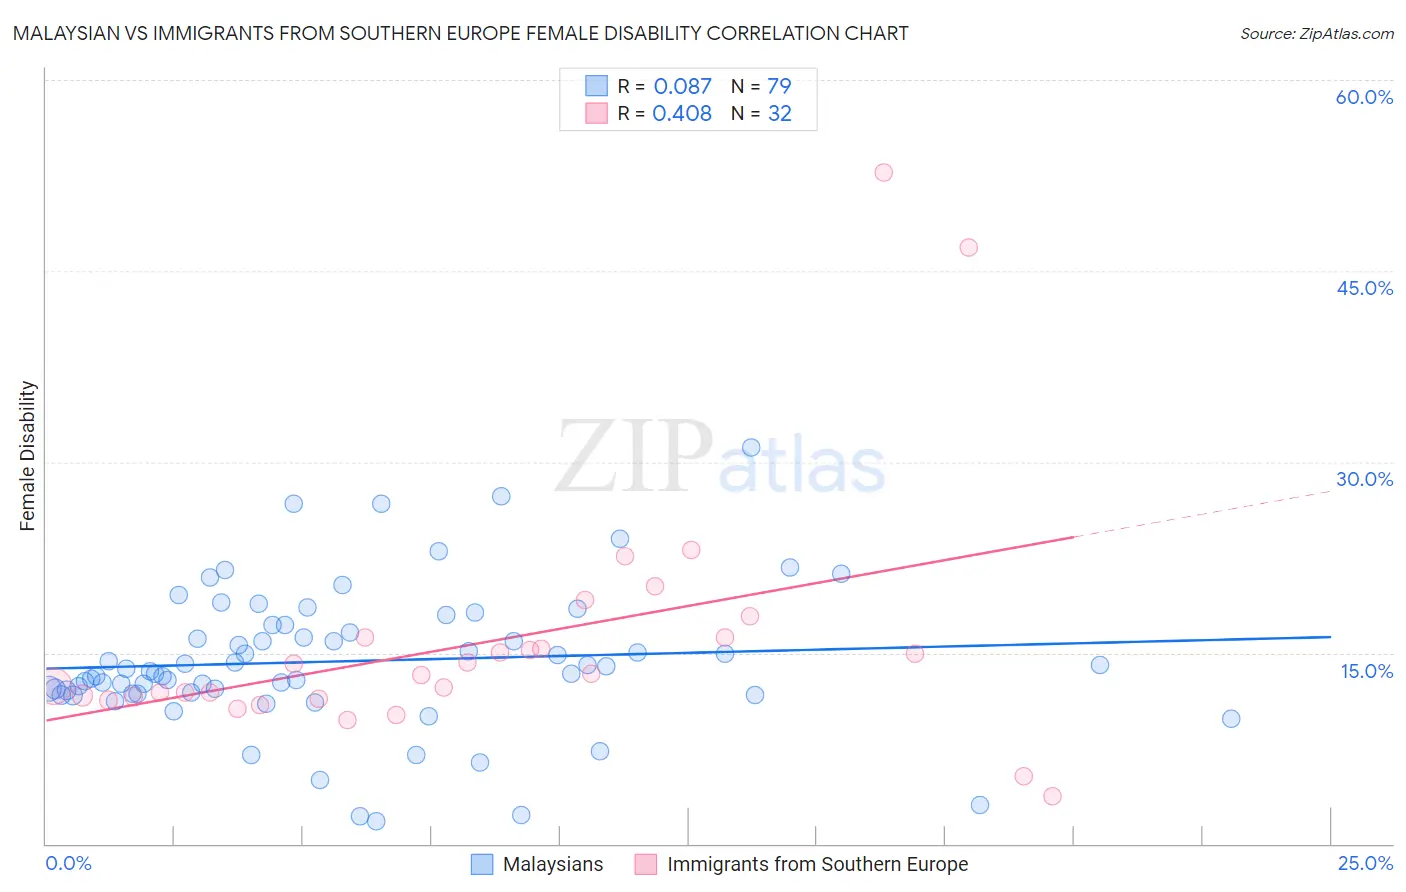
Malaysian vs Immigrants from Southern Europe Female Disability Correlation Chart
The statistical analysis conducted on geographies consisting of 226,065,175 people shows a slight positive correlation between the proportion of Malaysians and percentage of females with a disability in the United States with a correlation coefficient (R) of 0.087 and weighted average of 12.5%. Similarly, the statistical analysis conducted on geographies consisting of 402,770,343 people shows a moderate positive correlation between the proportion of Immigrants from Southern Europe and percentage of females with a disability in the United States with a correlation coefficient (R) of 0.408 and weighted average of 12.2%, a difference of 3.0%.
Female Disability Correlation Summary
| Measurement | Malaysian | Immigrants from Southern Europe |
| Minimum | 1.8% | 3.7% |
| Maximum | 31.1% | 52.8% |
| Range | 29.3% | 49.1% |
| Mean | 14.3% | 15.8% |
| Median | 13.5% | 13.3% |
| Interquartile 25% (IQ1) | 11.8% | 11.5% |
| Interquartile 75% (IQ3) | 17.2% | 16.2% |
| Interquartile Range (IQR) | 5.4% | 4.7% |
| Standard Deviation (Sample) | 5.5% | 9.8% |
| Standard Deviation (Population) | 5.5% | 9.7% |
Similar Demographics by Female Disability
Demographics Similar to Malaysians by Female Disability
In terms of female disability, the demographic groups most similar to Malaysians are Scandinavian (12.5%, a difference of 0.050%), Immigrants from Iraq (12.5%, a difference of 0.060%), Immigrants from West Indies (12.6%, a difference of 0.13%), Immigrants from Somalia (12.5%, a difference of 0.17%), and Belgian (12.5%, a difference of 0.25%).
| Demographics | Rating | Rank | Female Disability |
| Immigrants | Cambodia | 7.8 /100 | #228 | Tragic 12.5% |
| Hungarians | 7.2 /100 | #229 | Tragic 12.5% |
| Immigrants | Belize | 7.0 /100 | #230 | Tragic 12.5% |
| Belgians | 6.5 /100 | #231 | Tragic 12.5% |
| Immigrants | Somalia | 5.9 /100 | #232 | Tragic 12.5% |
| Immigrants | Iraq | 5.3 /100 | #233 | Tragic 12.5% |
| Scandinavians | 5.3 /100 | #234 | Tragic 12.5% |
| Malaysians | 5.0 /100 | #235 | Tragic 12.5% |
| Immigrants | West Indies | 4.4 /100 | #236 | Tragic 12.6% |
| Slavs | 3.8 /100 | #237 | Tragic 12.6% |
| Yugoslavians | 3.7 /100 | #238 | Tragic 12.6% |
| Barbadians | 3.6 /100 | #239 | Tragic 12.6% |
| German Russians | 3.2 /100 | #240 | Tragic 12.6% |
| Japanese | 2.7 /100 | #241 | Tragic 12.6% |
| Canadians | 2.6 /100 | #242 | Tragic 12.6% |
Demographics Similar to Immigrants from Southern Europe by Female Disability
In terms of female disability, the demographic groups most similar to Immigrants from Southern Europe are Maltese (12.2%, a difference of 0.030%), Lebanese (12.2%, a difference of 0.070%), Immigrants from Haiti (12.2%, a difference of 0.10%), Immigrants from Latin America (12.2%, a difference of 0.11%), and Lithuanian (12.2%, a difference of 0.12%).
| Demographics | Rating | Rank | Female Disability |
| Czechs | 63.6 /100 | #164 | Good 12.1% |
| Immigrants | Oceania | 61.8 /100 | #165 | Good 12.1% |
| Lithuanians | 59.5 /100 | #166 | Average 12.2% |
| Immigrants | Latin America | 59.0 /100 | #167 | Average 12.2% |
| Immigrants | Haiti | 58.8 /100 | #168 | Average 12.2% |
| Lebanese | 58.1 /100 | #169 | Average 12.2% |
| Maltese | 57.0 /100 | #170 | Average 12.2% |
| Immigrants | Southern Europe | 56.3 /100 | #171 | Average 12.2% |
| Haitians | 51.9 /100 | #172 | Average 12.2% |
| Immigrants | Mexico | 50.8 /100 | #173 | Average 12.2% |
| Immigrants | England | 50.0 /100 | #174 | Average 12.2% |
| Immigrants | St. Vincent and the Grenadines | 49.7 /100 | #175 | Average 12.2% |
| Immigrants | Guyana | 43.1 /100 | #176 | Average 12.2% |
| Immigrants | Ghana | 42.5 /100 | #177 | Average 12.2% |
| Immigrants | Western Europe | 40.9 /100 | #178 | Average 12.2% |