Malaysian vs Immigrants from Korea Female Disability
COMPARE
Malaysian
Immigrants from Korea
Female Disability
Female Disability Comparison
Malaysians
Immigrants from Korea
12.5%
FEMALE DISABILITY
5.0/ 100
METRIC RATING
235th/ 347
METRIC RANK
10.6%
FEMALE DISABILITY
100.0/ 100
METRIC RATING
11th/ 347
METRIC RANK
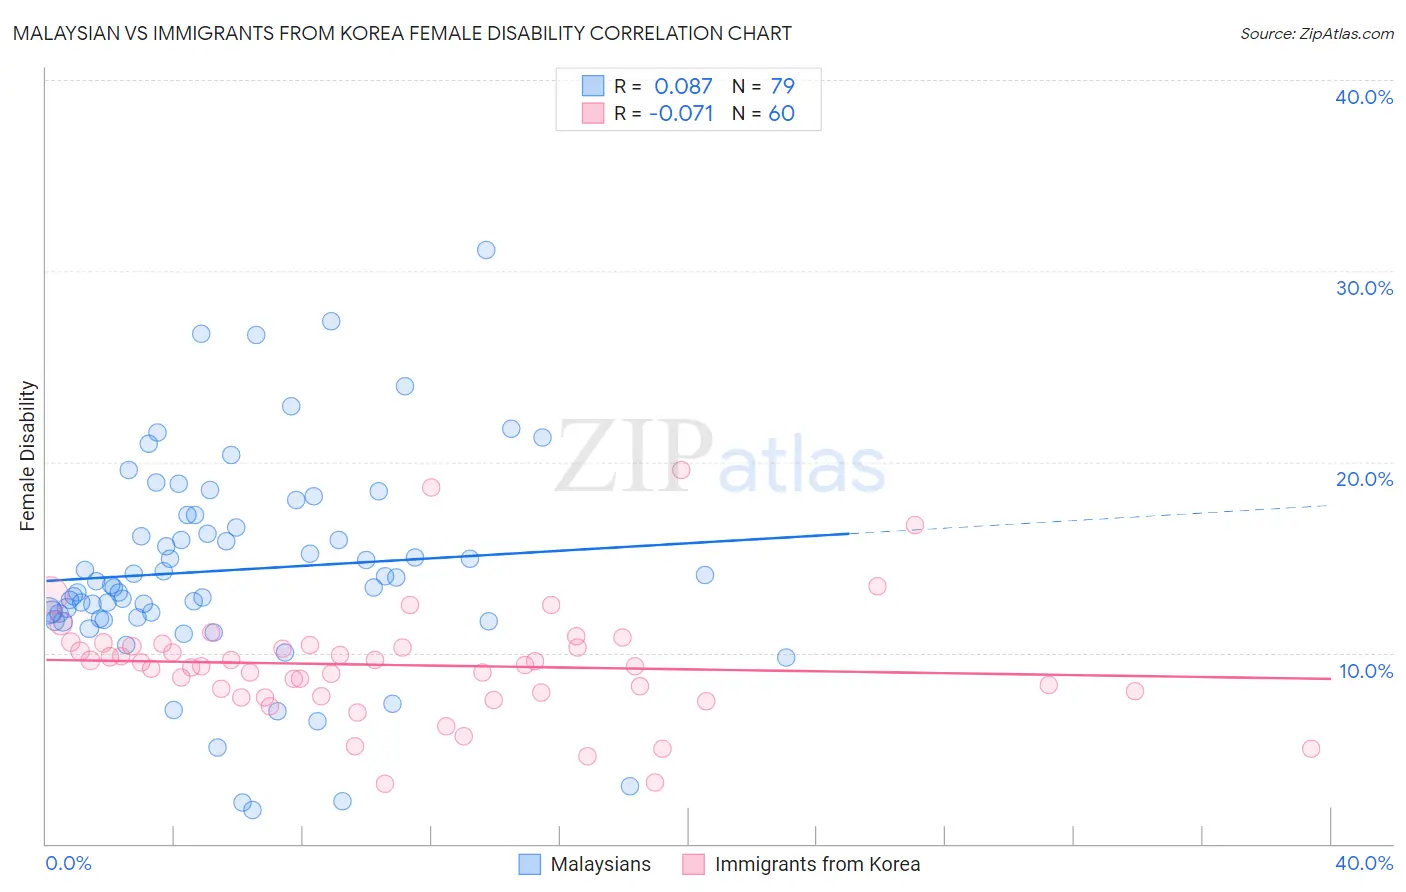
Malaysian vs Immigrants from Korea Female Disability Correlation Chart
The statistical analysis conducted on geographies consisting of 226,065,175 people shows a slight positive correlation between the proportion of Malaysians and percentage of females with a disability in the United States with a correlation coefficient (R) of 0.087 and weighted average of 12.5%. Similarly, the statistical analysis conducted on geographies consisting of 416,288,361 people shows a slight negative correlation between the proportion of Immigrants from Korea and percentage of females with a disability in the United States with a correlation coefficient (R) of -0.071 and weighted average of 10.6%, a difference of 17.8%.
Female Disability Correlation Summary
| Measurement | Malaysian | Immigrants from Korea |
| Minimum | 1.8% | 3.2% |
| Maximum | 31.1% | 19.6% |
| Range | 29.3% | 16.4% |
| Mean | 14.3% | 9.4% |
| Median | 13.5% | 9.3% |
| Interquartile 25% (IQ1) | 11.8% | 7.8% |
| Interquartile 75% (IQ3) | 17.2% | 10.4% |
| Interquartile Range (IQR) | 5.4% | 2.6% |
| Standard Deviation (Sample) | 5.5% | 3.0% |
| Standard Deviation (Population) | 5.5% | 3.0% |
Similar Demographics by Female Disability
Demographics Similar to Malaysians by Female Disability
In terms of female disability, the demographic groups most similar to Malaysians are Scandinavian (12.5%, a difference of 0.050%), Immigrants from Iraq (12.5%, a difference of 0.060%), Immigrants from West Indies (12.6%, a difference of 0.13%), Immigrants from Somalia (12.5%, a difference of 0.17%), and Belgian (12.5%, a difference of 0.25%).
| Demographics | Rating | Rank | Female Disability |
| Immigrants | Cambodia | 7.8 /100 | #228 | Tragic 12.5% |
| Hungarians | 7.2 /100 | #229 | Tragic 12.5% |
| Immigrants | Belize | 7.0 /100 | #230 | Tragic 12.5% |
| Belgians | 6.5 /100 | #231 | Tragic 12.5% |
| Immigrants | Somalia | 5.9 /100 | #232 | Tragic 12.5% |
| Immigrants | Iraq | 5.3 /100 | #233 | Tragic 12.5% |
| Scandinavians | 5.3 /100 | #234 | Tragic 12.5% |
| Malaysians | 5.0 /100 | #235 | Tragic 12.5% |
| Immigrants | West Indies | 4.4 /100 | #236 | Tragic 12.6% |
| Slavs | 3.8 /100 | #237 | Tragic 12.6% |
| Yugoslavians | 3.7 /100 | #238 | Tragic 12.6% |
| Barbadians | 3.6 /100 | #239 | Tragic 12.6% |
| German Russians | 3.2 /100 | #240 | Tragic 12.6% |
| Japanese | 2.7 /100 | #241 | Tragic 12.6% |
| Canadians | 2.6 /100 | #242 | Tragic 12.6% |
Demographics Similar to Immigrants from Korea by Female Disability
In terms of female disability, the demographic groups most similar to Immigrants from Korea are Immigrants from Hong Kong (10.6%, a difference of 0.17%), Immigrants from Israel (10.7%, a difference of 0.42%), Immigrants from Eastern Asia (10.7%, a difference of 0.49%), Immigrants from China (10.7%, a difference of 0.52%), and Iranian (10.6%, a difference of 0.82%).
| Demographics | Rating | Rank | Female Disability |
| Thais | 100.0 /100 | #4 | Exceptional 10.2% |
| Immigrants | Bolivia | 100.0 /100 | #5 | Exceptional 10.3% |
| Bolivians | 100.0 /100 | #6 | Exceptional 10.4% |
| Immigrants | Singapore | 100.0 /100 | #7 | Exceptional 10.4% |
| Immigrants | South Central Asia | 100.0 /100 | #8 | Exceptional 10.5% |
| Iranians | 100.0 /100 | #9 | Exceptional 10.6% |
| Immigrants | Hong Kong | 100.0 /100 | #10 | Exceptional 10.6% |
| Immigrants | Korea | 100.0 /100 | #11 | Exceptional 10.6% |
| Immigrants | Israel | 100.0 /100 | #12 | Exceptional 10.7% |
| Immigrants | Eastern Asia | 100.0 /100 | #13 | Exceptional 10.7% |
| Immigrants | China | 100.0 /100 | #14 | Exceptional 10.7% |
| Burmese | 100.0 /100 | #15 | Exceptional 10.7% |
| Okinawans | 100.0 /100 | #16 | Exceptional 10.8% |
| Indians (Asian) | 100.0 /100 | #17 | Exceptional 10.8% |
| Immigrants | Iran | 100.0 /100 | #18 | Exceptional 10.8% |