Laotian vs Luxembourger Disability Age Over 75

COMPARE

Laotian
Race
Ancestry
AfghanAfricanAlaska NativeAlaskan AthabascanAlbanianAleutAlsatianAmericanApacheArabArapahoArgentineanArmenianAssyrian/Chaldean/SyriacAustralianAustrianBahamianBangladeshiBarbadianBasqueBelgianBelizeanBermudanBhutaneseBlackfeetBolivianBrazilianBritishBritish West IndianBulgarianBurmeseCajunCambodianCanadianCape VerdeanCarpatho RusynCelticCentral AmericanCentral American IndianCherokeeCheyenneChickasawChileanChineseChippewaChoctawColombianColvilleComancheCosta RicanCreeCreekCroatianCrowCubanCypriotCzechCzechoslovakianDanishDelawareDominicanDutchDutch West IndianEastern EuropeanEcuadorianEgyptianEnglishEstonianEthiopianEuropeanFijianFilipinoFinnishFrenchFrench American IndianFrench CanadianGermanGerman RussianGhanaianGreekGuamanian/ChamorroGuatemalanGuyaneseHaitianHmongHonduranHopiHoumaHungarianIcelanderIndian (Asian)IndonesianInupiatIranianIraqiIrishIroquoisIsraeliItalianJamaicanJapaneseJordanianKenyanKiowaKoreanLaotianLatvianLebaneseLiberianLithuanianLumbeeMacedonianMalaysianMalteseMarshalleseMenomineeMexicanMexican American IndianMongolianMoroccanNative HawaiianNavajoNepaleseNew ZealanderNicaraguanNigerianNorthern EuropeanNorwegianOkinawanOsageOttawaPaiutePakistaniPalestinianPanamanianParaguayanPennsylvania GermanPeruvianPimaPolishPortuguesePotawatomiPuebloPuerto RicanPuget Sound SalishRomanianRussianSalvadoranSamoanScandinavianScotch-IrishScottishSeminoleSenegaleseSerbianShoshoneSierra LeoneanSiouxSlavicSlovakSloveneSomaliSouth AfricanSouth AmericanSouth American IndianSoviet UnionSpaniardSpanishSpanish AmericanSpanish American IndianSri LankanSubsaharan AfricanSudaneseSwedishSwissSyrianTaiwaneseThaiTlingit-HaidaTohono O'OdhamTonganTrinidadian and TobagonianTsimshianTurkishU.S. Virgin IslanderUgandanUkrainianUruguayanUteVenezuelanVietnameseWelshWest IndianYakamaYaquiYugoslavianYumanYup'ikZimbabwean
Immigration
NonimmigrantsImmigrantsAfghanistanAfricaAlbaniaArgentinaArmeniaAsiaAustraliaAustriaBahamasBangladeshBarbadosBelarusBelgiumBelizeBoliviaBosnia and HerzegovinaBrazilBulgariaBurma/MyanmarCabo VerdeCambodiaCameroonCanadaCaribbeanCentral AmericaChileChinaColombiaCongoCosta RicaCroatiaCubaCzechoslovakiaDenmarkDominicaDominican RepublicEastern AfricaEastern AsiaEastern EuropeEcuadorEgyptEl SalvadorEnglandEritreaEthiopiaEuropeFijiFranceGermanyGhanaGreeceGrenadaGuatemalaGuyanaHaitiHondurasHong KongHungaryIndiaIndonesiaIranIraqIrelandIsraelItalyJamaicaJapanJordanKazakhstanKenyaKoreaKuwaitLaosLatin AmericaLatviaLebanonLiberiaLithuaniaMalaysiaMexicoMicronesiaMiddle AfricaMoldovaMoroccoNepalNetherlandsNicaraguaNigeriaNorth AmericaNorth MacedoniaNorthern AfricaNorthern EuropeNorwayOceaniaPakistanPanamaPeruPhilippinesPolandPortugalRomaniaRussiaSaudi ArabiaScotlandSenegalSerbiaSierra LeoneSingaporeSomaliaSouth AfricaSouth AmericaSouth Central AsiaSouth Eastern AsiaSouthern EuropeSpainSri LankaSt. Vincent and the GrenadinesSudanSwedenSwitzerlandSyriaTaiwanThailandTrinidad and TobagoTurkeyUgandaUkraineUruguayUzbekistanVenezuelaVietnamWest IndiesWestern AfricaWestern AsiaWestern EuropeYemenZaireZimbabweAzores
Luxembourger
Race
Ancestry
AfghanAfricanAlaska NativeAlaskan AthabascanAlbanianAleutAlsatianAmericanApacheArabArapahoArgentineanArmenianAssyrian/Chaldean/SyriacAustralianAustrianBahamianBangladeshiBarbadianBasqueBelgianBelizeanBermudanBhutaneseBlackfeetBolivianBrazilianBritishBritish West IndianBulgarianBurmeseCajunCambodianCanadianCape VerdeanCarpatho RusynCelticCentral AmericanCentral American IndianCherokeeCheyenneChickasawChileanChineseChippewaChoctawColombianColvilleComancheCosta RicanCreeCreekCroatianCrowCubanCypriotCzechCzechoslovakianDanishDelawareDominicanDutchDutch West IndianEastern EuropeanEcuadorianEgyptianEnglishEstonianEthiopianEuropeanFijianFilipinoFinnishFrenchFrench American IndianFrench CanadianGermanGerman RussianGhanaianGreekGuamanian/ChamorroGuatemalanGuyaneseHaitianHmongHonduranHopiHoumaHungarianIcelanderIndian (Asian)IndonesianInupiatIranianIraqiIrishIroquoisIsraeliItalianJamaicanJapaneseJordanianKenyanKiowaKoreanLatvianLebaneseLiberianLithuanianLumbeeLuxembourgerMacedonianMalaysianMalteseMarshalleseMenomineeMexicanMexican American IndianMongolianMoroccanNative HawaiianNavajoNepaleseNew ZealanderNicaraguanNigerianNorthern EuropeanNorwegianOkinawanOsageOttawaPaiutePakistaniPalestinianPanamanianParaguayanPennsylvania GermanPeruvianPimaPolishPortuguesePotawatomiPuebloPuerto RicanPuget Sound SalishRomanianRussianSalvadoranSamoanScandinavianScotch-IrishScottishSeminoleSenegaleseSerbianShoshoneSierra LeoneanSiouxSlavicSlovakSloveneSomaliSouth AfricanSouth AmericanSouth American IndianSoviet UnionSpaniardSpanishSpanish AmericanSpanish American IndianSri LankanSubsaharan AfricanSudaneseSwedishSwissSyrianTaiwaneseThaiTlingit-HaidaTohono O'OdhamTonganTrinidadian and TobagonianTsimshianTurkishU.S. Virgin IslanderUgandanUkrainianUruguayanUteVenezuelanVietnameseWelshWest IndianYakamaYaquiYugoslavianYumanYup'ikZimbabwean
Immigration
NonimmigrantsImmigrantsAfghanistanAfricaAlbaniaArgentinaArmeniaAsiaAustraliaAustriaBahamasBangladeshBarbadosBelarusBelgiumBelizeBoliviaBosnia and HerzegovinaBrazilBulgariaBurma/MyanmarCabo VerdeCambodiaCameroonCanadaCaribbeanCentral AmericaChileChinaColombiaCongoCosta RicaCroatiaCubaCzechoslovakiaDenmarkDominicaDominican RepublicEastern AfricaEastern AsiaEastern EuropeEcuadorEgyptEl SalvadorEnglandEritreaEthiopiaEuropeFijiFranceGermanyGhanaGreeceGrenadaGuatemalaGuyanaHaitiHondurasHong KongHungaryIndiaIndonesiaIranIraqIrelandIsraelItalyJamaicaJapanJordanKazakhstanKenyaKoreaKuwaitLaosLatin AmericaLatviaLebanonLiberiaLithuaniaMalaysiaMexicoMicronesiaMiddle AfricaMoldovaMoroccoNepalNetherlandsNicaraguaNigeriaNorth AmericaNorth MacedoniaNorthern AfricaNorthern EuropeNorwayOceaniaPakistanPanamaPeruPhilippinesPolandPortugalRomaniaRussiaSaudi ArabiaScotlandSenegalSerbiaSierra LeoneSingaporeSomaliaSouth AfricaSouth AmericaSouth Central AsiaSouth Eastern AsiaSouthern EuropeSpainSri LankaSt. Vincent and the GrenadinesSudanSwedenSwitzerlandSyriaTaiwanThailandTrinidad and TobagoTurkeyUgandaUkraineUruguayUzbekistanVenezuelaVietnamWest IndiesWestern AfricaWestern AsiaWestern EuropeYemenZaireZimbabweAzores
Disability Age Over 75
Income
Poverty
Unemployment
Labor Participation
Family Structure
Vehicle Availability
Education Level
Disability

Disability Age Over 75 Comparison

Laotians

Luxembourgers

Poor
Exceptional
47.9%
DISABILITY AGE OVER 75
11.5/ 100
METRIC RATING
213th/ 347
METRIC RANK
44.8%
DISABILITY AGE OVER 75
100.0/ 100
METRIC RATING
5th/ 347
METRIC RANK

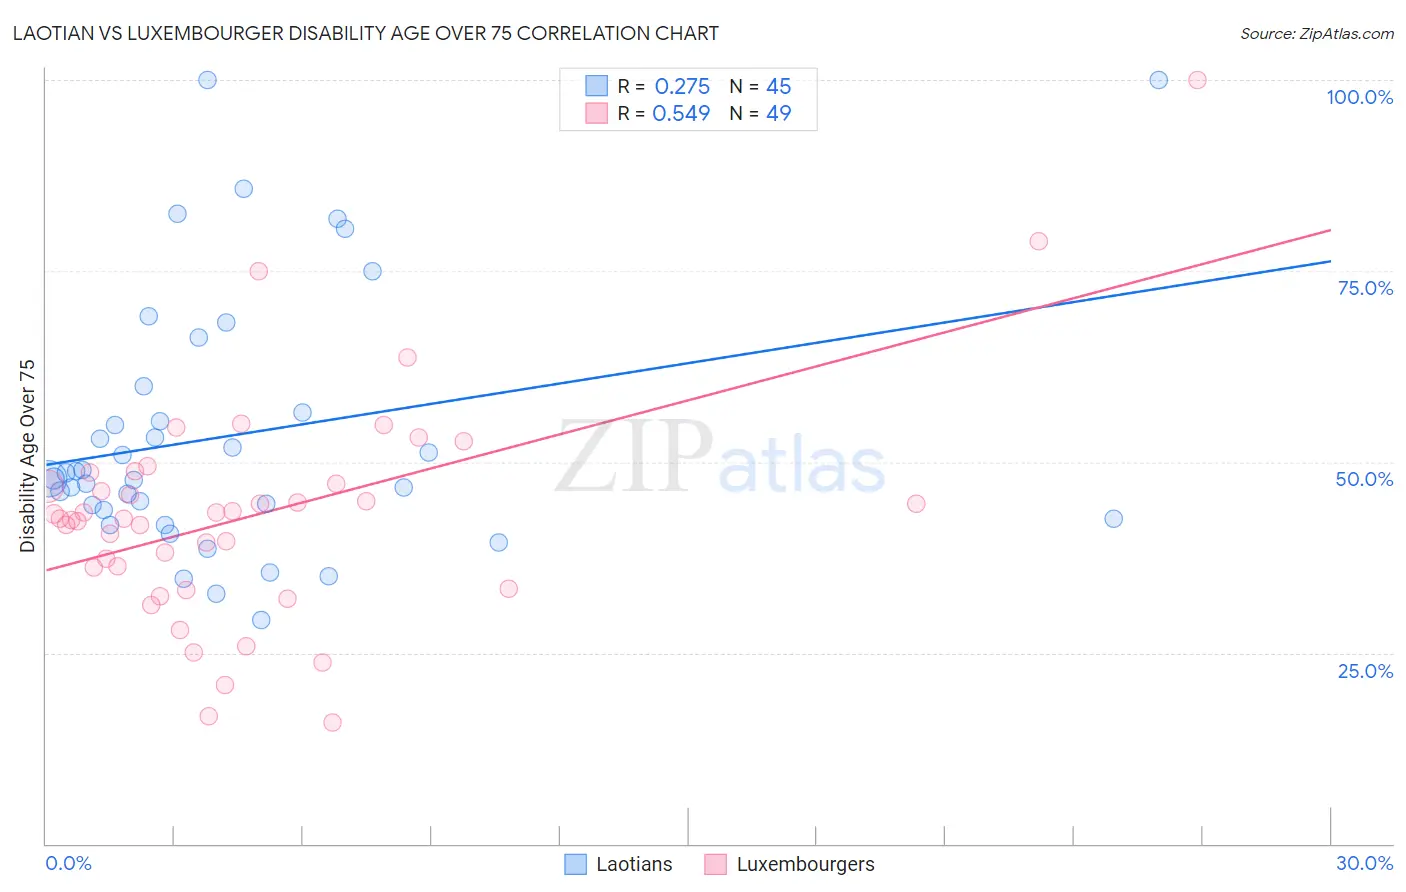
Laotian vs Luxembourger Disability Age Over 75 Correlation Chart

The statistical analysis conducted on geographies consisting of 224,625,451 people shows a weak positive correlation between the proportion of Laotians and percentage of population with a disability over the age of 75 in the United States with a correlation coefficient (R) of 0.275 and weighted average of 47.9%. Similarly, the statistical analysis conducted on geographies consisting of 144,572,010 people shows a substantial positive correlation between the proportion of Luxembourgers and percentage of population with a disability over the age of 75 in the United States with a correlation coefficient (R) of 0.549 and weighted average of 44.8%, a difference of 6.8%.
Laotian vs Luxembourger Disability Age Over 75

Disability Age Over 75 Correlation Summary

MeasurementLaotianLuxembourger
Minimum29.3%15.9%
Maximum100.0%100.0%
Range70.7%84.1%
Mean53.5%43.1%
Median47.8%42.5%
Interquartile 25% (IQ1)43.1%34.8%
Interquartile 75% (IQ3)58.2%47.9%
Interquartile Range (IQR)15.0%13.1%
Standard Deviation (Sample)17.0%14.9%
Standard Deviation (Population)16.8%14.7%

Similar Demographics by Disability Age Over 75

Demographics Similar to Laotians by Disability Age Over 75

In terms of disability age over 75, the demographic groups most similar to Laotians are Immigrants from Burma/Myanmar (47.9%, a difference of 0.010%), Vietnamese (47.9%, a difference of 0.020%), Panamanian (47.9%, a difference of 0.020%), Immigrants from Barbados (47.9%, a difference of 0.040%), and Senegalese (47.9%, a difference of 0.050%).
DemographicsRating | RankDisability Age Over 75
Jamaicans
19.0
/100
|
#206
Poor
47.7%
Immigrants | Syria
17.4
/100
|
#207
Poor
47.8%
Immigrants | Senegal
16.9
/100
|
#208
Poor
47.8%
Immigrants | Indonesia
14.2
/100
|
#209
Poor
47.8%
Vietnamese
11.9
/100
|
#210
Poor
47.9%
Panamanians
11.8
/100
|
#211
Poor
47.9%
Immigrants | Burma/Myanmar
11.7
/100
|
#212
Poor
47.9%
Laotians
11.5
/100
|
#213
Poor
47.9%
Immigrants | Barbados
10.7
/100
|
#214
Poor
47.9%
Senegalese
10.7
/100
|
#215
Poor
47.9%
Immigrants | Panama
10.2
/100
|
#216
Poor
47.9%
Immigrants | Grenada
9.4
/100
|
#217
Tragic
47.9%
Immigrants | Western Africa
8.3
/100
|
#218
Tragic
48.0%
Immigrants | Western Asia
7.5
/100
|
#219
Tragic
48.0%
Bahamians
7.4
/100
|
#220
Tragic
48.0%

Demographics Similar to Luxembourgers by Disability Age Over 75

In terms of disability age over 75, the demographic groups most similar to Luxembourgers are Carpatho Rusyn (44.8%, a difference of 0.060%), Eastern European (44.8%, a difference of 0.090%), Immigrants from Lithuania (44.9%, a difference of 0.090%), Okinawan (44.9%, a difference of 0.13%), and Immigrants from Austria (44.9%, a difference of 0.25%).
DemographicsRating | RankDisability Age Over 75
Cypriots
100.0
/100
|
#1
Exceptional
43.5%
Immigrants | Ireland
100.0
/100
|
#2
Exceptional
44.7%
Eastern Europeans
100.0
/100
|
#3
Exceptional
44.8%
Carpatho Rusyns
100.0
/100
|
#4
Exceptional
44.8%
Luxembourgers
100.0
/100
|
#5
Exceptional
44.8%
Immigrants | Lithuania
100.0
/100
|
#6
Exceptional
44.9%
Okinawans
100.0
/100
|
#7
Exceptional
44.9%
Immigrants | Austria
100.0
/100
|
#8
Exceptional
44.9%
Paraguayans
100.0
/100
|
#9
Exceptional
45.0%
Bulgarians
100.0
/100
|
#10
Exceptional
45.1%
Lithuanians
100.0
/100
|
#11
Exceptional
45.1%
Immigrants | Czechoslovakia
100.0
/100
|
#12
Exceptional
45.1%
Latvians
100.0
/100
|
#13
Exceptional
45.1%
Immigrants | Scotland
100.0
/100
|
#14
Exceptional
45.1%
Immigrants | Sweden
100.0
/100
|
#15
Exceptional
45.1%