Laotian vs Palestinian Disability Age Over 75

COMPARE

Laotian
Race
Ancestry
AfghanAfricanAlaska NativeAlaskan AthabascanAlbanianAleutAlsatianAmericanApacheArabArapahoArgentineanArmenianAssyrian/Chaldean/SyriacAustralianAustrianBahamianBangladeshiBarbadianBasqueBelgianBelizeanBermudanBhutaneseBlackfeetBolivianBrazilianBritishBritish West IndianBulgarianBurmeseCajunCambodianCanadianCape VerdeanCarpatho RusynCelticCentral AmericanCentral American IndianCherokeeCheyenneChickasawChileanChineseChippewaChoctawColombianColvilleComancheCosta RicanCreeCreekCroatianCrowCubanCypriotCzechCzechoslovakianDanishDelawareDominicanDutchDutch West IndianEastern EuropeanEcuadorianEgyptianEnglishEstonianEthiopianEuropeanFijianFilipinoFinnishFrenchFrench American IndianFrench CanadianGermanGerman RussianGhanaianGreekGuamanian/ChamorroGuatemalanGuyaneseHaitianHmongHonduranHopiHoumaHungarianIcelanderIndian (Asian)IndonesianInupiatIranianIraqiIrishIroquoisIsraeliItalianJamaicanJapaneseJordanianKenyanKiowaKoreanLaotianLatvianLebaneseLiberianLithuanianLumbeeLuxembourgerMacedonianMalaysianMalteseMarshalleseMenomineeMexicanMexican American IndianMongolianMoroccanNative HawaiianNavajoNepaleseNew ZealanderNicaraguanNigerianNorthern EuropeanNorwegianOkinawanOsageOttawaPaiutePakistaniPanamanianParaguayanPennsylvania GermanPeruvianPimaPolishPortuguesePotawatomiPuebloPuerto RicanPuget Sound SalishRomanianRussianSalvadoranSamoanScandinavianScotch-IrishScottishSeminoleSenegaleseSerbianShoshoneSierra LeoneanSiouxSlavicSlovakSloveneSomaliSouth AfricanSouth AmericanSouth American IndianSoviet UnionSpaniardSpanishSpanish AmericanSpanish American IndianSri LankanSubsaharan AfricanSudaneseSwedishSwissSyrianTaiwaneseThaiTlingit-HaidaTohono O'OdhamTonganTrinidadian and TobagonianTsimshianTurkishU.S. Virgin IslanderUgandanUkrainianUruguayanUteVenezuelanVietnameseWelshWest IndianYakamaYaquiYugoslavianYumanYup'ikZimbabwean
Immigration
NonimmigrantsImmigrantsAfghanistanAfricaAlbaniaArgentinaArmeniaAsiaAustraliaAustriaBahamasBangladeshBarbadosBelarusBelgiumBelizeBoliviaBosnia and HerzegovinaBrazilBulgariaBurma/MyanmarCabo VerdeCambodiaCameroonCanadaCaribbeanCentral AmericaChileChinaColombiaCongoCosta RicaCroatiaCubaCzechoslovakiaDenmarkDominicaDominican RepublicEastern AfricaEastern AsiaEastern EuropeEcuadorEgyptEl SalvadorEnglandEritreaEthiopiaEuropeFijiFranceGermanyGhanaGreeceGrenadaGuatemalaGuyanaHaitiHondurasHong KongHungaryIndiaIndonesiaIranIraqIrelandIsraelItalyJamaicaJapanJordanKazakhstanKenyaKoreaKuwaitLaosLatin AmericaLatviaLebanonLiberiaLithuaniaMalaysiaMexicoMicronesiaMiddle AfricaMoldovaMoroccoNepalNetherlandsNicaraguaNigeriaNorth AmericaNorth MacedoniaNorthern AfricaNorthern EuropeNorwayOceaniaPakistanPanamaPeruPhilippinesPolandPortugalRomaniaRussiaSaudi ArabiaScotlandSenegalSerbiaSierra LeoneSingaporeSomaliaSouth AfricaSouth AmericaSouth Central AsiaSouth Eastern AsiaSouthern EuropeSpainSri LankaSt. Vincent and the GrenadinesSudanSwedenSwitzerlandSyriaTaiwanThailandTrinidad and TobagoTurkeyUgandaUkraineUruguayUzbekistanVenezuelaVietnamWest IndiesWestern AfricaWestern AsiaWestern EuropeYemenZaireZimbabweAzores
Palestinian
Race
Ancestry
AfghanAfricanAlaska NativeAlaskan AthabascanAlbanianAleutAlsatianAmericanApacheArabArapahoArgentineanArmenianAssyrian/Chaldean/SyriacAustralianAustrianBahamianBangladeshiBarbadianBasqueBelgianBelizeanBermudanBhutaneseBlackfeetBolivianBrazilianBritishBritish West IndianBulgarianBurmeseCajunCambodianCanadianCape VerdeanCarpatho RusynCelticCentral AmericanCentral American IndianCherokeeCheyenneChickasawChileanChineseChippewaChoctawColombianColvilleComancheCosta RicanCreeCreekCroatianCrowCubanCypriotCzechCzechoslovakianDanishDelawareDominicanDutchDutch West IndianEastern EuropeanEcuadorianEgyptianEnglishEstonianEthiopianEuropeanFijianFilipinoFinnishFrenchFrench American IndianFrench CanadianGermanGerman RussianGhanaianGreekGuamanian/ChamorroGuatemalanGuyaneseHaitianHmongHonduranHopiHoumaHungarianIcelanderIndian (Asian)IndonesianInupiatIranianIraqiIrishIroquoisIsraeliItalianJamaicanJapaneseJordanianKenyanKiowaKoreanLatvianLebaneseLiberianLithuanianLumbeeLuxembourgerMacedonianMalaysianMalteseMarshalleseMenomineeMexicanMexican American IndianMongolianMoroccanNative HawaiianNavajoNepaleseNew ZealanderNicaraguanNigerianNorthern EuropeanNorwegianOkinawanOsageOttawaPaiutePakistaniPalestinianPanamanianParaguayanPennsylvania GermanPeruvianPimaPolishPortuguesePotawatomiPuebloPuerto RicanPuget Sound SalishRomanianRussianSalvadoranSamoanScandinavianScotch-IrishScottishSeminoleSenegaleseSerbianShoshoneSierra LeoneanSiouxSlavicSlovakSloveneSomaliSouth AfricanSouth AmericanSouth American IndianSoviet UnionSpaniardSpanishSpanish AmericanSpanish American IndianSri LankanSubsaharan AfricanSudaneseSwedishSwissSyrianTaiwaneseThaiTlingit-HaidaTohono O'OdhamTonganTrinidadian and TobagonianTsimshianTurkishU.S. Virgin IslanderUgandanUkrainianUruguayanUteVenezuelanVietnameseWelshWest IndianYakamaYaquiYugoslavianYumanYup'ikZimbabwean
Immigration
NonimmigrantsImmigrantsAfghanistanAfricaAlbaniaArgentinaArmeniaAsiaAustraliaAustriaBahamasBangladeshBarbadosBelarusBelgiumBelizeBoliviaBosnia and HerzegovinaBrazilBulgariaBurma/MyanmarCabo VerdeCambodiaCameroonCanadaCaribbeanCentral AmericaChileChinaColombiaCongoCosta RicaCroatiaCubaCzechoslovakiaDenmarkDominicaDominican RepublicEastern AfricaEastern AsiaEastern EuropeEcuadorEgyptEl SalvadorEnglandEritreaEthiopiaEuropeFijiFranceGermanyGhanaGreeceGrenadaGuatemalaGuyanaHaitiHondurasHong KongHungaryIndiaIndonesiaIranIraqIrelandIsraelItalyJamaicaJapanJordanKazakhstanKenyaKoreaKuwaitLaosLatin AmericaLatviaLebanonLiberiaLithuaniaMalaysiaMexicoMicronesiaMiddle AfricaMoldovaMoroccoNepalNetherlandsNicaraguaNigeriaNorth AmericaNorth MacedoniaNorthern AfricaNorthern EuropeNorwayOceaniaPakistanPanamaPeruPhilippinesPolandPortugalRomaniaRussiaSaudi ArabiaScotlandSenegalSerbiaSierra LeoneSingaporeSomaliaSouth AfricaSouth AmericaSouth Central AsiaSouth Eastern AsiaSouthern EuropeSpainSri LankaSt. Vincent and the GrenadinesSudanSwedenSwitzerlandSyriaTaiwanThailandTrinidad and TobagoTurkeyUgandaUkraineUruguayUzbekistanVenezuelaVietnamWest IndiesWestern AfricaWestern AsiaWestern EuropeYemenZaireZimbabweAzores
Disability Age Over 75
Income
Poverty
Unemployment
Labor Participation
Family Structure
Vehicle Availability
Education Level
Disability

Disability Age Over 75 Comparison

Laotians

Palestinians

Poor
Exceptional
47.9%
DISABILITY AGE OVER 75
11.5/ 100
METRIC RATING
213th/ 347
METRIC RANK
46.3%
DISABILITY AGE OVER 75
97.7/ 100
METRIC RATING
99th/ 347
METRIC RANK

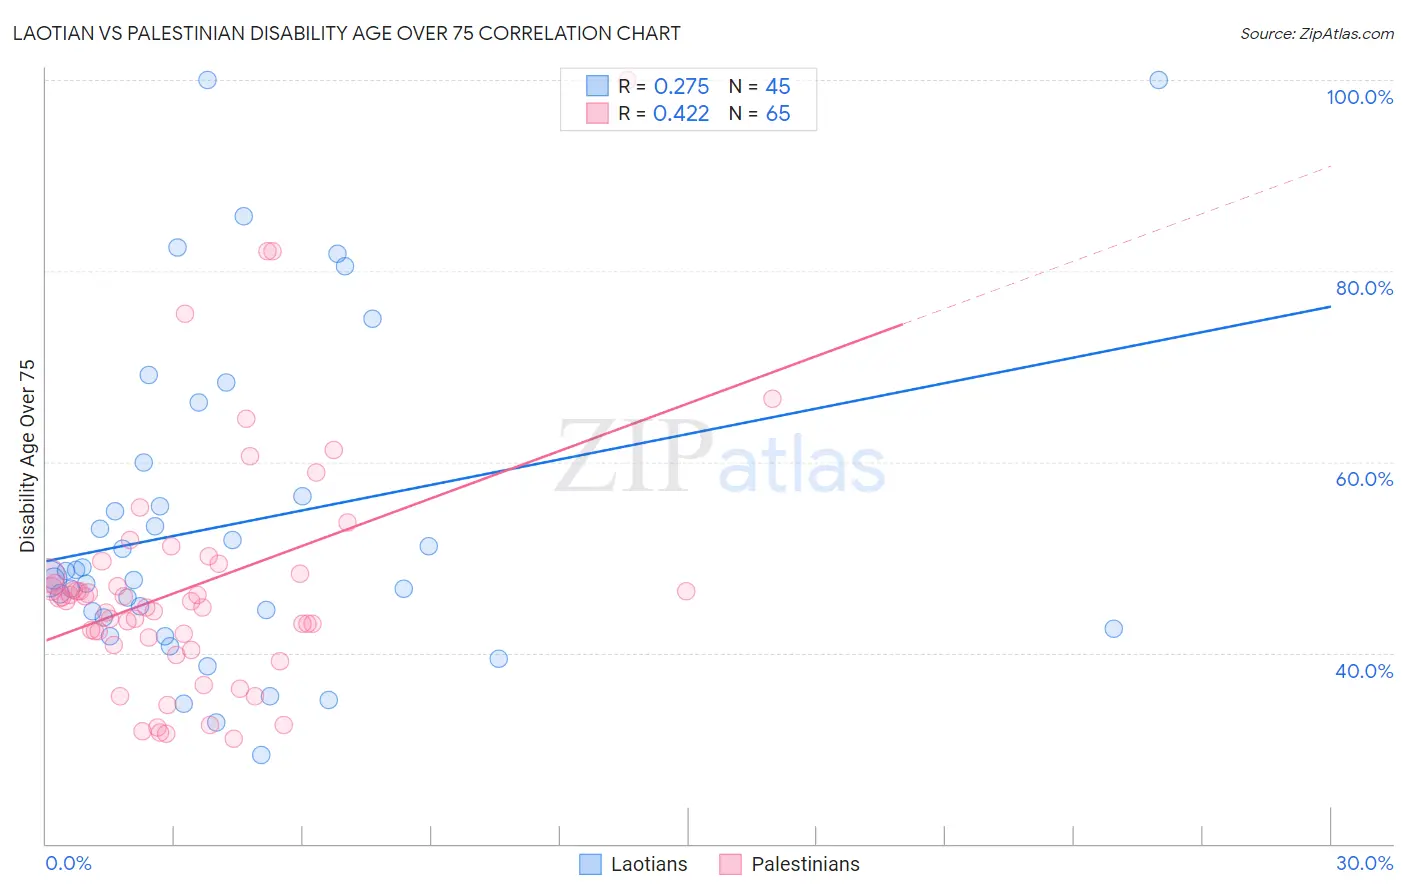
Laotian vs Palestinian Disability Age Over 75 Correlation Chart

The statistical analysis conducted on geographies consisting of 224,625,451 people shows a weak positive correlation between the proportion of Laotians and percentage of population with a disability over the age of 75 in the United States with a correlation coefficient (R) of 0.275 and weighted average of 47.9%. Similarly, the statistical analysis conducted on geographies consisting of 216,314,084 people shows a moderate positive correlation between the proportion of Palestinians and percentage of population with a disability over the age of 75 in the United States with a correlation coefficient (R) of 0.422 and weighted average of 46.3%, a difference of 3.3%.
Laotian vs Palestinian Disability Age Over 75

Disability Age Over 75 Correlation Summary

MeasurementLaotianPalestinian
Minimum29.3%31.0%
Maximum100.0%100.0%
Range70.7%69.0%
Mean53.5%47.0%
Median47.8%45.4%
Interquartile 25% (IQ1)43.1%41.2%
Interquartile 75% (IQ3)58.2%48.8%
Interquartile Range (IQR)15.0%7.5%
Standard Deviation (Sample)17.0%12.6%
Standard Deviation (Population)16.8%12.5%

Similar Demographics by Disability Age Over 75

Demographics Similar to Laotians by Disability Age Over 75

In terms of disability age over 75, the demographic groups most similar to Laotians are Immigrants from Burma/Myanmar (47.9%, a difference of 0.010%), Vietnamese (47.9%, a difference of 0.020%), Panamanian (47.9%, a difference of 0.020%), Immigrants from Barbados (47.9%, a difference of 0.040%), and Senegalese (47.9%, a difference of 0.050%).
DemographicsRating | RankDisability Age Over 75
Jamaicans
19.0
/100
|
#206
Poor
47.7%
Immigrants | Syria
17.4
/100
|
#207
Poor
47.8%
Immigrants | Senegal
16.9
/100
|
#208
Poor
47.8%
Immigrants | Indonesia
14.2
/100
|
#209
Poor
47.8%
Vietnamese
11.9
/100
|
#210
Poor
47.9%
Panamanians
11.8
/100
|
#211
Poor
47.9%
Immigrants | Burma/Myanmar
11.7
/100
|
#212
Poor
47.9%
Laotians
11.5
/100
|
#213
Poor
47.9%
Immigrants | Barbados
10.7
/100
|
#214
Poor
47.9%
Senegalese
10.7
/100
|
#215
Poor
47.9%
Immigrants | Panama
10.2
/100
|
#216
Poor
47.9%
Immigrants | Grenada
9.4
/100
|
#217
Tragic
47.9%
Immigrants | Western Africa
8.3
/100
|
#218
Tragic
48.0%
Immigrants | Western Asia
7.5
/100
|
#219
Tragic
48.0%
Bahamians
7.4
/100
|
#220
Tragic
48.0%

Demographics Similar to Palestinians by Disability Age Over 75

In terms of disability age over 75, the demographic groups most similar to Palestinians are Immigrants from Eastern Europe (46.3%, a difference of 0.0%), Mongolian (46.3%, a difference of 0.0%), Immigrants from Japan (46.3%, a difference of 0.040%), Finnish (46.3%, a difference of 0.050%), and Immigrants from China (46.3%, a difference of 0.070%).
DemographicsRating | RankDisability Age Over 75
Germans
98.2
/100
|
#92
Exceptional
46.3%
Ugandans
98.2
/100
|
#93
Exceptional
46.3%
Albanians
98.1
/100
|
#94
Exceptional
46.3%
Immigrants | Brazil
98.0
/100
|
#95
Exceptional
46.3%
Immigrants | China
98.0
/100
|
#96
Exceptional
46.3%
Finns
97.9
/100
|
#97
Exceptional
46.3%
Immigrants | Japan
97.8
/100
|
#98
Exceptional
46.3%
Palestinians
97.7
/100
|
#99
Exceptional
46.3%
Immigrants | Eastern Europe
97.7
/100
|
#100
Exceptional
46.3%
Mongolians
97.7
/100
|
#101
Exceptional
46.3%
Immigrants | Malaysia
97.1
/100
|
#102
Exceptional
46.4%
Ukrainians
97.1
/100
|
#103
Exceptional
46.4%
Israelis
97.0
/100
|
#104
Exceptional
46.4%
Immigrants | Cameroon
96.9
/100
|
#105
Exceptional
46.4%
Immigrants | Kuwait
96.8
/100
|
#106
Exceptional
46.4%