Inupiat vs Immigrants from Netherlands Female Disability

COMPARE

Inupiat
Race
Ancestry
AfghanAfricanAlaska NativeAlaskan AthabascanAlbanianAleutAlsatianAmericanApacheArabArapahoArgentineanArmenianAssyrian/Chaldean/SyriacAustralianAustrianBahamianBangladeshiBarbadianBasqueBelgianBelizeanBermudanBhutaneseBlackfeetBolivianBrazilianBritishBritish West IndianBulgarianBurmeseCajunCambodianCanadianCape VerdeanCarpatho RusynCelticCentral AmericanCentral American IndianCherokeeCheyenneChickasawChileanChineseChippewaChoctawColombianColvilleComancheCosta RicanCreeCreekCroatianCrowCubanCypriotCzechCzechoslovakianDanishDelawareDominicanDutchDutch West IndianEastern EuropeanEcuadorianEgyptianEnglishEstonianEthiopianEuropeanFijianFilipinoFinnishFrenchFrench American IndianFrench CanadianGermanGerman RussianGhanaianGreekGuamanian/ChamorroGuatemalanGuyaneseHaitianHmongHonduranHopiHoumaHungarianIcelanderIndian (Asian)IndonesianInupiatIranianIraqiIrishIroquoisIsraeliItalianJamaicanJapaneseJordanianKenyanKiowaKoreanLaotianLatvianLebaneseLiberianLithuanianLumbeeLuxembourgerMacedonianMalaysianMalteseMarshalleseMenomineeMexicanMexican American IndianMongolianMoroccanNative HawaiianNavajoNepaleseNew ZealanderNicaraguanNigerianNorthern EuropeanNorwegianOkinawanOsageOttawaPaiutePakistaniPalestinianPanamanianParaguayanPennsylvania GermanPeruvianPimaPolishPortuguesePotawatomiPuebloPuerto RicanPuget Sound SalishRomanianRussianSalvadoranSamoanScandinavianScotch-IrishScottishSeminoleSenegaleseSerbianShoshoneSierra LeoneanSiouxSlavicSlovakSloveneSomaliSouth AfricanSouth AmericanSouth American IndianSoviet UnionSpaniardSpanishSpanish AmericanSpanish American IndianSri LankanSubsaharan AfricanSudaneseSwedishSwissSyrianTaiwaneseThaiTlingit-HaidaTohono O'OdhamTonganTrinidadian and TobagonianTsimshianTurkishU.S. Virgin IslanderUgandanUkrainianUruguayanUteVenezuelanVietnameseWelshWest IndianYakamaYaquiYugoslavianYumanYup'ikZimbabwean
Immigration
NonimmigrantsImmigrantsAfghanistanAfricaAlbaniaArgentinaArmeniaAsiaAustraliaAustriaBahamasBangladeshBarbadosBelarusBelgiumBelizeBoliviaBosnia and HerzegovinaBrazilBulgariaBurma/MyanmarCabo VerdeCambodiaCameroonCanadaCaribbeanCentral AmericaChileChinaColombiaCongoCosta RicaCroatiaCubaCzechoslovakiaDenmarkDominicaDominican RepublicEastern AfricaEastern AsiaEastern EuropeEcuadorEgyptEl SalvadorEnglandEritreaEthiopiaEuropeFijiFranceGermanyGhanaGreeceGrenadaGuatemalaGuyanaHaitiHondurasHong KongHungaryIndiaIndonesiaIranIraqIrelandIsraelItalyJamaicaJapanJordanKazakhstanKenyaKoreaKuwaitLaosLatin AmericaLatviaLebanonLiberiaLithuaniaMalaysiaMexicoMicronesiaMiddle AfricaMoldovaMoroccoNepalNicaraguaNigeriaNorth AmericaNorth MacedoniaNorthern AfricaNorthern EuropeNorwayOceaniaPakistanPanamaPeruPhilippinesPolandPortugalRomaniaRussiaSaudi ArabiaScotlandSenegalSerbiaSierra LeoneSingaporeSomaliaSouth AfricaSouth AmericaSouth Central AsiaSouth Eastern AsiaSouthern EuropeSpainSri LankaSt. Vincent and the GrenadinesSudanSwedenSwitzerlandSyriaTaiwanThailandTrinidad and TobagoTurkeyUgandaUkraineUruguayUzbekistanVenezuelaVietnamWest IndiesWestern AfricaWestern AsiaWestern EuropeYemenZaireZimbabweAzores
Immigrants from Netherlands
Race
Ancestry
AfghanAfricanAlaska NativeAlaskan AthabascanAlbanianAleutAlsatianAmericanApacheArabArapahoArgentineanArmenianAssyrian/Chaldean/SyriacAustralianAustrianBahamianBangladeshiBarbadianBasqueBelgianBelizeanBermudanBhutaneseBlackfeetBolivianBrazilianBritishBritish West IndianBulgarianBurmeseCajunCambodianCanadianCape VerdeanCarpatho RusynCelticCentral AmericanCentral American IndianCherokeeCheyenneChickasawChileanChineseChippewaChoctawColombianColvilleComancheCosta RicanCreeCreekCroatianCrowCubanCypriotCzechCzechoslovakianDanishDelawareDominicanDutchDutch West IndianEastern EuropeanEcuadorianEgyptianEnglishEstonianEthiopianEuropeanFijianFilipinoFinnishFrenchFrench American IndianFrench CanadianGermanGerman RussianGhanaianGreekGuamanian/ChamorroGuatemalanGuyaneseHaitianHmongHonduranHopiHoumaHungarianIcelanderIndian (Asian)IndonesianIranianIraqiIrishIroquoisIsraeliItalianJamaicanJapaneseJordanianKenyanKiowaKoreanLaotianLatvianLebaneseLiberianLithuanianLumbeeLuxembourgerMacedonianMalaysianMalteseMarshalleseMenomineeMexicanMexican American IndianMongolianMoroccanNative HawaiianNavajoNepaleseNew ZealanderNicaraguanNigerianNorthern EuropeanNorwegianOkinawanOsageOttawaPaiutePakistaniPalestinianPanamanianParaguayanPennsylvania GermanPeruvianPimaPolishPortuguesePotawatomiPuebloPuerto RicanPuget Sound SalishRomanianRussianSalvadoranSamoanScandinavianScotch-IrishScottishSeminoleSenegaleseSerbianShoshoneSierra LeoneanSiouxSlavicSlovakSloveneSomaliSouth AfricanSouth AmericanSouth American IndianSoviet UnionSpaniardSpanishSpanish AmericanSpanish American IndianSri LankanSubsaharan AfricanSudaneseSwedishSwissSyrianTaiwaneseThaiTlingit-HaidaTohono O'OdhamTonganTrinidadian and TobagonianTsimshianTurkishU.S. Virgin IslanderUgandanUkrainianUruguayanUteVenezuelanVietnameseWelshWest IndianYakamaYaquiYugoslavianYumanYup'ikZimbabwean
Immigration
NonimmigrantsImmigrantsAfghanistanAfricaAlbaniaArgentinaArmeniaAsiaAustraliaAustriaBahamasBangladeshBarbadosBelarusBelgiumBelizeBoliviaBosnia and HerzegovinaBrazilBulgariaBurma/MyanmarCabo VerdeCambodiaCameroonCanadaCaribbeanCentral AmericaChileChinaColombiaCongoCosta RicaCroatiaCubaCzechoslovakiaDenmarkDominicaDominican RepublicEastern AfricaEastern AsiaEastern EuropeEcuadorEgyptEl SalvadorEnglandEritreaEthiopiaEuropeFijiFranceGermanyGhanaGreeceGrenadaGuatemalaGuyanaHaitiHondurasHong KongHungaryIndiaIndonesiaIranIraqIrelandIsraelItalyJamaicaJapanJordanKazakhstanKenyaKoreaKuwaitLaosLatin AmericaLatviaLebanonLiberiaLithuaniaMalaysiaMexicoMicronesiaMiddle AfricaMoldovaMoroccoNepalNetherlandsNicaraguaNigeriaNorth AmericaNorth MacedoniaNorthern AfricaNorthern EuropeNorwayOceaniaPakistanPanamaPeruPhilippinesPolandPortugalRomaniaRussiaSaudi ArabiaScotlandSenegalSerbiaSierra LeoneSingaporeSomaliaSouth AfricaSouth AmericaSouth Central AsiaSouth Eastern AsiaSouthern EuropeSpainSri LankaSt. Vincent and the GrenadinesSudanSwedenSwitzerlandSyriaTaiwanThailandTrinidad and TobagoTurkeyUgandaUkraineUruguayUzbekistanVenezuelaVietnamWest IndiesWestern AfricaWestern AsiaWestern EuropeYemenZaireZimbabweAzores
Female Disability
Income
Poverty
Unemployment
Labor Participation
Family Structure
Vehicle Availability
Education Level
Disability

Female Disability Comparison

Inupiat

Immigrants from Netherlands

Exceptional
Exceptional
11.3%
FEMALE DISABILITY
100.0/ 100
METRIC RATING
50th/ 347
METRIC RANK
11.8%
FEMALE DISABILITY
96.9/ 100
METRIC RATING
121st/ 347
METRIC RANK

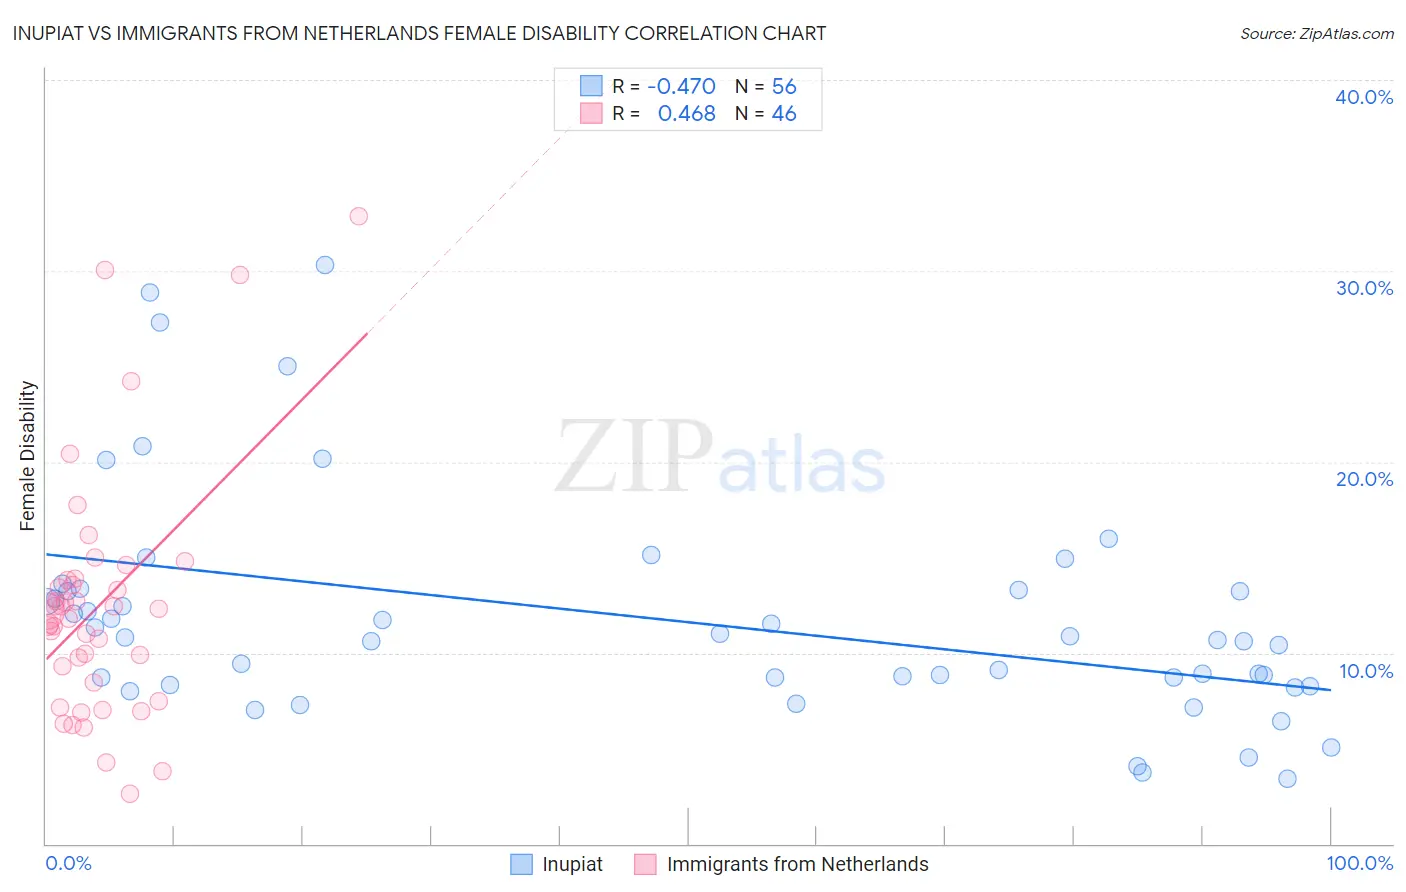
Inupiat vs Immigrants from Netherlands Female Disability Correlation Chart

The statistical analysis conducted on geographies consisting of 96,332,490 people shows a moderate negative correlation between the proportion of Inupiat and percentage of females with a disability in the United States with a correlation coefficient (R) of -0.470 and weighted average of 11.3%. Similarly, the statistical analysis conducted on geographies consisting of 237,879,368 people shows a moderate positive correlation between the proportion of Immigrants from Netherlands and percentage of females with a disability in the United States with a correlation coefficient (R) of 0.468 and weighted average of 11.8%, a difference of 4.4%.
Inupiat vs Immigrants from Netherlands Female Disability

Female Disability Correlation Summary

MeasurementInupiatImmigrants from Netherlands
Minimum3.4%2.6%
Maximum30.3%32.9%
Range26.9%30.2%
Mean11.8%12.5%
Median10.7%12.0%
Interquartile 25% (IQ1)8.5%8.4%
Interquartile 75% (IQ3)13.3%13.8%
Interquartile Range (IQR)4.8%5.4%
Standard Deviation (Sample)5.9%6.4%
Standard Deviation (Population)5.8%6.3%

Similar Demographics by Female Disability

Demographics Similar to Inupiat by Female Disability

In terms of female disability, the demographic groups most similar to Inupiat are Immigrants from Belgium (11.3%, a difference of 0.080%), Immigrants from Peru (11.3%, a difference of 0.20%), Tongan (11.3%, a difference of 0.23%), Jordanian (11.3%, a difference of 0.24%), and Zimbabwean (11.3%, a difference of 0.24%).
DemographicsRating | RankFemale Disability
Afghans
100.0
/100
|
#43
Exceptional
11.2%
Cambodians
100.0
/100
|
#44
Exceptional
11.3%
Immigrants | Sweden
100.0
/100
|
#45
Exceptional
11.3%
Immigrants | Nepal
100.0
/100
|
#46
Exceptional
11.3%
Jordanians
100.0
/100
|
#47
Exceptional
11.3%
Zimbabweans
100.0
/100
|
#48
Exceptional
11.3%
Tongans
100.0
/100
|
#49
Exceptional
11.3%
Inupiat
100.0
/100
|
#50
Exceptional
11.3%
Immigrants | Belgium
100.0
/100
|
#51
Exceptional
11.3%
Immigrants | Peru
99.9
/100
|
#52
Exceptional
11.3%
Immigrants | Saudi Arabia
99.9
/100
|
#53
Exceptional
11.3%
Peruvians
99.9
/100
|
#54
Exceptional
11.3%
Bulgarians
99.9
/100
|
#55
Exceptional
11.3%
Taiwanese
99.9
/100
|
#56
Exceptional
11.4%
South Americans
99.9
/100
|
#57
Exceptional
11.4%

Demographics Similar to Immigrants from Netherlands by Female Disability

In terms of female disability, the demographic groups most similar to Immigrants from Netherlands are Immigrants from North Macedonia (11.8%, a difference of 0.010%), Immigrants from Kazakhstan (11.8%, a difference of 0.030%), Immigrants from Croatia (11.8%, a difference of 0.060%), Immigrants from Eastern Europe (11.8%, a difference of 0.11%), and Immigrants from Nigeria (11.8%, a difference of 0.11%).
DemographicsRating | RankFemale Disability
South Africans
97.7
/100
|
#114
Exceptional
11.8%
Brazilians
97.7
/100
|
#115
Exceptional
11.8%
Immigrants | Morocco
97.6
/100
|
#116
Exceptional
11.8%
Immigrants | Eastern Europe
97.2
/100
|
#117
Exceptional
11.8%
Immigrants | Nigeria
97.2
/100
|
#118
Exceptional
11.8%
Immigrants | Uganda
97.2
/100
|
#119
Exceptional
11.8%
Immigrants | Kazakhstan
97.0
/100
|
#120
Exceptional
11.8%
Immigrants | Netherlands
96.9
/100
|
#121
Exceptional
11.8%
Immigrants | North Macedonia
96.8
/100
|
#122
Exceptional
11.8%
Immigrants | Croatia
96.7
/100
|
#123
Exceptional
11.8%
Russians
96.5
/100
|
#124
Exceptional
11.8%
Immigrants | Italy
96.4
/100
|
#125
Exceptional
11.8%
Immigrants | Europe
96.2
/100
|
#126
Exceptional
11.8%
South American Indians
95.8
/100
|
#127
Exceptional
11.8%
Immigrants | Latvia
95.6
/100
|
#128
Exceptional
11.8%