Indonesian vs Immigrants from Russia Male Disability
COMPARE
Indonesian
Immigrants from Russia
Male Disability
Male Disability Comparison
Indonesians
Immigrants from Russia
11.6%
MALE DISABILITY
5.9/ 100
METRIC RATING
215th/ 347
METRIC RANK
10.6%
MALE DISABILITY
98.6/ 100
METRIC RATING
78th/ 347
METRIC RANK
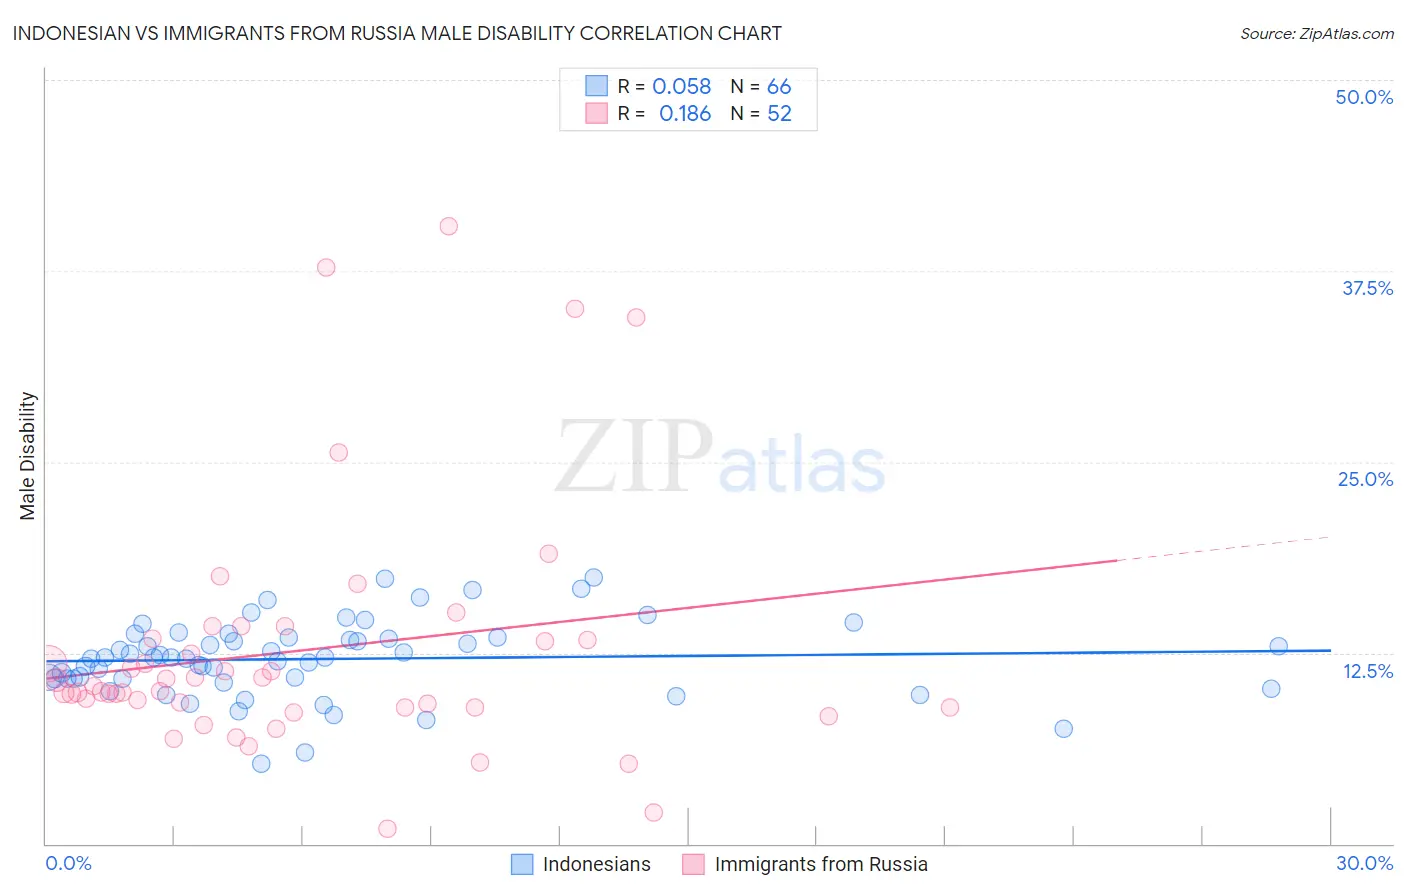
Indonesian vs Immigrants from Russia Male Disability Correlation Chart
The statistical analysis conducted on geographies consisting of 162,722,294 people shows a slight positive correlation between the proportion of Indonesians and percentage of males with a disability in the United States with a correlation coefficient (R) of 0.058 and weighted average of 11.6%. Similarly, the statistical analysis conducted on geographies consisting of 347,901,203 people shows a poor positive correlation between the proportion of Immigrants from Russia and percentage of males with a disability in the United States with a correlation coefficient (R) of 0.186 and weighted average of 10.6%, a difference of 10.3%.
Male Disability Correlation Summary
| Measurement | Indonesian | Immigrants from Russia |
| Minimum | 5.2% | 0.96% |
| Maximum | 17.5% | 40.4% |
| Range | 12.2% | 39.4% |
| Mean | 12.1% | 12.6% |
| Median | 12.2% | 10.2% |
| Interquartile 25% (IQ1) | 10.8% | 9.0% |
| Interquartile 75% (IQ3) | 13.5% | 13.4% |
| Interquartile Range (IQR) | 2.7% | 4.4% |
| Standard Deviation (Sample) | 2.5% | 8.1% |
| Standard Deviation (Population) | 2.5% | 8.0% |
Similar Demographics by Male Disability
Demographics Similar to Indonesians by Male Disability
In terms of male disability, the demographic groups most similar to Indonesians are Lithuanian (11.6%, a difference of 0.16%), Immigrants from Dominican Republic (11.7%, a difference of 0.28%), Immigrants from Dominica (11.7%, a difference of 0.34%), Mexican American Indian (11.6%, a difference of 0.40%), and Immigrants from Scotland (11.6%, a difference of 0.48%).
| Demographics | Rating | Rank | Male Disability |
| Icelanders | 10.1 /100 | #208 | Poor 11.6% |
| Spanish American Indians | 10.1 /100 | #209 | Poor 11.6% |
| Ute | 9.4 /100 | #210 | Tragic 11.6% |
| Immigrants | Thailand | 8.4 /100 | #211 | Tragic 11.6% |
| Immigrants | Scotland | 8.2 /100 | #212 | Tragic 11.6% |
| Mexican American Indians | 7.8 /100 | #213 | Tragic 11.6% |
| Lithuanians | 6.6 /100 | #214 | Tragic 11.6% |
| Indonesians | 5.9 /100 | #215 | Tragic 11.6% |
| Immigrants | Dominican Republic | 4.9 /100 | #216 | Tragic 11.7% |
| Immigrants | Dominica | 4.6 /100 | #217 | Tragic 11.7% |
| Immigrants | England | 4.0 /100 | #218 | Tragic 11.7% |
| Panamanians | 3.8 /100 | #219 | Tragic 11.7% |
| Immigrants | Western Europe | 3.8 /100 | #220 | Tragic 11.7% |
| Immigrants | Congo | 3.7 /100 | #221 | Tragic 11.7% |
| Alsatians | 3.3 /100 | #222 | Tragic 11.7% |
Demographics Similar to Immigrants from Russia by Male Disability
In terms of male disability, the demographic groups most similar to Immigrants from Russia are Laotian (10.6%, a difference of 0.020%), Immigrants from Sierra Leone (10.5%, a difference of 0.080%), Sierra Leonean (10.5%, a difference of 0.12%), Zimbabwean (10.6%, a difference of 0.23%), and Immigrants from Lebanon (10.5%, a difference of 0.24%).
| Demographics | Rating | Rank | Male Disability |
| Immigrants | Cameroon | 99.0 /100 | #71 | Exceptional 10.5% |
| Immigrants | Serbia | 99.0 /100 | #72 | Exceptional 10.5% |
| Immigrants | Lithuania | 98.9 /100 | #73 | Exceptional 10.5% |
| Immigrants | Lebanon | 98.8 /100 | #74 | Exceptional 10.5% |
| Sierra Leoneans | 98.7 /100 | #75 | Exceptional 10.5% |
| Immigrants | Sierra Leone | 98.7 /100 | #76 | Exceptional 10.5% |
| Laotians | 98.6 /100 | #77 | Exceptional 10.6% |
| Immigrants | Russia | 98.6 /100 | #78 | Exceptional 10.6% |
| Zimbabweans | 98.4 /100 | #79 | Exceptional 10.6% |
| Immigrants | Jordan | 98.4 /100 | #80 | Exceptional 10.6% |
| Immigrants | Chile | 98.3 /100 | #81 | Exceptional 10.6% |
| Immigrants | Guyana | 98.2 /100 | #82 | Exceptional 10.6% |
| Immigrants | Poland | 98.1 /100 | #83 | Exceptional 10.6% |
| Bulgarians | 98.1 /100 | #84 | Exceptional 10.6% |
| Sri Lankans | 97.9 /100 | #85 | Exceptional 10.6% |