Immigrants from Sierra Leone vs Navajo Female Disability
COMPARE
Immigrants from Sierra Leone
Navajo
Female Disability
Female Disability Comparison
Immigrants from Sierra Leone
Navajo
11.6%
FEMALE DISABILITY
99.4/ 100
METRIC RATING
93rd/ 347
METRIC RANK
14.2%
FEMALE DISABILITY
0.0/ 100
METRIC RATING
325th/ 347
METRIC RANK
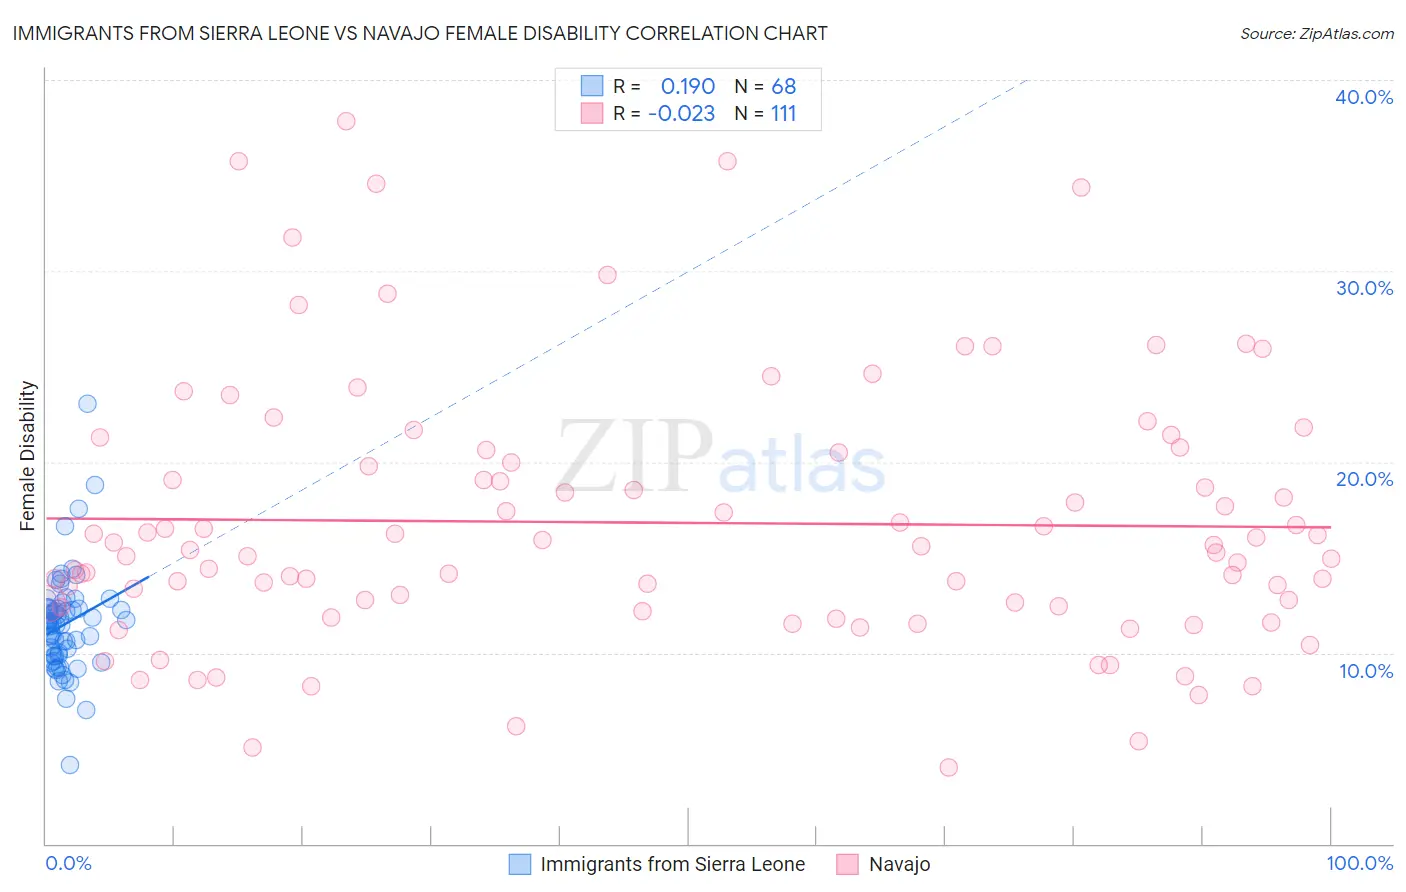
Immigrants from Sierra Leone vs Navajo Female Disability Correlation Chart
The statistical analysis conducted on geographies consisting of 101,646,950 people shows a poor positive correlation between the proportion of Immigrants from Sierra Leone and percentage of females with a disability in the United States with a correlation coefficient (R) of 0.190 and weighted average of 11.6%. Similarly, the statistical analysis conducted on geographies consisting of 224,768,780 people shows no correlation between the proportion of Navajo and percentage of females with a disability in the United States with a correlation coefficient (R) of -0.023 and weighted average of 14.2%, a difference of 22.1%.
Female Disability Correlation Summary
| Measurement | Immigrants from Sierra Leone | Navajo |
| Minimum | 4.1% | 4.0% |
| Maximum | 23.1% | 37.8% |
| Range | 18.9% | 33.8% |
| Mean | 11.5% | 16.8% |
| Median | 11.5% | 15.4% |
| Interquartile 25% (IQ1) | 9.8% | 12.5% |
| Interquartile 75% (IQ3) | 12.3% | 20.5% |
| Interquartile Range (IQR) | 2.5% | 8.0% |
| Standard Deviation (Sample) | 2.7% | 6.9% |
| Standard Deviation (Population) | 2.7% | 6.9% |
Similar Demographics by Female Disability
Demographics Similar to Immigrants from Sierra Leone by Female Disability
In terms of female disability, the demographic groups most similar to Immigrants from Sierra Leone are Immigrants from Brazil (11.6%, a difference of 0.030%), Immigrants from Czechoslovakia (11.6%, a difference of 0.10%), Immigrants from Northern Europe (11.6%, a difference of 0.10%), Immigrants from Zimbabwe (11.6%, a difference of 0.11%), and Vietnamese (11.6%, a difference of 0.12%).
| Demographics | Rating | Rank | Female Disability |
| Immigrants | Cameroon | 99.6 /100 | #86 | Exceptional 11.6% |
| Immigrants | Denmark | 99.5 /100 | #87 | Exceptional 11.6% |
| Yup'ik | 99.5 /100 | #88 | Exceptional 11.6% |
| Vietnamese | 99.5 /100 | #89 | Exceptional 11.6% |
| Immigrants | Romania | 99.5 /100 | #90 | Exceptional 11.6% |
| Immigrants | Zimbabwe | 99.5 /100 | #91 | Exceptional 11.6% |
| Immigrants | Czechoslovakia | 99.5 /100 | #92 | Exceptional 11.6% |
| Immigrants | Sierra Leone | 99.4 /100 | #93 | Exceptional 11.6% |
| Immigrants | Brazil | 99.4 /100 | #94 | Exceptional 11.6% |
| Immigrants | Northern Europe | 99.4 /100 | #95 | Exceptional 11.6% |
| Immigrants | Russia | 99.0 /100 | #96 | Exceptional 11.7% |
| Koreans | 99.0 /100 | #97 | Exceptional 11.7% |
| Uruguayans | 98.8 /100 | #98 | Exceptional 11.7% |
| Immigrants | Philippines | 98.6 /100 | #99 | Exceptional 11.7% |
| Immigrants | Uruguay | 98.5 /100 | #100 | Exceptional 11.7% |
Demographics Similar to Navajo by Female Disability
In terms of female disability, the demographic groups most similar to Navajo are Comanche (14.2%, a difference of 0.11%), Native/Alaskan (14.1%, a difference of 0.14%), Black/African American (14.1%, a difference of 0.16%), Pueblo (14.1%, a difference of 0.32%), and Potawatomi (14.1%, a difference of 0.33%).
| Demographics | Rating | Rank | Female Disability |
| Paiute | 0.0 /100 | #318 | Tragic 14.0% |
| Iroquois | 0.0 /100 | #319 | Tragic 14.0% |
| Americans | 0.0 /100 | #320 | Tragic 14.1% |
| Potawatomi | 0.0 /100 | #321 | Tragic 14.1% |
| Pueblo | 0.0 /100 | #322 | Tragic 14.1% |
| Blacks/African Americans | 0.0 /100 | #323 | Tragic 14.1% |
| Natives/Alaskans | 0.0 /100 | #324 | Tragic 14.1% |
| Navajo | 0.0 /100 | #325 | Tragic 14.2% |
| Comanche | 0.0 /100 | #326 | Tragic 14.2% |
| Ottawa | 0.0 /100 | #327 | Tragic 14.2% |
| Cape Verdeans | 0.0 /100 | #328 | Tragic 14.2% |
| Osage | 0.0 /100 | #329 | Tragic 14.3% |
| Yuman | 0.0 /100 | #330 | Tragic 14.5% |
| Immigrants | Cabo Verde | 0.0 /100 | #331 | Tragic 14.6% |
| Pima | 0.0 /100 | #332 | Tragic 14.8% |