Austrian vs Navajo Female Disability
COMPARE
Austrian
Navajo
Female Disability
Female Disability Comparison
Austrians
Navajo
12.3%
FEMALE DISABILITY
33.3/ 100
METRIC RATING
186th/ 347
METRIC RANK
14.2%
FEMALE DISABILITY
0.0/ 100
METRIC RATING
325th/ 347
METRIC RANK
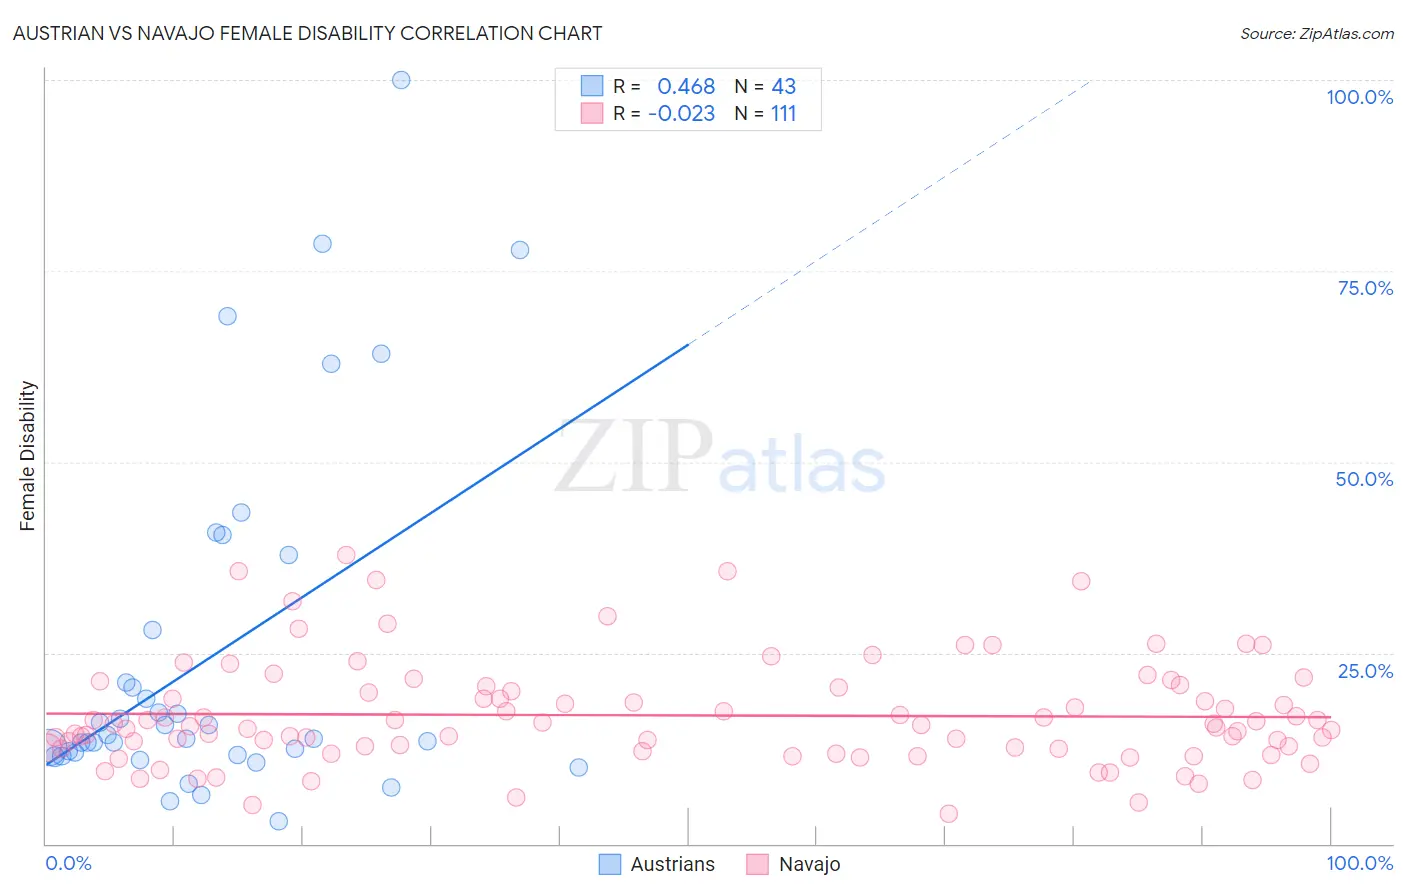
Austrian vs Navajo Female Disability Correlation Chart
The statistical analysis conducted on geographies consisting of 452,021,932 people shows a moderate positive correlation between the proportion of Austrians and percentage of females with a disability in the United States with a correlation coefficient (R) of 0.468 and weighted average of 12.3%. Similarly, the statistical analysis conducted on geographies consisting of 224,768,780 people shows no correlation between the proportion of Navajo and percentage of females with a disability in the United States with a correlation coefficient (R) of -0.023 and weighted average of 14.2%, a difference of 15.4%.
Female Disability Correlation Summary
| Measurement | Austrian | Navajo |
| Minimum | 2.9% | 4.0% |
| Maximum | 100.0% | 37.8% |
| Range | 97.1% | 33.8% |
| Mean | 24.5% | 16.8% |
| Median | 13.7% | 15.4% |
| Interquartile 25% (IQ1) | 11.6% | 12.5% |
| Interquartile 75% (IQ3) | 28.0% | 20.5% |
| Interquartile Range (IQR) | 16.3% | 8.0% |
| Standard Deviation (Sample) | 23.1% | 6.9% |
| Standard Deviation (Population) | 22.8% | 6.9% |
Similar Demographics by Female Disability
Demographics Similar to Austrians by Female Disability
In terms of female disability, the demographic groups most similar to Austrians are Serbian (12.3%, a difference of 0.010%), Immigrants from Uzbekistan (12.3%, a difference of 0.020%), Immigrants from North America (12.3%, a difference of 0.020%), Immigrants from Albania (12.3%, a difference of 0.080%), and Immigrants from Honduras (12.3%, a difference of 0.090%).
| Demographics | Rating | Rank | Female Disability |
| Immigrants | Fiji | 38.2 /100 | #179 | Fair 12.3% |
| Albanians | 37.9 /100 | #180 | Fair 12.3% |
| Immigrants | Canada | 37.2 /100 | #181 | Fair 12.3% |
| Norwegians | 36.9 /100 | #182 | Fair 12.3% |
| Cubans | 36.5 /100 | #183 | Fair 12.3% |
| Iraqis | 36.0 /100 | #184 | Fair 12.3% |
| Immigrants | Uzbekistan | 33.9 /100 | #185 | Fair 12.3% |
| Austrians | 33.3 /100 | #186 | Fair 12.3% |
| Serbians | 33.1 /100 | #187 | Fair 12.3% |
| Immigrants | North America | 32.8 /100 | #188 | Fair 12.3% |
| Immigrants | Albania | 31.6 /100 | #189 | Fair 12.3% |
| Immigrants | Honduras | 31.3 /100 | #190 | Fair 12.3% |
| Armenians | 29.7 /100 | #191 | Fair 12.3% |
| Immigrants | Western Africa | 29.2 /100 | #192 | Fair 12.3% |
| Northern Europeans | 27.5 /100 | #193 | Fair 12.3% |
Demographics Similar to Navajo by Female Disability
In terms of female disability, the demographic groups most similar to Navajo are Comanche (14.2%, a difference of 0.11%), Native/Alaskan (14.1%, a difference of 0.14%), Black/African American (14.1%, a difference of 0.16%), Pueblo (14.1%, a difference of 0.32%), and Potawatomi (14.1%, a difference of 0.33%).
| Demographics | Rating | Rank | Female Disability |
| Paiute | 0.0 /100 | #318 | Tragic 14.0% |
| Iroquois | 0.0 /100 | #319 | Tragic 14.0% |
| Americans | 0.0 /100 | #320 | Tragic 14.1% |
| Potawatomi | 0.0 /100 | #321 | Tragic 14.1% |
| Pueblo | 0.0 /100 | #322 | Tragic 14.1% |
| Blacks/African Americans | 0.0 /100 | #323 | Tragic 14.1% |
| Natives/Alaskans | 0.0 /100 | #324 | Tragic 14.1% |
| Navajo | 0.0 /100 | #325 | Tragic 14.2% |
| Comanche | 0.0 /100 | #326 | Tragic 14.2% |
| Ottawa | 0.0 /100 | #327 | Tragic 14.2% |
| Cape Verdeans | 0.0 /100 | #328 | Tragic 14.2% |
| Osage | 0.0 /100 | #329 | Tragic 14.3% |
| Yuman | 0.0 /100 | #330 | Tragic 14.5% |
| Immigrants | Cabo Verde | 0.0 /100 | #331 | Tragic 14.6% |
| Pima | 0.0 /100 | #332 | Tragic 14.8% |