Immigrants from Senegal vs Alaska Native Male Disability
COMPARE
Immigrants from Senegal
Alaska Native
Male Disability
Male Disability Comparison
Immigrants from Senegal
Alaska Natives
11.3%
MALE DISABILITY
34.4/ 100
METRIC RATING
181st/ 347
METRIC RANK
13.6%
MALE DISABILITY
0.0/ 100
METRIC RATING
316th/ 347
METRIC RANK
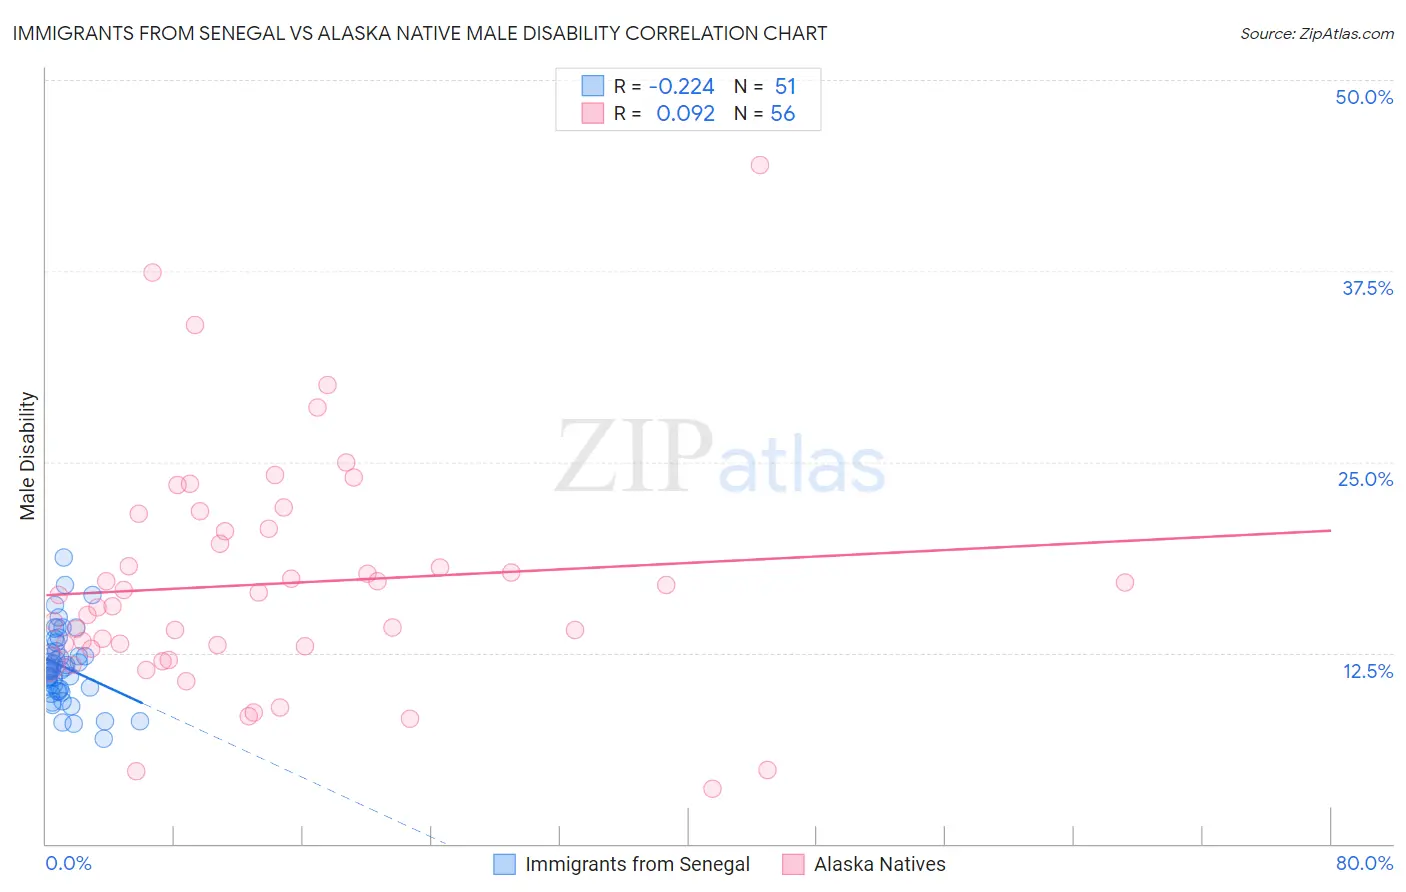
Immigrants from Senegal vs Alaska Native Male Disability Correlation Chart
The statistical analysis conducted on geographies consisting of 90,127,503 people shows a weak negative correlation between the proportion of Immigrants from Senegal and percentage of males with a disability in the United States with a correlation coefficient (R) of -0.224 and weighted average of 11.3%. Similarly, the statistical analysis conducted on geographies consisting of 76,765,214 people shows a slight positive correlation between the proportion of Alaska Natives and percentage of males with a disability in the United States with a correlation coefficient (R) of 0.092 and weighted average of 13.6%, a difference of 20.0%.
Male Disability Correlation Summary
| Measurement | Immigrants from Senegal | Alaska Native |
| Minimum | 6.9% | 3.6% |
| Maximum | 18.7% | 44.4% |
| Range | 11.8% | 40.8% |
| Mean | 11.6% | 17.0% |
| Median | 11.4% | 15.9% |
| Interquartile 25% (IQ1) | 10.0% | 12.8% |
| Interquartile 75% (IQ3) | 12.6% | 20.5% |
| Interquartile Range (IQR) | 2.6% | 7.7% |
| Standard Deviation (Sample) | 2.4% | 7.6% |
| Standard Deviation (Population) | 2.4% | 7.6% |
Similar Demographics by Male Disability
Demographics Similar to Immigrants from Senegal by Male Disability
In terms of male disability, the demographic groups most similar to Immigrants from Senegal are Immigrants from Belize (11.3%, a difference of 0.040%), Immigrants from Central America (11.3%, a difference of 0.090%), Iraqi (11.3%, a difference of 0.24%), Pakistani (11.3%, a difference of 0.25%), and Honduran (11.3%, a difference of 0.40%).
| Demographics | Rating | Rank | Male Disability |
| Maltese | 50.0 /100 | #174 | Average 11.2% |
| Immigrants | Honduras | 48.7 /100 | #175 | Average 11.2% |
| Syrians | 46.6 /100 | #176 | Average 11.2% |
| Immigrants | Norway | 44.2 /100 | #177 | Average 11.3% |
| Australians | 42.2 /100 | #178 | Average 11.3% |
| Immigrants | Caribbean | 41.4 /100 | #179 | Average 11.3% |
| Hondurans | 41.1 /100 | #180 | Average 11.3% |
| Immigrants | Senegal | 34.4 /100 | #181 | Fair 11.3% |
| Immigrants | Belize | 33.7 /100 | #182 | Fair 11.3% |
| Immigrants | Central America | 32.9 /100 | #183 | Fair 11.3% |
| Iraqis | 30.5 /100 | #184 | Fair 11.3% |
| Pakistanis | 30.3 /100 | #185 | Fair 11.3% |
| Immigrants | Zaire | 27.6 /100 | #186 | Fair 11.4% |
| Immigrants | Austria | 27.3 /100 | #187 | Fair 11.4% |
| Estonians | 26.8 /100 | #188 | Fair 11.4% |
Demographics Similar to Alaska Natives by Male Disability
In terms of male disability, the demographic groups most similar to Alaska Natives are Iroquois (13.6%, a difference of 0.050%), Aleut (13.5%, a difference of 0.21%), Puget Sound Salish (13.5%, a difference of 0.27%), Yakama (13.5%, a difference of 0.29%), and Paiute (13.7%, a difference of 0.80%).
| Demographics | Rating | Rank | Male Disability |
| Blackfeet | 0.0 /100 | #309 | Tragic 13.4% |
| Immigrants | Azores | 0.0 /100 | #310 | Tragic 13.4% |
| Delaware | 0.0 /100 | #311 | Tragic 13.5% |
| Yakama | 0.0 /100 | #312 | Tragic 13.5% |
| Puget Sound Salish | 0.0 /100 | #313 | Tragic 13.5% |
| Aleuts | 0.0 /100 | #314 | Tragic 13.5% |
| Iroquois | 0.0 /100 | #315 | Tragic 13.6% |
| Alaska Natives | 0.0 /100 | #316 | Tragic 13.6% |
| Paiute | 0.0 /100 | #317 | Tragic 13.7% |
| Cree | 0.0 /100 | #318 | Tragic 13.7% |
| Americans | 0.0 /100 | #319 | Tragic 13.8% |
| Tlingit-Haida | 0.0 /100 | #320 | Tragic 13.8% |
| Shoshone | 0.0 /100 | #321 | Tragic 13.8% |
| Apache | 0.0 /100 | #322 | Tragic 14.0% |
| Osage | 0.0 /100 | #323 | Tragic 14.0% |