Immigrants from Senegal vs Zimbabwean Male Disability
COMPARE
Immigrants from Senegal
Zimbabwean
Male Disability
Male Disability Comparison
Immigrants from Senegal
Zimbabweans
11.3%
MALE DISABILITY
34.4/ 100
METRIC RATING
181st/ 347
METRIC RANK
10.6%
MALE DISABILITY
98.4/ 100
METRIC RATING
79th/ 347
METRIC RANK
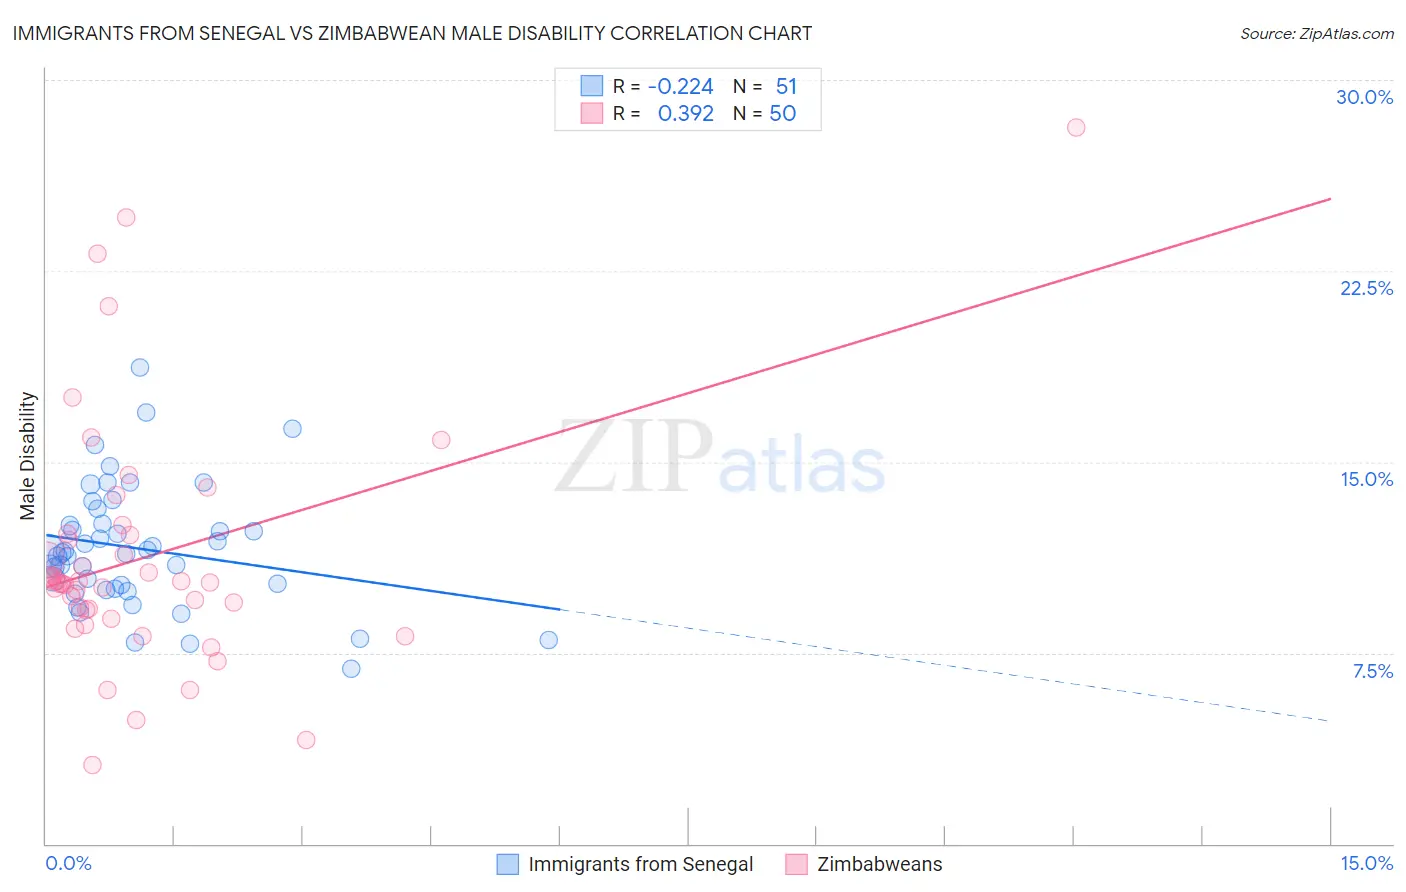
Immigrants from Senegal vs Zimbabwean Male Disability Correlation Chart
The statistical analysis conducted on geographies consisting of 90,127,503 people shows a weak negative correlation between the proportion of Immigrants from Senegal and percentage of males with a disability in the United States with a correlation coefficient (R) of -0.224 and weighted average of 11.3%. Similarly, the statistical analysis conducted on geographies consisting of 69,206,379 people shows a mild positive correlation between the proportion of Zimbabweans and percentage of males with a disability in the United States with a correlation coefficient (R) of 0.392 and weighted average of 10.6%, a difference of 7.0%.
Male Disability Correlation Summary
| Measurement | Immigrants from Senegal | Zimbabwean |
| Minimum | 6.9% | 3.1% |
| Maximum | 18.7% | 28.1% |
| Range | 11.8% | 25.0% |
| Mean | 11.6% | 11.3% |
| Median | 11.4% | 10.2% |
| Interquartile 25% (IQ1) | 10.0% | 9.2% |
| Interquartile 75% (IQ3) | 12.6% | 12.1% |
| Interquartile Range (IQR) | 2.6% | 2.9% |
| Standard Deviation (Sample) | 2.4% | 4.8% |
| Standard Deviation (Population) | 2.4% | 4.8% |
Similar Demographics by Male Disability
Demographics Similar to Immigrants from Senegal by Male Disability
In terms of male disability, the demographic groups most similar to Immigrants from Senegal are Immigrants from Belize (11.3%, a difference of 0.040%), Immigrants from Central America (11.3%, a difference of 0.090%), Iraqi (11.3%, a difference of 0.24%), Pakistani (11.3%, a difference of 0.25%), and Honduran (11.3%, a difference of 0.40%).
| Demographics | Rating | Rank | Male Disability |
| Maltese | 50.0 /100 | #174 | Average 11.2% |
| Immigrants | Honduras | 48.7 /100 | #175 | Average 11.2% |
| Syrians | 46.6 /100 | #176 | Average 11.2% |
| Immigrants | Norway | 44.2 /100 | #177 | Average 11.3% |
| Australians | 42.2 /100 | #178 | Average 11.3% |
| Immigrants | Caribbean | 41.4 /100 | #179 | Average 11.3% |
| Hondurans | 41.1 /100 | #180 | Average 11.3% |
| Immigrants | Senegal | 34.4 /100 | #181 | Fair 11.3% |
| Immigrants | Belize | 33.7 /100 | #182 | Fair 11.3% |
| Immigrants | Central America | 32.9 /100 | #183 | Fair 11.3% |
| Iraqis | 30.5 /100 | #184 | Fair 11.3% |
| Pakistanis | 30.3 /100 | #185 | Fair 11.3% |
| Immigrants | Zaire | 27.6 /100 | #186 | Fair 11.4% |
| Immigrants | Austria | 27.3 /100 | #187 | Fair 11.4% |
| Estonians | 26.8 /100 | #188 | Fair 11.4% |
Demographics Similar to Zimbabweans by Male Disability
In terms of male disability, the demographic groups most similar to Zimbabweans are Immigrants from Jordan (10.6%, a difference of 0.020%), Immigrants from Chile (10.6%, a difference of 0.080%), Immigrants from Guyana (10.6%, a difference of 0.15%), Immigrants from Poland (10.6%, a difference of 0.21%), and Bulgarian (10.6%, a difference of 0.22%).
| Demographics | Rating | Rank | Male Disability |
| Immigrants | Serbia | 99.0 /100 | #72 | Exceptional 10.5% |
| Immigrants | Lithuania | 98.9 /100 | #73 | Exceptional 10.5% |
| Immigrants | Lebanon | 98.8 /100 | #74 | Exceptional 10.5% |
| Sierra Leoneans | 98.7 /100 | #75 | Exceptional 10.5% |
| Immigrants | Sierra Leone | 98.7 /100 | #76 | Exceptional 10.5% |
| Laotians | 98.6 /100 | #77 | Exceptional 10.6% |
| Immigrants | Russia | 98.6 /100 | #78 | Exceptional 10.6% |
| Zimbabweans | 98.4 /100 | #79 | Exceptional 10.6% |
| Immigrants | Jordan | 98.4 /100 | #80 | Exceptional 10.6% |
| Immigrants | Chile | 98.3 /100 | #81 | Exceptional 10.6% |
| Immigrants | Guyana | 98.2 /100 | #82 | Exceptional 10.6% |
| Immigrants | Poland | 98.1 /100 | #83 | Exceptional 10.6% |
| Bulgarians | 98.1 /100 | #84 | Exceptional 10.6% |
| Sri Lankans | 97.9 /100 | #85 | Exceptional 10.6% |
| Immigrants | Ireland | 97.9 /100 | #86 | Exceptional 10.6% |