Immigrants from Grenada vs Iroquois Male Disability
COMPARE
Immigrants from Grenada
Iroquois
Male Disability
Male Disability Comparison
Immigrants from Grenada
Iroquois
10.5%
MALE DISABILITY
99.2/ 100
METRIC RATING
65th/ 347
METRIC RANK
13.6%
MALE DISABILITY
0.0/ 100
METRIC RATING
315th/ 347
METRIC RANK
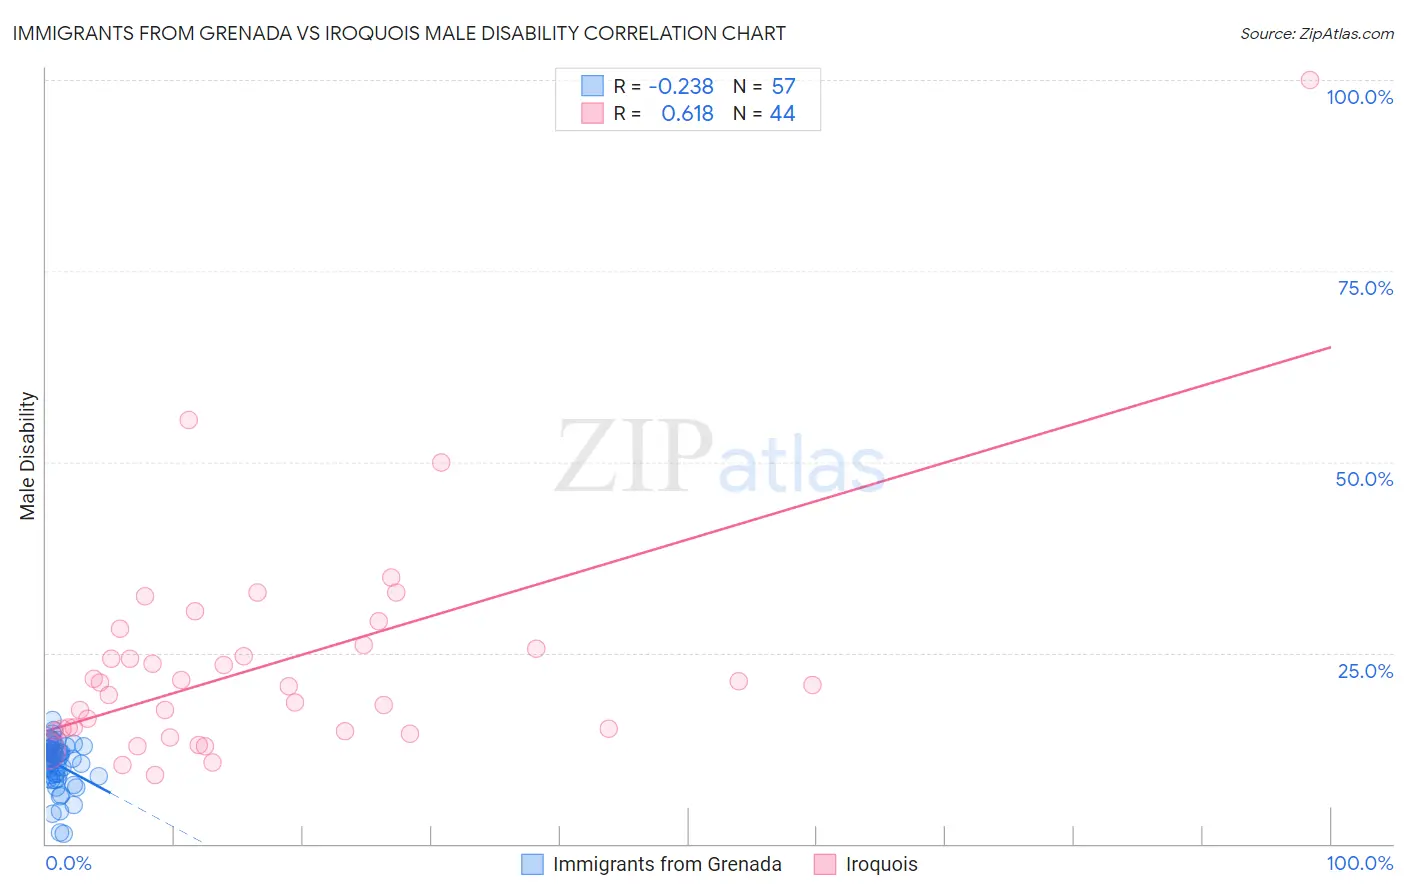
Immigrants from Grenada vs Iroquois Male Disability Correlation Chart
The statistical analysis conducted on geographies consisting of 67,197,352 people shows a weak negative correlation between the proportion of Immigrants from Grenada and percentage of males with a disability in the United States with a correlation coefficient (R) of -0.238 and weighted average of 10.5%. Similarly, the statistical analysis conducted on geographies consisting of 207,273,711 people shows a significant positive correlation between the proportion of Iroquois and percentage of males with a disability in the United States with a correlation coefficient (R) of 0.618 and weighted average of 13.6%, a difference of 29.7%.
Male Disability Correlation Summary
| Measurement | Immigrants from Grenada | Iroquois |
| Minimum | 1.3% | 9.0% |
| Maximum | 16.2% | 100.0% |
| Range | 14.9% | 91.0% |
| Mean | 10.4% | 23.4% |
| Median | 11.2% | 20.7% |
| Interquartile 25% (IQ1) | 8.7% | 14.9% |
| Interquartile 75% (IQ3) | 12.3% | 25.8% |
| Interquartile Range (IQR) | 3.6% | 11.0% |
| Standard Deviation (Sample) | 3.1% | 15.2% |
| Standard Deviation (Population) | 3.1% | 15.0% |
Similar Demographics by Male Disability
Demographics Similar to Immigrants from Grenada by Male Disability
In terms of male disability, the demographic groups most similar to Immigrants from Grenada are Guyanese (10.5%, a difference of 0.0%), Immigrants from Afghanistan (10.5%, a difference of 0.010%), Jordanian (10.5%, a difference of 0.020%), Colombian (10.5%, a difference of 0.11%), and Ecuadorian (10.5%, a difference of 0.11%).
| Demographics | Rating | Rank | Male Disability |
| Immigrants | Japan | 99.5 /100 | #58 | Exceptional 10.4% |
| Immigrants | Australia | 99.5 /100 | #59 | Exceptional 10.4% |
| Immigrants | Colombia | 99.5 /100 | #60 | Exceptional 10.4% |
| Immigrants | Northern Africa | 99.4 /100 | #61 | Exceptional 10.4% |
| Immigrants | Ecuador | 99.3 /100 | #62 | Exceptional 10.4% |
| Immigrants | Belarus | 99.3 /100 | #63 | Exceptional 10.4% |
| Jordanians | 99.3 /100 | #64 | Exceptional 10.5% |
| Immigrants | Grenada | 99.2 /100 | #65 | Exceptional 10.5% |
| Guyanese | 99.2 /100 | #66 | Exceptional 10.5% |
| Immigrants | Afghanistan | 99.2 /100 | #67 | Exceptional 10.5% |
| Colombians | 99.2 /100 | #68 | Exceptional 10.5% |
| Ecuadorians | 99.2 /100 | #69 | Exceptional 10.5% |
| Immigrants | Bulgaria | 99.1 /100 | #70 | Exceptional 10.5% |
| Immigrants | Cameroon | 99.0 /100 | #71 | Exceptional 10.5% |
| Immigrants | Serbia | 99.0 /100 | #72 | Exceptional 10.5% |
Demographics Similar to Iroquois by Male Disability
In terms of male disability, the demographic groups most similar to Iroquois are Alaska Native (13.6%, a difference of 0.050%), Aleut (13.5%, a difference of 0.16%), Puget Sound Salish (13.5%, a difference of 0.22%), Yakama (13.5%, a difference of 0.24%), and Delaware (13.5%, a difference of 0.79%).
| Demographics | Rating | Rank | Male Disability |
| French American Indians | 0.0 /100 | #308 | Tragic 13.4% |
| Blackfeet | 0.0 /100 | #309 | Tragic 13.4% |
| Immigrants | Azores | 0.0 /100 | #310 | Tragic 13.4% |
| Delaware | 0.0 /100 | #311 | Tragic 13.5% |
| Yakama | 0.0 /100 | #312 | Tragic 13.5% |
| Puget Sound Salish | 0.0 /100 | #313 | Tragic 13.5% |
| Aleuts | 0.0 /100 | #314 | Tragic 13.5% |
| Iroquois | 0.0 /100 | #315 | Tragic 13.6% |
| Alaska Natives | 0.0 /100 | #316 | Tragic 13.6% |
| Paiute | 0.0 /100 | #317 | Tragic 13.7% |
| Cree | 0.0 /100 | #318 | Tragic 13.7% |
| Americans | 0.0 /100 | #319 | Tragic 13.8% |
| Tlingit-Haida | 0.0 /100 | #320 | Tragic 13.8% |
| Shoshone | 0.0 /100 | #321 | Tragic 13.8% |
| Apache | 0.0 /100 | #322 | Tragic 14.0% |