Immigrants from Caribbean vs Alaskan Athabascan Female Disability
COMPARE
Immigrants from Caribbean
Alaskan Athabascan
Female Disability
Female Disability Comparison
Immigrants from Caribbean
Alaskan Athabascans
12.7%
FEMALE DISABILITY
1.4/ 100
METRIC RATING
252nd/ 347
METRIC RANK
13.9%
FEMALE DISABILITY
0.0/ 100
METRIC RATING
315th/ 347
METRIC RANK
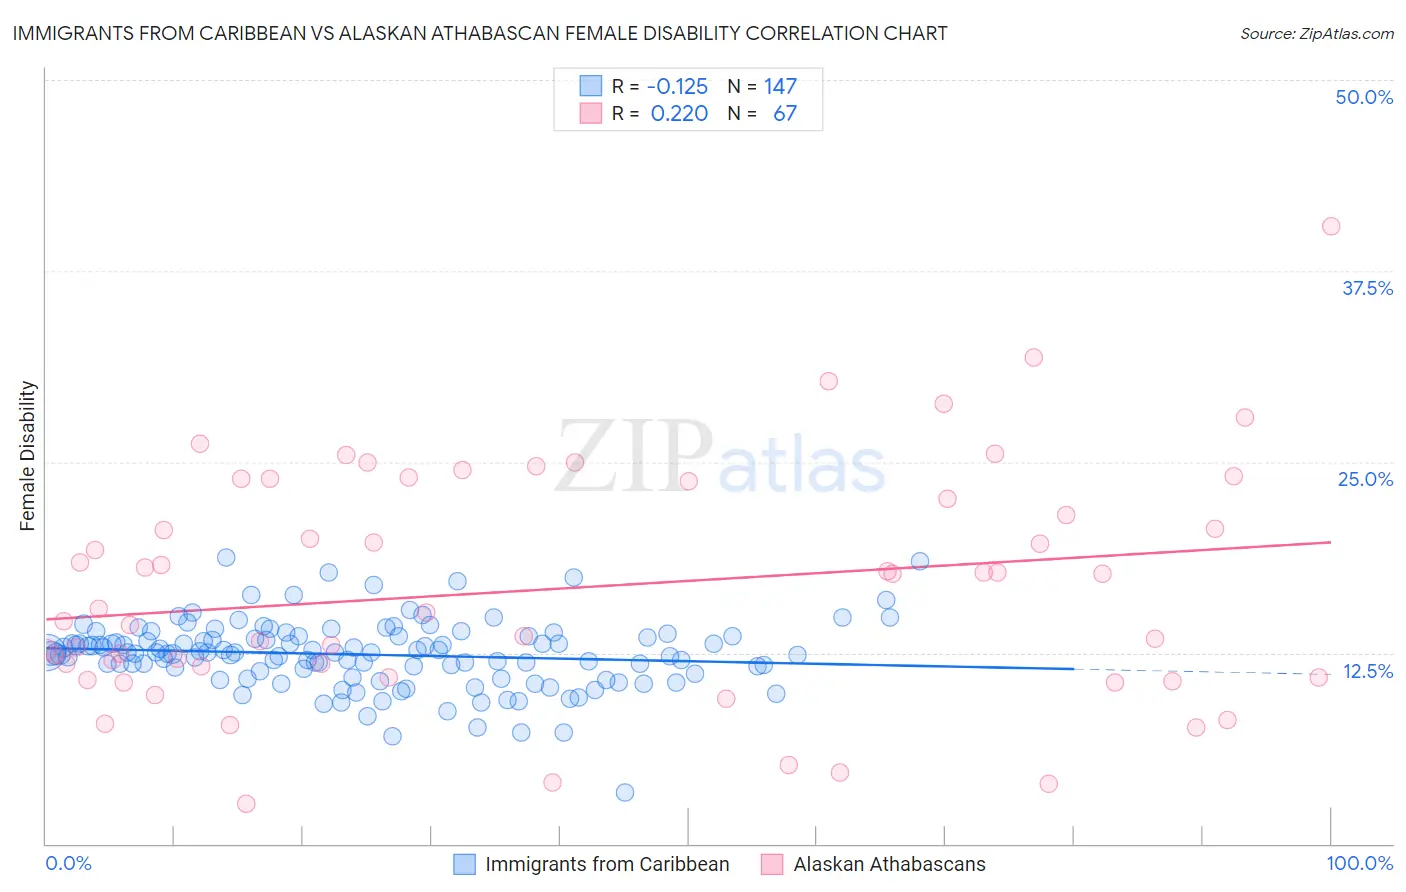
Immigrants from Caribbean vs Alaskan Athabascan Female Disability Correlation Chart
The statistical analysis conducted on geographies consisting of 449,918,897 people shows a poor negative correlation between the proportion of Immigrants from Caribbean and percentage of females with a disability in the United States with a correlation coefficient (R) of -0.125 and weighted average of 12.7%. Similarly, the statistical analysis conducted on geographies consisting of 45,817,882 people shows a weak positive correlation between the proportion of Alaskan Athabascans and percentage of females with a disability in the United States with a correlation coefficient (R) of 0.220 and weighted average of 13.9%, a difference of 9.8%.
Female Disability Correlation Summary
| Measurement | Immigrants from Caribbean | Alaskan Athabascan |
| Minimum | 3.3% | 2.6% |
| Maximum | 18.7% | 40.4% |
| Range | 15.4% | 37.8% |
| Mean | 12.4% | 16.7% |
| Median | 12.5% | 15.4% |
| Interquartile 25% (IQ1) | 11.3% | 10.9% |
| Interquartile 75% (IQ3) | 13.5% | 23.7% |
| Interquartile Range (IQR) | 2.3% | 12.8% |
| Standard Deviation (Sample) | 2.2% | 7.6% |
| Standard Deviation (Population) | 2.2% | 7.6% |
Similar Demographics by Female Disability
Demographics Similar to Immigrants from Caribbean by Female Disability
In terms of female disability, the demographic groups most similar to Immigrants from Caribbean are Jamaican (12.7%, a difference of 0.010%), Hawaiian (12.7%, a difference of 0.040%), Crow (12.7%, a difference of 0.080%), Immigrants from Germany (12.7%, a difference of 0.12%), and Slovene (12.7%, a difference of 0.14%).
| Demographics | Rating | Rank | Female Disability |
| Immigrants | Jamaica | 2.2 /100 | #245 | Tragic 12.6% |
| Spanish American Indians | 2.1 /100 | #246 | Tragic 12.6% |
| Menominee | 2.1 /100 | #247 | Tragic 12.6% |
| Carpatho Rusyns | 2.0 /100 | #248 | Tragic 12.6% |
| Immigrants | Congo | 1.8 /100 | #249 | Tragic 12.7% |
| Slovenes | 1.7 /100 | #250 | Tragic 12.7% |
| Crow | 1.6 /100 | #251 | Tragic 12.7% |
| Immigrants | Caribbean | 1.4 /100 | #252 | Tragic 12.7% |
| Jamaicans | 1.4 /100 | #253 | Tragic 12.7% |
| Hawaiians | 1.4 /100 | #254 | Tragic 12.7% |
| Immigrants | Germany | 1.3 /100 | #255 | Tragic 12.7% |
| British West Indians | 1.2 /100 | #256 | Tragic 12.7% |
| Liberians | 1.1 /100 | #257 | Tragic 12.7% |
| Aleuts | 1.1 /100 | #258 | Tragic 12.7% |
| Immigrants | Armenia | 1.0 /100 | #259 | Tragic 12.7% |
Demographics Similar to Alaskan Athabascans by Female Disability
In terms of female disability, the demographic groups most similar to Alaskan Athabascans are Spanish American (14.0%, a difference of 0.36%), Chippewa (14.0%, a difference of 0.47%), Paiute (14.0%, a difference of 0.58%), Puget Sound Salish (13.8%, a difference of 0.59%), and Blackfeet (13.8%, a difference of 0.69%).
| Demographics | Rating | Rank | Female Disability |
| Cree | 0.0 /100 | #308 | Tragic 13.7% |
| French American Indians | 0.0 /100 | #309 | Tragic 13.7% |
| Apache | 0.0 /100 | #310 | Tragic 13.7% |
| Hopi | 0.0 /100 | #311 | Tragic 13.7% |
| Delaware | 0.0 /100 | #312 | Tragic 13.8% |
| Blackfeet | 0.0 /100 | #313 | Tragic 13.8% |
| Puget Sound Salish | 0.0 /100 | #314 | Tragic 13.8% |
| Alaskan Athabascans | 0.0 /100 | #315 | Tragic 13.9% |
| Spanish Americans | 0.0 /100 | #316 | Tragic 14.0% |
| Chippewa | 0.0 /100 | #317 | Tragic 14.0% |
| Paiute | 0.0 /100 | #318 | Tragic 14.0% |
| Iroquois | 0.0 /100 | #319 | Tragic 14.0% |
| Americans | 0.0 /100 | #320 | Tragic 14.1% |
| Potawatomi | 0.0 /100 | #321 | Tragic 14.1% |
| Pueblo | 0.0 /100 | #322 | Tragic 14.1% |