Honduran vs Colombian Male Disability
COMPARE
Honduran
Colombian
Male Disability
Male Disability Comparison
Hondurans
Colombians
11.3%
MALE DISABILITY
41.1/ 100
METRIC RATING
180th/ 347
METRIC RANK
10.5%
MALE DISABILITY
99.2/ 100
METRIC RATING
68th/ 347
METRIC RANK
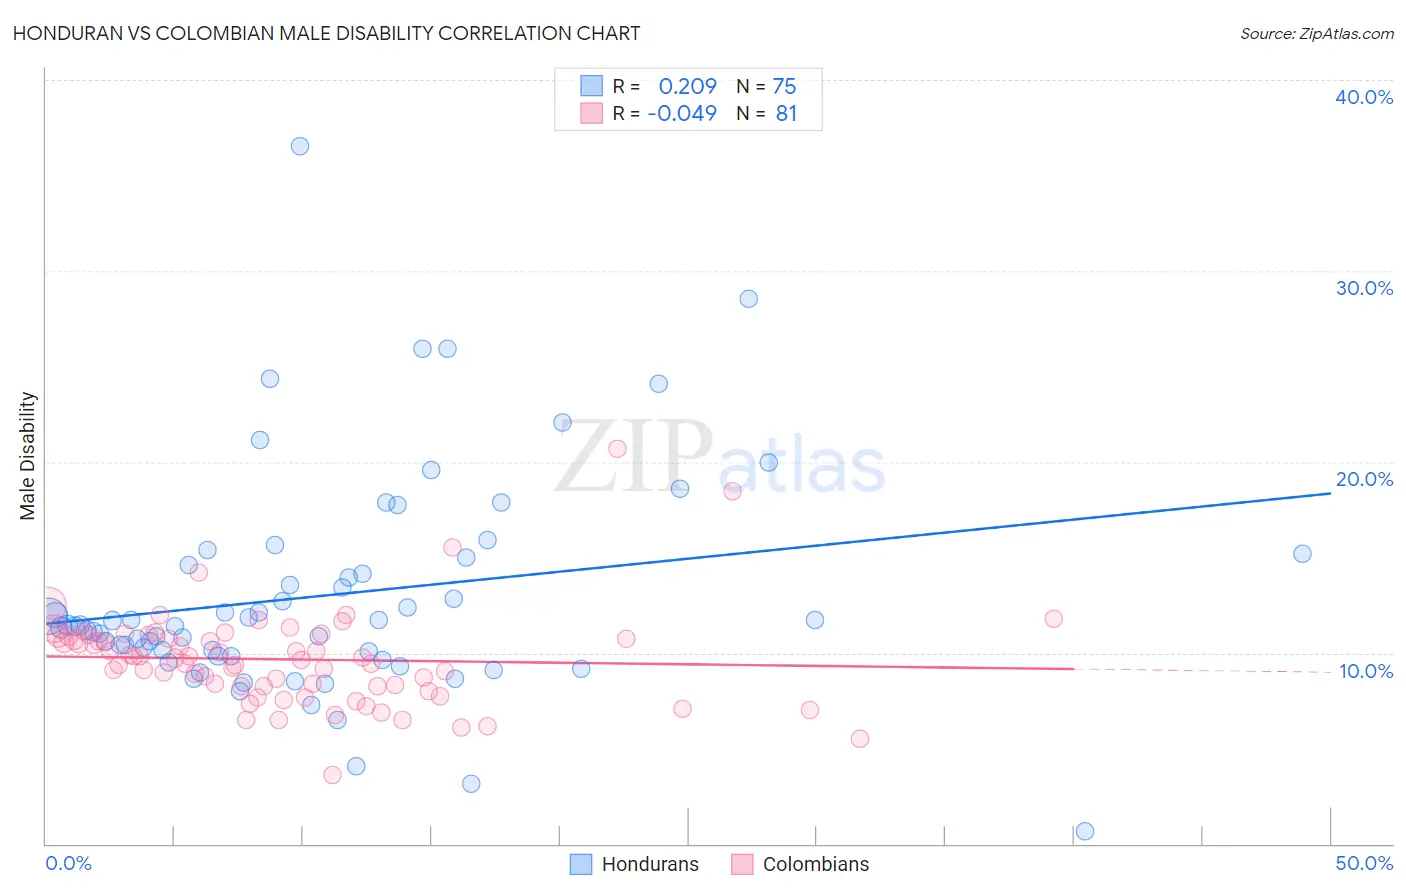
Honduran vs Colombian Male Disability Correlation Chart
The statistical analysis conducted on geographies consisting of 357,765,878 people shows a weak positive correlation between the proportion of Hondurans and percentage of males with a disability in the United States with a correlation coefficient (R) of 0.209 and weighted average of 11.3%. Similarly, the statistical analysis conducted on geographies consisting of 419,578,648 people shows no correlation between the proportion of Colombians and percentage of males with a disability in the United States with a correlation coefficient (R) of -0.049 and weighted average of 10.5%, a difference of 7.6%.
Male Disability Correlation Summary
| Measurement | Honduran | Colombian |
| Minimum | 0.65% | 3.6% |
| Maximum | 36.5% | 20.7% |
| Range | 35.9% | 17.1% |
| Mean | 13.0% | 9.7% |
| Median | 11.4% | 9.7% |
| Interquartile 25% (IQ1) | 9.8% | 8.2% |
| Interquartile 75% (IQ3) | 15.0% | 10.9% |
| Interquartile Range (IQR) | 5.1% | 2.7% |
| Standard Deviation (Sample) | 5.8% | 2.5% |
| Standard Deviation (Population) | 5.8% | 2.5% |
Similar Demographics by Male Disability
Demographics Similar to Hondurans by Male Disability
In terms of male disability, the demographic groups most similar to Hondurans are Immigrants from Caribbean (11.3%, a difference of 0.020%), Australian (11.3%, a difference of 0.060%), Immigrants from Norway (11.3%, a difference of 0.17%), Syrian (11.2%, a difference of 0.31%), and Immigrants from Senegal (11.3%, a difference of 0.40%).
| Demographics | Rating | Rank | Male Disability |
| Immigrants | Burma/Myanmar | 50.4 /100 | #173 | Average 11.2% |
| Maltese | 50.0 /100 | #174 | Average 11.2% |
| Immigrants | Honduras | 48.7 /100 | #175 | Average 11.2% |
| Syrians | 46.6 /100 | #176 | Average 11.2% |
| Immigrants | Norway | 44.2 /100 | #177 | Average 11.3% |
| Australians | 42.2 /100 | #178 | Average 11.3% |
| Immigrants | Caribbean | 41.4 /100 | #179 | Average 11.3% |
| Hondurans | 41.1 /100 | #180 | Average 11.3% |
| Immigrants | Senegal | 34.4 /100 | #181 | Fair 11.3% |
| Immigrants | Belize | 33.7 /100 | #182 | Fair 11.3% |
| Immigrants | Central America | 32.9 /100 | #183 | Fair 11.3% |
| Iraqis | 30.5 /100 | #184 | Fair 11.3% |
| Pakistanis | 30.3 /100 | #185 | Fair 11.3% |
| Immigrants | Zaire | 27.6 /100 | #186 | Fair 11.4% |
| Immigrants | Austria | 27.3 /100 | #187 | Fair 11.4% |
Demographics Similar to Colombians by Male Disability
In terms of male disability, the demographic groups most similar to Colombians are Ecuadorian (10.5%, a difference of 0.0%), Guyanese (10.5%, a difference of 0.10%), Immigrants from Afghanistan (10.5%, a difference of 0.10%), Immigrants from Grenada (10.5%, a difference of 0.11%), and Jordanian (10.5%, a difference of 0.13%).
| Demographics | Rating | Rank | Male Disability |
| Immigrants | Northern Africa | 99.4 /100 | #61 | Exceptional 10.4% |
| Immigrants | Ecuador | 99.3 /100 | #62 | Exceptional 10.4% |
| Immigrants | Belarus | 99.3 /100 | #63 | Exceptional 10.4% |
| Jordanians | 99.3 /100 | #64 | Exceptional 10.5% |
| Immigrants | Grenada | 99.2 /100 | #65 | Exceptional 10.5% |
| Guyanese | 99.2 /100 | #66 | Exceptional 10.5% |
| Immigrants | Afghanistan | 99.2 /100 | #67 | Exceptional 10.5% |
| Colombians | 99.2 /100 | #68 | Exceptional 10.5% |
| Ecuadorians | 99.2 /100 | #69 | Exceptional 10.5% |
| Immigrants | Bulgaria | 99.1 /100 | #70 | Exceptional 10.5% |
| Immigrants | Cameroon | 99.0 /100 | #71 | Exceptional 10.5% |
| Immigrants | Serbia | 99.0 /100 | #72 | Exceptional 10.5% |
| Immigrants | Lithuania | 98.9 /100 | #73 | Exceptional 10.5% |
| Immigrants | Lebanon | 98.8 /100 | #74 | Exceptional 10.5% |
| Sierra Leoneans | 98.7 /100 | #75 | Exceptional 10.5% |