Haitian vs Hopi Male Disability
COMPARE
Haitian
Hopi
Male Disability
Male Disability Comparison
Haitians
Hopi
11.2%
MALE DISABILITY
52.5/ 100
METRIC RATING
171st/ 347
METRIC RANK
12.5%
MALE DISABILITY
0.0/ 100
METRIC RATING
274th/ 347
METRIC RANK
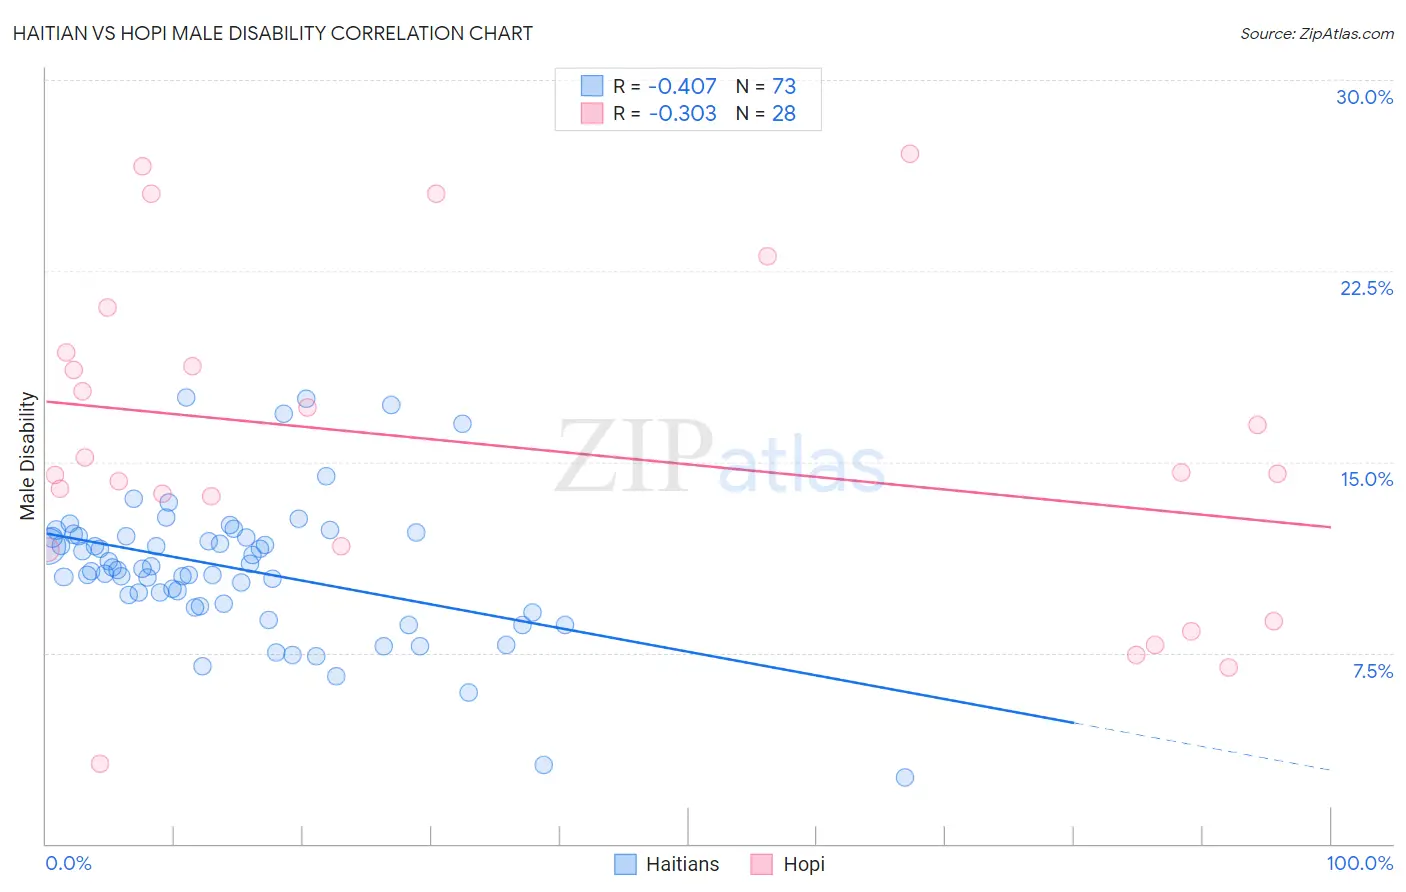
Haitian vs Hopi Male Disability Correlation Chart
The statistical analysis conducted on geographies consisting of 287,906,859 people shows a moderate negative correlation between the proportion of Haitians and percentage of males with a disability in the United States with a correlation coefficient (R) of -0.407 and weighted average of 11.2%. Similarly, the statistical analysis conducted on geographies consisting of 74,731,740 people shows a mild negative correlation between the proportion of Hopi and percentage of males with a disability in the United States with a correlation coefficient (R) of -0.303 and weighted average of 12.5%, a difference of 11.8%.
Male Disability Correlation Summary
| Measurement | Haitian | Hopi |
| Minimum | 2.6% | 3.2% |
| Maximum | 17.5% | 27.1% |
| Range | 14.9% | 24.0% |
| Mean | 10.8% | 15.6% |
| Median | 10.8% | 14.5% |
| Interquartile 25% (IQ1) | 9.4% | 11.6% |
| Interquartile 75% (IQ3) | 12.1% | 19.0% |
| Interquartile Range (IQR) | 2.7% | 7.4% |
| Standard Deviation (Sample) | 2.8% | 6.3% |
| Standard Deviation (Population) | 2.7% | 6.2% |
Similar Demographics by Male Disability
Demographics Similar to Haitians by Male Disability
In terms of male disability, the demographic groups most similar to Haitians are New Zealander (11.2%, a difference of 0.020%), Barbadian (11.2%, a difference of 0.050%), Immigrants from Latin America (11.2%, a difference of 0.080%), Immigrants from Southern Europe (11.2%, a difference of 0.10%), and Romanian (11.2%, a difference of 0.10%).
| Demographics | Rating | Rank | Male Disability |
| British West Indians | 62.8 /100 | #164 | Good 11.1% |
| Luxembourgers | 61.9 /100 | #165 | Good 11.1% |
| Immigrants | Hungary | 61.2 /100 | #166 | Good 11.1% |
| Immigrants | Southern Europe | 54.4 /100 | #167 | Average 11.2% |
| Immigrants | Latin America | 54.0 /100 | #168 | Average 11.2% |
| Barbadians | 53.4 /100 | #169 | Average 11.2% |
| New Zealanders | 52.9 /100 | #170 | Average 11.2% |
| Haitians | 52.5 /100 | #171 | Average 11.2% |
| Romanians | 50.7 /100 | #172 | Average 11.2% |
| Immigrants | Burma/Myanmar | 50.4 /100 | #173 | Average 11.2% |
| Maltese | 50.0 /100 | #174 | Average 11.2% |
| Immigrants | Honduras | 48.7 /100 | #175 | Average 11.2% |
| Syrians | 46.6 /100 | #176 | Average 11.2% |
| Immigrants | Norway | 44.2 /100 | #177 | Average 11.3% |
| Australians | 42.2 /100 | #178 | Average 11.3% |
Demographics Similar to Hopi by Male Disability
In terms of male disability, the demographic groups most similar to Hopi are Native Hawaiian (12.5%, a difference of 0.33%), Fijian (12.6%, a difference of 0.35%), Hmong (12.5%, a difference of 0.39%), African (12.6%, a difference of 0.40%), and Finnish (12.6%, a difference of 0.72%).
| Demographics | Rating | Rank | Male Disability |
| Immigrants | Germany | 0.1 /100 | #267 | Tragic 12.3% |
| Portuguese | 0.1 /100 | #268 | Tragic 12.3% |
| Czechoslovakians | 0.1 /100 | #269 | Tragic 12.3% |
| Spaniards | 0.1 /100 | #270 | Tragic 12.3% |
| Scandinavians | 0.1 /100 | #271 | Tragic 12.3% |
| Hmong | 0.0 /100 | #272 | Tragic 12.5% |
| Native Hawaiians | 0.0 /100 | #273 | Tragic 12.5% |
| Hopi | 0.0 /100 | #274 | Tragic 12.5% |
| Fijians | 0.0 /100 | #275 | Tragic 12.6% |
| Africans | 0.0 /100 | #276 | Tragic 12.6% |
| Finns | 0.0 /100 | #277 | Tragic 12.6% |
| Central American Indians | 0.0 /100 | #278 | Tragic 12.7% |
| Slovaks | 0.0 /100 | #279 | Tragic 12.7% |
| Dutch | 0.0 /100 | #280 | Tragic 12.7% |
| Sioux | 0.0 /100 | #281 | Tragic 12.7% |