Ghanaian vs Chippewa Disability Age 18 to 34

COMPARE

Ghanaian
Race
Ancestry
AfghanAfricanAlaska NativeAlaskan AthabascanAlbanianAleutAlsatianAmericanApacheArabArapahoArgentineanArmenianAssyrian/Chaldean/SyriacAustralianAustrianBahamianBangladeshiBarbadianBasqueBelgianBelizeanBermudanBhutaneseBlackfeetBolivianBrazilianBritishBritish West IndianBulgarianBurmeseCajunCambodianCanadianCape VerdeanCarpatho RusynCelticCentral AmericanCentral American IndianCherokeeCheyenneChickasawChileanChineseChoctawColombianColvilleComancheCosta RicanCreeCreekCroatianCrowCubanCypriotCzechCzechoslovakianDanishDelawareDominicanDutchDutch West IndianEastern EuropeanEcuadorianEgyptianEnglishEstonianEthiopianEuropeanFijianFilipinoFinnishFrenchFrench American IndianFrench CanadianGermanGerman RussianGhanaianGreekGuamanian/ChamorroGuatemalanGuyaneseHaitianHmongHonduranHopiHoumaHungarianIcelanderIndian (Asian)IndonesianInupiatIranianIraqiIrishIroquoisIsraeliItalianJamaicanJapaneseJordanianKenyanKiowaKoreanLaotianLatvianLebaneseLiberianLithuanianLumbeeLuxembourgerMacedonianMalaysianMalteseMarshalleseMenomineeMexicanMexican American IndianMongolianMoroccanNative HawaiianNavajoNepaleseNew ZealanderNicaraguanNigerianNorthern EuropeanNorwegianOkinawanOsageOttawaPaiutePakistaniPalestinianPanamanianParaguayanPennsylvania GermanPeruvianPimaPolishPortuguesePotawatomiPuebloPuerto RicanPuget Sound SalishRomanianRussianSalvadoranSamoanScandinavianScotch-IrishScottishSeminoleSenegaleseSerbianShoshoneSierra LeoneanSiouxSlavicSlovakSloveneSomaliSouth AfricanSouth AmericanSouth American IndianSoviet UnionSpaniardSpanishSpanish AmericanSpanish American IndianSri LankanSubsaharan AfricanSudaneseSwedishSwissSyrianTaiwaneseThaiTlingit-HaidaTohono O'OdhamTonganTrinidadian and TobagonianTsimshianTurkishU.S. Virgin IslanderUgandanUkrainianUruguayanUteVenezuelanVietnameseWelshWest IndianYakamaYaquiYugoslavianYumanYup'ikZimbabwean
Immigration
NonimmigrantsImmigrantsAfghanistanAfricaAlbaniaArgentinaArmeniaAsiaAustraliaAustriaBahamasBangladeshBarbadosBelarusBelgiumBelizeBoliviaBosnia and HerzegovinaBrazilBulgariaBurma/MyanmarCabo VerdeCambodiaCameroonCanadaCaribbeanCentral AmericaChileChinaColombiaCongoCosta RicaCroatiaCubaCzechoslovakiaDenmarkDominicaDominican RepublicEastern AfricaEastern AsiaEastern EuropeEcuadorEgyptEl SalvadorEnglandEritreaEthiopiaEuropeFijiFranceGermanyGhanaGreeceGrenadaGuatemalaGuyanaHaitiHondurasHong KongHungaryIndiaIndonesiaIranIraqIrelandIsraelItalyJamaicaJapanJordanKazakhstanKenyaKoreaKuwaitLaosLatin AmericaLatviaLebanonLiberiaLithuaniaMalaysiaMexicoMicronesiaMiddle AfricaMoldovaMoroccoNepalNetherlandsNicaraguaNigeriaNorth AmericaNorth MacedoniaNorthern AfricaNorthern EuropeNorwayOceaniaPakistanPanamaPeruPhilippinesPolandPortugalRomaniaRussiaSaudi ArabiaScotlandSenegalSerbiaSierra LeoneSingaporeSomaliaSouth AfricaSouth AmericaSouth Central AsiaSouth Eastern AsiaSouthern EuropeSpainSri LankaSt. Vincent and the GrenadinesSudanSwedenSwitzerlandSyriaTaiwanThailandTrinidad and TobagoTurkeyUgandaUkraineUruguayUzbekistanVenezuelaVietnamWest IndiesWestern AfricaWestern AsiaWestern EuropeYemenZaireZimbabweAzores
Chippewa
Race
Ancestry
AfghanAfricanAlaska NativeAlaskan AthabascanAlbanianAleutAlsatianAmericanApacheArabArapahoArgentineanArmenianAssyrian/Chaldean/SyriacAustralianAustrianBahamianBangladeshiBarbadianBasqueBelgianBelizeanBermudanBhutaneseBlackfeetBolivianBrazilianBritishBritish West IndianBulgarianBurmeseCajunCambodianCanadianCape VerdeanCarpatho RusynCelticCentral AmericanCentral American IndianCherokeeCheyenneChickasawChileanChineseChippewaChoctawColombianColvilleComancheCosta RicanCreeCreekCroatianCrowCubanCypriotCzechCzechoslovakianDanishDelawareDominicanDutchDutch West IndianEastern EuropeanEcuadorianEgyptianEnglishEstonianEthiopianEuropeanFijianFilipinoFinnishFrenchFrench American IndianFrench CanadianGermanGerman RussianGreekGuamanian/ChamorroGuatemalanGuyaneseHaitianHmongHonduranHopiHoumaHungarianIcelanderIndian (Asian)IndonesianInupiatIranianIraqiIrishIroquoisIsraeliItalianJamaicanJapaneseJordanianKenyanKiowaKoreanLaotianLatvianLebaneseLiberianLithuanianLumbeeLuxembourgerMacedonianMalaysianMalteseMarshalleseMenomineeMexicanMexican American IndianMongolianMoroccanNative HawaiianNavajoNepaleseNew ZealanderNicaraguanNigerianNorthern EuropeanNorwegianOkinawanOsageOttawaPaiutePakistaniPalestinianPanamanianParaguayanPennsylvania GermanPeruvianPimaPolishPortuguesePotawatomiPuebloPuerto RicanPuget Sound SalishRomanianRussianSalvadoranSamoanScandinavianScotch-IrishScottishSeminoleSenegaleseSerbianShoshoneSierra LeoneanSiouxSlavicSlovakSloveneSomaliSouth AfricanSouth AmericanSouth American IndianSoviet UnionSpaniardSpanishSpanish AmericanSpanish American IndianSri LankanSubsaharan AfricanSudaneseSwedishSwissSyrianTaiwaneseThaiTlingit-HaidaTohono O'OdhamTonganTrinidadian and TobagonianTsimshianTurkishU.S. Virgin IslanderUgandanUkrainianUruguayanUteVenezuelanVietnameseWelshWest IndianYakamaYaquiYugoslavianYumanYup'ikZimbabwean
Immigration
NonimmigrantsImmigrantsAfghanistanAfricaAlbaniaArgentinaArmeniaAsiaAustraliaAustriaBahamasBangladeshBarbadosBelarusBelgiumBelizeBoliviaBosnia and HerzegovinaBrazilBulgariaBurma/MyanmarCabo VerdeCambodiaCameroonCanadaCaribbeanCentral AmericaChileChinaColombiaCongoCosta RicaCroatiaCubaCzechoslovakiaDenmarkDominicaDominican RepublicEastern AfricaEastern AsiaEastern EuropeEcuadorEgyptEl SalvadorEnglandEritreaEthiopiaEuropeFijiFranceGermanyGhanaGreeceGrenadaGuatemalaGuyanaHaitiHondurasHong KongHungaryIndiaIndonesiaIranIraqIrelandIsraelItalyJamaicaJapanJordanKazakhstanKenyaKoreaKuwaitLaosLatin AmericaLatviaLebanonLiberiaLithuaniaMalaysiaMexicoMicronesiaMiddle AfricaMoldovaMoroccoNepalNetherlandsNicaraguaNigeriaNorth AmericaNorth MacedoniaNorthern AfricaNorthern EuropeNorwayOceaniaPakistanPanamaPeruPhilippinesPolandPortugalRomaniaRussiaSaudi ArabiaScotlandSenegalSerbiaSierra LeoneSingaporeSomaliaSouth AfricaSouth AmericaSouth Central AsiaSouth Eastern AsiaSouthern EuropeSpainSri LankaSt. Vincent and the GrenadinesSudanSwedenSwitzerlandSyriaTaiwanThailandTrinidad and TobagoTurkeyUgandaUkraineUruguayUzbekistanVenezuelaVietnamWest IndiesWestern AfricaWestern AsiaWestern EuropeYemenZaireZimbabweAzores
Disability Age 18 to 34
Income
Poverty
Unemployment
Labor Participation
Family Structure
Vehicle Availability
Education Level
Disability

Disability Age 18 to 34 Comparison

Ghanaians

Chippewa

Average
Tragic
6.6%
DISABILITY AGE 18 TO 34
54.7/ 100
METRIC RATING
172nd/ 347
METRIC RANK
9.0%
DISABILITY AGE 18 TO 34
0.0/ 100
METRIC RATING
343rd/ 347
METRIC RANK

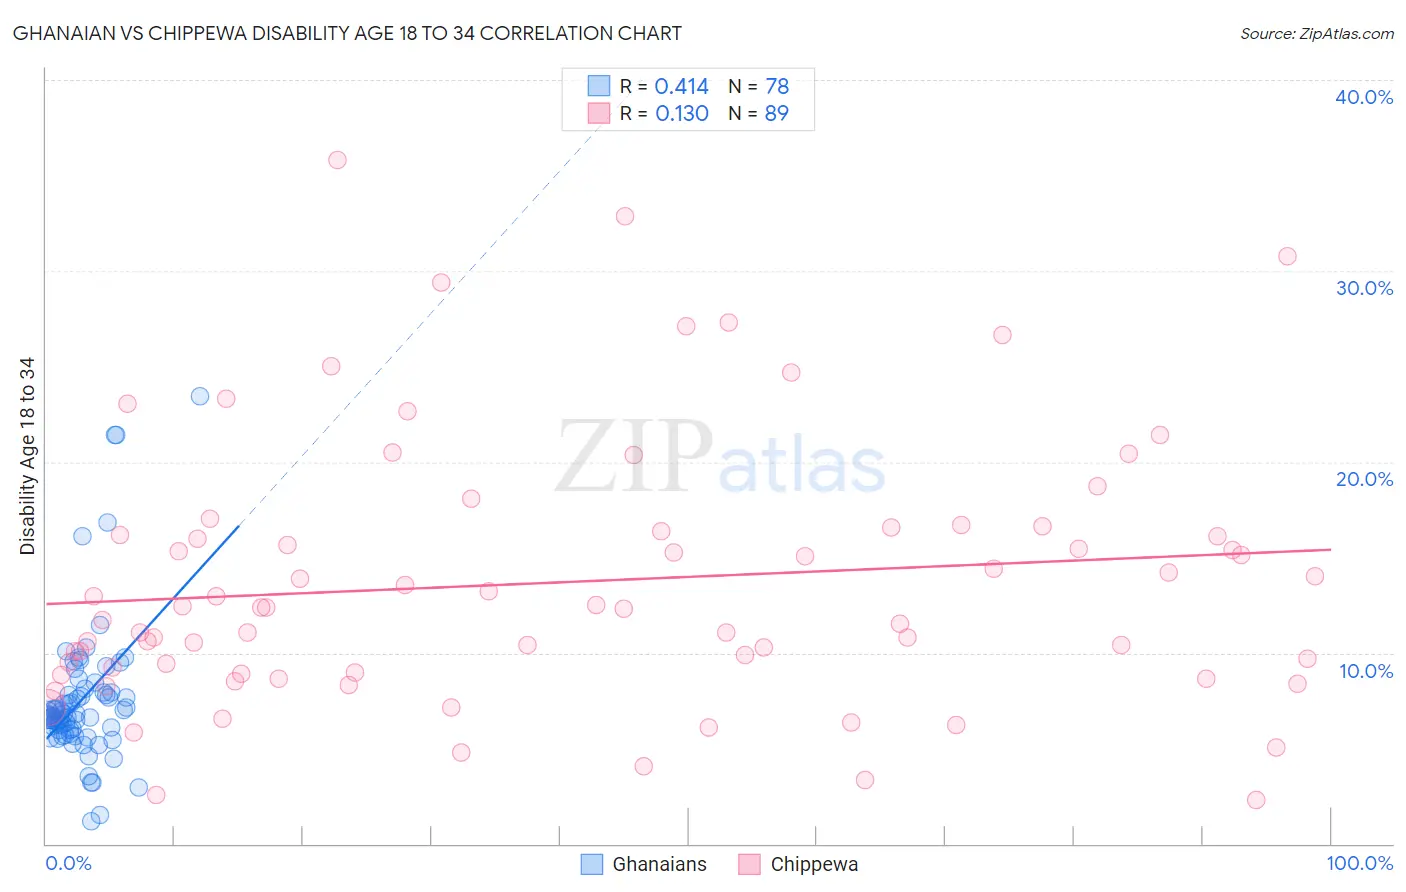
Ghanaian vs Chippewa Disability Age 18 to 34 Correlation Chart

The statistical analysis conducted on geographies consisting of 190,614,383 people shows a moderate positive correlation between the proportion of Ghanaians and percentage of population with a disability between the ages 18 and 35 in the United States with a correlation coefficient (R) of 0.414 and weighted average of 6.6%. Similarly, the statistical analysis conducted on geographies consisting of 214,650,505 people shows a poor positive correlation between the proportion of Chippewa and percentage of population with a disability between the ages 18 and 35 in the United States with a correlation coefficient (R) of 0.130 and weighted average of 9.0%, a difference of 36.5%.
Ghanaian vs Chippewa Disability Age 18 to 34

Disability Age 18 to 34 Correlation Summary

MeasurementGhanaianChippewa
Minimum1.2%2.3%
Maximum23.5%35.8%
Range22.3%33.5%
Mean7.6%13.7%
Median6.7%12.4%
Interquartile 25% (IQ1)6.0%9.0%
Interquartile 75% (IQ3)7.9%16.4%
Interquartile Range (IQR)1.9%7.5%
Standard Deviation (Sample)3.8%6.9%
Standard Deviation (Population)3.8%6.9%

Similar Demographics by Disability Age 18 to 34

Demographics Similar to Ghanaians by Disability Age 18 to 34

In terms of disability age 18 to 34, the demographic groups most similar to Ghanaians are Immigrants from Mexico (6.6%, a difference of 0.040%), Bahamian (6.6%, a difference of 0.050%), Immigrants from Bahamas (6.6%, a difference of 0.22%), Native Hawaiian (6.6%, a difference of 0.33%), and Russian (6.5%, a difference of 0.39%).
DemographicsRating | RankDisability Age 18 to 34
Immigrants | Hungary
69.6
/100
|
#165
Good
6.5%
Eastern Europeans
65.1
/100
|
#166
Good
6.5%
Immigrants | Northern Europe
64.1
/100
|
#167
Good
6.5%
Immigrants | Moldova
63.1
/100
|
#168
Good
6.5%
Russians
60.2
/100
|
#169
Good
6.5%
Immigrants | Bahamas
57.9
/100
|
#170
Average
6.6%
Bahamians
55.5
/100
|
#171
Average
6.6%
Ghanaians
54.7
/100
|
#172
Average
6.6%
Immigrants | Mexico
54.1
/100
|
#173
Average
6.6%
Native Hawaiians
50.0
/100
|
#174
Average
6.6%
Immigrants | Cambodia
46.5
/100
|
#175
Average
6.6%
Immigrants | Africa
45.9
/100
|
#176
Average
6.6%
Syrians
44.3
/100
|
#177
Average
6.6%
Nigerians
43.7
/100
|
#178
Average
6.6%
Immigrants | Ghana
42.1
/100
|
#179
Average
6.6%

Demographics Similar to Chippewa by Disability Age 18 to 34

In terms of disability age 18 to 34, the demographic groups most similar to Chippewa are Yakama (9.0%, a difference of 0.010%), Chickasaw (9.0%, a difference of 0.060%), Choctaw (9.0%, a difference of 0.15%), Creek (9.0%, a difference of 0.38%), and Kiowa (8.8%, a difference of 1.6%).
DemographicsRating | RankDisability Age 18 to 34
Apache
0.0
/100
|
#333
Tragic
8.4%
Dutch West Indians
0.0
/100
|
#334
Tragic
8.4%
Seminole
0.0
/100
|
#335
Tragic
8.4%
Immigrants | Azores
0.0
/100
|
#336
Tragic
8.5%
Ottawa
0.0
/100
|
#337
Tragic
8.6%
Cherokee
0.0
/100
|
#338
Tragic
8.7%
Kiowa
0.0
/100
|
#339
Tragic
8.8%
Choctaw
0.0
/100
|
#340
Tragic
9.0%
Chickasaw
0.0
/100
|
#341
Tragic
9.0%
Yakama
0.0
/100
|
#342
Tragic
9.0%
Chippewa
0.0
/100
|
#343
Tragic
9.0%
Creek
0.0
/100
|
#344
Tragic
9.0%
Alaskan Athabascans
0.0
/100
|
#345
Tragic
9.4%
Houma
0.0
/100
|
#346
Tragic
9.7%
Yuman
0.0
/100
|
#347
Tragic
10.6%