Saddle Ridge, CO
Saddle Ridge Map
Saddle Ridge Overview
53
TOTAL POPULATION
32
MALE POPULATION
21
FEMALE POPULATION
152.38
MALES / 100 FEMALES
65.62
FEMALES / 100 MALES
52.4
MEDIAN AGE
2.8
AVG FAMILY SIZE
2.8
AVG HOUSEHOLD SIZE
$11,421
PER CAPITA INCOME
0.39
INEQUALITY / GINI INDEX
30
LABOR FORCE [ PEOPLE ]
56.6%
PERCENT IN LABOR FORCE
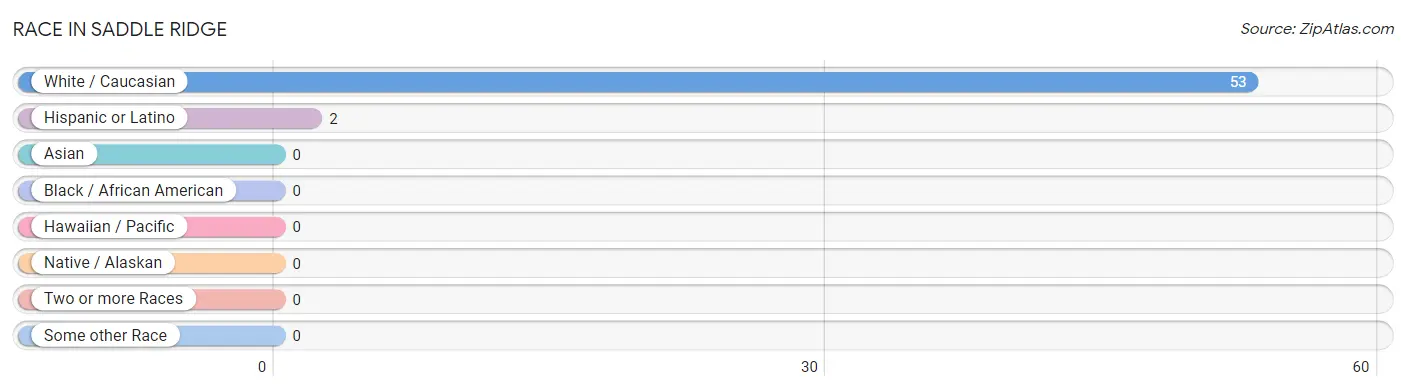
Race in Saddle Ridge
The most populous races in Saddle Ridge are White / Caucasian (53 | 100.0%), and Hispanic or Latino (2 | 3.8%).
| Race | # Population | % Population |
| Asian | 0 | 0.0% |
| Black / African American | 0 | 0.0% |
| Hawaiian / Pacific | 0 | 0.0% |
| Hispanic or Latino | 2 | 3.8% |
| Native / Alaskan | 0 | 0.0% |
| White / Caucasian | 53 | 100.0% |
| Two or more Races | 0 | 0.0% |
| Some other Race | 0 | 0.0% |
| Total | 53 | 100.0% |
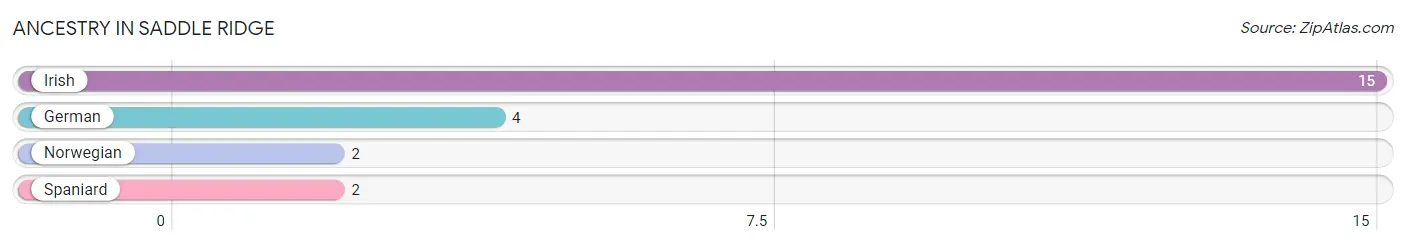
Ancestry in Saddle Ridge
The most populous ancestries reported in Saddle Ridge are Irish (15 | 28.3%), German (4 | 7.5%), Norwegian (2 | 3.8%), and Spaniard (2 | 3.8%), together accounting for 43.4% of all Saddle Ridge residents.
| Ancestry | # Population | % Population |
| German | 4 | 7.5% |
| Irish | 15 | 28.3% |
| Norwegian | 2 | 3.8% |
| Spaniard | 2 | 3.8% | View All 4 Rows |
Immigrants in Saddle Ridge

| Immigration Origin | # Population | % Population | View All 0 Rows |
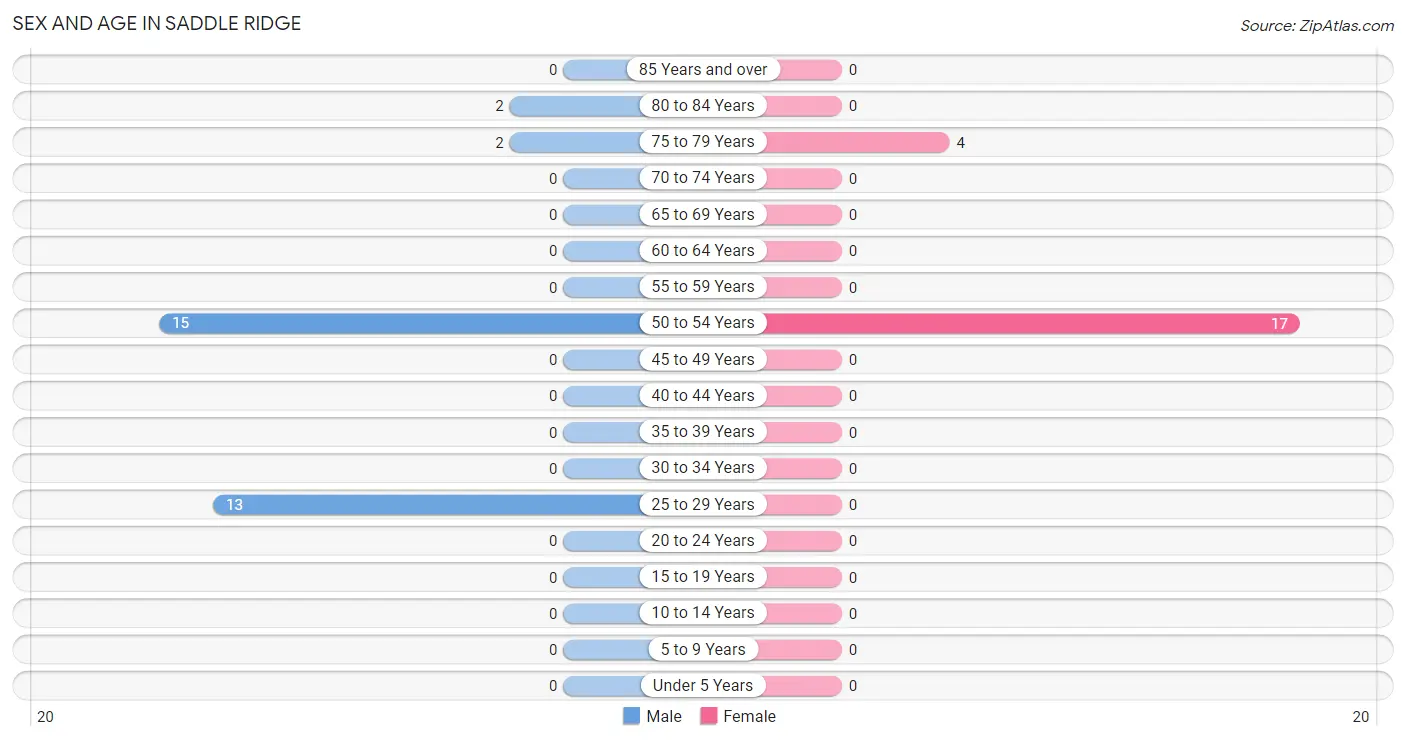
Sex and Age in Saddle Ridge
Sex and Age in Saddle Ridge
The most populous age groups in Saddle Ridge are 50 to 54 Years (15 | 46.9%) for men and 50 to 54 Years (17 | 80.9%) for women.
| Age Bracket | Male | Female |
| Under 5 Years | 0 (0.0%) | 0 (0.0%) |
| 5 to 9 Years | 0 (0.0%) | 0 (0.0%) |
| 10 to 14 Years | 0 (0.0%) | 0 (0.0%) |
| 15 to 19 Years | 0 (0.0%) | 0 (0.0%) |
| 20 to 24 Years | 0 (0.0%) | 0 (0.0%) |
| 25 to 29 Years | 13 (40.6%) | 0 (0.0%) |
| 30 to 34 Years | 0 (0.0%) | 0 (0.0%) |
| 35 to 39 Years | 0 (0.0%) | 0 (0.0%) |
| 40 to 44 Years | 0 (0.0%) | 0 (0.0%) |
| 45 to 49 Years | 0 (0.0%) | 0 (0.0%) |
| 50 to 54 Years | 15 (46.9%) | 17 (80.9%) |
| 55 to 59 Years | 0 (0.0%) | 0 (0.0%) |
| 60 to 64 Years | 0 (0.0%) | 0 (0.0%) |
| 65 to 69 Years | 0 (0.0%) | 0 (0.0%) |
| 70 to 74 Years | 0 (0.0%) | 0 (0.0%) |
| 75 to 79 Years | 2 (6.2%) | 4 (19.1%) |
| 80 to 84 Years | 2 (6.2%) | 0 (0.0%) |
| 85 Years and over | 0 (0.0%) | 0 (0.0%) |
| Total | 32 (100.0%) | 21 (100.0%) |
Families and Households in Saddle Ridge
Median Family Size in Saddle Ridge
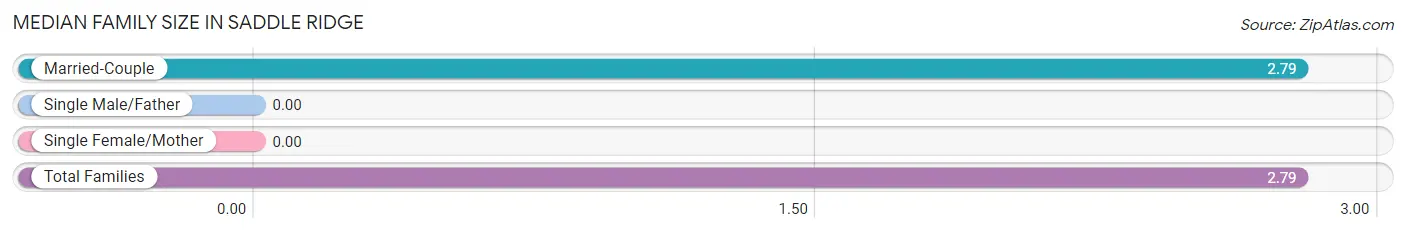
| Family Type | # Families | Family Size |
| Married-Couple | 19 (100.0%) | 2.79 |
| Single Male/Father | 0 (0.0%) | - |
| Single Female/Mother | 0 (0.0%) | - |
| Total Families | 19 (100.0%) | 2.79 |
Median Household Size in Saddle Ridge
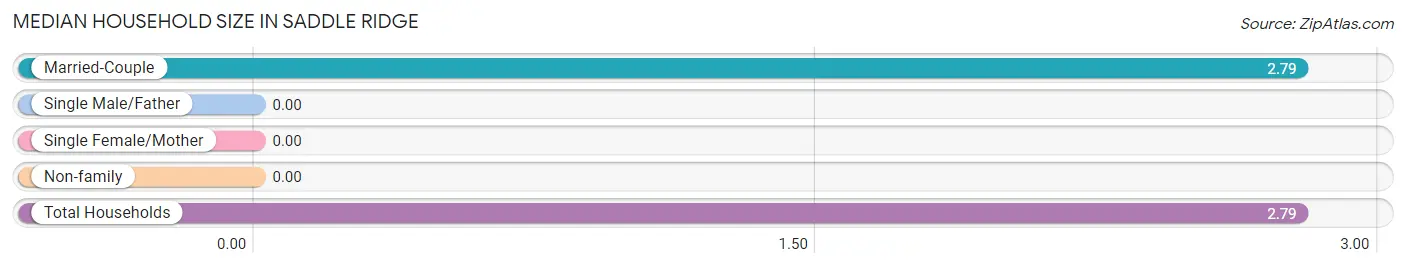
| Household Type | # Households | Household Size |
| Married-Couple | 19 (100.0%) | 2.79 |
| Single Male/Father | 0 (0.0%) | - |
| Single Female/Mother | 0 (0.0%) | - |
| Non-family | 0 (0.0%) | - |
| Total Households | 19 (100.0%) | 2.79 |
Household Size by Marriage Status in Saddle Ridge
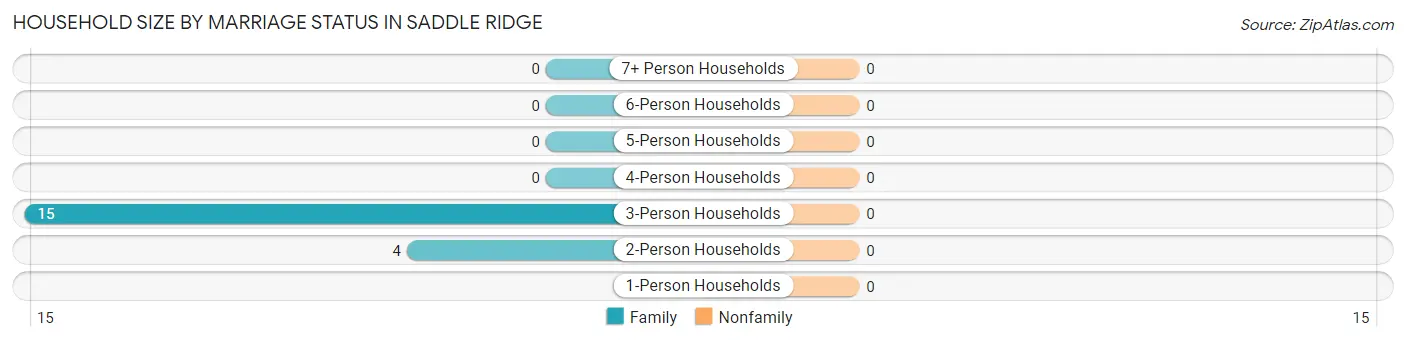
| Household Size | Family Households | Nonfamily Households |
| 1-Person Households | - | 0 (0.0%) |
| 2-Person Households | 4 (21.0%) | 0 (0.0%) |
| 3-Person Households | 15 (78.9%) | 0 (0.0%) |
| 4-Person Households | 0 (0.0%) | 0 (0.0%) |
| 5-Person Households | 0 (0.0%) | 0 (0.0%) |
| 6-Person Households | 0 (0.0%) | 0 (0.0%) |
| 7+ Person Households | 0 (0.0%) | 0 (0.0%) |
| Total | 19 (100.0%) | 0 (0.0%) |
Female Fertility in Saddle Ridge
Fertility by Age in Saddle Ridge
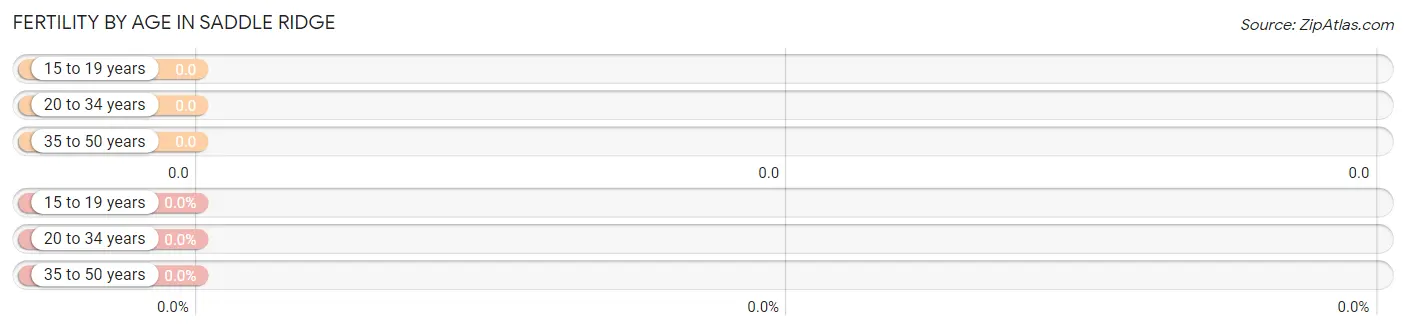
| Age Bracket | Women with Births | Births / 1,000 Women |
| 15 to 19 years | 0 (0.0%) | 0.0 |
| 20 to 34 years | 0 (0.0%) | 0.0 |
| 35 to 50 years | 0 (0.0%) | 0.0 |
| Total | 0 (0.0%) | 0.0 |
Fertility by Age by Marriage Status in Saddle Ridge
| Age Bracket | Married | Unmarried |
| 15 to 19 years | 0 (0.0%) | 0 (0.0%) |
| 20 to 34 years | 0 (0.0%) | 0 (0.0%) |
| 35 to 50 years | 0 (0.0%) | 0 (0.0%) |
| Total | 0 (0.0%) | 0 (0.0%) |
Fertility by Education in Saddle Ridge
| Educational Attainment | Women with Births | Births / 1,000 Women |
| Less than High School | 0 (0.0%) | 0.0 |
| High School Diploma | 0 (0.0%) | 0.0 |
| College or Associate's Degree | 0 (0.0%) | 0.0 |
| Bachelor's Degree | 0 (0.0%) | 0.0 |
| Graduate Degree | 0 (0.0%) | 0.0 |
| Total | 0 (0.0%) | 0.0 |
Fertility by Education by Marriage Status in Saddle Ridge
| Educational Attainment | Married | Unmarried |
| Less than High School | 0 (0.0%) | 0 (0.0%) |
| High School Diploma | 0 (0.0%) | 0 (0.0%) |
| College or Associate's Degree | 0 (0.0%) | 0 (0.0%) |
| Bachelor's Degree | 0 (0.0%) | 0 (0.0%) |
| Graduate Degree | 0 (0.0%) | 0 (0.0%) |
| Total | 0 (0.0%) | 0 (0.0%) |
Income in Saddle Ridge
Income Overview in Saddle Ridge
| Characteristic | Number | Measure |
| Per Capita Income | 53 | $11,421 |
| Median Family Income | 19 | $0 |
| Mean Family Income | 19 | $31,726 |
| Median Household Income | 19 | $0 |
| Mean Household Income | 19 | $31,726 |
| Income Deficit | 19 | $0 |
| Wage / Income Gap (%) | 53 | 0.00% |
| Wage / Income Gap ($) | 53 | 100.00¢ per $1 |
| Gini / Inequality Index | 53 | 0.39 |
Earnings by Sex in Saddle Ridge
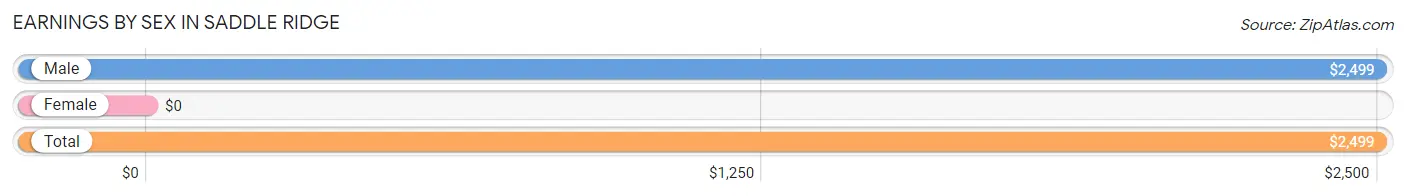
| Sex | Number | Average Earnings |
| Male | 30 (63.8%) | $2,499 |
| Female | 17 (36.2%) | $0 |
| Total | 47 (100.0%) | $2,499 |
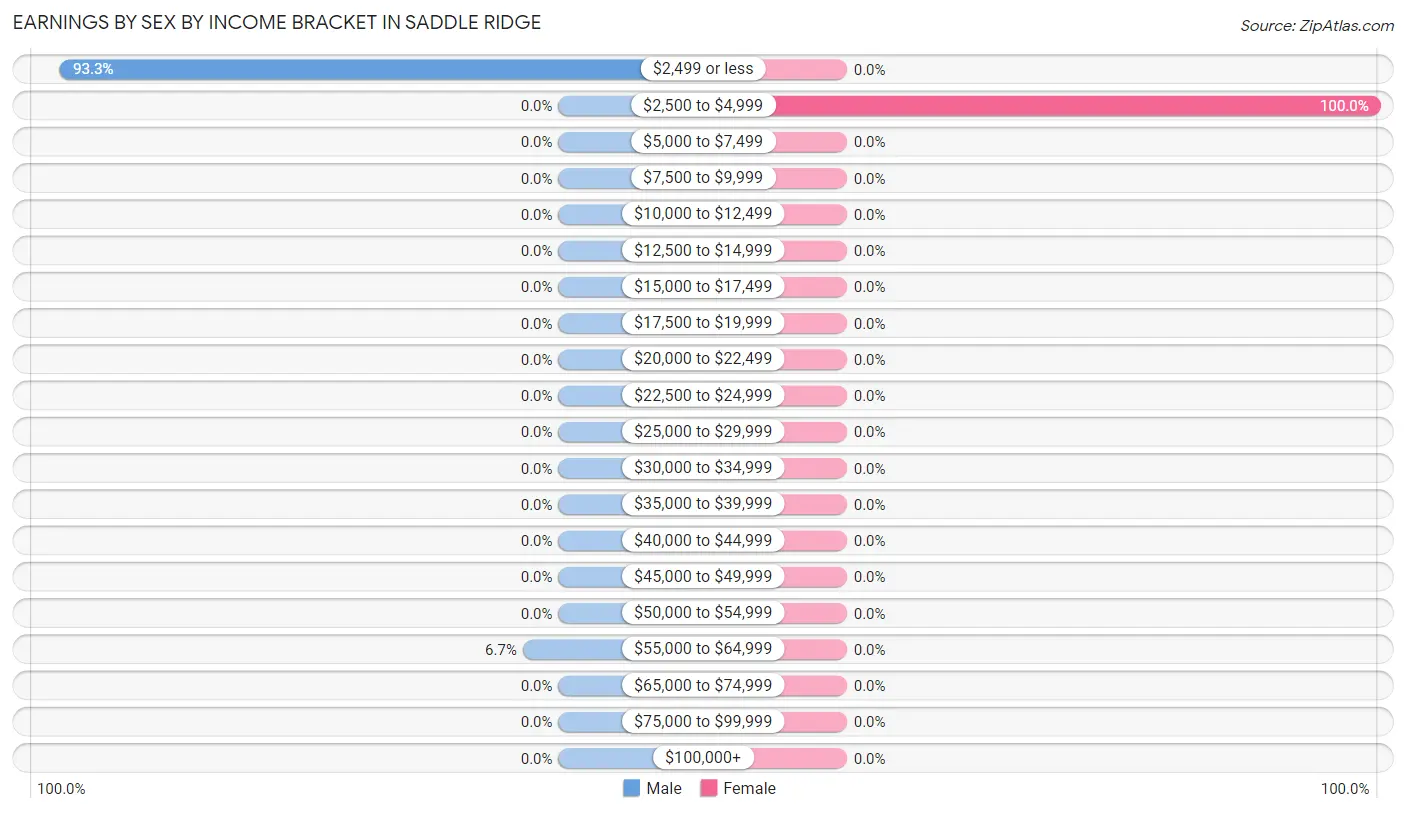
Earnings by Sex by Income Bracket in Saddle Ridge
The most common earnings brackets in Saddle Ridge are $2,499 or less for men (28 | 93.3%) and $2,500 to $4,999 for women (17 | 100.0%).
| Income | Male | Female |
| $2,499 or less | 28 (93.3%) | 0 (0.0%) |
| $2,500 to $4,999 | 0 (0.0%) | 17 (100.0%) |
| $5,000 to $7,499 | 0 (0.0%) | 0 (0.0%) |
| $7,500 to $9,999 | 0 (0.0%) | 0 (0.0%) |
| $10,000 to $12,499 | 0 (0.0%) | 0 (0.0%) |
| $12,500 to $14,999 | 0 (0.0%) | 0 (0.0%) |
| $15,000 to $17,499 | 0 (0.0%) | 0 (0.0%) |
| $17,500 to $19,999 | 0 (0.0%) | 0 (0.0%) |
| $20,000 to $22,499 | 0 (0.0%) | 0 (0.0%) |
| $22,500 to $24,999 | 0 (0.0%) | 0 (0.0%) |
| $25,000 to $29,999 | 0 (0.0%) | 0 (0.0%) |
| $30,000 to $34,999 | 0 (0.0%) | 0 (0.0%) |
| $35,000 to $39,999 | 0 (0.0%) | 0 (0.0%) |
| $40,000 to $44,999 | 0 (0.0%) | 0 (0.0%) |
| $45,000 to $49,999 | 0 (0.0%) | 0 (0.0%) |
| $50,000 to $54,999 | 0 (0.0%) | 0 (0.0%) |
| $55,000 to $64,999 | 2 (6.7%) | 0 (0.0%) |
| $65,000 to $74,999 | 0 (0.0%) | 0 (0.0%) |
| $75,000 to $99,999 | 0 (0.0%) | 0 (0.0%) |
| $100,000+ | 0 (0.0%) | 0 (0.0%) |
| Total | 30 (100.0%) | 17 (100.0%) |
Earnings by Sex by Educational Attainment in Saddle Ridge
| Educational Attainment | Male Income | Female Income |
| Less than High School | - | - |
| High School Diploma | - | - |
| College or Associate's Degree | - | - |
| Bachelor's Degree | - | - |
| Graduate Degree | - | - |
| Total | $2,499 | $0 |
Family Income in Saddle Ridge
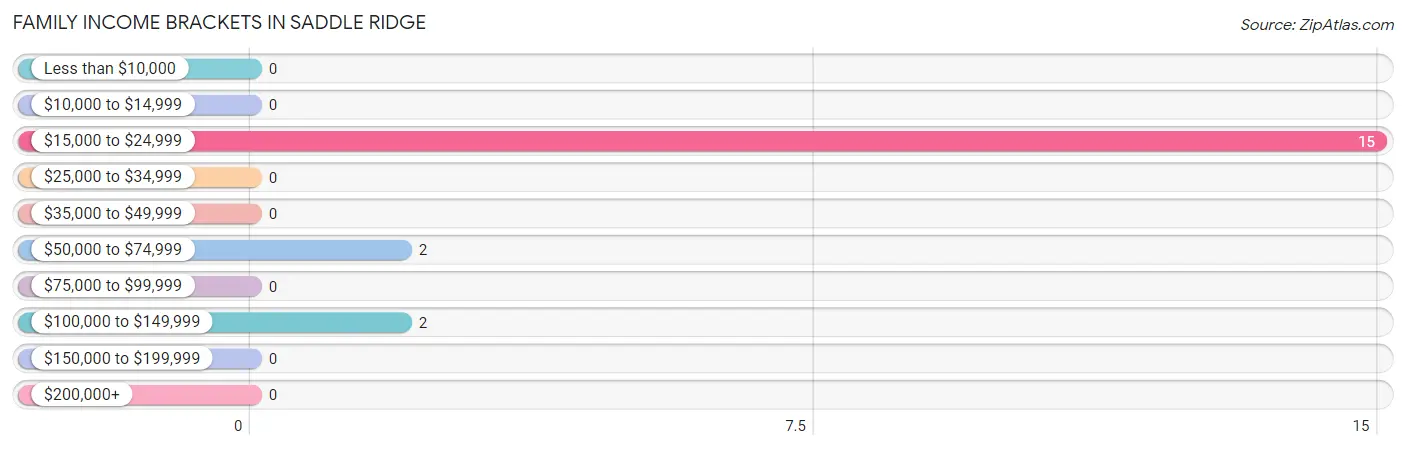
Family Income Brackets in Saddle Ridge
According to the Saddle Ridge family income data, there are 15 families falling into the $15,000 to $24,999 income range, which is the most common income bracket and makes up 78.9% of all families.
| Income Bracket | # Families | % Families |
| Less than $10,000 | 0 | 0.0% |
| $10,000 to $14,999 | 0 | 0.0% |
| $15,000 to $24,999 | 15 | 78.9% |
| $25,000 to $34,999 | 0 | 0.0% |
| $35,000 to $49,999 | 0 | 0.0% |
| $50,000 to $74,999 | 2 | 10.5% |
| $75,000 to $99,999 | 0 | 0.0% |
| $100,000 to $149,999 | 2 | 10.5% |
| $150,000 to $199,999 | 0 | 0.0% |
| $200,000+ | 0 | 0.0% |
Family Income by Famaliy Size in Saddle Ridge
| Income Bracket | # Families | Median Income |
| 2-Person Families | 4 (21.0%) | $0 |
| 3-Person Families | 15 (78.9%) | $0 |
| 4-Person Families | 0 (0.0%) | $0 |
| 5-Person Families | 0 (0.0%) | $0 |
| 6-Person Families | 0 (0.0%) | $0 |
| 7+ Person Families | 0 (0.0%) | $0 |
| Total | 19 (100.0%) | $0 |
Family Income by Number of Earners in Saddle Ridge
| Number of Earners | # Families | Median Income |
| No Earners | 2 (10.5%) | $0 |
| 1 Earner | 2 (10.5%) | $0 |
| 2 Earners | 0 (0.0%) | $0 |
| 3+ Earners | 15 (78.9%) | $0 |
| Total | 19 (100.0%) | $0 |
Household Income in Saddle Ridge
Household Income Brackets in Saddle Ridge
With 15 households falling in the category, the $15,000 to $24,999 income range is the most frequent in Saddle Ridge, accounting for 78.9% of all households.
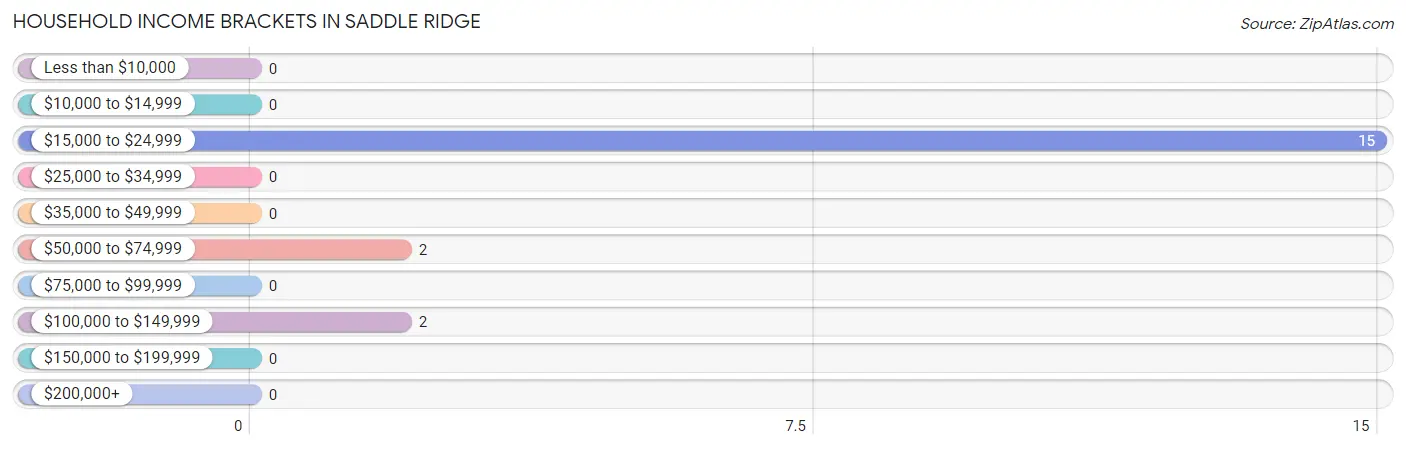
| Income Bracket | # Households | % Households |
| Less than $10,000 | 0 | 0.0% |
| $10,000 to $14,999 | 0 | 0.0% |
| $15,000 to $24,999 | 15 | 78.9% |
| $25,000 to $34,999 | 0 | 0.0% |
| $35,000 to $49,999 | 0 | 0.0% |
| $50,000 to $74,999 | 2 | 10.5% |
| $75,000 to $99,999 | 0 | 0.0% |
| $100,000 to $149,999 | 2 | 10.5% |
| $150,000 to $199,999 | 0 | 0.0% |
| $200,000+ | 0 | 0.0% |
Household Income by Householder Age in Saddle Ridge
| Income Bracket | # Households | Median Income |
| 15 to 24 Years | 0 (0.0%) | $0 |
| 25 to 44 Years | 0 (0.0%) | $0 |
| 45 to 64 Years | 15 (78.9%) | $0 |
| 65+ Years | 4 (21.0%) | $0 |
| Total | 19 (100.0%) | $0 |
Poverty in Saddle Ridge
Income Below Poverty by Sex and Age in Saddle Ridge
With 87.5% poverty level for males and 80.9% for females among the residents of Saddle Ridge, 25 to 34 year old males and 45 to 54 year old females are the most vulnerable to poverty, with 13 males (100.0%) and 17 females (100.0%) in their respective age groups living below the poverty level.
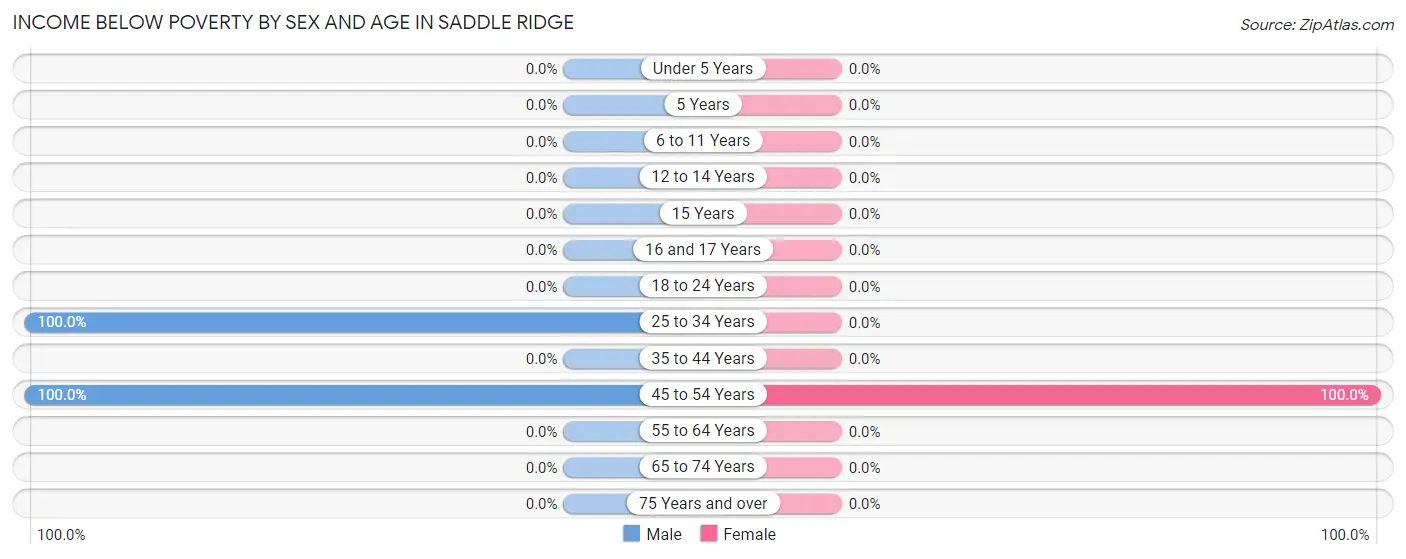
| Age Bracket | Male | Female |
| Under 5 Years | 0 (0.0%) | 0 (0.0%) |
| 5 Years | 0 (0.0%) | 0 (0.0%) |
| 6 to 11 Years | 0 (0.0%) | 0 (0.0%) |
| 12 to 14 Years | 0 (0.0%) | 0 (0.0%) |
| 15 Years | 0 (0.0%) | 0 (0.0%) |
| 16 and 17 Years | 0 (0.0%) | 0 (0.0%) |
| 18 to 24 Years | 0 (0.0%) | 0 (0.0%) |
| 25 to 34 Years | 13 (100.0%) | 0 (0.0%) |
| 35 to 44 Years | 0 (0.0%) | 0 (0.0%) |
| 45 to 54 Years | 15 (100.0%) | 17 (100.0%) |
| 55 to 64 Years | 0 (0.0%) | 0 (0.0%) |
| 65 to 74 Years | 0 (0.0%) | 0 (0.0%) |
| 75 Years and over | 0 (0.0%) | 0 (0.0%) |
| Total | 28 (87.5%) | 17 (80.9%) |
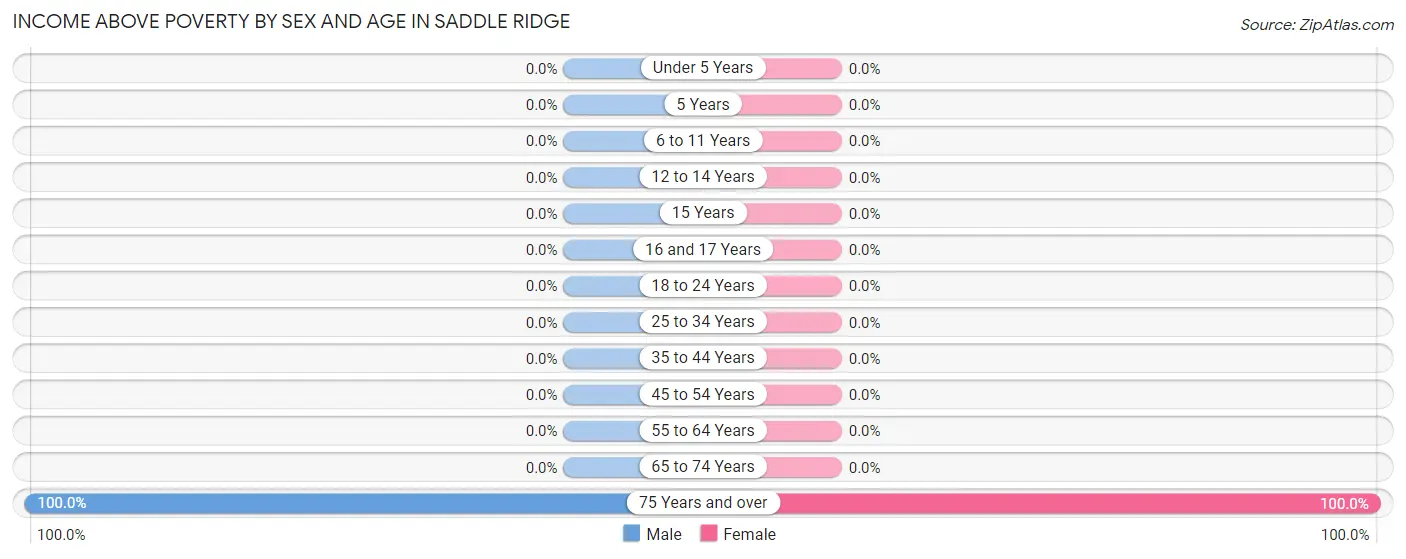
Income Above Poverty by Sex and Age in Saddle Ridge
According to the poverty statistics in Saddle Ridge, males aged 75 years and over and females aged 75 years and over are the age groups that are most secure financially, with 100.0% of males and 100.0% of females in these age groups living above the poverty line.
| Age Bracket | Male | Female |
| Under 5 Years | 0 (0.0%) | 0 (0.0%) |
| 5 Years | 0 (0.0%) | 0 (0.0%) |
| 6 to 11 Years | 0 (0.0%) | 0 (0.0%) |
| 12 to 14 Years | 0 (0.0%) | 0 (0.0%) |
| 15 Years | 0 (0.0%) | 0 (0.0%) |
| 16 and 17 Years | 0 (0.0%) | 0 (0.0%) |
| 18 to 24 Years | 0 (0.0%) | 0 (0.0%) |
| 25 to 34 Years | 0 (0.0%) | 0 (0.0%) |
| 35 to 44 Years | 0 (0.0%) | 0 (0.0%) |
| 45 to 54 Years | 0 (0.0%) | 0 (0.0%) |
| 55 to 64 Years | 0 (0.0%) | 0 (0.0%) |
| 65 to 74 Years | 0 (0.0%) | 0 (0.0%) |
| 75 Years and over | 4 (100.0%) | 4 (100.0%) |
| Total | 4 (12.5%) | 4 (19.1%) |
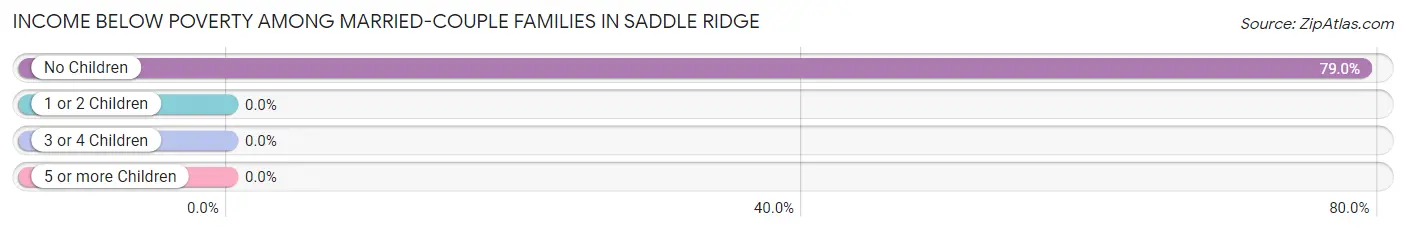
Income Below Poverty Among Married-Couple Families in Saddle Ridge
The poverty statistics for married-couple families in Saddle Ridge show that 78.9% or 15 of the total 19 families live below the poverty line. Families with no children have the highest poverty rate of 78.9%, comprising of 15 families. On the other hand, families with no children have the lowest poverty rate of 78.9%, which includes 15 families.
| Children | Above Poverty | Below Poverty |
| No Children | 4 (21.0%) | 15 (78.9%) |
| 1 or 2 Children | 0 (0.0%) | 0 (0.0%) |
| 3 or 4 Children | 0 (0.0%) | 0 (0.0%) |
| 5 or more Children | 0 (0.0%) | 0 (0.0%) |
| Total | 4 (21.0%) | 15 (78.9%) |
Income Below Poverty Among Single-Parent Households in Saddle Ridge
| Children | Single Father | Single Mother |
| No Children | 0 (0.0%) | 0 (0.0%) |
| 1 or 2 Children | 0 (0.0%) | 0 (0.0%) |
| 3 or 4 Children | 0 (0.0%) | 0 (0.0%) |
| 5 or more Children | 0 (0.0%) | 0 (0.0%) |
| Total | 0 (0.0%) | 0 (0.0%) |
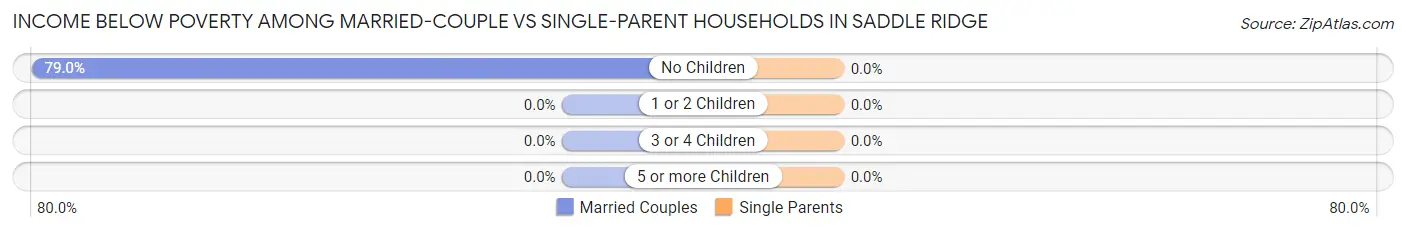
Income Below Poverty Among Married-Couple vs Single-Parent Households in Saddle Ridge
| Children | Married-Couple Families | Single-Parent Households |
| No Children | 15 (78.9%) | 0 (0.0%) |
| 1 or 2 Children | 0 (0.0%) | 0 (0.0%) |
| 3 or 4 Children | 0 (0.0%) | 0 (0.0%) |
| 5 or more Children | 0 (0.0%) | 0 (0.0%) |
| Total | 15 (78.9%) | 0 (0.0%) |
Employment Characteristics in Saddle Ridge
Employment by Class of Employer in Saddle Ridge
Among the 28 employed individuals in Saddle Ridge, state government employees (15 | 53.6%), and local government employees (13 | 46.4%) make up the most common classes of employment.
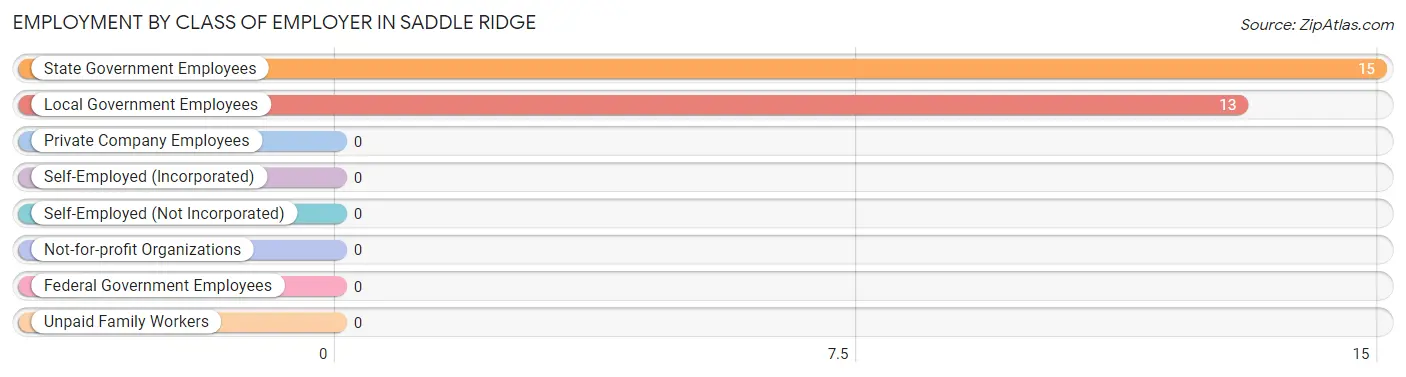
| Employer Class | # Employees | % Employees |
| Private Company Employees | 0 | 0.0% |
| Self-Employed (Incorporated) | 0 | 0.0% |
| Self-Employed (Not Incorporated) | 0 | 0.0% |
| Not-for-profit Organizations | 0 | 0.0% |
| Local Government Employees | 13 | 46.4% |
| State Government Employees | 15 | 53.6% |
| Federal Government Employees | 0 | 0.0% |
| Unpaid Family Workers | 0 | 0.0% |
| Total | 28 | 100.0% |
Employment Status by Age in Saddle Ridge
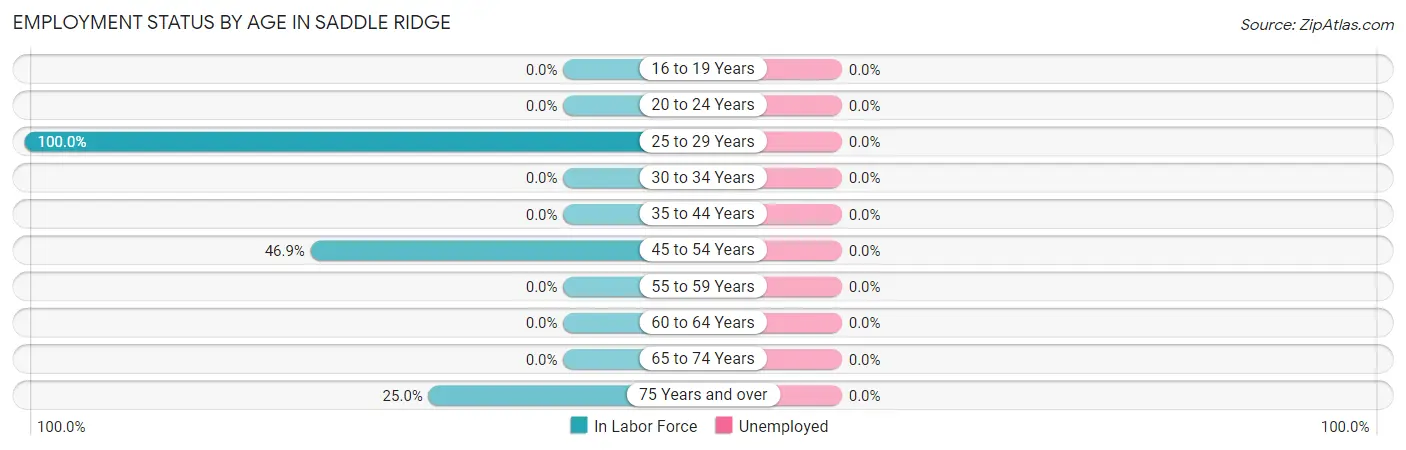
| Age Bracket | In Labor Force | Unemployed |
| 16 to 19 Years | 0 (0.0%) | 0 (0.0%) |
| 20 to 24 Years | 0 (0.0%) | 0 (0.0%) |
| 25 to 29 Years | 13 (100.0%) | 0 (0.0%) |
| 30 to 34 Years | 0 (0.0%) | 0 (0.0%) |
| 35 to 44 Years | 0 (0.0%) | 0 (0.0%) |
| 45 to 54 Years | 15 (46.9%) | 0 (0.0%) |
| 55 to 59 Years | 0 (0.0%) | 0 (0.0%) |
| 60 to 64 Years | 0 (0.0%) | 0 (0.0%) |
| 65 to 74 Years | 0 (0.0%) | 0 (0.0%) |
| 75 Years and over | 2 (25.0%) | 0 (0.0%) |
| Total | 30 (56.6%) | 0 (0.0%) |
Employment Status by Educational Attainment in Saddle Ridge
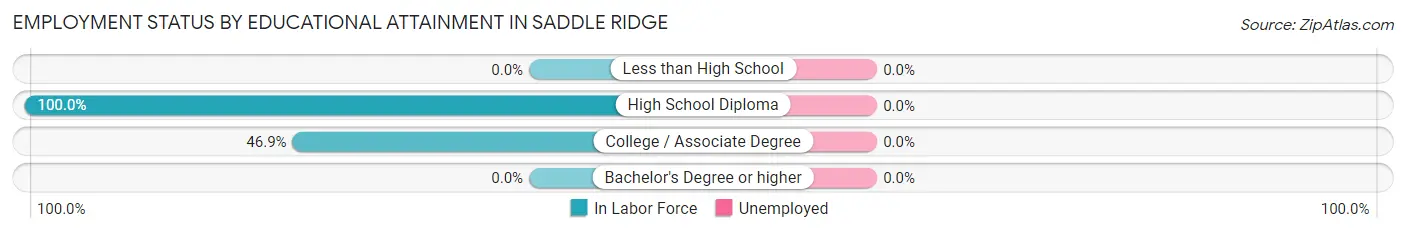
| Educational Attainment | In Labor Force | Unemployed |
| Less than High School | 0 (0.0%) | 0 (0.0%) |
| High School Diploma | 13 (100.0%) | 0 (0.0%) |
| College / Associate Degree | 15 (46.9%) | 0 (0.0%) |
| Bachelor's Degree or higher | 0 (0.0%) | 0 (0.0%) |
| Total | 28 (62.2%) | 0 (0.0%) |
Employment Occupations by Sex in Saddle Ridge
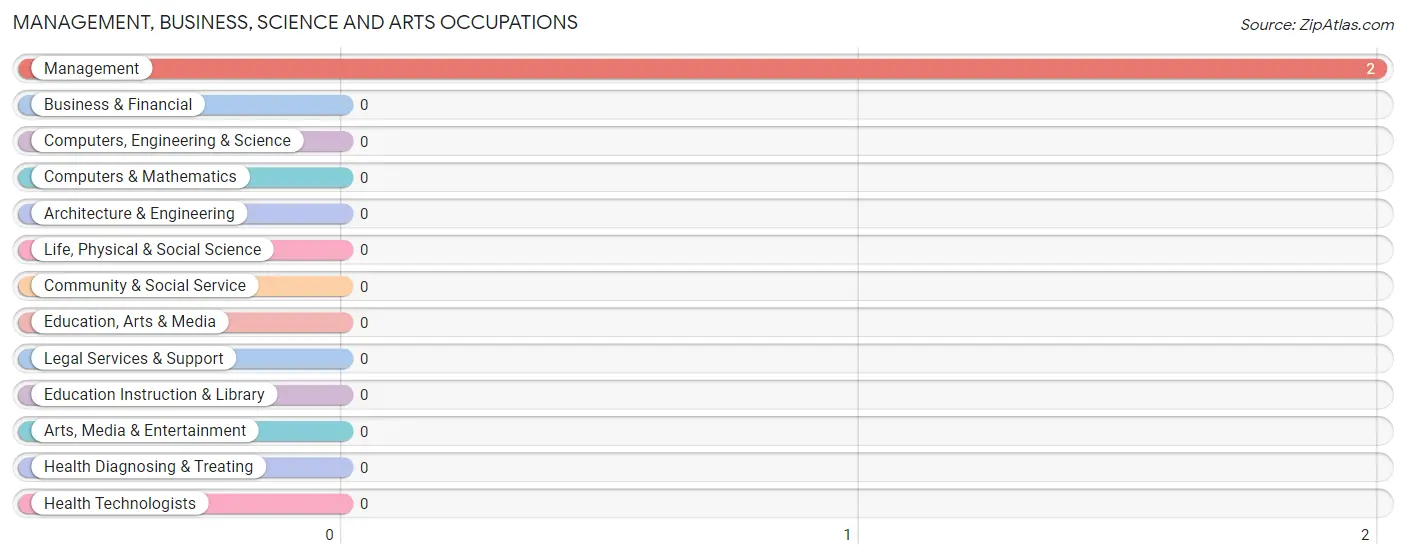
Management, Business, Science and Arts Occupations
The most common Management, Business, Science and Arts occupations in Saddle Ridge are , and Management (2 | 6.7%).
Management, Business, Science and Arts Occupations by Sex
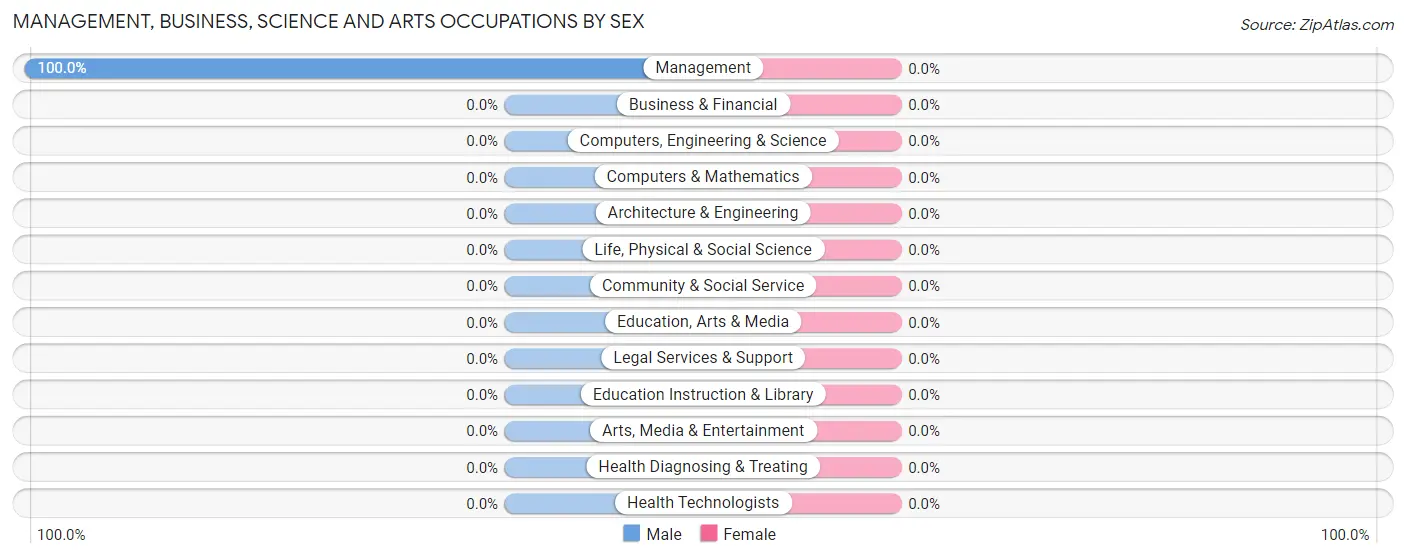
| Occupation | Male | Female |
| Management | 2 (100.0%) | 0 (0.0%) |
| Business & Financial | 0 (0.0%) | 0 (0.0%) |
| Computers, Engineering & Science | 0 (0.0%) | 0 (0.0%) |
| Computers & Mathematics | 0 (0.0%) | 0 (0.0%) |
| Architecture & Engineering | 0 (0.0%) | 0 (0.0%) |
| Life, Physical & Social Science | 0 (0.0%) | 0 (0.0%) |
| Community & Social Service | 0 (0.0%) | 0 (0.0%) |
| Education, Arts & Media | 0 (0.0%) | 0 (0.0%) |
| Legal Services & Support | 0 (0.0%) | 0 (0.0%) |
| Education Instruction & Library | 0 (0.0%) | 0 (0.0%) |
| Arts, Media & Entertainment | 0 (0.0%) | 0 (0.0%) |
| Health Diagnosing & Treating | 0 (0.0%) | 0 (0.0%) |
| Health Technologists | 0 (0.0%) | 0 (0.0%) |
| Total (Category) | 2 (100.0%) | 0 (0.0%) |
| Total (Overall) | 30 (100.0%) | 0 (0.0%) |
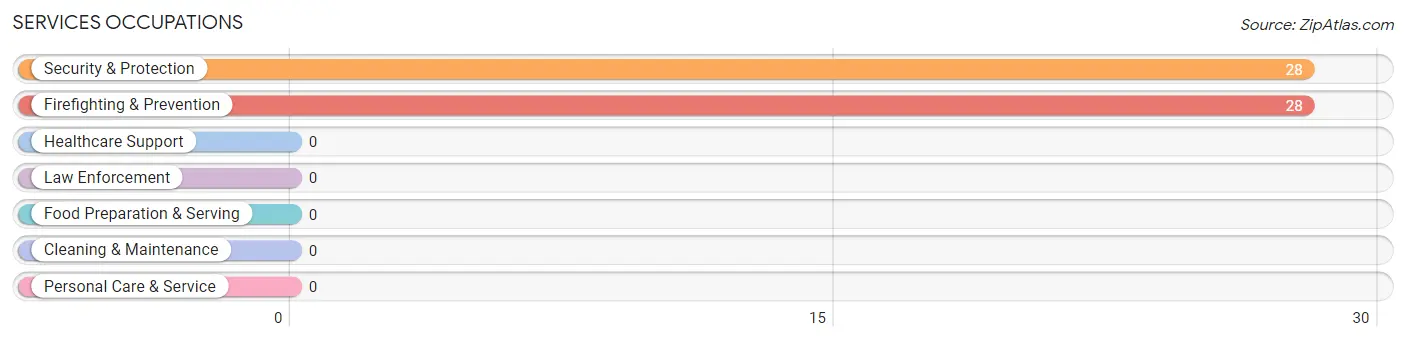
Services Occupations
The most common Services occupations in Saddle Ridge are Security & Protection (28 | 93.3%), and Firefighting & Prevention (28 | 93.3%).
Services Occupations by Sex
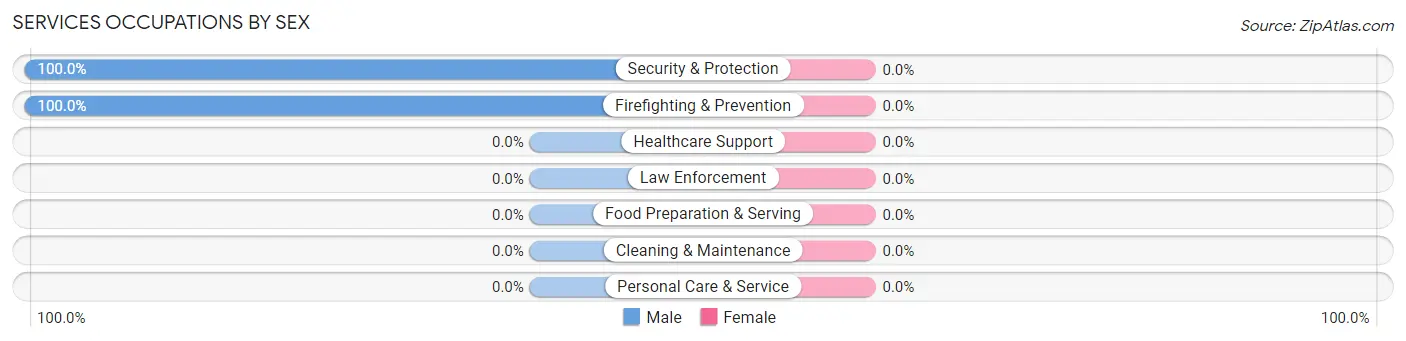
| Occupation | Male | Female |
| Healthcare Support | 0 (0.0%) | 0 (0.0%) |
| Security & Protection | 28 (100.0%) | 0 (0.0%) |
| Firefighting & Prevention | 28 (100.0%) | 0 (0.0%) |
| Law Enforcement | 0 (0.0%) | 0 (0.0%) |
| Food Preparation & Serving | 0 (0.0%) | 0 (0.0%) |
| Cleaning & Maintenance | 0 (0.0%) | 0 (0.0%) |
| Personal Care & Service | 0 (0.0%) | 0 (0.0%) |
| Total (Category) | 28 (100.0%) | 0 (0.0%) |
| Total (Overall) | 30 (100.0%) | 0 (0.0%) |
Sales and Office Occupations
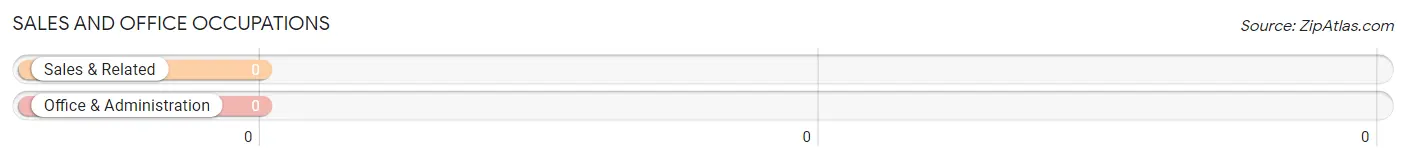
Sales and Office Occupations by Sex

| Occupation | Male | Female |
| Sales & Related | 0 (0.0%) | 0 (0.0%) |
| Office & Administration | 0 (0.0%) | 0 (0.0%) |
| Total (Category) | 0 (0.0%) | 0 (0.0%) |
| Total (Overall) | 30 (100.0%) | 0 (0.0%) |
Natural Resources, Construction and Maintenance Occupations
Natural Resources, Construction and Maintenance Occupations by Sex
| Occupation | Male | Female |
| Farming, Fishing & Forestry | 0 (0.0%) | 0 (0.0%) |
| Construction & Extraction | 0 (0.0%) | 0 (0.0%) |
| Installation, Maintenance & Repair | 0 (0.0%) | 0 (0.0%) |
| Total (Category) | 0 (0.0%) | 0 (0.0%) |
| Total (Overall) | 30 (100.0%) | 0 (0.0%) |
Production, Transportation and Moving Occupations
Production, Transportation and Moving Occupations by Sex
| Occupation | Male | Female |
| Production | 0 (0.0%) | 0 (0.0%) |
| Transportation | 0 (0.0%) | 0 (0.0%) |
| Material Moving | 0 (0.0%) | 0 (0.0%) |
| Total (Category) | 0 (0.0%) | 0 (0.0%) |
| Total (Overall) | 30 (100.0%) | 0 (0.0%) |
Employment Industries by Sex in Saddle Ridge
Employment Industries in Saddle Ridge
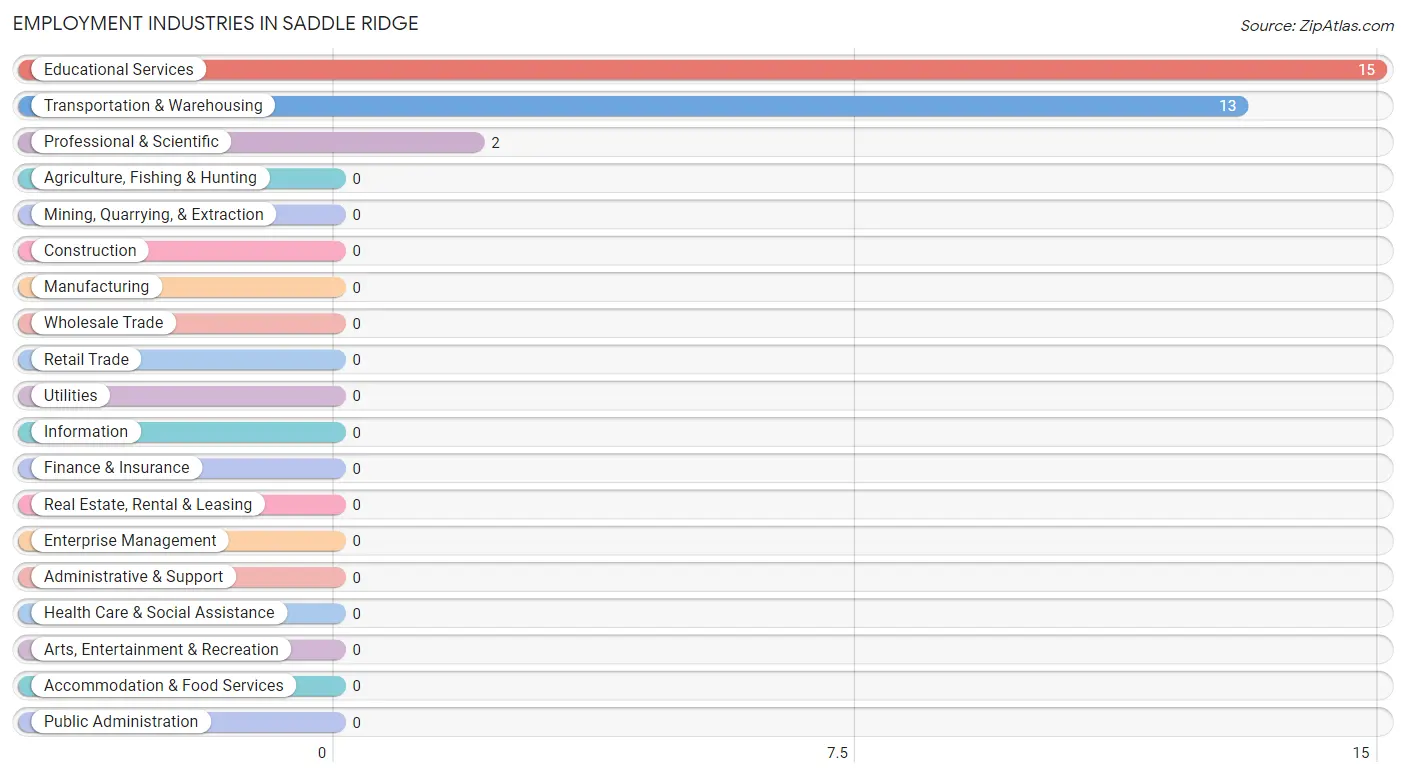
The major employment industries in Saddle Ridge include Educational Services (15 | 50.0%), Transportation & Warehousing (13 | 43.3%), and Professional & Scientific (2 | 6.7%).
Employment Industries by Sex in Saddle Ridge
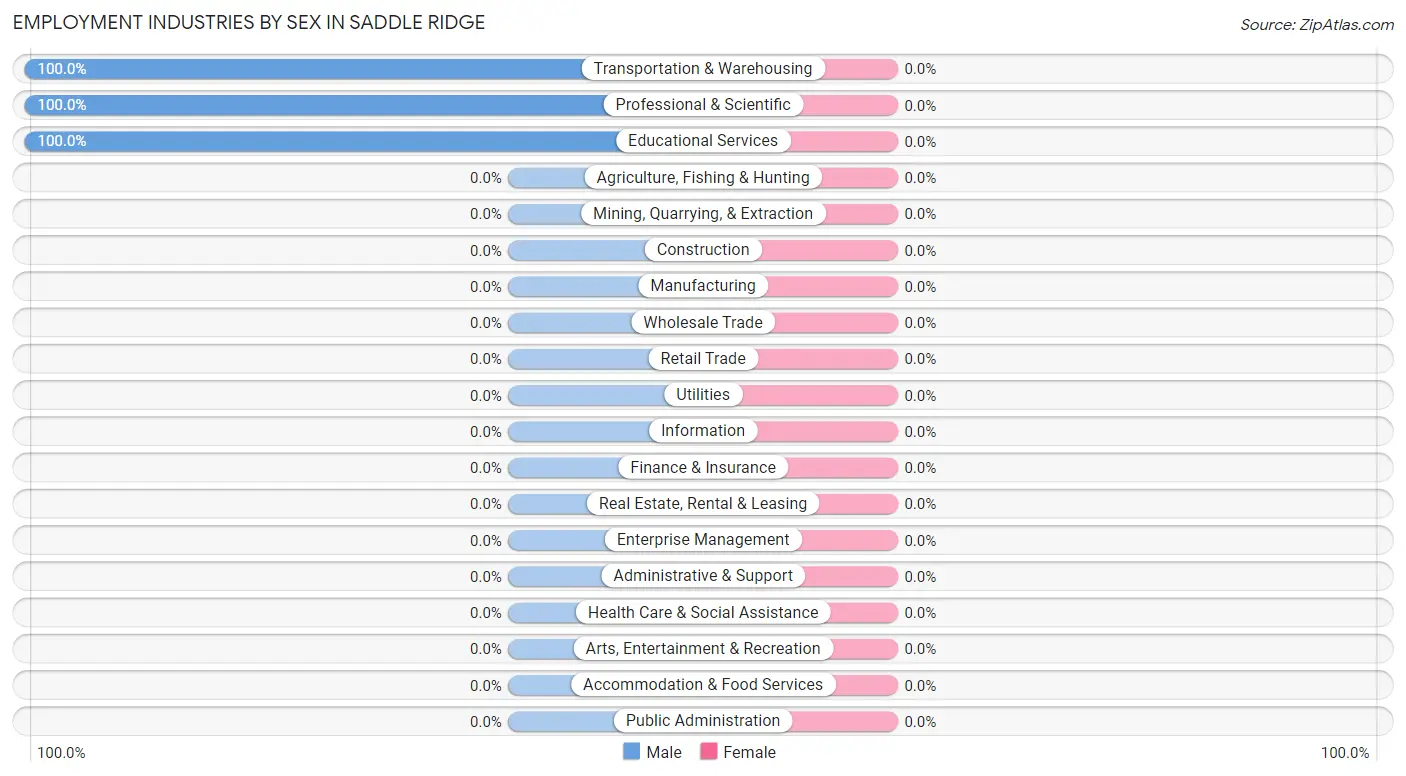
| Industry | Male | Female |
| Agriculture, Fishing & Hunting | 0 (0.0%) | 0 (0.0%) |
| Mining, Quarrying, & Extraction | 0 (0.0%) | 0 (0.0%) |
| Construction | 0 (0.0%) | 0 (0.0%) |
| Manufacturing | 0 (0.0%) | 0 (0.0%) |
| Wholesale Trade | 0 (0.0%) | 0 (0.0%) |
| Retail Trade | 0 (0.0%) | 0 (0.0%) |
| Transportation & Warehousing | 13 (100.0%) | 0 (0.0%) |
| Utilities | 0 (0.0%) | 0 (0.0%) |
| Information | 0 (0.0%) | 0 (0.0%) |
| Finance & Insurance | 0 (0.0%) | 0 (0.0%) |
| Real Estate, Rental & Leasing | 0 (0.0%) | 0 (0.0%) |
| Professional & Scientific | 2 (100.0%) | 0 (0.0%) |
| Enterprise Management | 0 (0.0%) | 0 (0.0%) |
| Administrative & Support | 0 (0.0%) | 0 (0.0%) |
| Educational Services | 15 (100.0%) | 0 (0.0%) |
| Health Care & Social Assistance | 0 (0.0%) | 0 (0.0%) |
| Arts, Entertainment & Recreation | 0 (0.0%) | 0 (0.0%) |
| Accommodation & Food Services | 0 (0.0%) | 0 (0.0%) |
| Public Administration | 0 (0.0%) | 0 (0.0%) |
| Total | 30 (100.0%) | 0 (0.0%) |
Education in Saddle Ridge
School Enrollment in Saddle Ridge
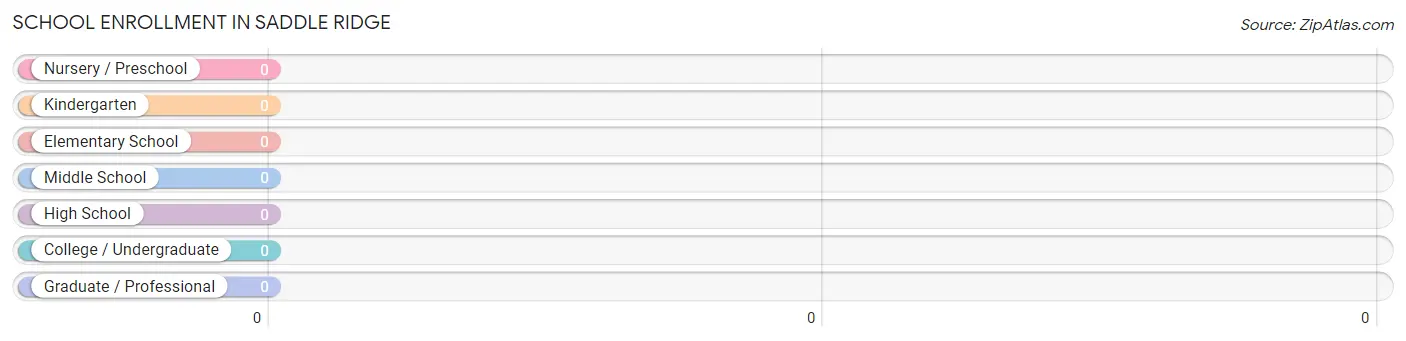
| School Level | # Students | % Students |
| Nursery / Preschool | 0 | 0.0% |
| Kindergarten | 0 | 0.0% |
| Elementary School | 0 | 0.0% |
| Middle School | 0 | 0.0% |
| High School | 0 | 0.0% |
| College / Undergraduate | 0 | 0.0% |
| Graduate / Professional | 0 | 0.0% |
| Total | 0 | 0.0% |
School Enrollment by Age by Funding Source in Saddle Ridge
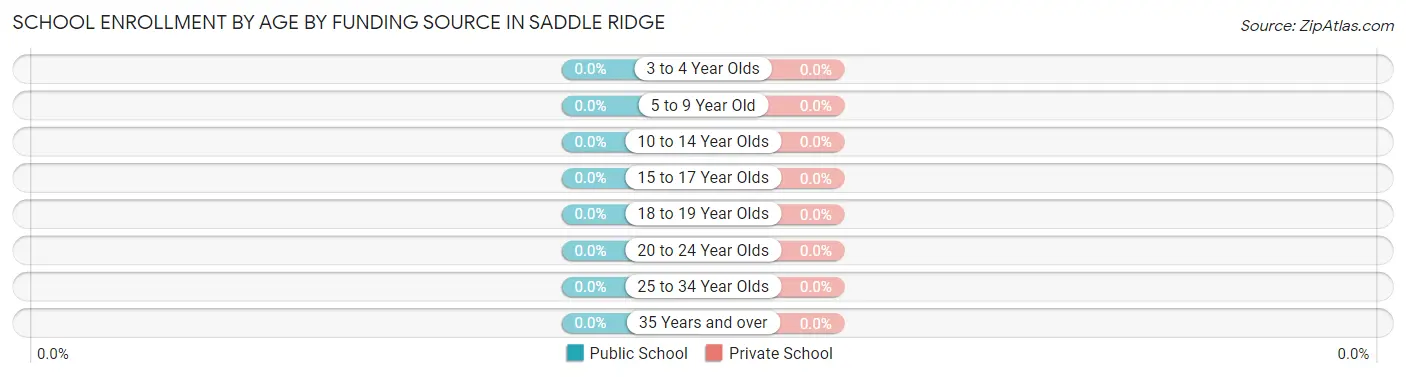
| Age Bracket | Public School | Private School |
| 3 to 4 Year Olds | 0 (0.0%) | 0 (0.0%) |
| 5 to 9 Year Old | 0 (0.0%) | 0 (0.0%) |
| 10 to 14 Year Olds | 0 (0.0%) | 0 (0.0%) |
| 15 to 17 Year Olds | 0 (0.0%) | 0 (0.0%) |
| 18 to 19 Year Olds | 0 (0.0%) | 0 (0.0%) |
| 20 to 24 Year Olds | 0 (0.0%) | 0 (0.0%) |
| 25 to 34 Year Olds | 0 (0.0%) | 0 (0.0%) |
| 35 Years and over | 0 (0.0%) | 0 (0.0%) |
| Total | 0 (0.0%) | 0 (0.0%) |
Educational Attainment by Field of Study in Saddle Ridge
| Field of Study | # Graduates | % Graduates |
| Computers & Mathematics | 0 | 0.0% |
| Bio, Nature & Agricultural | 0 | 0.0% |
| Physical & Health Sciences | 0 | 0.0% |
| Psychology | 0 | 0.0% |
| Social Sciences | 0 | 0.0% |
| Engineering | 0 | 0.0% |
| Multidisciplinary Studies | 0 | 0.0% |
| Science & Technology | 0 | 0.0% |
| Business | 0 | 0.0% |
| Education | 0 | 0.0% |
| Literature & Languages | 0 | 0.0% |
| Liberal Arts & History | 0 | 0.0% |
| Visual & Performing Arts | 0 | 0.0% |
| Communications | 0 | 0.0% |
| Arts & Humanities | 0 | 0.0% |
| Total | 0 | 0.0% |
Transportation & Commute in Saddle Ridge
Vehicle Availability by Sex in Saddle Ridge
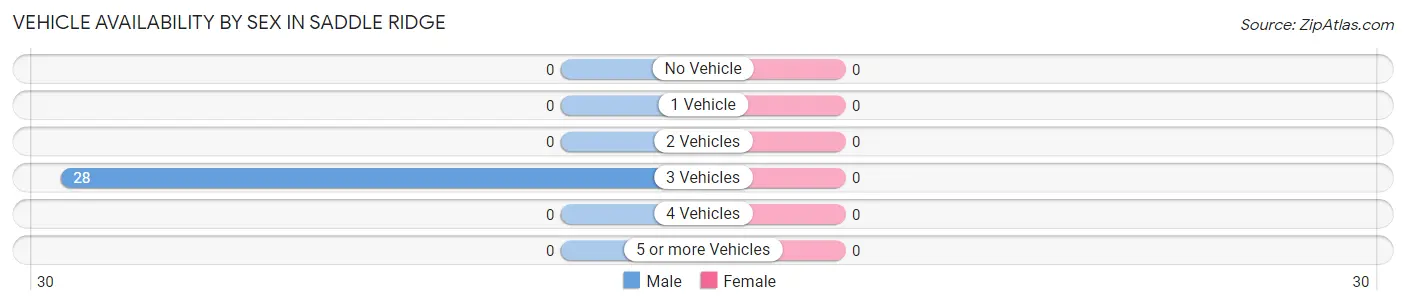
| Vehicles Available | Male | Female |
| No Vehicle | 0 (0.0%) | 0 (0.0%) |
| 1 Vehicle | 0 (0.0%) | 0 (0.0%) |
| 2 Vehicles | 0 (0.0%) | 0 (0.0%) |
| 3 Vehicles | 28 (100.0%) | 0 (0.0%) |
| 4 Vehicles | 0 (0.0%) | 0 (0.0%) |
| 5 or more Vehicles | 0 (0.0%) | 0 (0.0%) |
| Total | 28 (100.0%) | 0 (0.0%) |
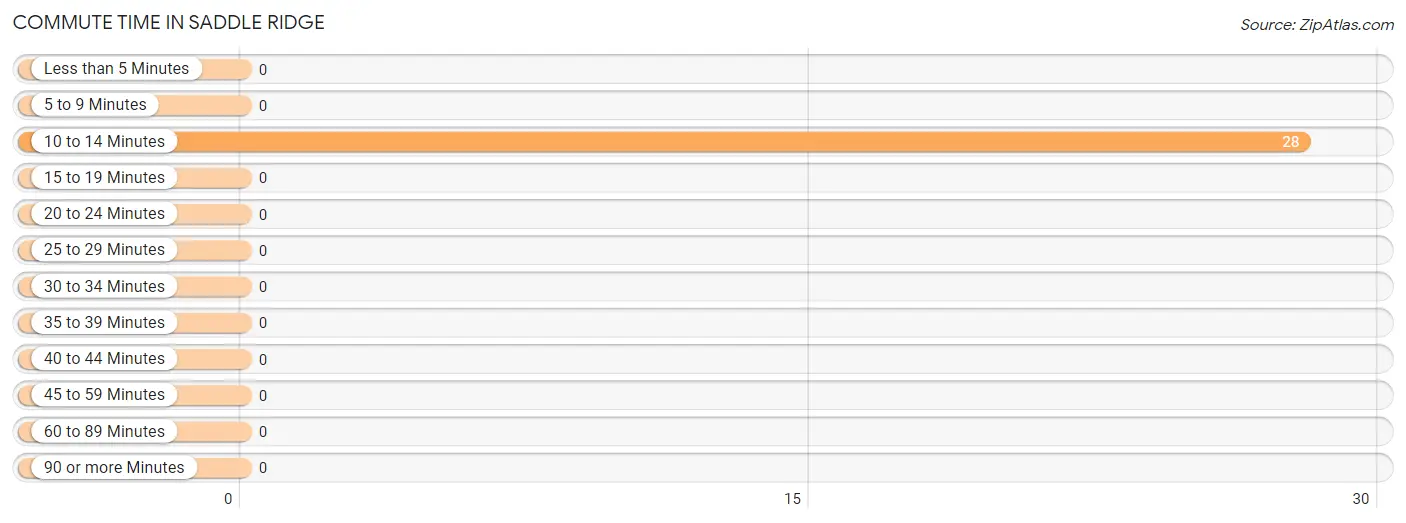
Commute Time in Saddle Ridge
The most frequently occuring commute durations in Saddle Ridge are 10 to 14 minutes (28 commuters, 100.0%), less than 5 minutes (0 commuters, 0.0%), and 5 to 9 minutes (0 commuters, 0.0%).
| Commute Time | # Commuters | % Commuters |
| Less than 5 Minutes | 0 | 0.0% |
| 5 to 9 Minutes | 0 | 0.0% |
| 10 to 14 Minutes | 28 | 100.0% |
| 15 to 19 Minutes | 0 | 0.0% |
| 20 to 24 Minutes | 0 | 0.0% |
| 25 to 29 Minutes | 0 | 0.0% |
| 30 to 34 Minutes | 0 | 0.0% |
| 35 to 39 Minutes | 0 | 0.0% |
| 40 to 44 Minutes | 0 | 0.0% |
| 45 to 59 Minutes | 0 | 0.0% |
| 60 to 89 Minutes | 0 | 0.0% |
| 90 or more Minutes | 0 | 0.0% |
Commute Time by Sex in Saddle Ridge
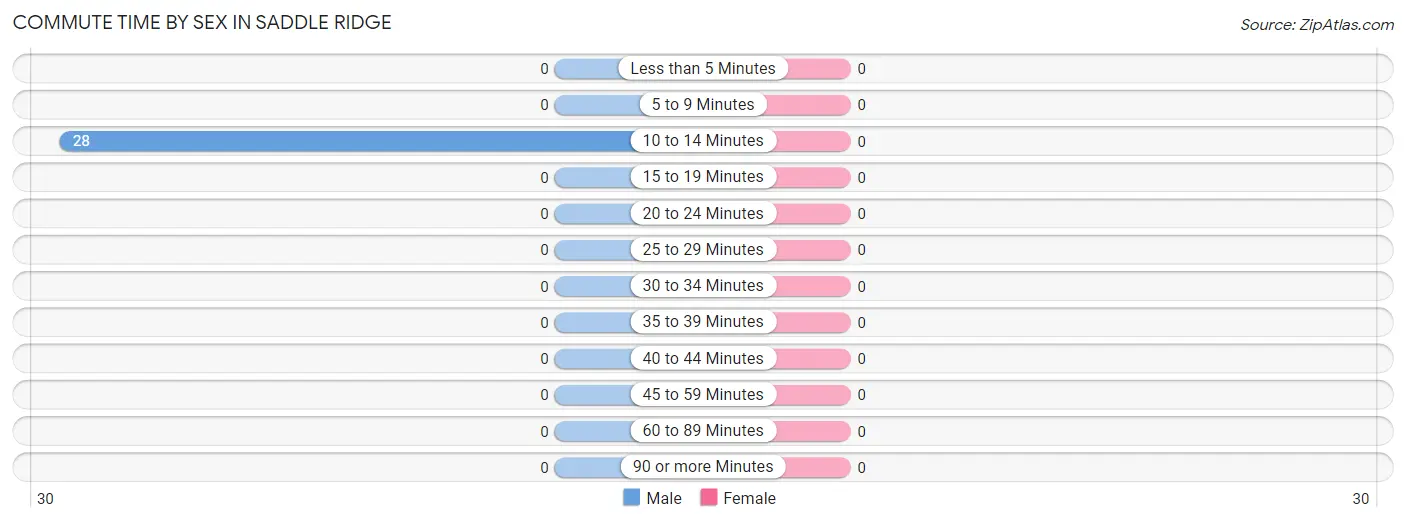
| Commute Time | Male | Female |
| Less than 5 Minutes | 0 (0.0%) | 0 (0.0%) |
| 5 to 9 Minutes | 0 (0.0%) | 0 (0.0%) |
| 10 to 14 Minutes | 28 (100.0%) | 0 (0.0%) |
| 15 to 19 Minutes | 0 (0.0%) | 0 (0.0%) |
| 20 to 24 Minutes | 0 (0.0%) | 0 (0.0%) |
| 25 to 29 Minutes | 0 (0.0%) | 0 (0.0%) |
| 30 to 34 Minutes | 0 (0.0%) | 0 (0.0%) |
| 35 to 39 Minutes | 0 (0.0%) | 0 (0.0%) |
| 40 to 44 Minutes | 0 (0.0%) | 0 (0.0%) |
| 45 to 59 Minutes | 0 (0.0%) | 0 (0.0%) |
| 60 to 89 Minutes | 0 (0.0%) | 0 (0.0%) |
| 90 or more Minutes | 0 (0.0%) | 0 (0.0%) |
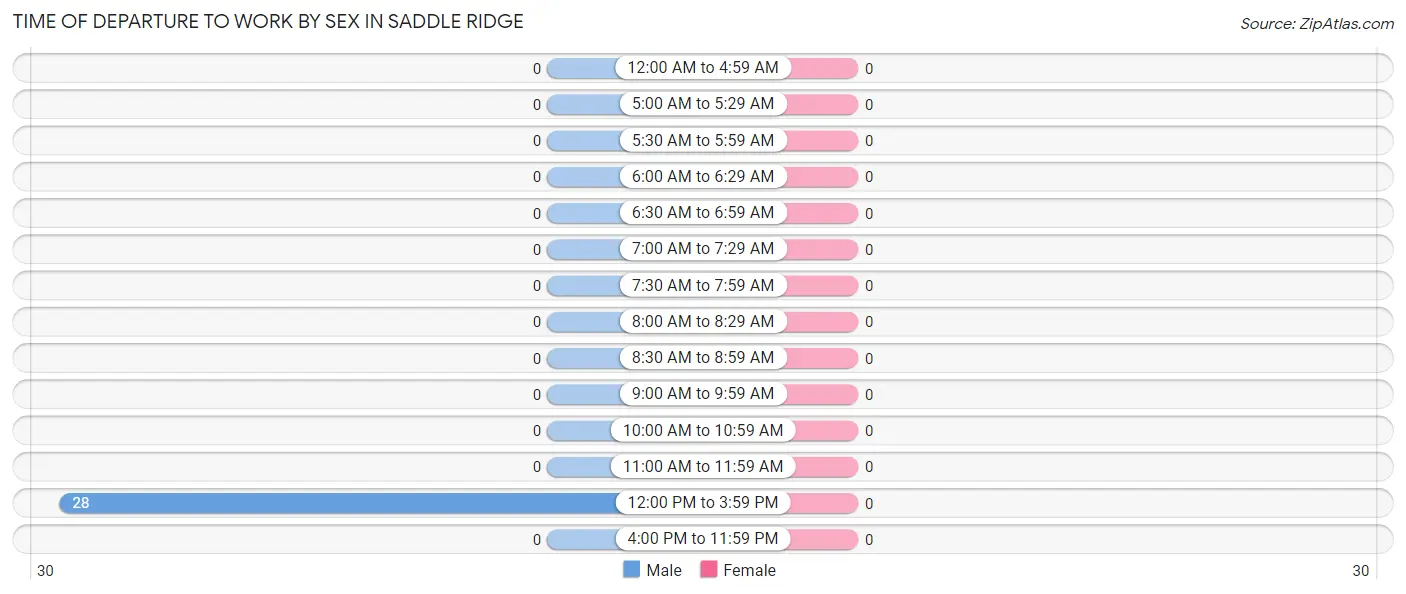
Time of Departure to Work by Sex in Saddle Ridge
| Time of Departure | Male | Female |
| 12:00 AM to 4:59 AM | 0 (0.0%) | 0 (0.0%) |
| 5:00 AM to 5:29 AM | 0 (0.0%) | 0 (0.0%) |
| 5:30 AM to 5:59 AM | 0 (0.0%) | 0 (0.0%) |
| 6:00 AM to 6:29 AM | 0 (0.0%) | 0 (0.0%) |
| 6:30 AM to 6:59 AM | 0 (0.0%) | 0 (0.0%) |
| 7:00 AM to 7:29 AM | 0 (0.0%) | 0 (0.0%) |
| 7:30 AM to 7:59 AM | 0 (0.0%) | 0 (0.0%) |
| 8:00 AM to 8:29 AM | 0 (0.0%) | 0 (0.0%) |
| 8:30 AM to 8:59 AM | 0 (0.0%) | 0 (0.0%) |
| 9:00 AM to 9:59 AM | 0 (0.0%) | 0 (0.0%) |
| 10:00 AM to 10:59 AM | 0 (0.0%) | 0 (0.0%) |
| 11:00 AM to 11:59 AM | 0 (0.0%) | 0 (0.0%) |
| 12:00 PM to 3:59 PM | 28 (100.0%) | 0 (0.0%) |
| 4:00 PM to 11:59 PM | 0 (0.0%) | 0 (0.0%) |
| Total | 28 (100.0%) | 0 (0.0%) |
Housing Occupancy in Saddle Ridge
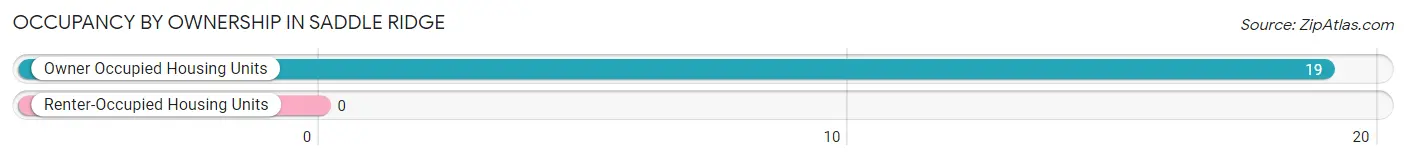
Occupancy by Ownership in Saddle Ridge
Of the total 19 dwellings in Saddle Ridge, owner-occupied units account for 19 (100.0%), while renter-occupied units make up 0 (0.0%).
| Occupancy | # Housing Units | % Housing Units |
| Owner Occupied Housing Units | 19 | 100.0% |
| Renter-Occupied Housing Units | 0 | 0.0% |
| Total Occupied Housing Units | 19 | 100.0% |
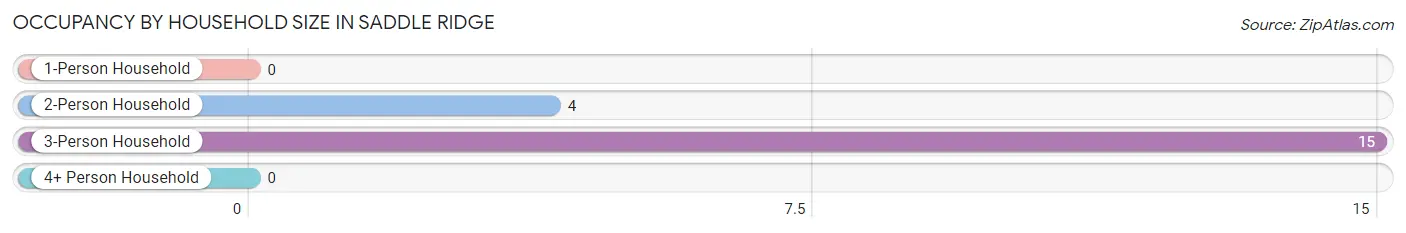
Occupancy by Household Size in Saddle Ridge
| Household Size | # Housing Units | % Housing Units |
| 1-Person Household | 0 | 0.0% |
| 2-Person Household | 4 | 21.0% |
| 3-Person Household | 15 | 78.9% |
| 4+ Person Household | 0 | 0.0% |
| Total Housing Units | 19 | 100.0% |
Occupancy by Ownership by Household Size in Saddle Ridge
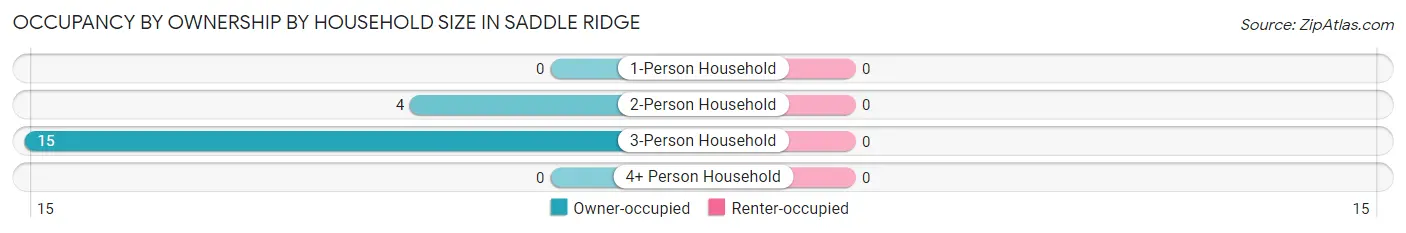
| Household Size | Owner-occupied | Renter-occupied |
| 1-Person Household | 0 (0.0%) | 0 (0.0%) |
| 2-Person Household | 4 (100.0%) | 0 (0.0%) |
| 3-Person Household | 15 (100.0%) | 0 (0.0%) |
| 4+ Person Household | 0 (0.0%) | 0 (0.0%) |
| Total Housing Units | 19 (100.0%) | 0 (0.0%) |
Occupancy by Educational Attainment in Saddle Ridge
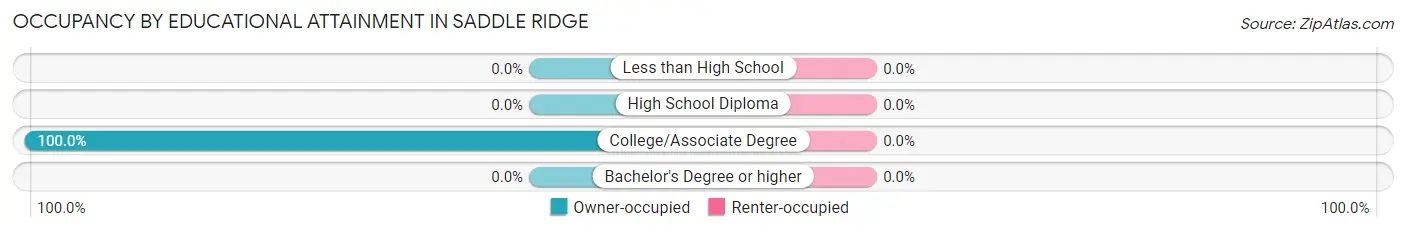
| Household Size | Owner-occupied | Renter-occupied |
| Less than High School | 0 (0.0%) | 0 (0.0%) |
| High School Diploma | 0 (0.0%) | 0 (0.0%) |
| College/Associate Degree | 19 (100.0%) | 0 (0.0%) |
| Bachelor's Degree or higher | 0 (0.0%) | 0 (0.0%) |
Occupancy by Age of Householder in Saddle Ridge
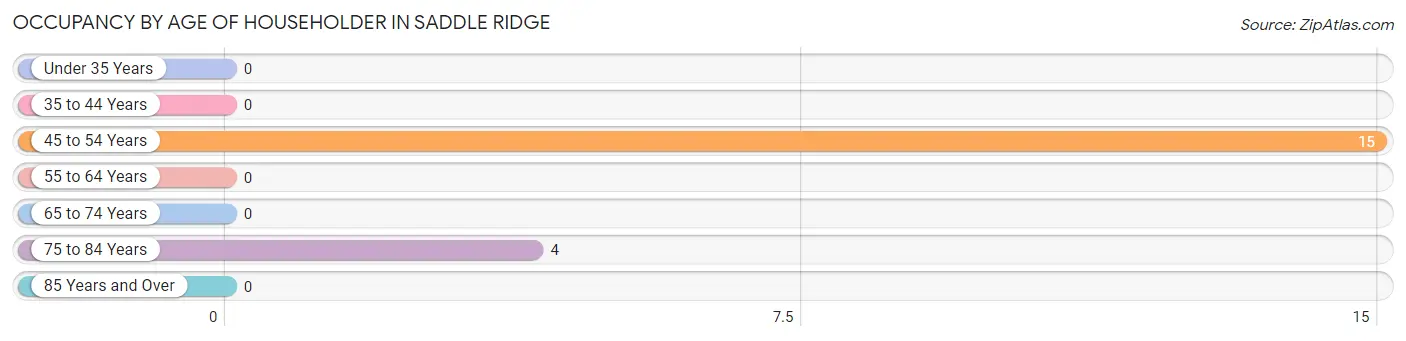
| Age Bracket | # Households | % Households |
| Under 35 Years | 0 | 0.0% |
| 35 to 44 Years | 0 | 0.0% |
| 45 to 54 Years | 15 | 78.9% |
| 55 to 64 Years | 0 | 0.0% |
| 65 to 74 Years | 0 | 0.0% |
| 75 to 84 Years | 4 | 21.0% |
| 85 Years and Over | 0 | 0.0% |
| Total | 19 | 100.0% |
Housing Finances in Saddle Ridge
Median Income by Occupancy in Saddle Ridge
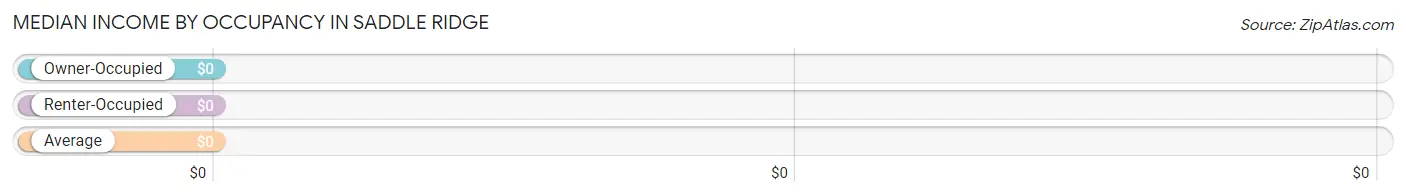
| Occupancy Type | # Households | Median Income |
| Owner-Occupied | 19 (100.0%) | $0 |
| Renter-Occupied | 0 (0.0%) | $0 |
| Average | 19 (100.0%) | $0 |
Occupancy by Householder Income Bracket in Saddle Ridge
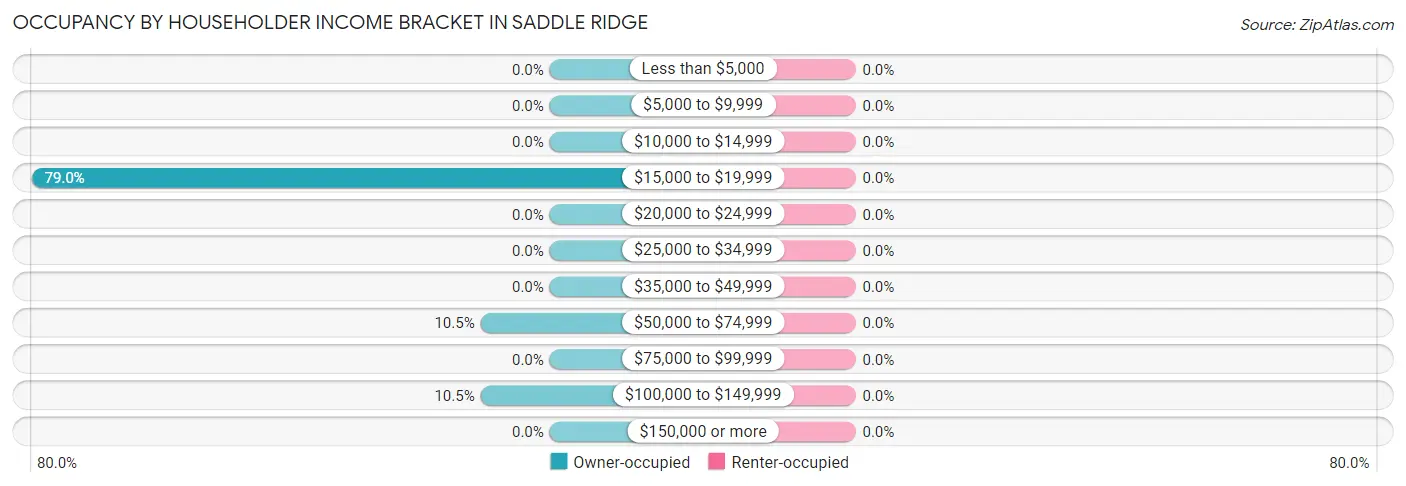
| Income Bracket | Owner-occupied | Renter-occupied |
| Less than $5,000 | 0 (0.0%) | 0 (0.0%) |
| $5,000 to $9,999 | 0 (0.0%) | 0 (0.0%) |
| $10,000 to $14,999 | 0 (0.0%) | 0 (0.0%) |
| $15,000 to $19,999 | 15 (78.9%) | 0 (0.0%) |
| $20,000 to $24,999 | 0 (0.0%) | 0 (0.0%) |
| $25,000 to $34,999 | 0 (0.0%) | 0 (0.0%) |
| $35,000 to $49,999 | 0 (0.0%) | 0 (0.0%) |
| $50,000 to $74,999 | 2 (10.5%) | 0 (0.0%) |
| $75,000 to $99,999 | 0 (0.0%) | 0 (0.0%) |
| $100,000 to $149,999 | 2 (10.5%) | 0 (0.0%) |
| $150,000 or more | 0 (0.0%) | 0 (0.0%) |
| Total | 19 (100.0%) | 0 (0.0%) |
Monthly Housing Cost Tiers in Saddle Ridge
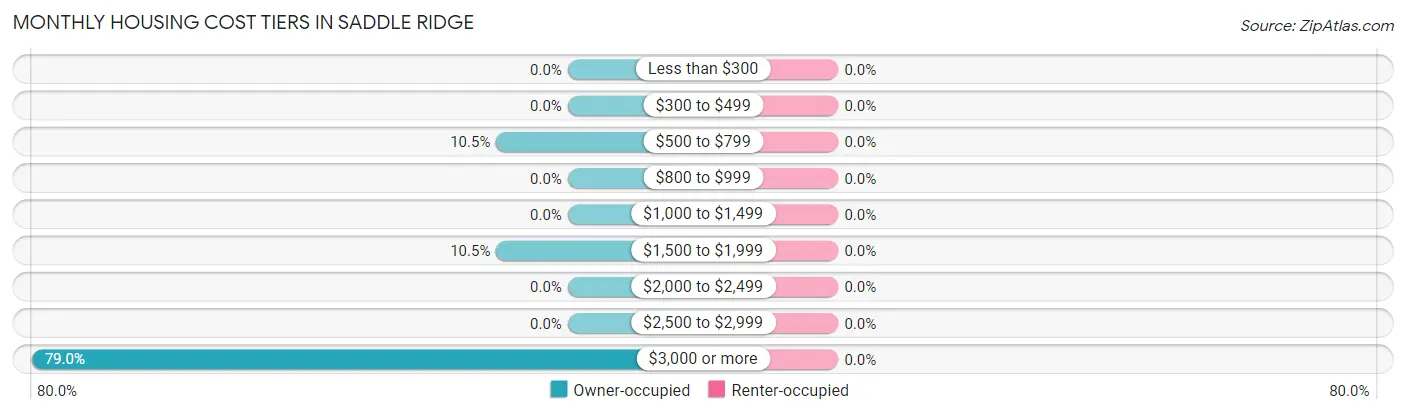
| Monthly Cost | Owner-occupied | Renter-occupied |
| Less than $300 | 0 (0.0%) | 0 (0.0%) |
| $300 to $499 | 0 (0.0%) | 0 (0.0%) |
| $500 to $799 | 2 (10.5%) | 0 (0.0%) |
| $800 to $999 | 0 (0.0%) | 0 (0.0%) |
| $1,000 to $1,499 | 0 (0.0%) | 0 (0.0%) |
| $1,500 to $1,999 | 2 (10.5%) | 0 (0.0%) |
| $2,000 to $2,499 | 0 (0.0%) | 0 (0.0%) |
| $2,500 to $2,999 | 0 (0.0%) | 0 (0.0%) |
| $3,000 or more | 15 (78.9%) | 0 (0.0%) |
| Total | 19 (100.0%) | 0 (0.0%) |
Physical Housing Characteristics in Saddle Ridge
Housing Structures in Saddle Ridge
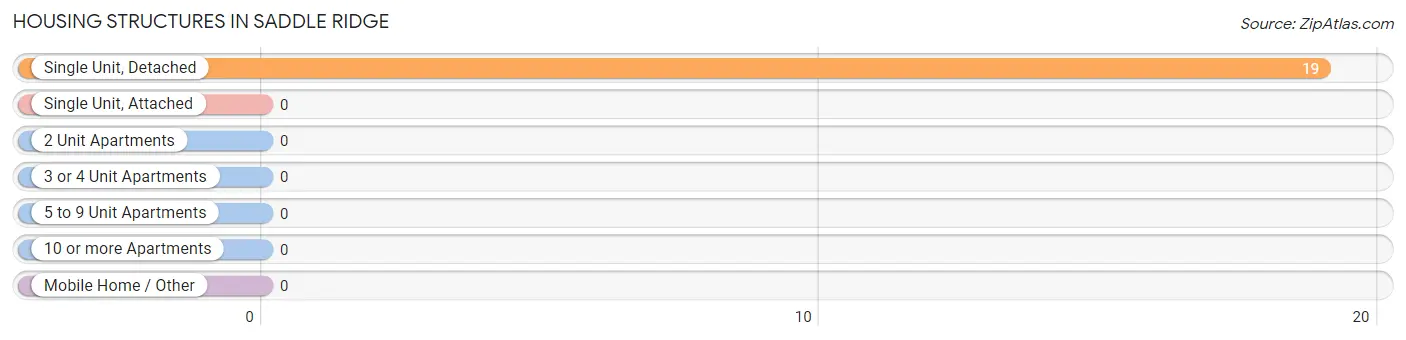
| Structure Type | # Housing Units | % Housing Units |
| Single Unit, Detached | 19 | 100.0% |
| Single Unit, Attached | 0 | 0.0% |
| 2 Unit Apartments | 0 | 0.0% |
| 3 or 4 Unit Apartments | 0 | 0.0% |
| 5 to 9 Unit Apartments | 0 | 0.0% |
| 10 or more Apartments | 0 | 0.0% |
| Mobile Home / Other | 0 | 0.0% |
| Total | 19 | 100.0% |
Housing Structures by Occupancy in Saddle Ridge
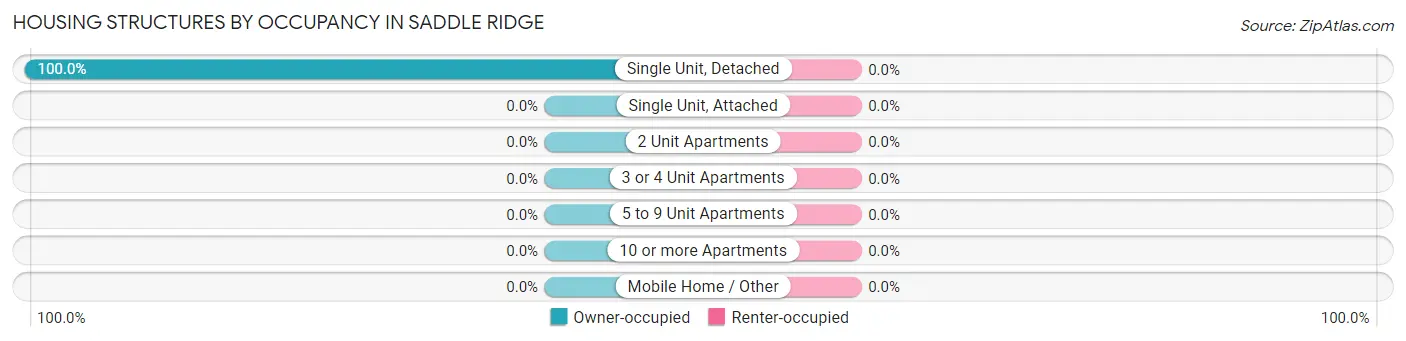
| Structure Type | Owner-occupied | Renter-occupied |
| Single Unit, Detached | 19 (100.0%) | 0 (0.0%) |
| Single Unit, Attached | 0 (0.0%) | 0 (0.0%) |
| 2 Unit Apartments | 0 (0.0%) | 0 (0.0%) |
| 3 or 4 Unit Apartments | 0 (0.0%) | 0 (0.0%) |
| 5 to 9 Unit Apartments | 0 (0.0%) | 0 (0.0%) |
| 10 or more Apartments | 0 (0.0%) | 0 (0.0%) |
| Mobile Home / Other | 0 (0.0%) | 0 (0.0%) |
| Total | 19 (100.0%) | 0 (0.0%) |
Housing Structures by Number of Rooms in Saddle Ridge
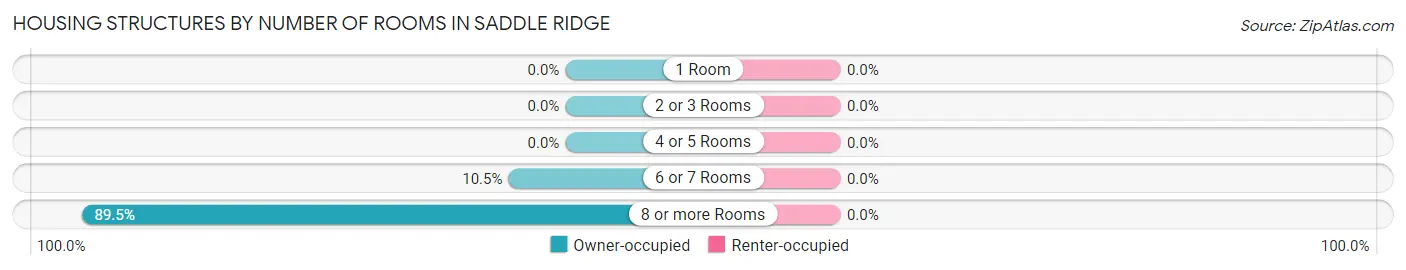
| Number of Rooms | Owner-occupied | Renter-occupied |
| 1 Room | 0 (0.0%) | 0 (0.0%) |
| 2 or 3 Rooms | 0 (0.0%) | 0 (0.0%) |
| 4 or 5 Rooms | 0 (0.0%) | 0 (0.0%) |
| 6 or 7 Rooms | 2 (10.5%) | 0 (0.0%) |
| 8 or more Rooms | 17 (89.5%) | 0 (0.0%) |
| Total | 19 (100.0%) | 0 (0.0%) |
Housing Structure by Heating Type in Saddle Ridge
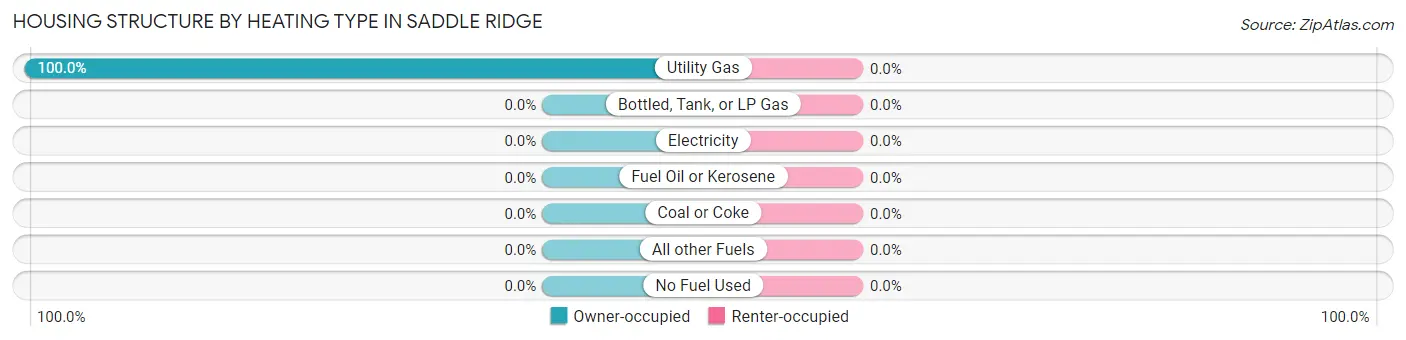
| Heating Type | Owner-occupied | Renter-occupied |
| Utility Gas | 19 (100.0%) | 0 (0.0%) |
| Bottled, Tank, or LP Gas | 0 (0.0%) | 0 (0.0%) |
| Electricity | 0 (0.0%) | 0 (0.0%) |
| Fuel Oil or Kerosene | 0 (0.0%) | 0 (0.0%) |
| Coal or Coke | 0 (0.0%) | 0 (0.0%) |
| All other Fuels | 0 (0.0%) | 0 (0.0%) |
| No Fuel Used | 0 (0.0%) | 0 (0.0%) |
| Total | 19 (100.0%) | 0 (0.0%) |
Household Vehicle Usage in Saddle Ridge
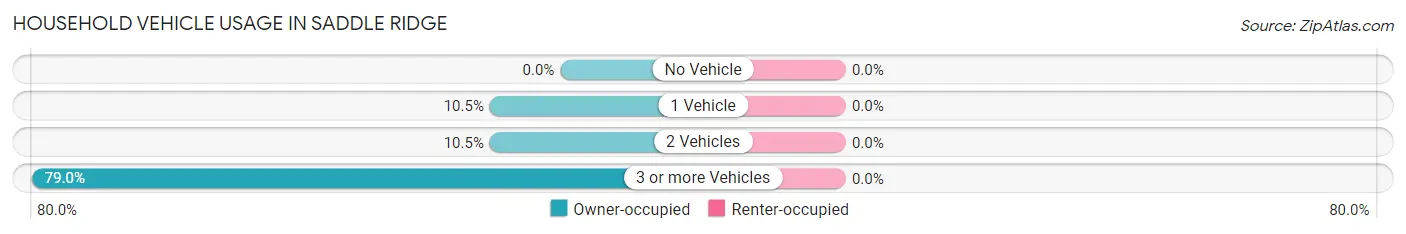
| Vehicles per Household | Owner-occupied | Renter-occupied |
| No Vehicle | 0 (0.0%) | 0 (0.0%) |
| 1 Vehicle | 2 (10.5%) | 0 (0.0%) |
| 2 Vehicles | 2 (10.5%) | 0 (0.0%) |
| 3 or more Vehicles | 15 (78.9%) | 0 (0.0%) |
| Total | 19 (100.0%) | 0 (0.0%) |
Real Estate & Mortgages in Saddle Ridge
Real Estate and Mortgage Overview in Saddle Ridge
| Characteristic | Without Mortgage | With Mortgage |
| Housing Units | 2 | 17 |
| Median Property Value | - | - |
| Median Household Income | - | - |
| Monthly Housing Costs | - | - |
| Real Estate Taxes | - | - |
Property Value by Mortgage Status in Saddle Ridge
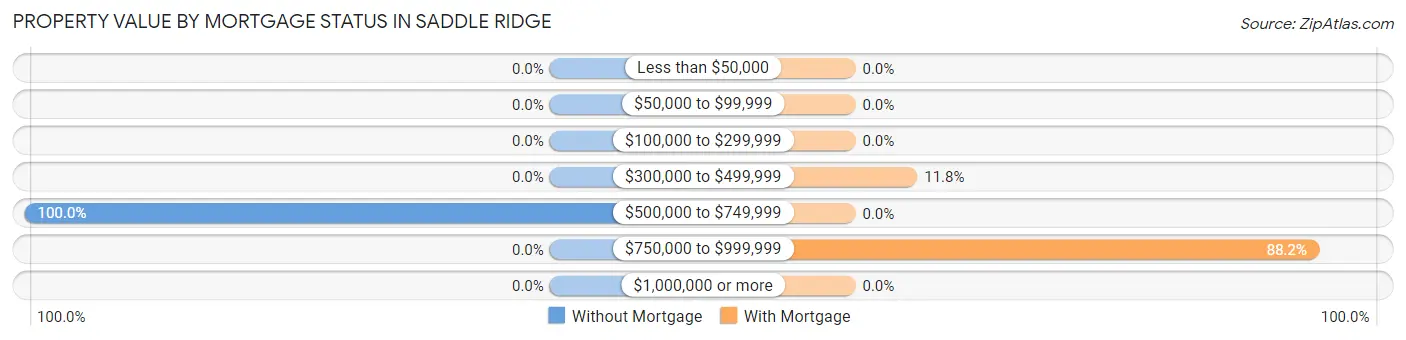
| Property Value | Without Mortgage | With Mortgage |
| Less than $50,000 | 0 (0.0%) | 0 (0.0%) |
| $50,000 to $99,999 | 0 (0.0%) | 0 (0.0%) |
| $100,000 to $299,999 | 0 (0.0%) | 0 (0.0%) |
| $300,000 to $499,999 | 0 (0.0%) | 2 (11.8%) |
| $500,000 to $749,999 | 2 (100.0%) | 0 (0.0%) |
| $750,000 to $999,999 | 0 (0.0%) | 15 (88.2%) |
| $1,000,000 or more | 0 (0.0%) | 0 (0.0%) |
| Total | 2 (100.0%) | 17 (100.0%) |
Household Income by Mortgage Status in Saddle Ridge
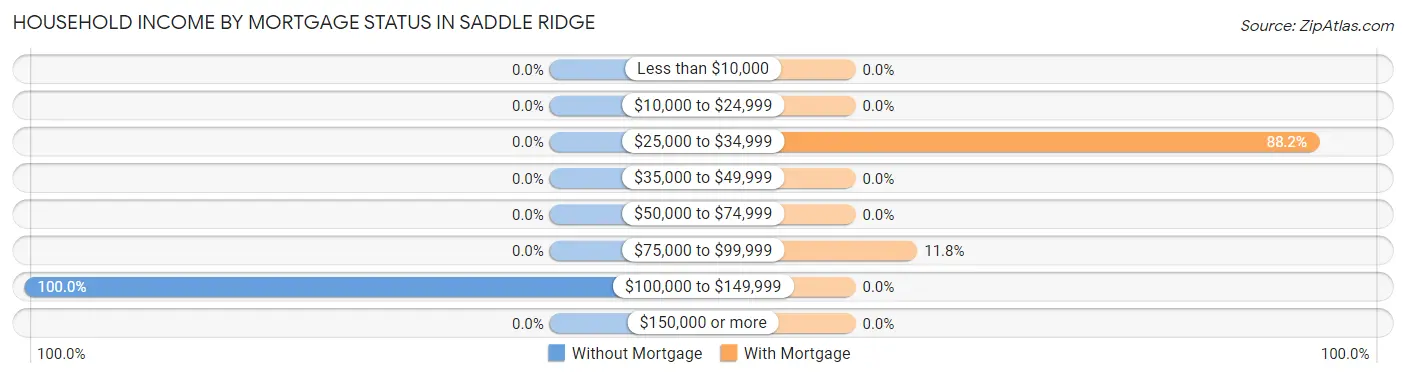
| Household Income | Without Mortgage | With Mortgage |
| Less than $10,000 | 0 (0.0%) | 0 (0.0%) |
| $10,000 to $24,999 | 0 (0.0%) | 0 (0.0%) |
| $25,000 to $34,999 | 0 (0.0%) | 15 (88.2%) |
| $35,000 to $49,999 | 0 (0.0%) | 0 (0.0%) |
| $50,000 to $74,999 | 0 (0.0%) | 0 (0.0%) |
| $75,000 to $99,999 | 0 (0.0%) | 2 (11.8%) |
| $100,000 to $149,999 | 2 (100.0%) | 0 (0.0%) |
| $150,000 or more | 0 (0.0%) | 0 (0.0%) |
| Total | 2 (100.0%) | 17 (100.0%) |
Property Value to Household Income Ratio in Saddle Ridge
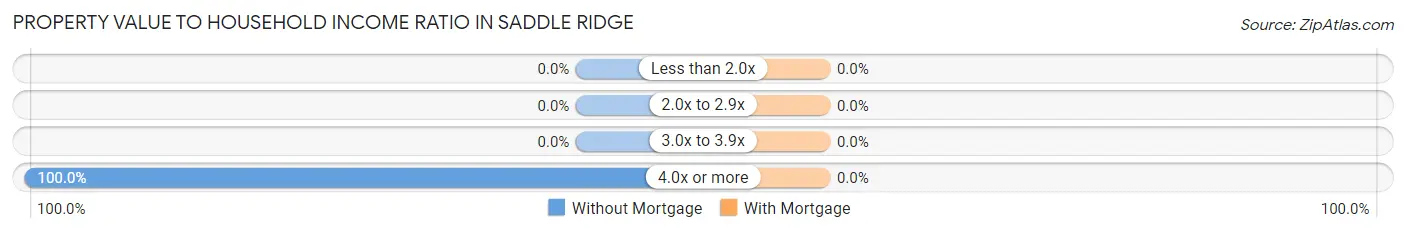
| Value-to-Income Ratio | Without Mortgage | With Mortgage |
| Less than 2.0x | 0 (0.0%) | 0 (0.0%) |
| 2.0x to 2.9x | 0 (0.0%) | 0 (0.0%) |
| 3.0x to 3.9x | 0 (0.0%) | 0 (0.0%) |
| 4.0x or more | 2 (100.0%) | 0 (0.0%) |
| Total | 2 (100.0%) | 17 (100.0%) |
Real Estate Taxes by Mortgage Status in Saddle Ridge

| Property Taxes | Without Mortgage | With Mortgage |
| Less than $800 | 0 (0.0%) | 0 (0.0%) |
| $800 to $1,499 | 0 (0.0%) | 0 (0.0%) |
| $800 to $1,499 | 2 (100.0%) | 0 (0.0%) |
| Total | 2 (100.0%) | 17 (100.0%) |
Health & Disability in Saddle Ridge
Health Insurance Coverage by Age in Saddle Ridge
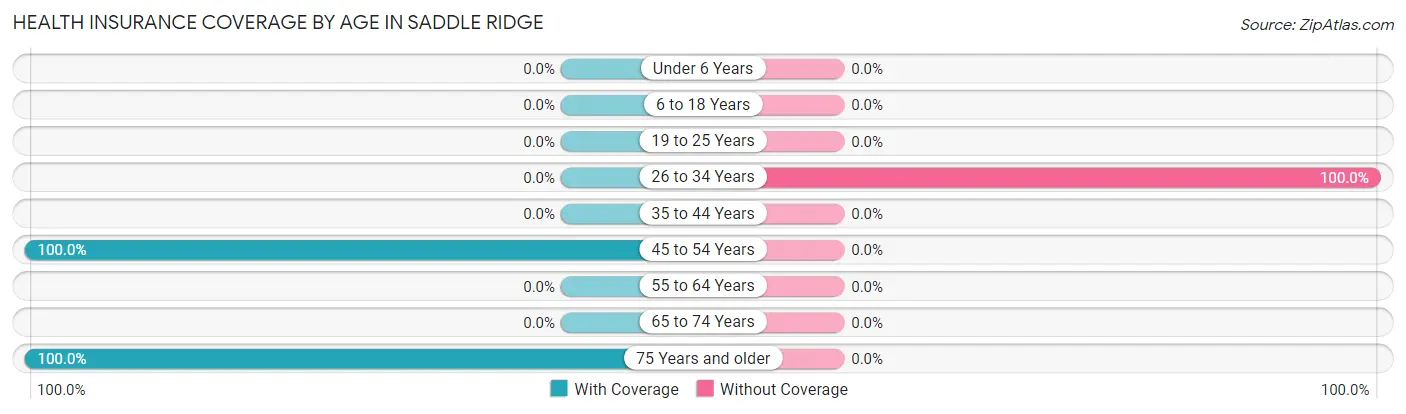
| Age Bracket | With Coverage | Without Coverage |
| Under 6 Years | 0 (0.0%) | 0 (0.0%) |
| 6 to 18 Years | 0 (0.0%) | 0 (0.0%) |
| 19 to 25 Years | 0 (0.0%) | 0 (0.0%) |
| 26 to 34 Years | 0 (0.0%) | 13 (100.0%) |
| 35 to 44 Years | 0 (0.0%) | 0 (0.0%) |
| 45 to 54 Years | 32 (100.0%) | 0 (0.0%) |
| 55 to 64 Years | 0 (0.0%) | 0 (0.0%) |
| 65 to 74 Years | 0 (0.0%) | 0 (0.0%) |
| 75 Years and older | 8 (100.0%) | 0 (0.0%) |
| Total | 40 (75.5%) | 13 (24.5%) |
Health Insurance Coverage by Citizenship Status in Saddle Ridge
| Citizenship Status | With Coverage | Without Coverage |
| Native Born | 0 (0.0%) | 0 (0.0%) |
| Foreign Born, Citizen | 0 (0.0%) | 0 (0.0%) |
| Foreign Born, not a Citizen | 0 (0.0%) | 0 (0.0%) |
Health Insurance Coverage by Household Income in Saddle Ridge
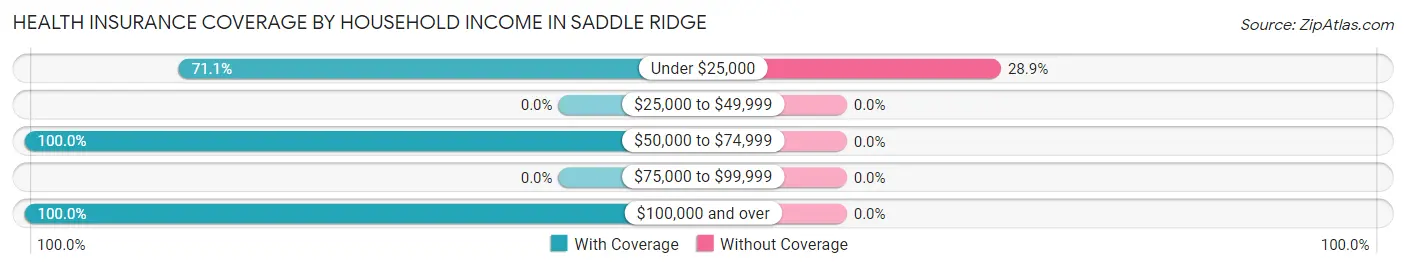
| Household Income | With Coverage | Without Coverage |
| Under $25,000 | 32 (71.1%) | 13 (28.9%) |
| $25,000 to $49,999 | 0 (0.0%) | 0 (0.0%) |
| $50,000 to $74,999 | 4 (100.0%) | 0 (0.0%) |
| $75,000 to $99,999 | 0 (0.0%) | 0 (0.0%) |
| $100,000 and over | 4 (100.0%) | 0 (0.0%) |
Public vs Private Health Insurance Coverage by Age in Saddle Ridge
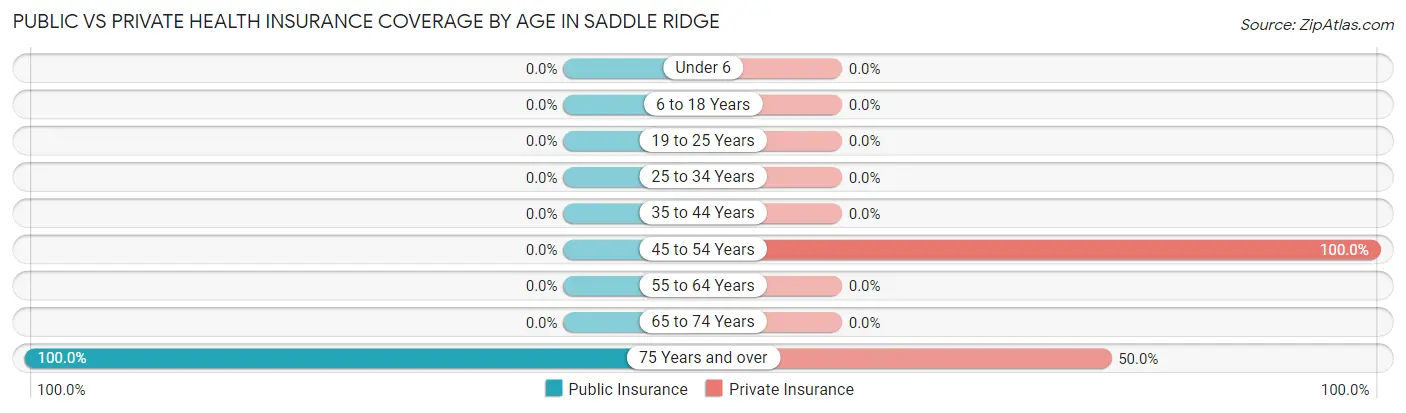
| Age Bracket | Public Insurance | Private Insurance |
| Under 6 | 0 (0.0%) | 0 (0.0%) |
| 6 to 18 Years | 0 (0.0%) | 0 (0.0%) |
| 19 to 25 Years | 0 (0.0%) | 0 (0.0%) |
| 25 to 34 Years | 0 (0.0%) | 0 (0.0%) |
| 35 to 44 Years | 0 (0.0%) | 0 (0.0%) |
| 45 to 54 Years | 0 (0.0%) | 32 (100.0%) |
| 55 to 64 Years | 0 (0.0%) | 0 (0.0%) |
| 65 to 74 Years | 0 (0.0%) | 0 (0.0%) |
| 75 Years and over | 8 (100.0%) | 4 (50.0%) |
| Total | 8 (15.1%) | 36 (67.9%) |
Disability Status by Sex by Age in Saddle Ridge
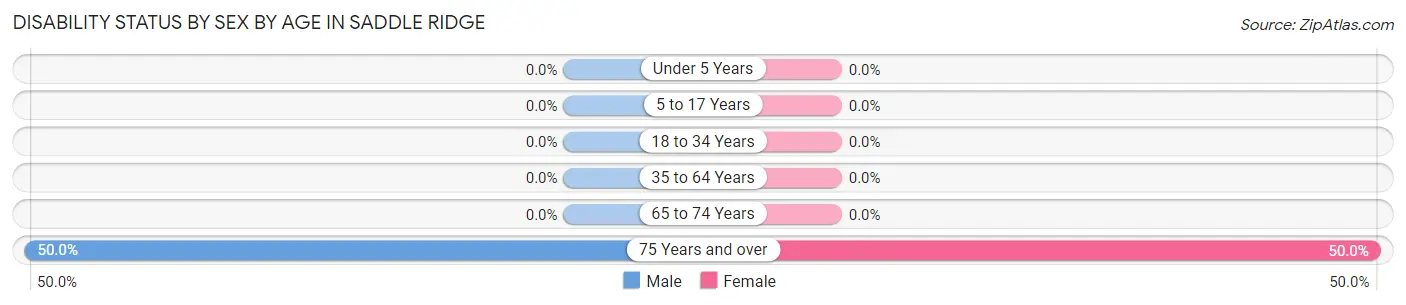
| Age Bracket | Male | Female |
| Under 5 Years | 0 (0.0%) | 0 (0.0%) |
| 5 to 17 Years | 0 (0.0%) | 0 (0.0%) |
| 18 to 34 Years | 0 (0.0%) | 0 (0.0%) |
| 35 to 64 Years | 0 (0.0%) | 0 (0.0%) |
| 65 to 74 Years | 0 (0.0%) | 0 (0.0%) |
| 75 Years and over | 2 (50.0%) | 2 (50.0%) |
Disability Class by Sex by Age in Saddle Ridge
Disability Class: Hearing Difficulty
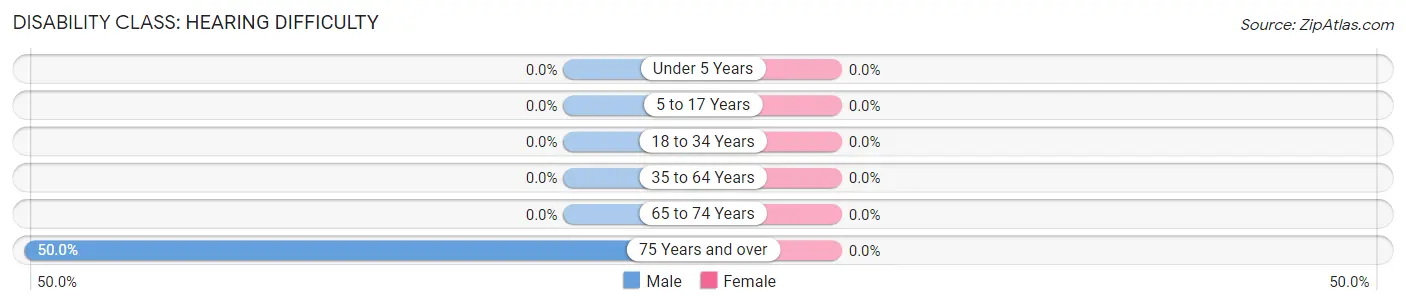
| Age Bracket | Male | Female |
| Under 5 Years | 0 (0.0%) | 0 (0.0%) |
| 5 to 17 Years | 0 (0.0%) | 0 (0.0%) |
| 18 to 34 Years | 0 (0.0%) | 0 (0.0%) |
| 35 to 64 Years | 0 (0.0%) | 0 (0.0%) |
| 65 to 74 Years | 0 (0.0%) | 0 (0.0%) |
| 75 Years and over | 2 (50.0%) | 0 (0.0%) |
Disability Class: Vision Difficulty
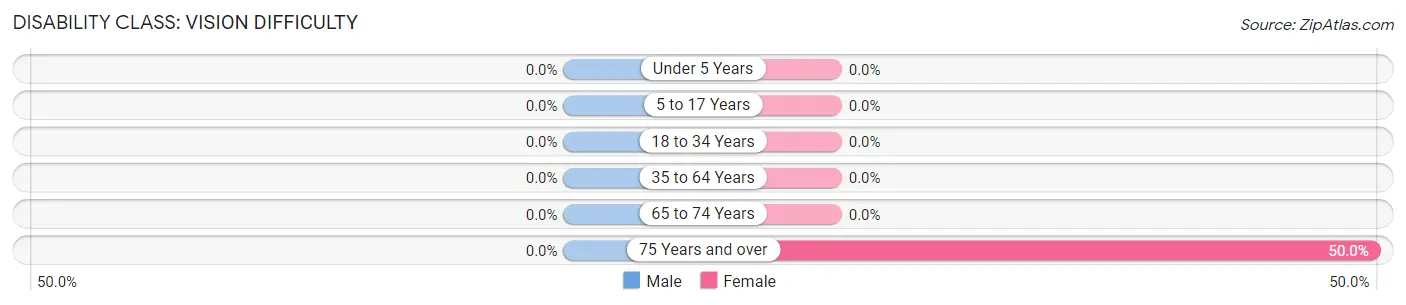
| Age Bracket | Male | Female |
| Under 5 Years | 0 (0.0%) | 0 (0.0%) |
| 5 to 17 Years | 0 (0.0%) | 0 (0.0%) |
| 18 to 34 Years | 0 (0.0%) | 0 (0.0%) |
| 35 to 64 Years | 0 (0.0%) | 0 (0.0%) |
| 65 to 74 Years | 0 (0.0%) | 0 (0.0%) |
| 75 Years and over | 0 (0.0%) | 2 (50.0%) |
Disability Class: Cognitive Difficulty
| Age Bracket | Male | Female |
| 5 to 17 Years | 0 (0.0%) | 0 (0.0%) |
| 18 to 34 Years | 0 (0.0%) | 0 (0.0%) |
| 35 to 64 Years | 0 (0.0%) | 0 (0.0%) |
| 65 to 74 Years | 0 (0.0%) | 0 (0.0%) |
| 75 Years and over | 0 (0.0%) | 0 (0.0%) |
Disability Class: Ambulatory Difficulty
| Age Bracket | Male | Female |
| 5 to 17 Years | 0 (0.0%) | 0 (0.0%) |
| 18 to 34 Years | 0 (0.0%) | 0 (0.0%) |
| 35 to 64 Years | 0 (0.0%) | 0 (0.0%) |
| 65 to 74 Years | 0 (0.0%) | 0 (0.0%) |
| 75 Years and over | 0 (0.0%) | 0 (0.0%) |
Disability Class: Self-Care Difficulty

| Age Bracket | Male | Female |
| 5 to 17 Years | 0 (0.0%) | 0 (0.0%) |
| 18 to 34 Years | 0 (0.0%) | 0 (0.0%) |
| 35 to 64 Years | 0 (0.0%) | 0 (0.0%) |
| 65 to 74 Years | 0 (0.0%) | 0 (0.0%) |
| 75 Years and over | 0 (0.0%) | 0 (0.0%) |
Technology Access in Saddle Ridge
Computing Device Access in Saddle Ridge
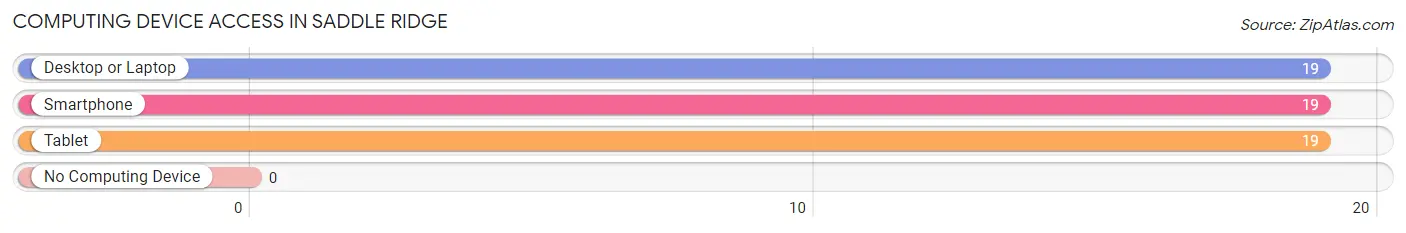
| Device Type | # Households | % Households |
| Desktop or Laptop | 19 | 100.0% |
| Smartphone | 19 | 100.0% |
| Tablet | 19 | 100.0% |
| No Computing Device | 0 | 0.0% |
| Total | 19 | 100.0% |
Internet Access in Saddle Ridge
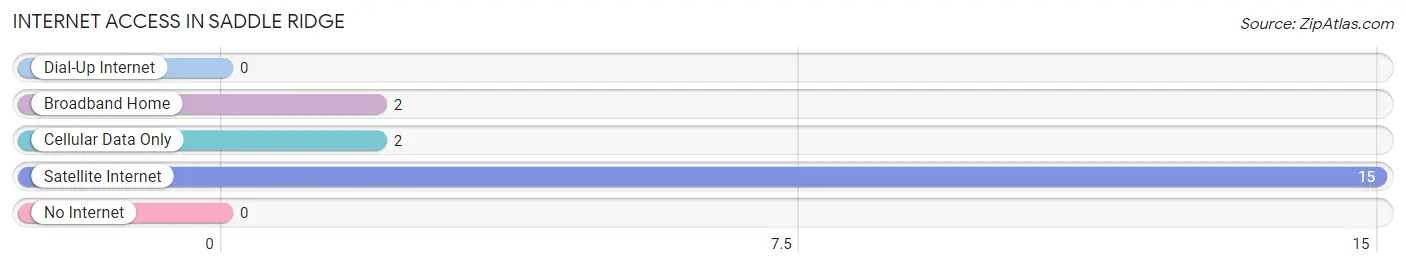
| Internet Type | # Households | % Households |
| Dial-Up Internet | 0 | 0.0% |
| Broadband Home | 2 | 10.5% |
| Cellular Data Only | 2 | 10.5% |
| Satellite Internet | 15 | 78.9% |
| No Internet | 0 | 0.0% |
| Total | 19 | 100.0% |
Saddle Ridge Summary
Saddle Ridge is a small unincorporated community located in Weld County, Colorado, United States. It is situated in the foothills of the Rocky Mountains, approximately 25 miles northeast of Denver. The community is located in the northern part of the county, near the border with Larimer County.
History
Saddle Ridge was first settled in the late 1800s by homesteaders who were attracted to the area by its abundant natural resources. The area was originally known as “Saddleback”, but the name was changed to “Saddle Ridge” in the early 1900s. The community was officially incorporated in 1909, and the first post office was established in 1910.
The town was originally a farming and ranching community, but in the 1950s, the area began to experience rapid growth due to the influx of people moving to the area from other parts of the country. This growth was largely due to the construction of the nearby Rocky Mountain Arsenal, which provided employment opportunities for many of the new residents.
Geography
Saddle Ridge is located in the foothills of the Rocky Mountains, approximately 25 miles northeast of Denver. The community is situated in the northern part of Weld County, near the border with Larimer County. The area is characterized by rolling hills, open meadows, and dense forests. The elevation of the town is 5,400 feet above sea level.
Economy
The economy of Saddle Ridge is largely based on agriculture and ranching. The area is home to several large farms and ranches, which produce a variety of crops and livestock. The town is also home to several small businesses, including a grocery store, a hardware store, and a few restaurants.
Demographics
As of the 2010 census, the population of Saddle Ridge was 1,845. The racial makeup of the town was 94.3% White, 0.7% African American, 0.3% Native American, 0.3% Asian, 0.1% Pacific Islander, 2.2% from other races, and 2.3% from two or more races. Hispanic or Latino of any race were 5.2% of the population.
The median household income in Saddle Ridge was $50,938, and the median family income was $54,844. The per capita income for the town was $21,945. About 8.3% of families and 10.2% of the population were below the poverty line, including 14.2% of those under age 18 and 5.2% of those age 65 or over.
Conclusion
Saddle Ridge is a small unincorporated community located in Weld County, Colorado, United States. It is situated in the foothills of the Rocky Mountains, approximately 25 miles northeast of Denver. The community is characterized by rolling hills, open meadows, and dense forests. The economy of Saddle Ridge is largely based on agriculture and ranching, and the town is home to several small businesses. As of the 2010 census, the population of Saddle Ridge was 1,845. The median household income in Saddle Ridge was $50,938, and the median family income was $54,844.
Common Questions
What is the Total Population of Saddle Ridge?
Total Population of Saddle Ridge is 53.
What is the Total Male Population of Saddle Ridge?
Total Male Population of Saddle Ridge is 32.
What is the Total Female Population of Saddle Ridge?
Total Female Population of Saddle Ridge is 21.
What is the Ratio of Males per 100 Females in Saddle Ridge?
There are 152.38 Males per 100 Females in Saddle Ridge.
What is the Ratio of Females per 100 Males in Saddle Ridge?
There are 65.62 Females per 100 Males in Saddle Ridge.
What is the Median Population Age in Saddle Ridge?
Median Population Age in Saddle Ridge is 52.4 Years.
What is the Average Family Size in Saddle Ridge
Average Family Size in Saddle Ridge is 2.8 People.
What is the Average Household Size in Saddle Ridge
Average Household Size in Saddle Ridge is 2.8 People.
What is Per Capita Income in Saddle Ridge?
Per Capita income in Saddle Ridge is $11,421.
What is Inequality or Gini Index in Saddle Ridge?
Inequality or Gini Index in Saddle Ridge is 0.39.
How Large is the Labor Force in Saddle Ridge?
There are 30 People in the Labor Forcein in Saddle Ridge.
What is the Percentage of People in the Labor Force in Saddle Ridge?
56.6% of People are in the Labor Force in Saddle Ridge.