Edgewater, CO
Edgewater Map
Edgewater Overview
5,002
TOTAL POPULATION
2,612
MALE POPULATION
2,390
FEMALE POPULATION
109.29
MALES / 100 FEMALES
91.50
FEMALES / 100 MALES
33.1
MEDIAN AGE
3.0
AVG FAMILY SIZE
2.3
AVG HOUSEHOLD SIZE
$43,238
PER CAPITA INCOME
$74,426
AVG FAMILY INCOME
$71,964
AVG HOUSEHOLD INCOME
12.3%
WAGE / INCOME GAP [ % ]
87.7¢/ $1
WAGE / INCOME GAP [ $ ]
0.41
INEQUALITY / GINI INDEX
3,714
LABOR FORCE [ PEOPLE ]
86.1%
PERCENT IN LABOR FORCE
4.2%
UNEMPLOYMENT RATE
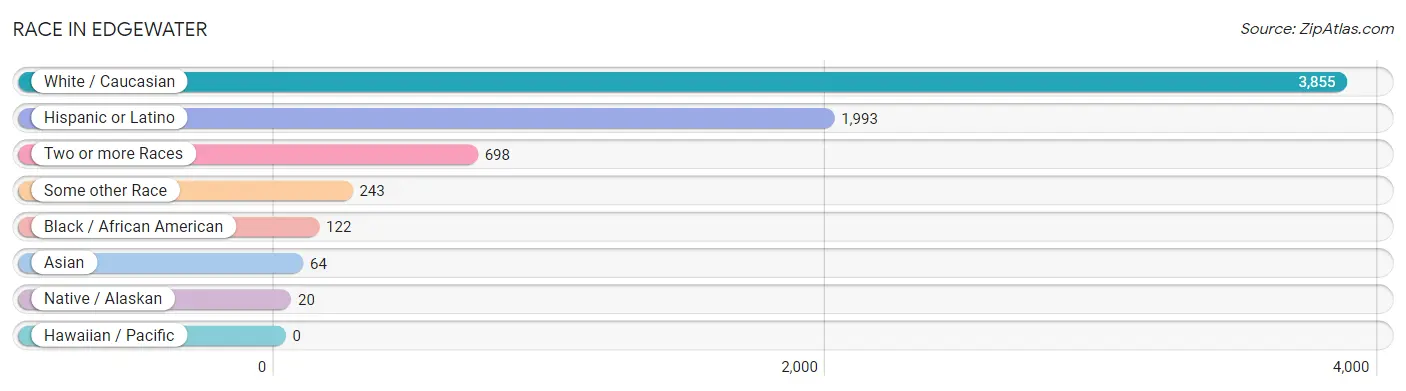
Race in Edgewater
The most populous races in Edgewater are White / Caucasian (3,855 | 77.1%), Hispanic or Latino (1,993 | 39.8%), and Two or more Races (698 | 14.0%).
| Race | # Population | % Population |
| Asian | 64 | 1.3% |
| Black / African American | 122 | 2.4% |
| Hawaiian / Pacific | 0 | 0.0% |
| Hispanic or Latino | 1,993 | 39.8% |
| Native / Alaskan | 20 | 0.4% |
| White / Caucasian | 3,855 | 77.1% |
| Two or more Races | 698 | 14.0% |
| Some other Race | 243 | 4.9% |
| Total | 5,002 | 100.0% |
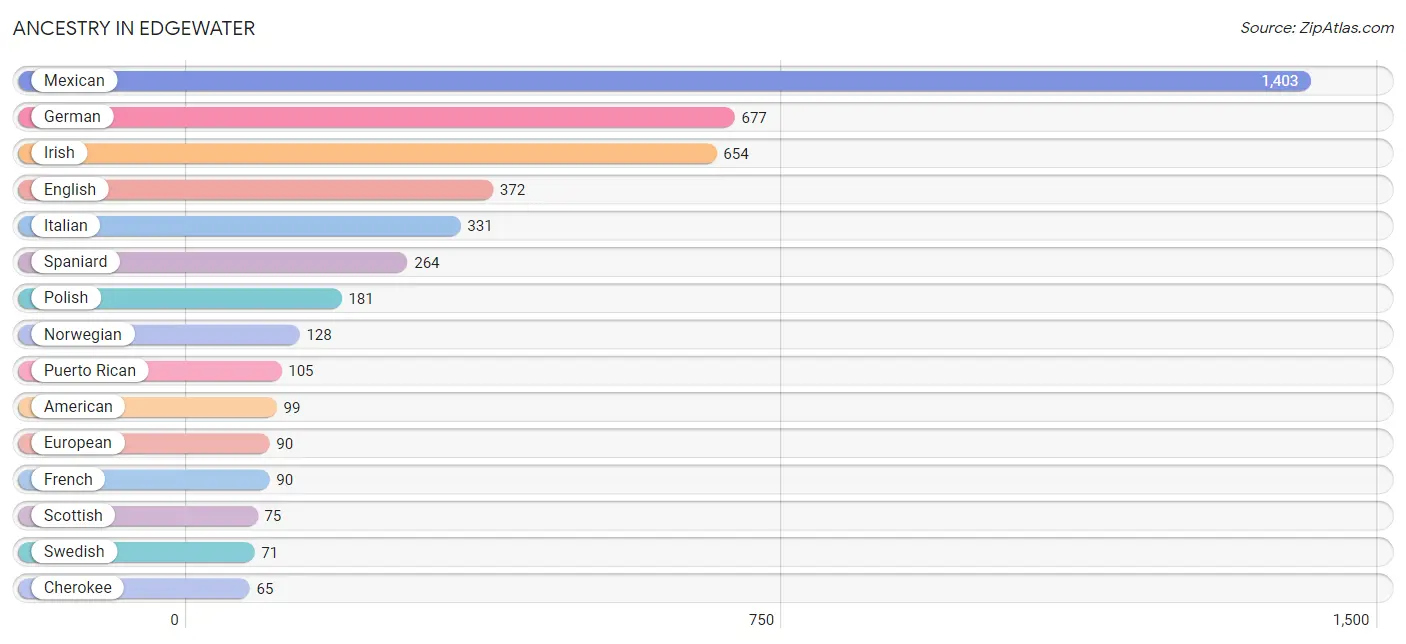
Ancestry in Edgewater
The most populous ancestries reported in Edgewater are Mexican (1,403 | 28.1%), German (677 | 13.5%), Irish (654 | 13.1%), English (372 | 7.4%), and Italian (331 | 6.6%), together accounting for 68.7% of all Edgewater residents.
| Ancestry | # Population | % Population |
| American | 99 | 2.0% |
| Arab | 23 | 0.5% |
| Austrian | 27 | 0.5% |
| British | 18 | 0.4% |
| Burmese | 16 | 0.3% |
| Canadian | 14 | 0.3% |
| Cherokee | 65 | 1.3% |
| Colombian | 24 | 0.5% |
| Croatian | 10 | 0.2% |
| Cuban | 33 | 0.7% |
| Czech | 25 | 0.5% |
| Danish | 25 | 0.5% |
| Dutch | 40 | 0.8% |
| Eastern European | 8 | 0.2% |
| English | 372 | 7.4% |
| European | 90 | 1.8% |
| Finnish | 20 | 0.4% |
| French | 90 | 1.8% |
| French Canadian | 18 | 0.4% |
| German | 677 | 13.5% |
| Greek | 9 | 0.2% |
| Hungarian | 20 | 0.4% |
| Irish | 654 | 13.1% |
| Italian | 331 | 6.6% |
| Lebanese | 23 | 0.5% |
| Lithuanian | 6 | 0.1% |
| Mexican | 1,403 | 28.1% |
| Mexican American Indian | 7 | 0.1% |
| Norwegian | 128 | 2.6% |
| Osage | 18 | 0.4% |
| Pakistani | 19 | 0.4% |
| Pennsylvania German | 7 | 0.1% |
| Polish | 181 | 3.6% |
| Puerto Rican | 105 | 2.1% |
| Russian | 11 | 0.2% |
| Scandinavian | 18 | 0.4% |
| Scotch-Irish | 34 | 0.7% |
| Scottish | 75 | 1.5% |
| Slavic | 13 | 0.3% |
| Slovak | 35 | 0.7% |
| South American | 24 | 0.5% |
| Spaniard | 264 | 5.3% |
| Spanish | 32 | 0.6% |
| Sri Lankan | 34 | 0.7% |
| Swedish | 71 | 1.4% |
| Swiss | 14 | 0.3% |
| Thai | 34 | 0.7% |
| Ukrainian | 32 | 0.6% |
| Welsh | 41 | 0.8% | View All 49 Rows |
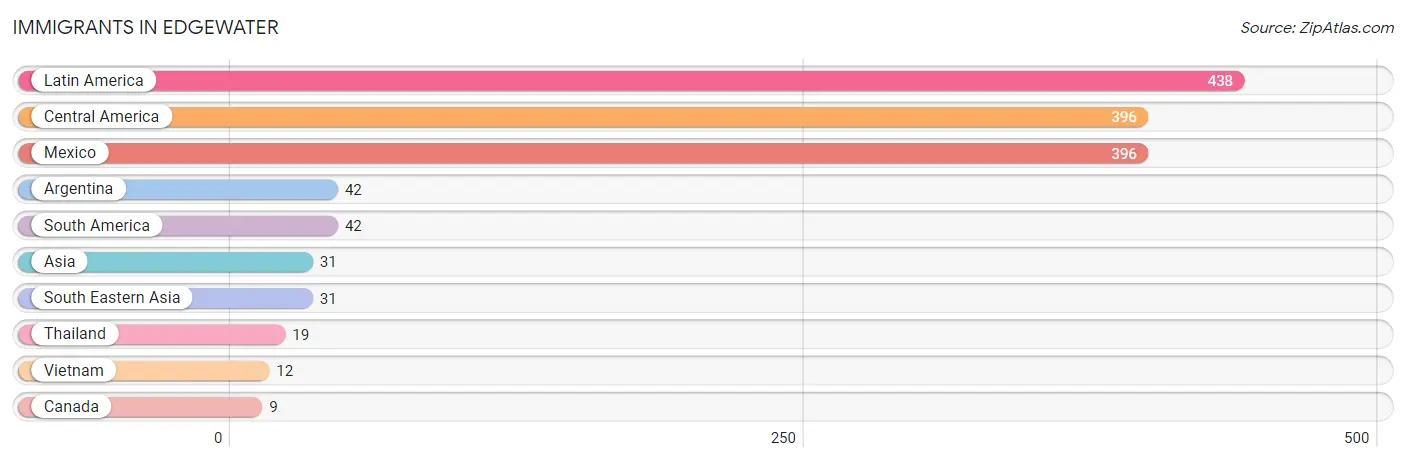
Immigrants in Edgewater
The most numerous immigrant groups reported in Edgewater came from Latin America (438 | 8.8%), Central America (396 | 7.9%), Mexico (396 | 7.9%), Argentina (42 | 0.8%), and South America (42 | 0.8%), together accounting for 26.3% of all Edgewater residents.
| Immigration Origin | # Population | % Population |
| Argentina | 42 | 0.8% |
| Asia | 31 | 0.6% |
| Canada | 9 | 0.2% |
| Central America | 396 | 7.9% |
| Latin America | 438 | 8.8% |
| Mexico | 396 | 7.9% |
| South America | 42 | 0.8% |
| South Eastern Asia | 31 | 0.6% |
| Thailand | 19 | 0.4% |
| Vietnam | 12 | 0.2% | View All 10 Rows |
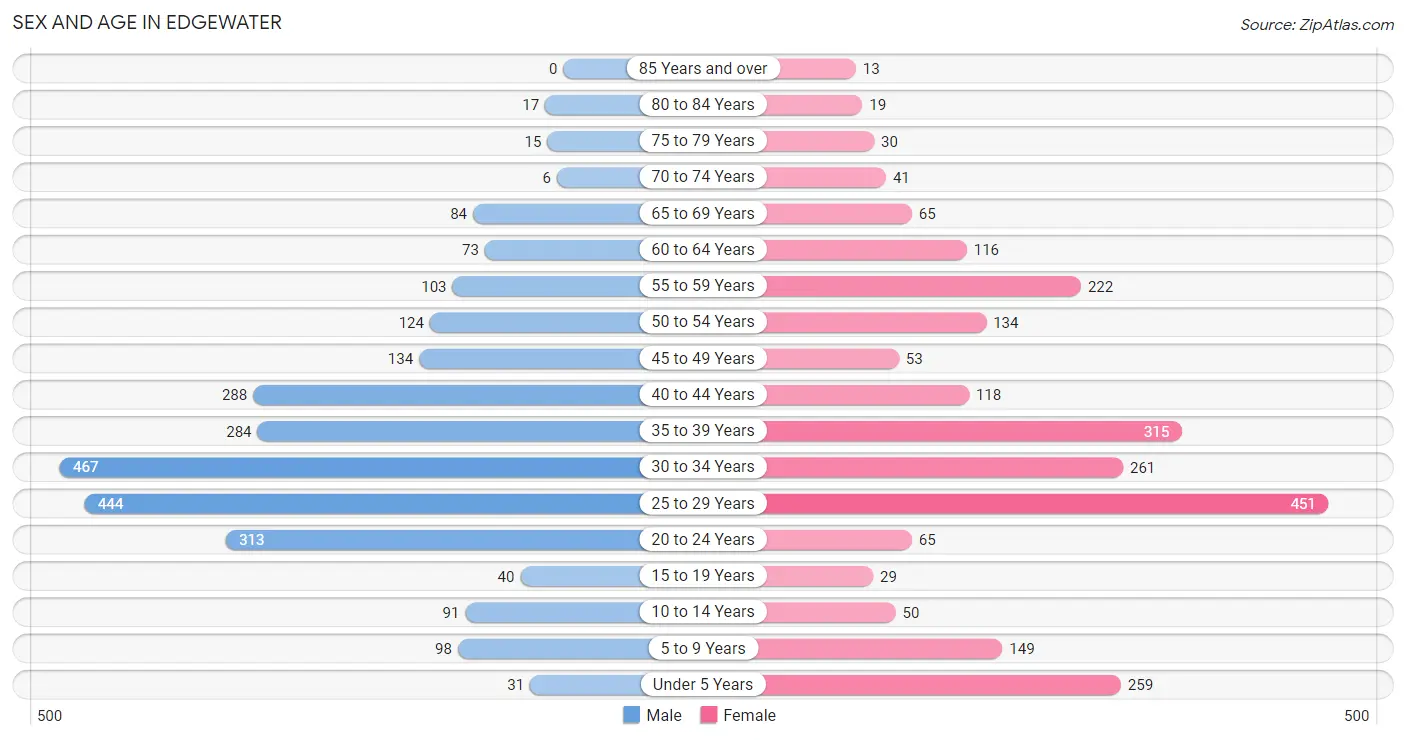
Sex and Age in Edgewater
Sex and Age in Edgewater
The most populous age groups in Edgewater are 30 to 34 Years (467 | 17.9%) for men and 25 to 29 Years (451 | 18.9%) for women.
| Age Bracket | Male | Female |
| Under 5 Years | 31 (1.2%) | 259 (10.8%) |
| 5 to 9 Years | 98 (3.7%) | 149 (6.2%) |
| 10 to 14 Years | 91 (3.5%) | 50 (2.1%) |
| 15 to 19 Years | 40 (1.5%) | 29 (1.2%) |
| 20 to 24 Years | 313 (12.0%) | 65 (2.7%) |
| 25 to 29 Years | 444 (17.0%) | 451 (18.9%) |
| 30 to 34 Years | 467 (17.9%) | 261 (10.9%) |
| 35 to 39 Years | 284 (10.9%) | 315 (13.2%) |
| 40 to 44 Years | 288 (11.0%) | 118 (4.9%) |
| 45 to 49 Years | 134 (5.1%) | 53 (2.2%) |
| 50 to 54 Years | 124 (4.8%) | 134 (5.6%) |
| 55 to 59 Years | 103 (3.9%) | 222 (9.3%) |
| 60 to 64 Years | 73 (2.8%) | 116 (4.9%) |
| 65 to 69 Years | 84 (3.2%) | 65 (2.7%) |
| 70 to 74 Years | 6 (0.2%) | 41 (1.7%) |
| 75 to 79 Years | 15 (0.6%) | 30 (1.3%) |
| 80 to 84 Years | 17 (0.6%) | 19 (0.8%) |
| 85 Years and over | 0 (0.0%) | 13 (0.5%) |
| Total | 2,612 (100.0%) | 2,390 (100.0%) |
Families and Households in Edgewater
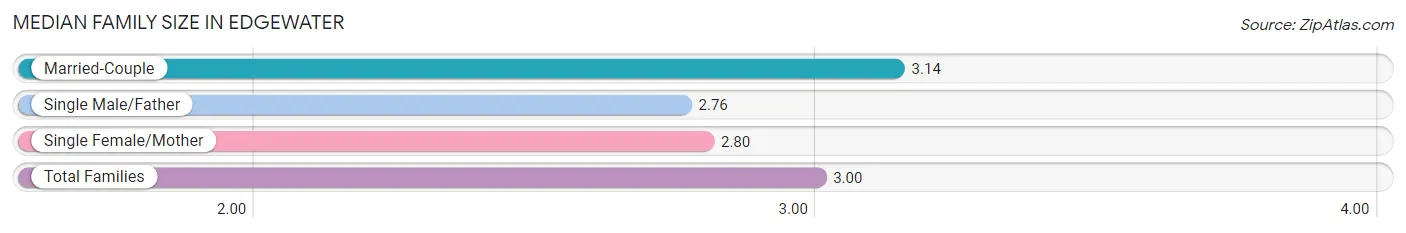
Median Family Size in Edgewater
The median family size in Edgewater is 3.00 persons per family, with married-couple families (582 | 60.4%) accounting for the largest median family size of 3.14 persons per family. On the other hand, single male/father families (153 | 15.9%) represent the smallest median family size with 2.76 persons per family.
| Family Type | # Families | Family Size |
| Married-Couple | 582 (60.4%) | 3.14 |
| Single Male/Father | 153 (15.9%) | 2.76 |
| Single Female/Mother | 229 (23.8%) | 2.80 |
| Total Families | 964 (100.0%) | 3.00 |
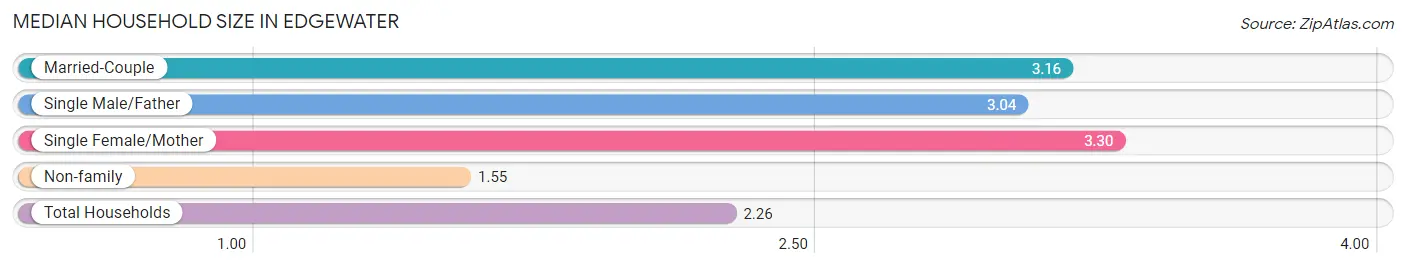
Median Household Size in Edgewater
The median household size in Edgewater is 2.26 persons per household, with single female/mother households (229 | 10.3%) accounting for the largest median household size of 3.3 persons per household. non-family households (1,254 | 56.5%) represent the smallest median household size with 1.55 persons per household.
| Household Type | # Households | Household Size |
| Married-Couple | 582 (26.2%) | 3.16 |
| Single Male/Father | 153 (6.9%) | 3.04 |
| Single Female/Mother | 229 (10.3%) | 3.30 |
| Non-family | 1,254 (56.5%) | 1.55 |
| Total Households | 2,218 (100.0%) | 2.26 |
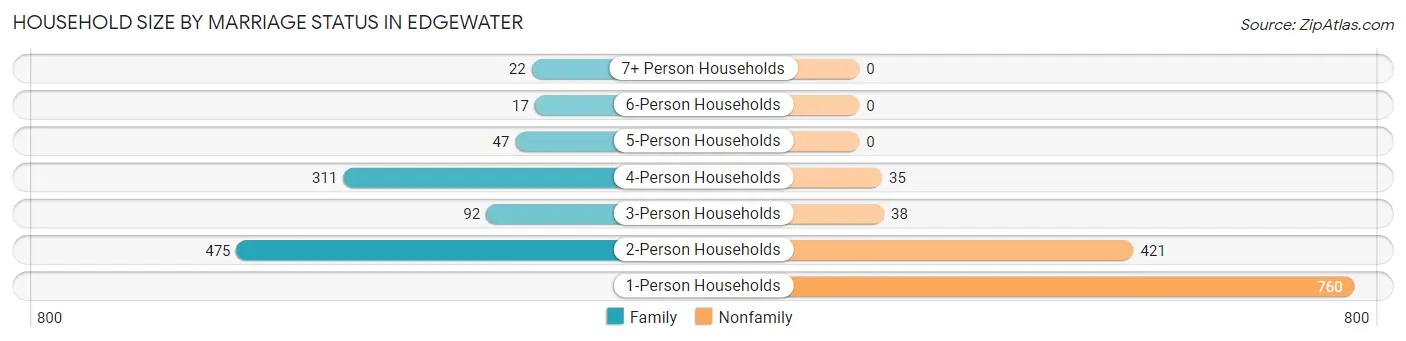
Household Size by Marriage Status in Edgewater
Out of a total of 2,218 households in Edgewater, 964 (43.5%) are family households, while 1,254 (56.5%) are nonfamily households. The most numerous type of family households are 2-person households, comprising 475, and the most common type of nonfamily households are 1-person households, comprising 760.
| Household Size | Family Households | Nonfamily Households |
| 1-Person Households | - | 760 (34.3%) |
| 2-Person Households | 475 (21.4%) | 421 (19.0%) |
| 3-Person Households | 92 (4.2%) | 38 (1.7%) |
| 4-Person Households | 311 (14.0%) | 35 (1.6%) |
| 5-Person Households | 47 (2.1%) | 0 (0.0%) |
| 6-Person Households | 17 (0.8%) | 0 (0.0%) |
| 7+ Person Households | 22 (1.0%) | 0 (0.0%) |
| Total | 964 (43.5%) | 1,254 (56.5%) |
Female Fertility in Edgewater
Fertility by Age in Edgewater
Average fertility rate in Edgewater is 103.0 births per 1,000 women. Women in the age bracket of 35 to 50 years have the highest fertility rate with 196.0 births per 1,000 women. Women in the age bracket of 35 to 50 years acount for 73.5% of all women with births.
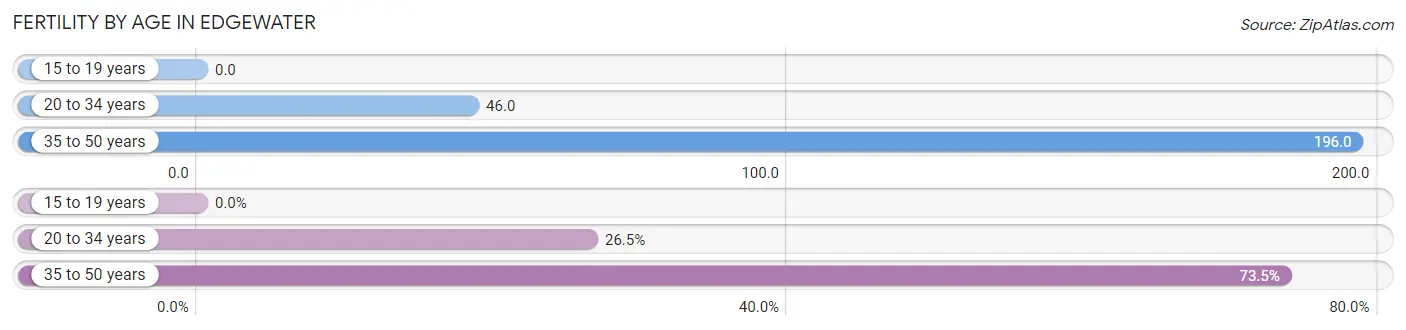
| Age Bracket | Women with Births | Births / 1,000 Women |
| 15 to 19 years | 0 (0.0%) | 0.0 |
| 20 to 34 years | 36 (26.5%) | 46.0 |
| 35 to 50 years | 100 (73.5%) | 196.0 |
| Total | 136 (100.0%) | 103.0 |
Fertility by Age by Marriage Status in Edgewater
68.4% of women with births (136) in Edgewater are married. The highest percentage of unmarried women with births falls into 20 to 34 years age bracket with 100.0% of them unmarried at the time of birth, while the lowest percentage of unmarried women with births belong to 35 to 50 years age bracket with 7.0% of them unmarried.
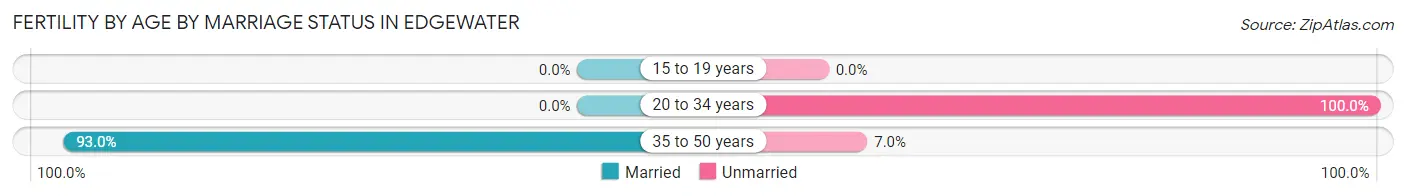
| Age Bracket | Married | Unmarried |
| 15 to 19 years | 0 (0.0%) | 0 (0.0%) |
| 20 to 34 years | 0 (0.0%) | 36 (100.0%) |
| 35 to 50 years | 93 (93.0%) | 7 (7.0%) |
| Total | 93 (68.4%) | 43 (31.6%) |
Fertility by Education in Edgewater
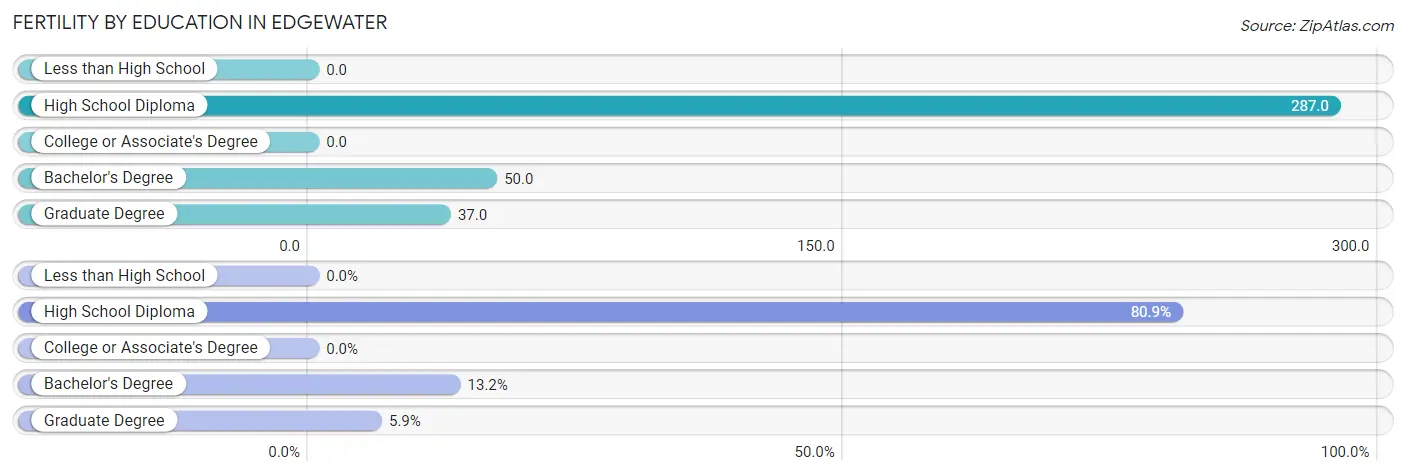
| Educational Attainment | Women with Births | Births / 1,000 Women |
| Less than High School | 0 (0.0%) | 0.0 |
| High School Diploma | 110 (80.9%) | 287.0 |
| College or Associate's Degree | 0 (0.0%) | 0.0 |
| Bachelor's Degree | 18 (13.2%) | 50.0 |
| Graduate Degree | 8 (5.9%) | 37.0 |
| Total | 136 (100.0%) | 103.0 |
Fertility by Education by Marriage Status in Edgewater
31.6% of women with births in Edgewater are unmarried. Women with the educational attainment of graduate degree are most likely to be married with 100.0% of them married at childbirth, while women with the educational attainment of bachelor's degree are least likely to be married with 38.9% of them unmarried at childbirth.
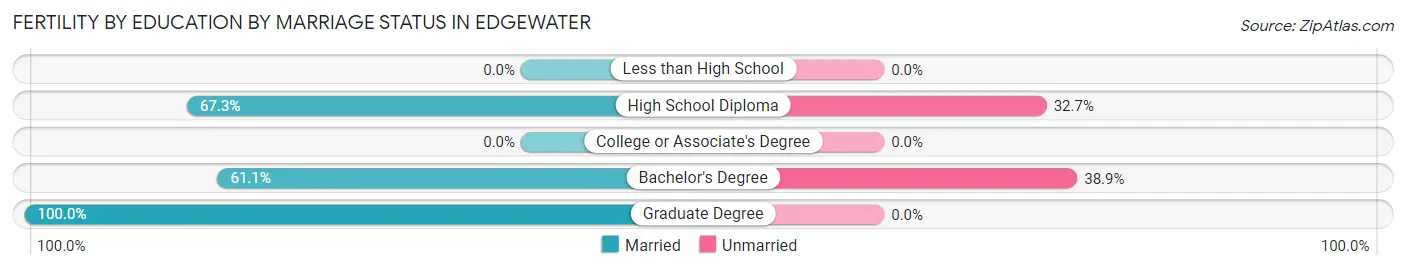
| Educational Attainment | Married | Unmarried |
| Less than High School | 0 (0.0%) | 0 (0.0%) |
| High School Diploma | 74 (67.3%) | 36 (32.7%) |
| College or Associate's Degree | 0 (0.0%) | 0 (0.0%) |
| Bachelor's Degree | 11 (61.1%) | 7 (38.9%) |
| Graduate Degree | 8 (100.0%) | 0 (0.0%) |
| Total | 93 (68.4%) | 43 (31.6%) |
Income in Edgewater
Income Overview in Edgewater
Per Capita Income in Edgewater is $43,238, while median incomes of families and households are $74,426 and $71,964 respectively.
| Characteristic | Number | Measure |
| Per Capita Income | 5,002 | $43,238 |
| Median Family Income | 964 | $74,426 |
| Mean Family Income | 964 | $104,462 |
| Median Household Income | 2,218 | $71,964 |
| Mean Household Income | 2,218 | $91,194 |
| Income Deficit | 964 | $0 |
| Wage / Income Gap (%) | 5,002 | 12.26% |
| Wage / Income Gap ($) | 5,002 | 87.74¢ per $1 |
| Gini / Inequality Index | 5,002 | 0.41 |
Earnings by Sex in Edgewater
Average Earnings in Edgewater are $45,764, $46,741 for men and $41,011 for women, a difference of 12.3%.
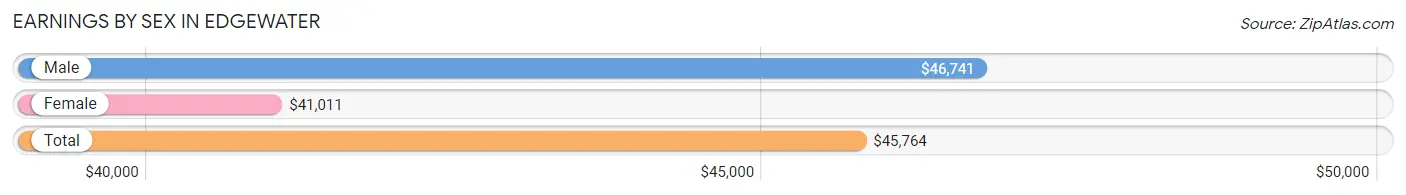
| Sex | Number | Average Earnings |
| Male | 2,139 (57.0%) | $46,741 |
| Female | 1,615 (43.0%) | $41,011 |
| Total | 3,754 (100.0%) | $45,764 |
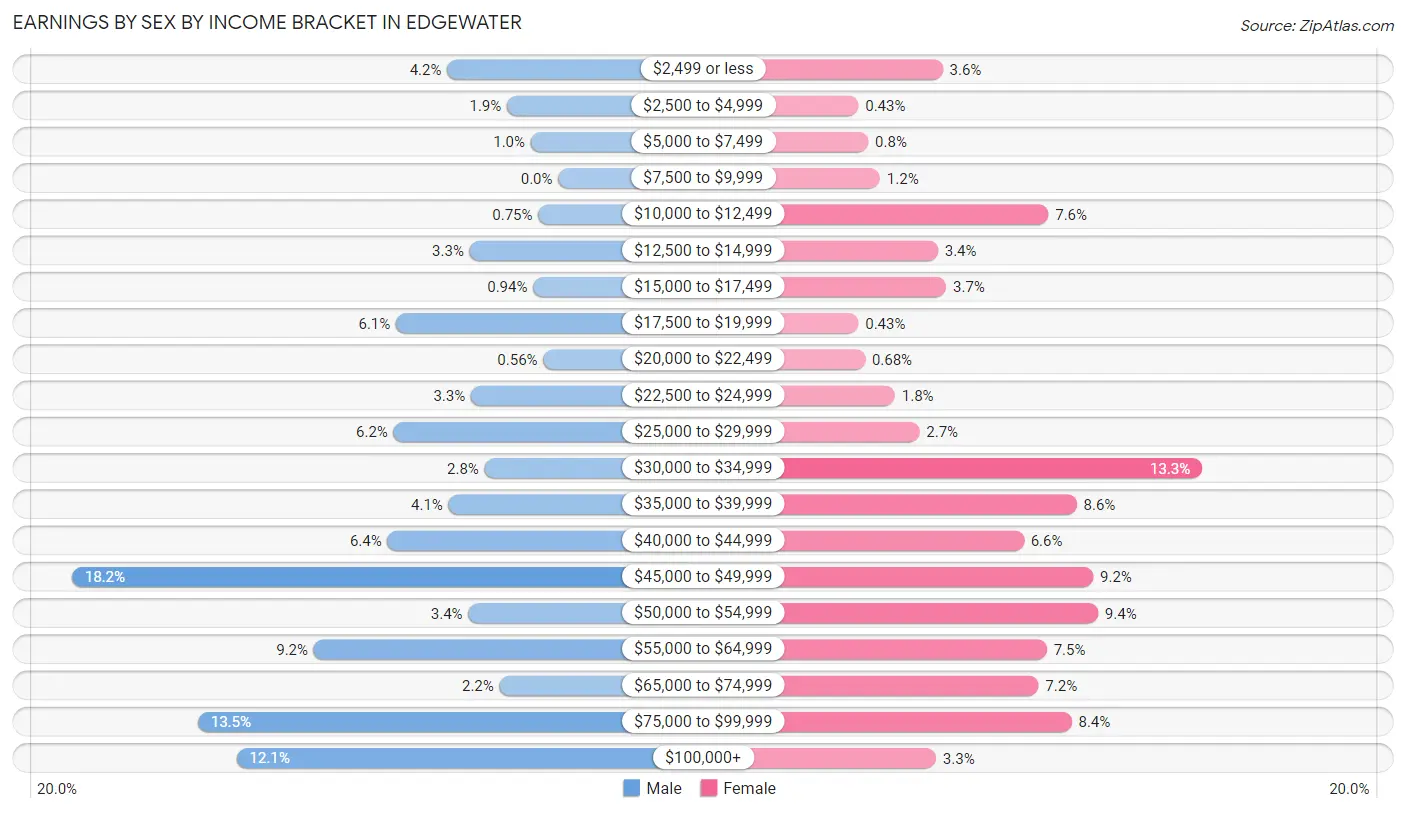
Earnings by Sex by Income Bracket in Edgewater
The most common earnings brackets in Edgewater are $45,000 to $49,999 for men (390 | 18.2%) and $30,000 to $34,999 for women (215 | 13.3%).
| Income | Male | Female |
| $2,499 or less | 89 (4.2%) | 58 (3.6%) |
| $2,500 to $4,999 | 41 (1.9%) | 7 (0.4%) |
| $5,000 to $7,499 | 22 (1.0%) | 13 (0.8%) |
| $7,500 to $9,999 | 0 (0.0%) | 20 (1.2%) |
| $10,000 to $12,499 | 16 (0.7%) | 122 (7.5%) |
| $12,500 to $14,999 | 71 (3.3%) | 55 (3.4%) |
| $15,000 to $17,499 | 20 (0.9%) | 60 (3.7%) |
| $17,500 to $19,999 | 130 (6.1%) | 7 (0.4%) |
| $20,000 to $22,499 | 12 (0.6%) | 11 (0.7%) |
| $22,500 to $24,999 | 70 (3.3%) | 29 (1.8%) |
| $25,000 to $29,999 | 132 (6.2%) | 44 (2.7%) |
| $30,000 to $34,999 | 59 (2.8%) | 215 (13.3%) |
| $35,000 to $39,999 | 88 (4.1%) | 139 (8.6%) |
| $40,000 to $44,999 | 137 (6.4%) | 107 (6.6%) |
| $45,000 to $49,999 | 390 (18.2%) | 149 (9.2%) |
| $50,000 to $54,999 | 72 (3.4%) | 152 (9.4%) |
| $55,000 to $64,999 | 196 (9.2%) | 121 (7.5%) |
| $65,000 to $74,999 | 47 (2.2%) | 116 (7.2%) |
| $75,000 to $99,999 | 289 (13.5%) | 136 (8.4%) |
| $100,000+ | 258 (12.1%) | 54 (3.3%) |
| Total | 2,139 (100.0%) | 1,615 (100.0%) |
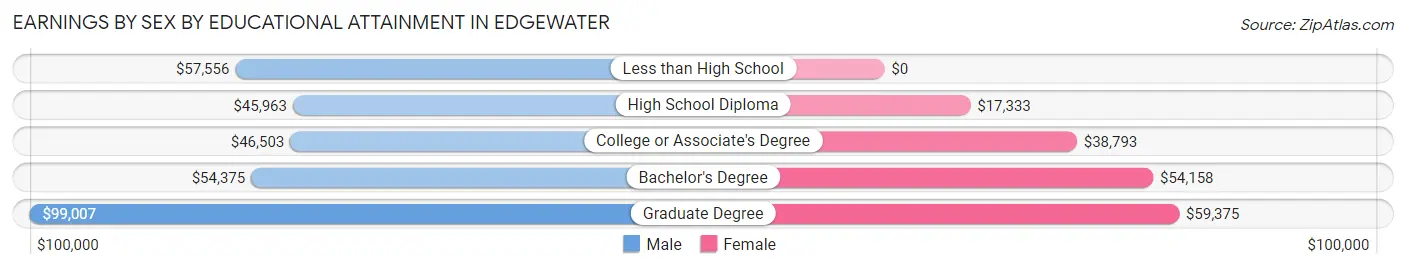
Earnings by Sex by Educational Attainment in Edgewater
Average earnings in Edgewater are $47,343 for men and $42,298 for women, a difference of 10.7%. Men with an educational attainment of graduate degree enjoy the highest average annual earnings of $99,007, while those with high school diploma education earn the least with $45,963. Women with an educational attainment of graduate degree earn the most with the average annual earnings of $59,375, while those with high school diploma education have the smallest earnings of $17,333.
| Educational Attainment | Male Income | Female Income |
| Less than High School | $57,556 | $0 |
| High School Diploma | $45,963 | $17,333 |
| College or Associate's Degree | $46,503 | $38,793 |
| Bachelor's Degree | $54,375 | $54,158 |
| Graduate Degree | $99,007 | $59,375 |
| Total | $47,343 | $42,298 |
Family Income in Edgewater
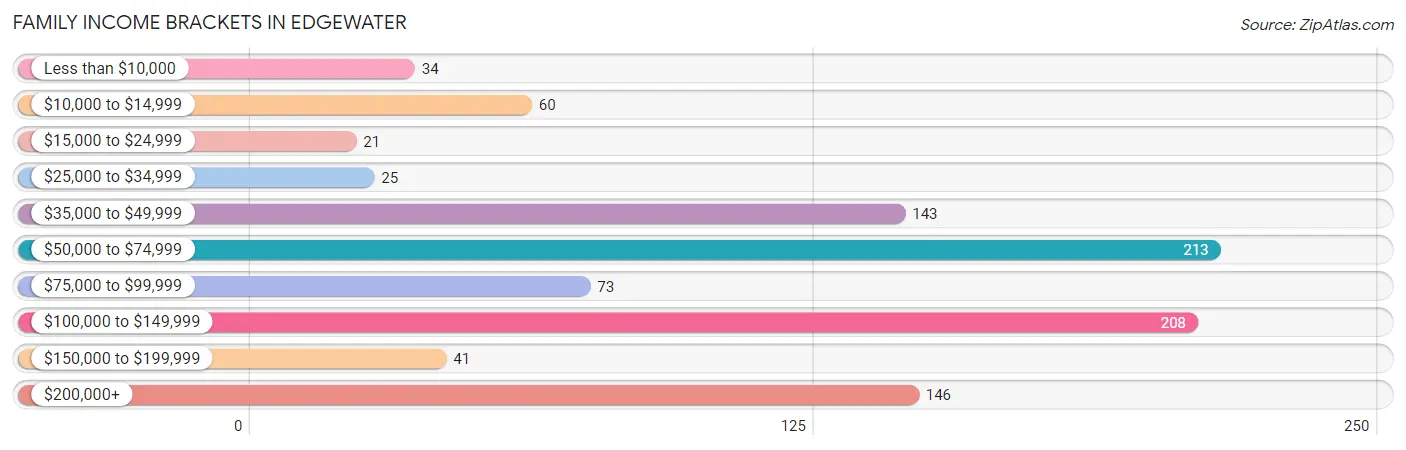
Family Income Brackets in Edgewater
According to the Edgewater family income data, there are 213 families falling into the $50,000 to $74,999 income range, which is the most common income bracket and makes up 22.1% of all families. Conversely, the $15,000 to $24,999 income bracket is the least frequent group with only 21 families (2.2%) belonging to this category.
| Income Bracket | # Families | % Families |
| Less than $10,000 | 34 | 3.5% |
| $10,000 to $14,999 | 60 | 6.2% |
| $15,000 to $24,999 | 21 | 2.2% |
| $25,000 to $34,999 | 25 | 2.6% |
| $35,000 to $49,999 | 143 | 14.8% |
| $50,000 to $74,999 | 213 | 22.1% |
| $75,000 to $99,999 | 73 | 7.6% |
| $100,000 to $149,999 | 208 | 21.6% |
| $150,000 to $199,999 | 41 | 4.3% |
| $200,000+ | 146 | 15.1% |
Family Income by Famaliy Size in Edgewater
2-person families (475 | 49.3%) account for the highest median family income in Edgewater with $91,544 per family, while 2-person families (475 | 49.3%) have the highest median income of $45,772 per family member.
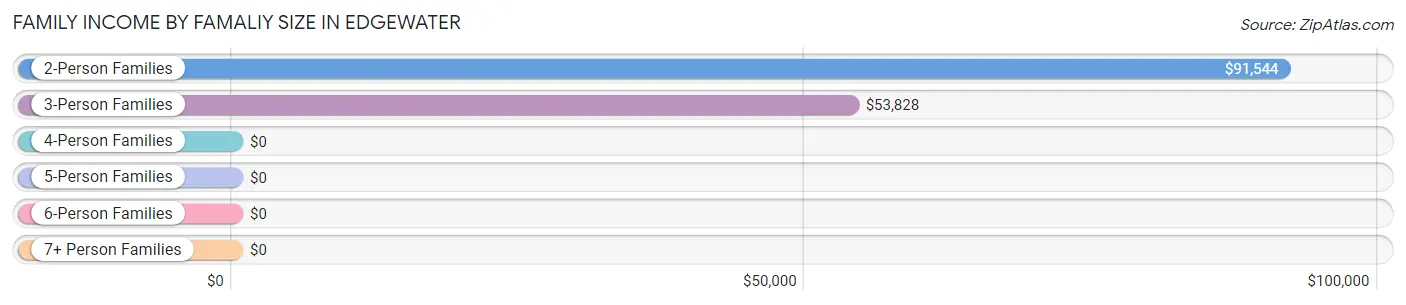
| Income Bracket | # Families | Median Income |
| 2-Person Families | 475 (49.3%) | $91,544 |
| 3-Person Families | 214 (22.2%) | $53,828 |
| 4-Person Families | 189 (19.6%) | $0 |
| 5-Person Families | 47 (4.9%) | $0 |
| 6-Person Families | 26 (2.7%) | $0 |
| 7+ Person Families | 13 (1.3%) | $0 |
| Total | 964 (100.0%) | $74,426 |
Family Income by Number of Earners in Edgewater
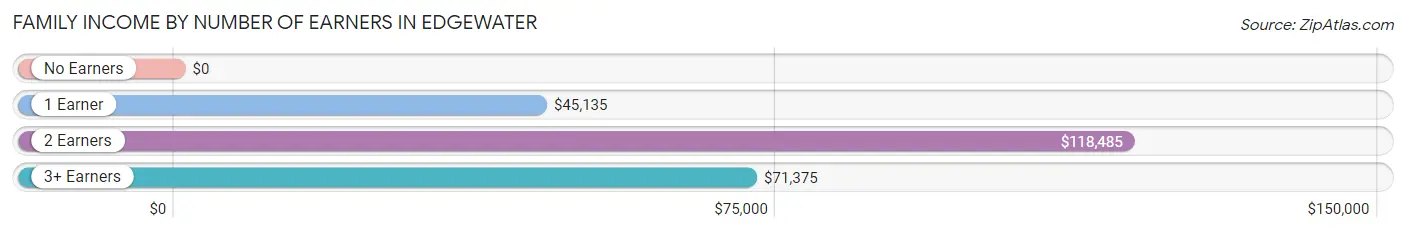
| Number of Earners | # Families | Median Income |
| No Earners | 31 (3.2%) | $0 |
| 1 Earner | 254 (26.4%) | $45,135 |
| 2 Earners | 574 (59.5%) | $118,485 |
| 3+ Earners | 105 (10.9%) | $71,375 |
| Total | 964 (100.0%) | $74,426 |
Household Income in Edgewater
Household Income Brackets in Edgewater
With 468 households falling in the category, the $100,000 to $149,999 income range is the most frequent in Edgewater, accounting for 21.1% of all households. In contrast, only 18 households (0.8%) fall into the less than $10,000 income bracket, making it the least populous group.
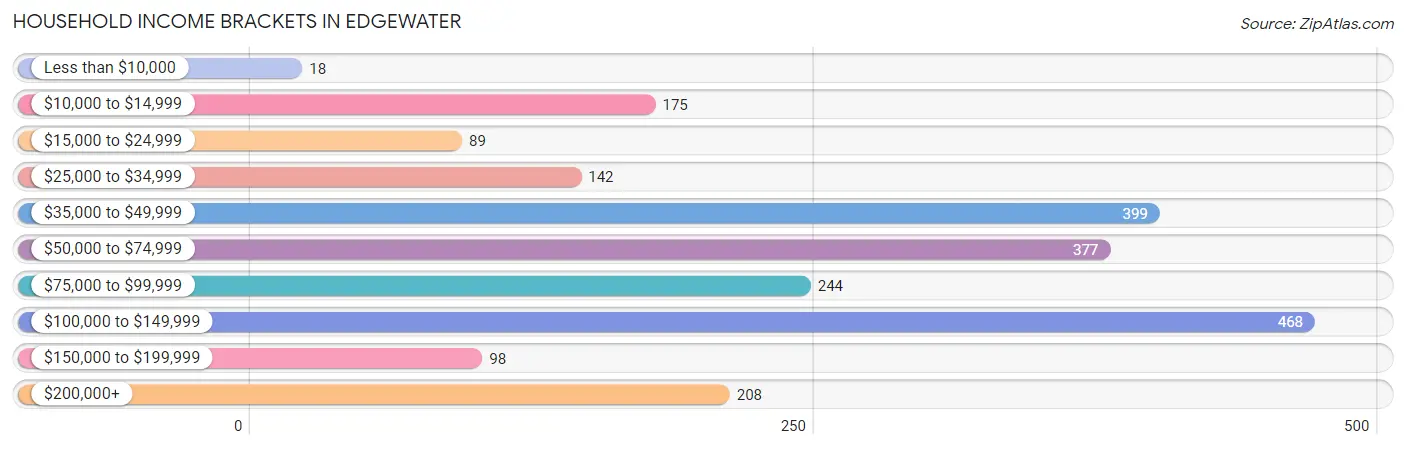
| Income Bracket | # Households | % Households |
| Less than $10,000 | 18 | 0.8% |
| $10,000 to $14,999 | 175 | 7.9% |
| $15,000 to $24,999 | 89 | 4.0% |
| $25,000 to $34,999 | 142 | 6.4% |
| $35,000 to $49,999 | 399 | 18.0% |
| $50,000 to $74,999 | 377 | 17.0% |
| $75,000 to $99,999 | 244 | 11.0% |
| $100,000 to $149,999 | 468 | 21.1% |
| $150,000 to $199,999 | 98 | 4.4% |
| $200,000+ | 208 | 9.4% |
Household Income by Householder Age in Edgewater
The median household income in Edgewater is $71,964, with the highest median household income of $103,214 found in the 25 to 44 years age bracket for the primary householder. A total of 1,164 households (52.5%) fall into this category. Meanwhile, the 65+ years age bracket for the primary householder has the lowest median household income of $32,564, with 232 households (10.5%) in this group.
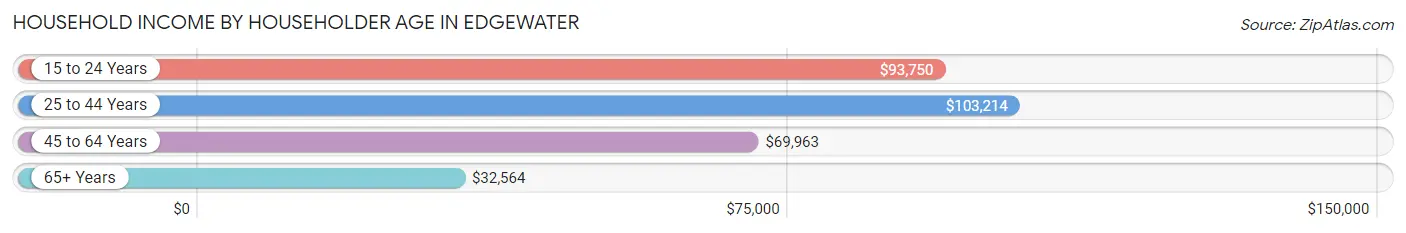
| Income Bracket | # Households | Median Income |
| 15 to 24 Years | 89 (4.0%) | $93,750 |
| 25 to 44 Years | 1,164 (52.5%) | $103,214 |
| 45 to 64 Years | 733 (33.1%) | $69,963 |
| 65+ Years | 232 (10.5%) | $32,564 |
| Total | 2,218 (100.0%) | $71,964 |
Poverty in Edgewater
Income Below Poverty by Sex and Age in Edgewater
With 6.5% poverty level for males and 13.1% for females among the residents of Edgewater, 12 to 14 year old males and 6 to 11 year old females are the most vulnerable to poverty, with 40 males (53.3%) and 43 females (32.3%) in their respective age groups living below the poverty level.
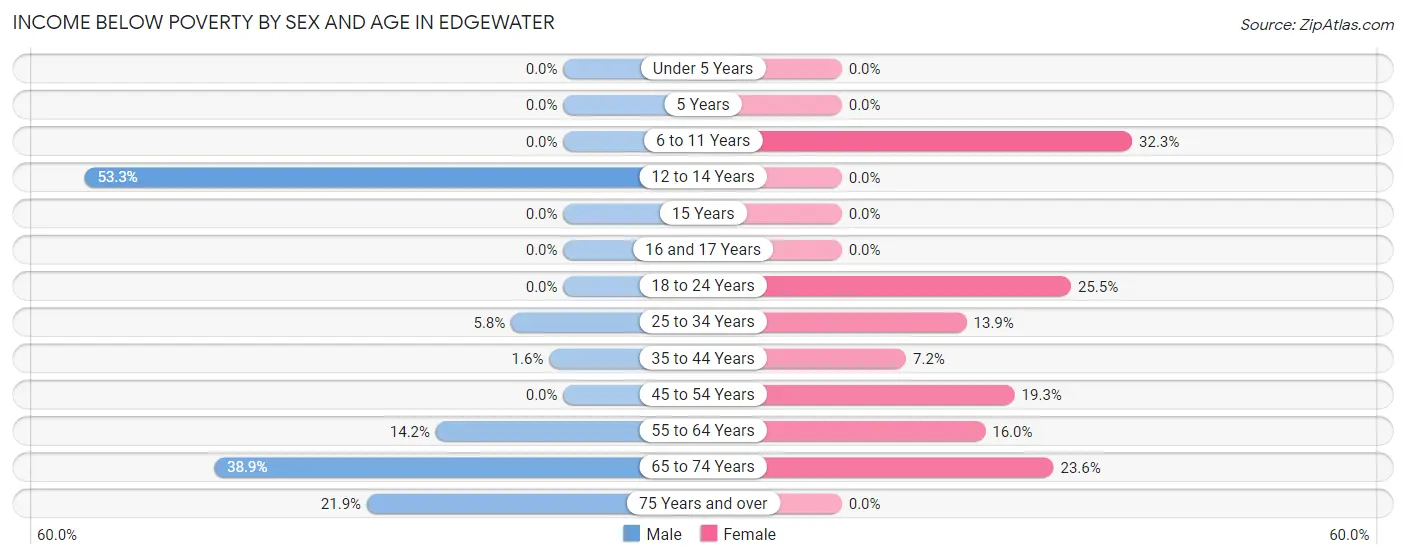
| Age Bracket | Male | Female |
| Under 5 Years | 0 (0.0%) | 0 (0.0%) |
| 5 Years | 0 (0.0%) | 0 (0.0%) |
| 6 to 11 Years | 0 (0.0%) | 43 (32.3%) |
| 12 to 14 Years | 40 (53.3%) | 0 (0.0%) |
| 15 Years | 0 (0.0%) | 0 (0.0%) |
| 16 and 17 Years | 0 (0.0%) | 0 (0.0%) |
| 18 to 24 Years | 0 (0.0%) | 24 (25.5%) |
| 25 to 34 Years | 53 (5.8%) | 99 (13.9%) |
| 35 to 44 Years | 9 (1.6%) | 31 (7.2%) |
| 45 to 54 Years | 0 (0.0%) | 36 (19.3%) |
| 55 to 64 Years | 25 (14.2%) | 54 (16.0%) |
| 65 to 74 Years | 35 (38.9%) | 25 (23.6%) |
| 75 Years and over | 7 (21.9%) | 0 (0.0%) |
| Total | 169 (6.5%) | 312 (13.1%) |
Income Above Poverty by Sex and Age in Edgewater
According to the poverty statistics in Edgewater, males aged under 5 years and females aged under 5 years are the age groups that are most secure financially, with 100.0% of males and 100.0% of females in these age groups living above the poverty line.
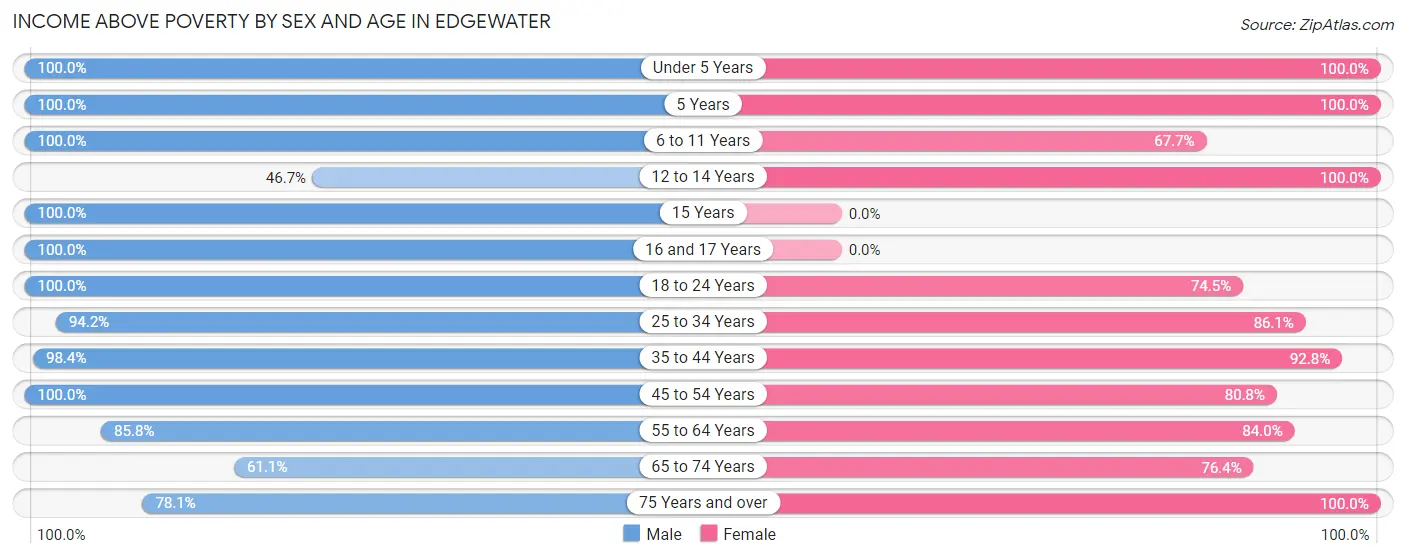
| Age Bracket | Male | Female |
| Under 5 Years | 31 (100.0%) | 259 (100.0%) |
| 5 Years | 28 (100.0%) | 16 (100.0%) |
| 6 to 11 Years | 86 (100.0%) | 90 (67.7%) |
| 12 to 14 Years | 35 (46.7%) | 50 (100.0%) |
| 15 Years | 10 (100.0%) | 0 (0.0%) |
| 16 and 17 Years | 17 (100.0%) | 0 (0.0%) |
| 18 to 24 Years | 326 (100.0%) | 70 (74.5%) |
| 25 to 34 Years | 858 (94.2%) | 613 (86.1%) |
| 35 to 44 Years | 563 (98.4%) | 402 (92.8%) |
| 45 to 54 Years | 258 (100.0%) | 151 (80.7%) |
| 55 to 64 Years | 151 (85.8%) | 284 (84.0%) |
| 65 to 74 Years | 55 (61.1%) | 81 (76.4%) |
| 75 Years and over | 25 (78.1%) | 62 (100.0%) |
| Total | 2,443 (93.5%) | 2,078 (87.0%) |
Income Below Poverty Among Married-Couple Families in Edgewater
The poverty statistics for married-couple families in Edgewater show that 1.2% or 7 of the total 582 families live below the poverty line. Families with no children have the highest poverty rate of 2.2%, comprising of 7 families. On the other hand, families with 1 or 2 children have the lowest poverty rate of 0.0%, which includes 0 families.
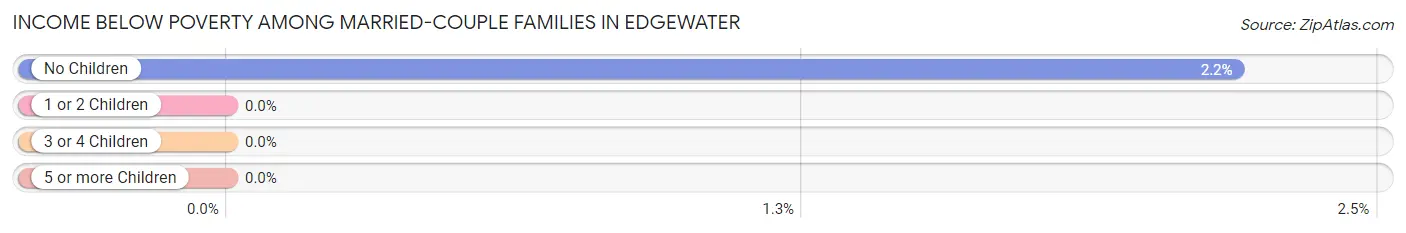
| Children | Above Poverty | Below Poverty |
| No Children | 312 (97.8%) | 7 (2.2%) |
| 1 or 2 Children | 230 (100.0%) | 0 (0.0%) |
| 3 or 4 Children | 33 (100.0%) | 0 (0.0%) |
| 5 or more Children | 0 (0.0%) | 0 (0.0%) |
| Total | 575 (98.8%) | 7 (1.2%) |
Income Below Poverty Among Single-Parent Households in Edgewater
According to the poverty data in Edgewater, 34.6% or 53 single-father households and 18.3% or 42 single-mother households are living below the poverty line. Among single-father households, those with no children have the highest poverty rate, with 53 households (59.6%) experiencing poverty. Likewise, among single-mother households, those with 1 or 2 children have the highest poverty rate, with 34 households (39.5%) falling below the poverty line.
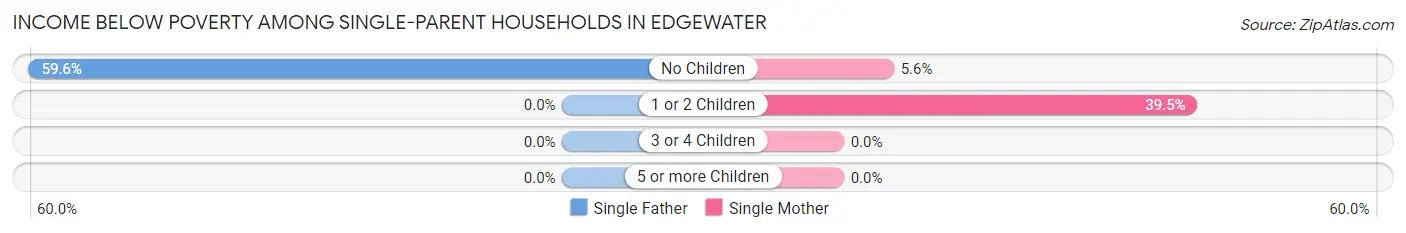
| Children | Single Father | Single Mother |
| No Children | 53 (59.6%) | 8 (5.6%) |
| 1 or 2 Children | 0 (0.0%) | 34 (39.5%) |
| 3 or 4 Children | 0 (0.0%) | 0 (0.0%) |
| 5 or more Children | 0 (0.0%) | 0 (0.0%) |
| Total | 53 (34.6%) | 42 (18.3%) |
Income Below Poverty Among Married-Couple vs Single-Parent Households in Edgewater
The poverty data for Edgewater shows that 7 of the married-couple family households (1.2%) and 95 of the single-parent households (24.9%) are living below the poverty level. Within the married-couple family households, those with no children have the highest poverty rate, with 7 households (2.2%) falling below the poverty line. Among the single-parent households, those with no children have the highest poverty rate, with 61 household (26.3%) living below poverty.
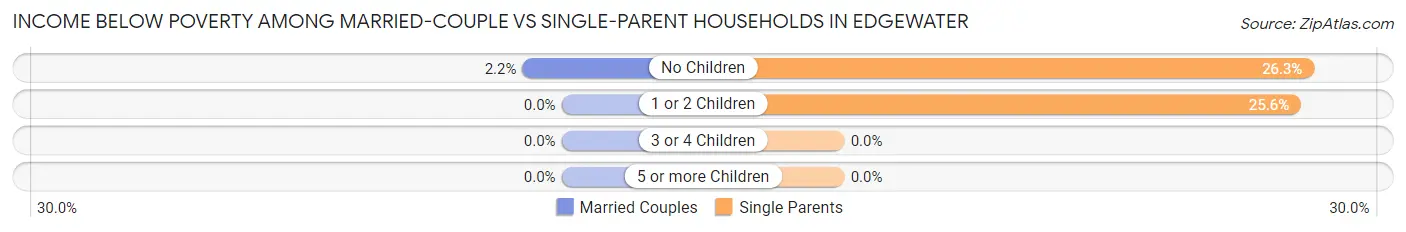
| Children | Married-Couple Families | Single-Parent Households |
| No Children | 7 (2.2%) | 61 (26.3%) |
| 1 or 2 Children | 0 (0.0%) | 34 (25.6%) |
| 3 or 4 Children | 0 (0.0%) | 0 (0.0%) |
| 5 or more Children | 0 (0.0%) | 0 (0.0%) |
| Total | 7 (1.2%) | 95 (24.9%) |
Employment Characteristics in Edgewater
Employment by Class of Employer in Edgewater
Among the 3,505 employed individuals in Edgewater, private company employees (2,451 | 69.9%), not-for-profit organizations (312 | 8.9%), and self-employed (not incorporated) (231 | 6.6%) make up the most common classes of employment.
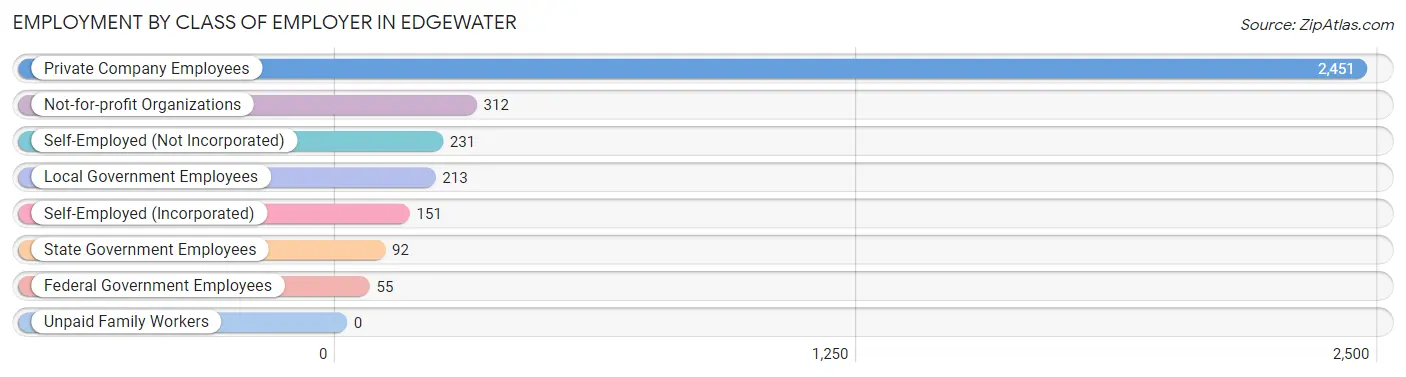
| Employer Class | # Employees | % Employees |
| Private Company Employees | 2,451 | 69.9% |
| Self-Employed (Incorporated) | 151 | 4.3% |
| Self-Employed (Not Incorporated) | 231 | 6.6% |
| Not-for-profit Organizations | 312 | 8.9% |
| Local Government Employees | 213 | 6.1% |
| State Government Employees | 92 | 2.6% |
| Federal Government Employees | 55 | 1.6% |
| Unpaid Family Workers | 0 | 0.0% |
| Total | 3,505 | 100.0% |
Employment Status by Age in Edgewater
According to the labor force statistics for Edgewater, out of the total population over 16 years of age (4,314), 86.1% or 3,714 individuals are in the labor force, with 4.2% or 156 of them unemployed. The age group with the highest labor force participation rate is 20 to 24 years, with 100.0% or 378 individuals in the labor force. Within the labor force, the 60 to 64 years age range has the highest percentage of unemployed individuals, with 25.8% or 24 of them being unemployed.
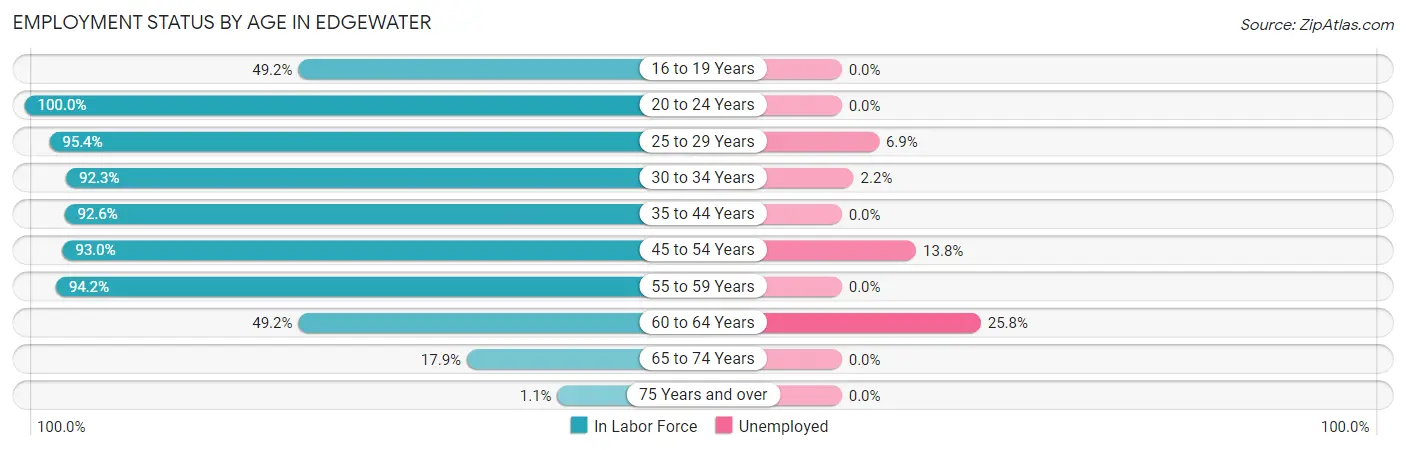
| Age Bracket | In Labor Force | Unemployed |
| 16 to 19 Years | 29 (49.2%) | 0 (0.0%) |
| 20 to 24 Years | 378 (100.0%) | 0 (0.0%) |
| 25 to 29 Years | 854 (95.4%) | 59 (6.9%) |
| 30 to 34 Years | 672 (92.3%) | 15 (2.2%) |
| 35 to 44 Years | 931 (92.6%) | 0 (0.0%) |
| 45 to 54 Years | 414 (93.0%) | 57 (13.8%) |
| 55 to 59 Years | 306 (94.2%) | 0 (0.0%) |
| 60 to 64 Years | 93 (49.2%) | 24 (25.8%) |
| 65 to 74 Years | 35 (17.9%) | 0 (0.0%) |
| 75 Years and over | 1 (1.1%) | 0 (0.0%) |
| Total | 3,714 (86.1%) | 156 (4.2%) |
Employment Status by Educational Attainment in Edgewater
According to labor force statistics for Edgewater, 91.2% of individuals (3,271) out of the total population between 25 and 64 years of age (3,587) are in the labor force, with 4.7% or 154 of them being unemployed. The group with the highest labor force participation rate are those with the educational attainment of college / associate degree, with 99.1% or 951 individuals in the labor force. Within the labor force, individuals with less than high school education have the highest percentage of unemployment, with 38.1% or 106 of them being unemployed.
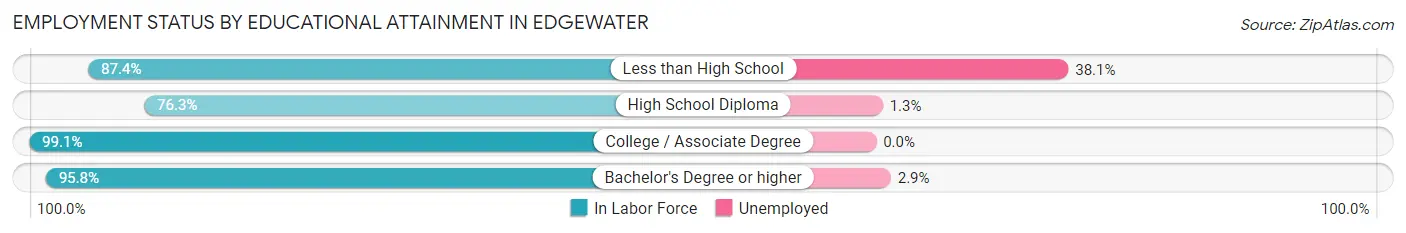
| Educational Attainment | In Labor Force | Unemployed |
| Less than High School | 278 (87.4%) | 121 (38.1%) |
| High School Diploma | 669 (76.3%) | 11 (1.3%) |
| College / Associate Degree | 951 (99.1%) | 0 (0.0%) |
| Bachelor's Degree or higher | 1,372 (95.8%) | 42 (2.9%) |
| Total | 3,271 (91.2%) | 169 (4.7%) |
Employment Occupations by Sex in Edgewater
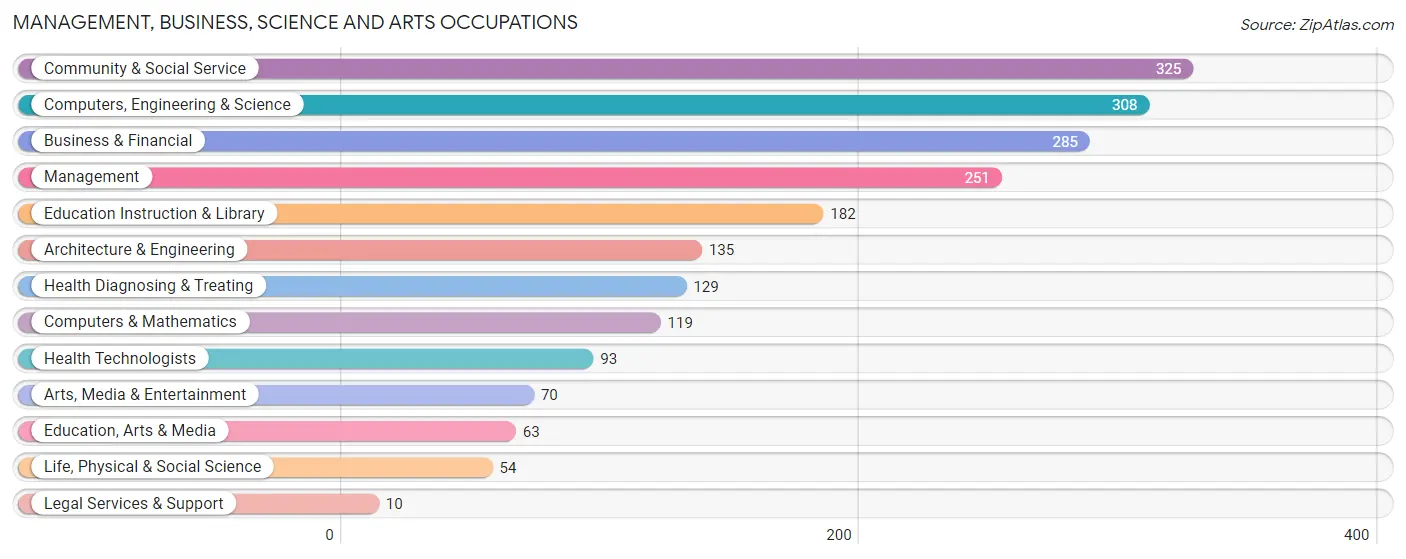
Management, Business, Science and Arts Occupations
The most common Management, Business, Science and Arts occupations in Edgewater are Community & Social Service (325 | 9.1%), Computers, Engineering & Science (308 | 8.7%), Business & Financial (285 | 8.0%), Management (251 | 7.0%), and Education Instruction & Library (182 | 5.1%).
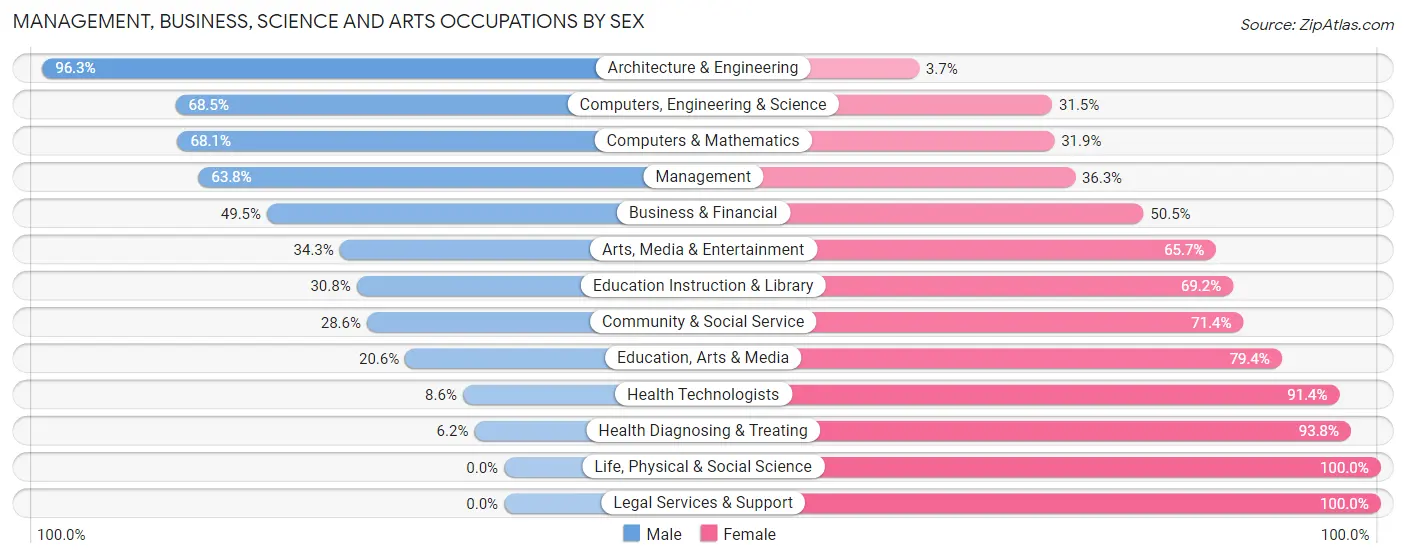
Management, Business, Science and Arts Occupations by Sex
Within the Management, Business, Science and Arts occupations in Edgewater, the most male-oriented occupations are Architecture & Engineering (96.3%), Computers, Engineering & Science (68.5%), and Computers & Mathematics (68.1%), while the most female-oriented occupations are Life, Physical & Social Science (100.0%), Legal Services & Support (100.0%), and Health Diagnosing & Treating (93.8%).
| Occupation | Male | Female |
| Management | 160 (63.7%) | 91 (36.2%) |
| Business & Financial | 141 (49.5%) | 144 (50.5%) |
| Computers, Engineering & Science | 211 (68.5%) | 97 (31.5%) |
| Computers & Mathematics | 81 (68.1%) | 38 (31.9%) |
| Architecture & Engineering | 130 (96.3%) | 5 (3.7%) |
| Life, Physical & Social Science | 0 (0.0%) | 54 (100.0%) |
| Community & Social Service | 93 (28.6%) | 232 (71.4%) |
| Education, Arts & Media | 13 (20.6%) | 50 (79.4%) |
| Legal Services & Support | 0 (0.0%) | 10 (100.0%) |
| Education Instruction & Library | 56 (30.8%) | 126 (69.2%) |
| Arts, Media & Entertainment | 24 (34.3%) | 46 (65.7%) |
| Health Diagnosing & Treating | 8 (6.2%) | 121 (93.8%) |
| Health Technologists | 8 (8.6%) | 85 (91.4%) |
| Total (Category) | 613 (47.2%) | 685 (52.8%) |
| Total (Overall) | 2,008 (56.4%) | 1,550 (43.6%) |
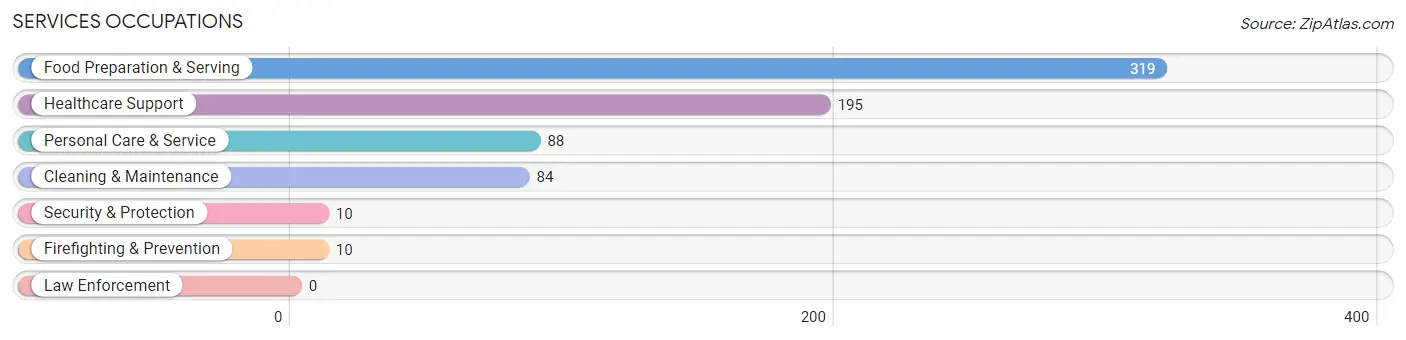
Services Occupations
The most common Services occupations in Edgewater are Food Preparation & Serving (319 | 9.0%), Healthcare Support (195 | 5.5%), Personal Care & Service (88 | 2.5%), Cleaning & Maintenance (84 | 2.4%), and Security & Protection (10 | 0.3%).
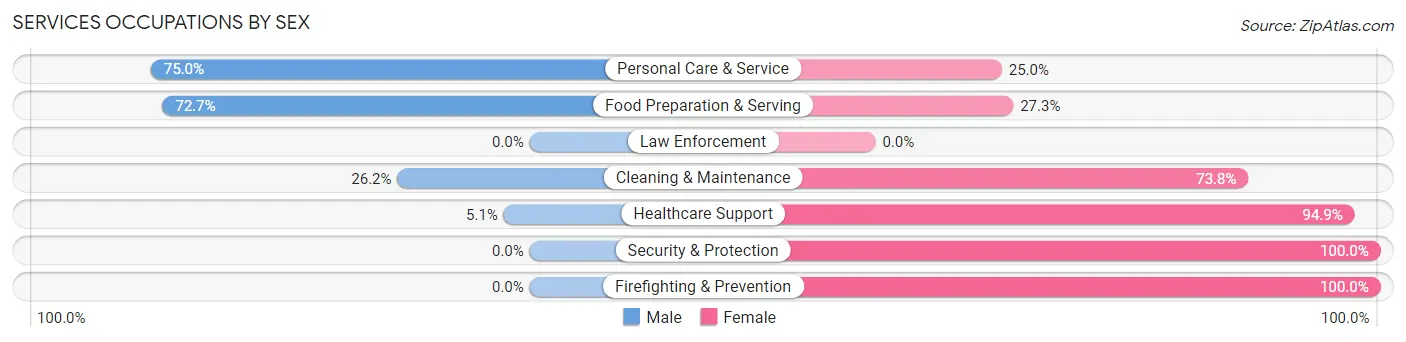
Services Occupations by Sex
Within the Services occupations in Edgewater, the most male-oriented occupations are Personal Care & Service (75.0%), Food Preparation & Serving (72.7%), and Cleaning & Maintenance (26.2%), while the most female-oriented occupations are Security & Protection (100.0%), Firefighting & Prevention (100.0%), and Healthcare Support (94.9%).
| Occupation | Male | Female |
| Healthcare Support | 10 (5.1%) | 185 (94.9%) |
| Security & Protection | 0 (0.0%) | 10 (100.0%) |
| Firefighting & Prevention | 0 (0.0%) | 10 (100.0%) |
| Law Enforcement | 0 (0.0%) | 0 (0.0%) |
| Food Preparation & Serving | 232 (72.7%) | 87 (27.3%) |
| Cleaning & Maintenance | 22 (26.2%) | 62 (73.8%) |
| Personal Care & Service | 66 (75.0%) | 22 (25.0%) |
| Total (Category) | 330 (47.4%) | 366 (52.6%) |
| Total (Overall) | 2,008 (56.4%) | 1,550 (43.6%) |
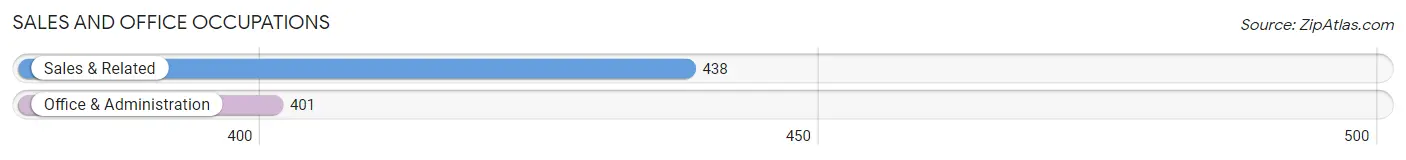
Sales and Office Occupations
The most common Sales and Office occupations in Edgewater are Sales & Related (438 | 12.3%), and Office & Administration (401 | 11.3%).
Sales and Office Occupations by Sex
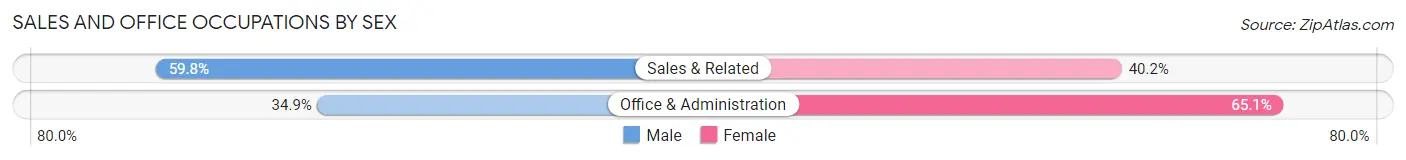
| Occupation | Male | Female |
| Sales & Related | 262 (59.8%) | 176 (40.2%) |
| Office & Administration | 140 (34.9%) | 261 (65.1%) |
| Total (Category) | 402 (47.9%) | 437 (52.1%) |
| Total (Overall) | 2,008 (56.4%) | 1,550 (43.6%) |
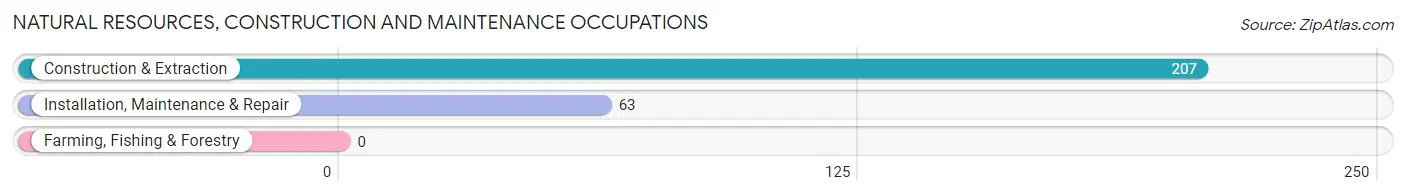
Natural Resources, Construction and Maintenance Occupations
The most common Natural Resources, Construction and Maintenance occupations in Edgewater are Construction & Extraction (207 | 5.8%), and Installation, Maintenance & Repair (63 | 1.8%).
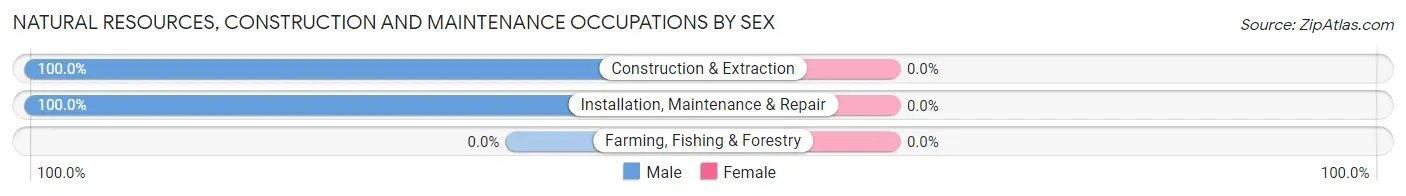
Natural Resources, Construction and Maintenance Occupations by Sex
| Occupation | Male | Female |
| Farming, Fishing & Forestry | 0 (0.0%) | 0 (0.0%) |
| Construction & Extraction | 207 (100.0%) | 0 (0.0%) |
| Installation, Maintenance & Repair | 63 (100.0%) | 0 (0.0%) |
| Total (Category) | 270 (100.0%) | 0 (0.0%) |
| Total (Overall) | 2,008 (56.4%) | 1,550 (43.6%) |
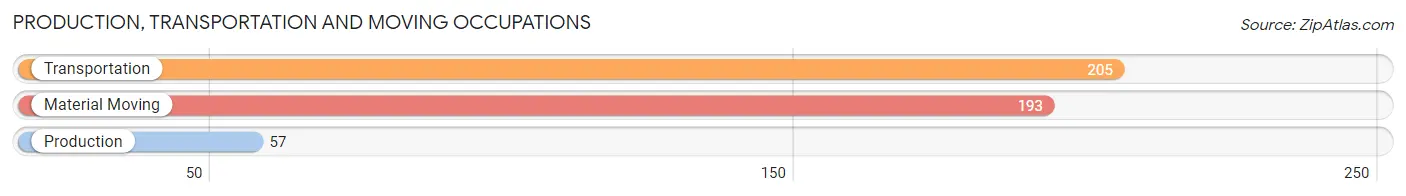
Production, Transportation and Moving Occupations
The most common Production, Transportation and Moving occupations in Edgewater are Transportation (205 | 5.8%), Material Moving (193 | 5.4%), and Production (57 | 1.6%).
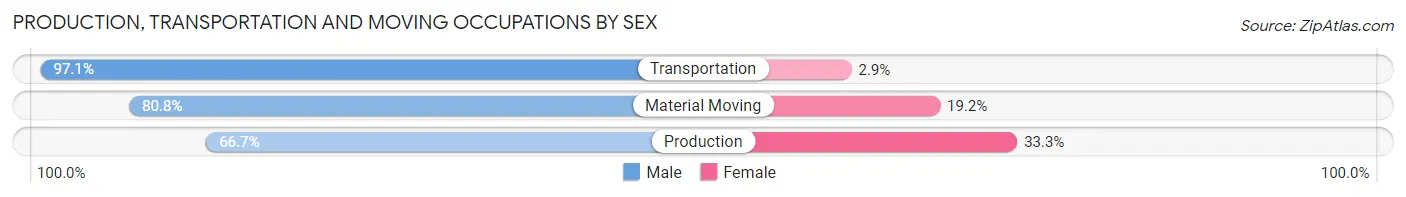
Production, Transportation and Moving Occupations by Sex
| Occupation | Male | Female |
| Production | 38 (66.7%) | 19 (33.3%) |
| Transportation | 199 (97.1%) | 6 (2.9%) |
| Material Moving | 156 (80.8%) | 37 (19.2%) |
| Total (Category) | 393 (86.4%) | 62 (13.6%) |
| Total (Overall) | 2,008 (56.4%) | 1,550 (43.6%) |
Employment Industries by Sex in Edgewater
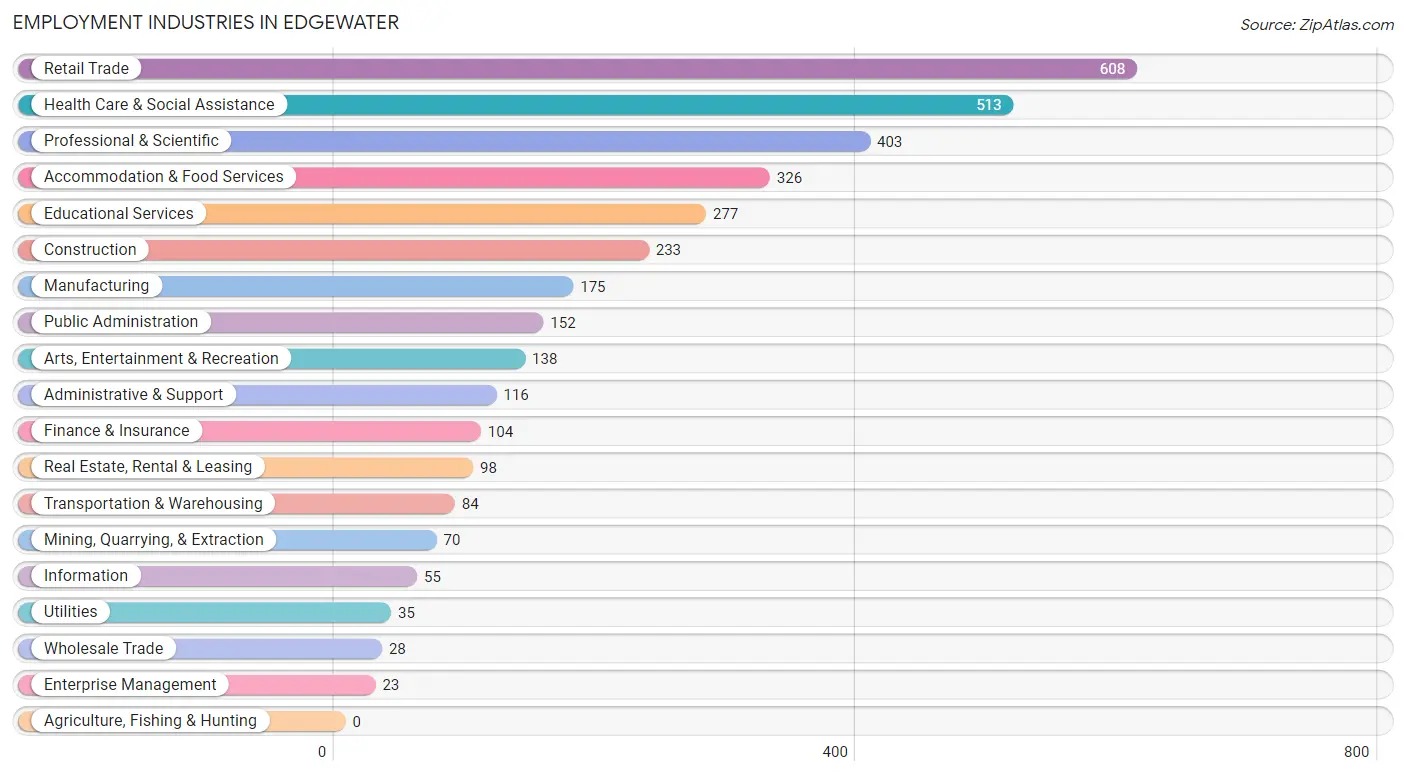
Employment Industries in Edgewater
The major employment industries in Edgewater include Retail Trade (608 | 17.1%), Health Care & Social Assistance (513 | 14.4%), Professional & Scientific (403 | 11.3%), Accommodation & Food Services (326 | 9.2%), and Educational Services (277 | 7.8%).
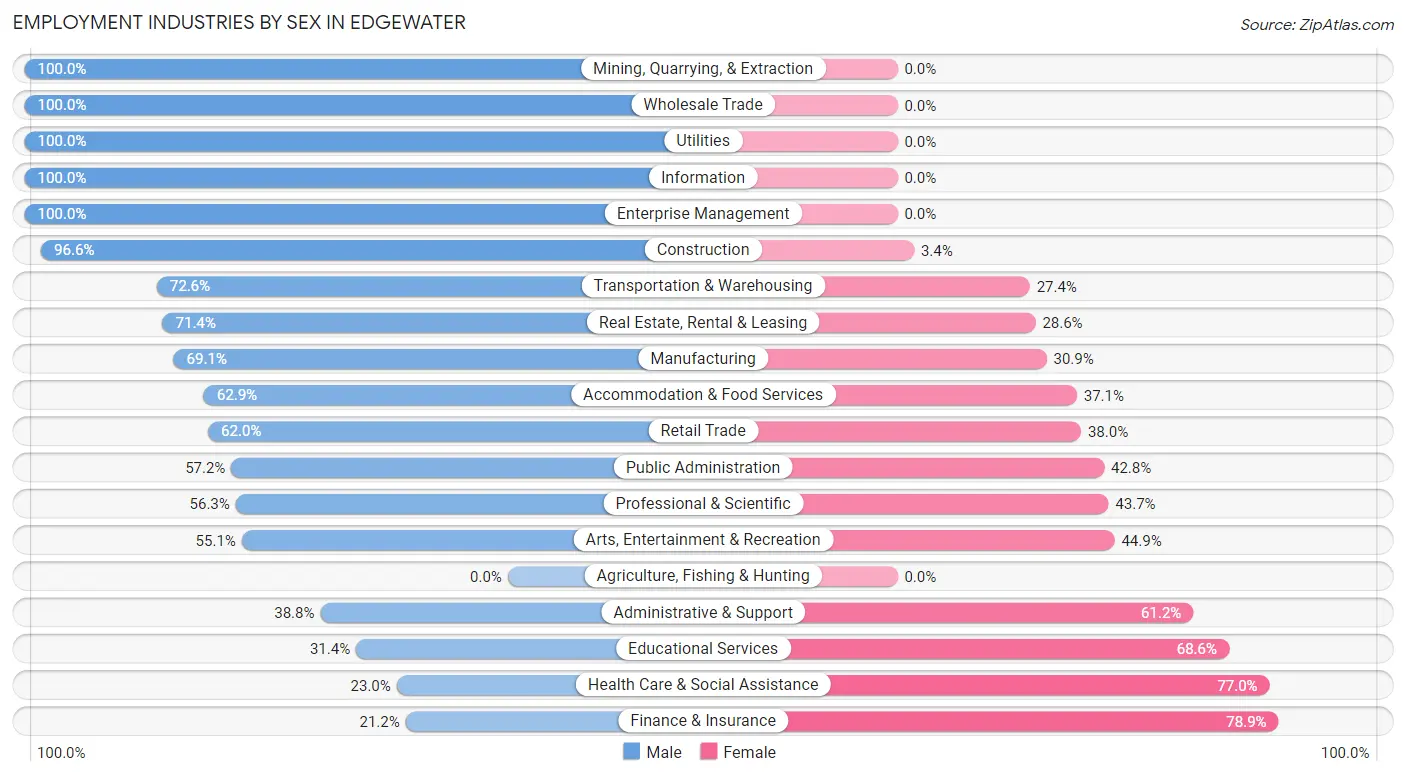
Employment Industries by Sex in Edgewater
The Edgewater industries that see more men than women are Mining, Quarrying, & Extraction (100.0%), Wholesale Trade (100.0%), and Utilities (100.0%), whereas the industries that tend to have a higher number of women are Finance & Insurance (78.8%), Health Care & Social Assistance (77.0%), and Educational Services (68.6%).
| Industry | Male | Female |
| Agriculture, Fishing & Hunting | 0 (0.0%) | 0 (0.0%) |
| Mining, Quarrying, & Extraction | 70 (100.0%) | 0 (0.0%) |
| Construction | 225 (96.6%) | 8 (3.4%) |
| Manufacturing | 121 (69.1%) | 54 (30.9%) |
| Wholesale Trade | 28 (100.0%) | 0 (0.0%) |
| Retail Trade | 377 (62.0%) | 231 (38.0%) |
| Transportation & Warehousing | 61 (72.6%) | 23 (27.4%) |
| Utilities | 35 (100.0%) | 0 (0.0%) |
| Information | 55 (100.0%) | 0 (0.0%) |
| Finance & Insurance | 22 (21.1%) | 82 (78.8%) |
| Real Estate, Rental & Leasing | 70 (71.4%) | 28 (28.6%) |
| Professional & Scientific | 227 (56.3%) | 176 (43.7%) |
| Enterprise Management | 23 (100.0%) | 0 (0.0%) |
| Administrative & Support | 45 (38.8%) | 71 (61.2%) |
| Educational Services | 87 (31.4%) | 190 (68.6%) |
| Health Care & Social Assistance | 118 (23.0%) | 395 (77.0%) |
| Arts, Entertainment & Recreation | 76 (55.1%) | 62 (44.9%) |
| Accommodation & Food Services | 205 (62.9%) | 121 (37.1%) |
| Public Administration | 87 (57.2%) | 65 (42.8%) |
| Total | 2,008 (56.4%) | 1,550 (43.6%) |
Education in Edgewater
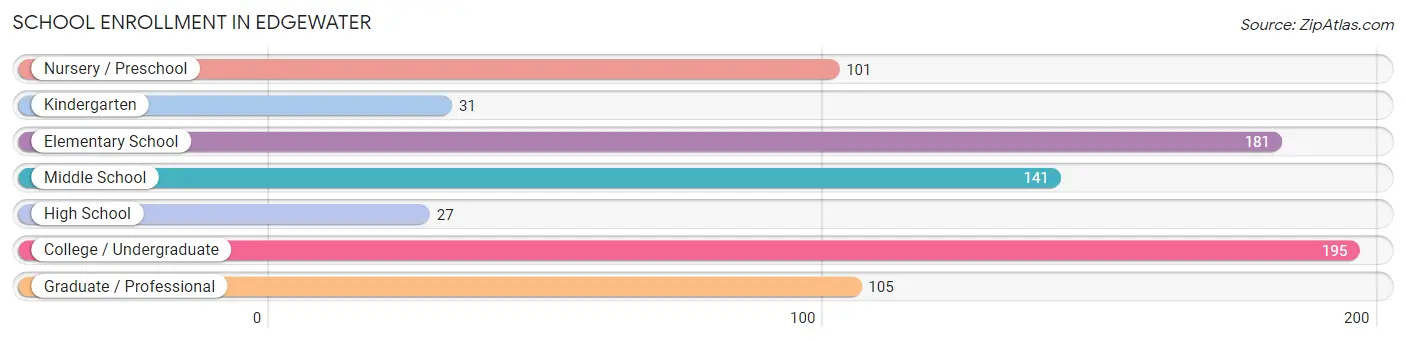
School Enrollment in Edgewater
The most common levels of schooling among the 781 students in Edgewater are college / undergraduate (195 | 25.0%), elementary school (181 | 23.2%), and middle school (141 | 18.0%).
| School Level | # Students | % Students |
| Nursery / Preschool | 101 | 12.9% |
| Kindergarten | 31 | 4.0% |
| Elementary School | 181 | 23.2% |
| Middle School | 141 | 18.0% |
| High School | 27 | 3.5% |
| College / Undergraduate | 195 | 25.0% |
| Graduate / Professional | 105 | 13.4% |
| Total | 781 | 100.0% |
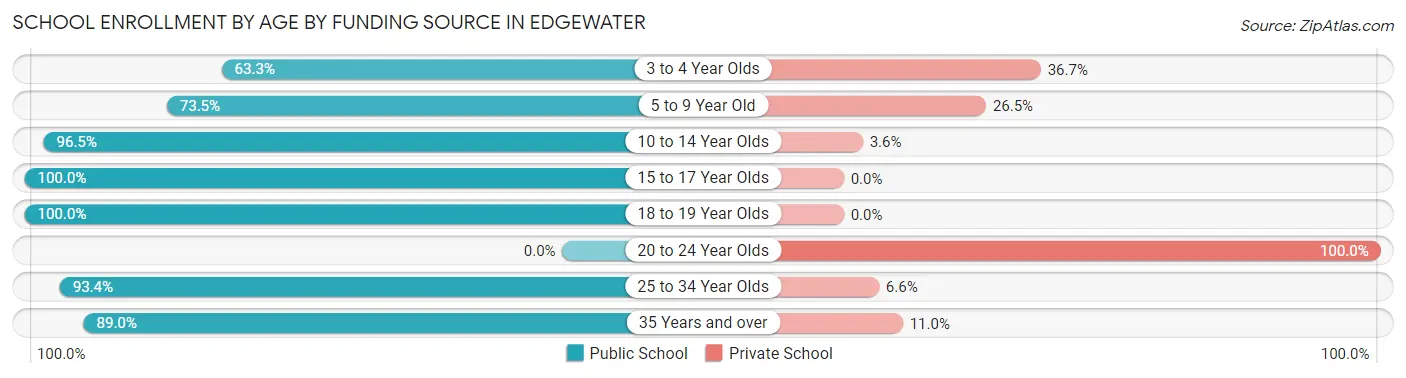
School Enrollment by Age by Funding Source in Edgewater
Out of a total of 781 students who are enrolled in schools in Edgewater, 151 (19.3%) attend a private institution, while the remaining 630 (80.7%) are enrolled in public schools. The age group of 20 to 24 year olds has the highest likelihood of being enrolled in private schools, with 36 (100.0% in the age bracket) enrolled. Conversely, the age group of 15 to 17 year olds has the lowest likelihood of being enrolled in a private school, with 27 (100.0% in the age bracket) attending a public institution.
| Age Bracket | Public School | Private School |
| 3 to 4 Year Olds | 50 (63.3%) | 29 (36.7%) |
| 5 to 9 Year Old | 172 (73.5%) | 62 (26.5%) |
| 10 to 14 Year Olds | 136 (96.5%) | 5 (3.5%) |
| 15 to 17 Year Olds | 27 (100.0%) | 0 (0.0%) |
| 18 to 19 Year Olds | 42 (100.0%) | 0 (0.0%) |
| 20 to 24 Year Olds | 0 (0.0%) | 36 (100.0%) |
| 25 to 34 Year Olds | 114 (93.4%) | 8 (6.6%) |
| 35 Years and over | 89 (89.0%) | 11 (11.0%) |
| Total | 630 (80.7%) | 151 (19.3%) |
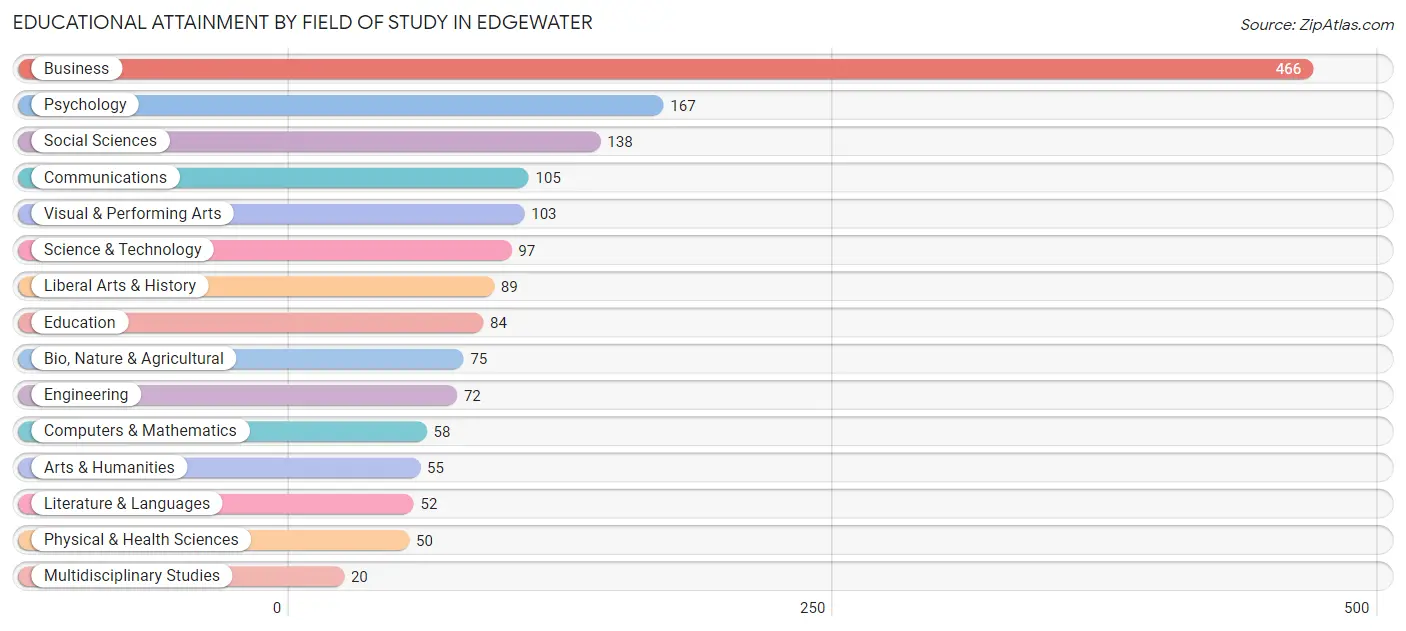
Educational Attainment by Field of Study in Edgewater
Business (466 | 28.6%), psychology (167 | 10.2%), social sciences (138 | 8.5%), communications (105 | 6.4%), and visual & performing arts (103 | 6.3%) are the most common fields of study among 1,631 individuals in Edgewater who have obtained a bachelor's degree or higher.
| Field of Study | # Graduates | % Graduates |
| Computers & Mathematics | 58 | 3.6% |
| Bio, Nature & Agricultural | 75 | 4.6% |
| Physical & Health Sciences | 50 | 3.1% |
| Psychology | 167 | 10.2% |
| Social Sciences | 138 | 8.5% |
| Engineering | 72 | 4.4% |
| Multidisciplinary Studies | 20 | 1.2% |
| Science & Technology | 97 | 5.9% |
| Business | 466 | 28.6% |
| Education | 84 | 5.1% |
| Literature & Languages | 52 | 3.2% |
| Liberal Arts & History | 89 | 5.5% |
| Visual & Performing Arts | 103 | 6.3% |
| Communications | 105 | 6.4% |
| Arts & Humanities | 55 | 3.4% |
| Total | 1,631 | 100.0% |
Transportation & Commute in Edgewater
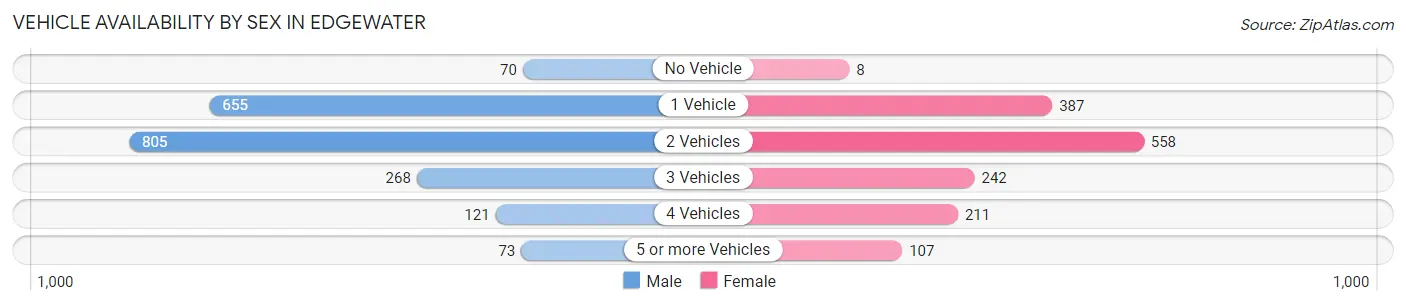
Vehicle Availability by Sex in Edgewater
The most prevalent vehicle ownership categories in Edgewater are males with 2 vehicles (805, accounting for 40.4%) and females with 2 vehicles (558, making up 53.2%).
| Vehicles Available | Male | Female |
| No Vehicle | 70 (3.5%) | 8 (0.5%) |
| 1 Vehicle | 655 (32.9%) | 387 (25.6%) |
| 2 Vehicles | 805 (40.4%) | 558 (36.9%) |
| 3 Vehicles | 268 (13.5%) | 242 (16.0%) |
| 4 Vehicles | 121 (6.1%) | 211 (14.0%) |
| 5 or more Vehicles | 73 (3.7%) | 107 (7.1%) |
| Total | 1,992 (100.0%) | 1,513 (100.0%) |
Commute Time in Edgewater
The most frequently occuring commute durations in Edgewater are 30 to 34 minutes (576 commuters, 19.7%), 15 to 19 minutes (563 commuters, 19.2%), and 10 to 14 minutes (427 commuters, 14.6%).
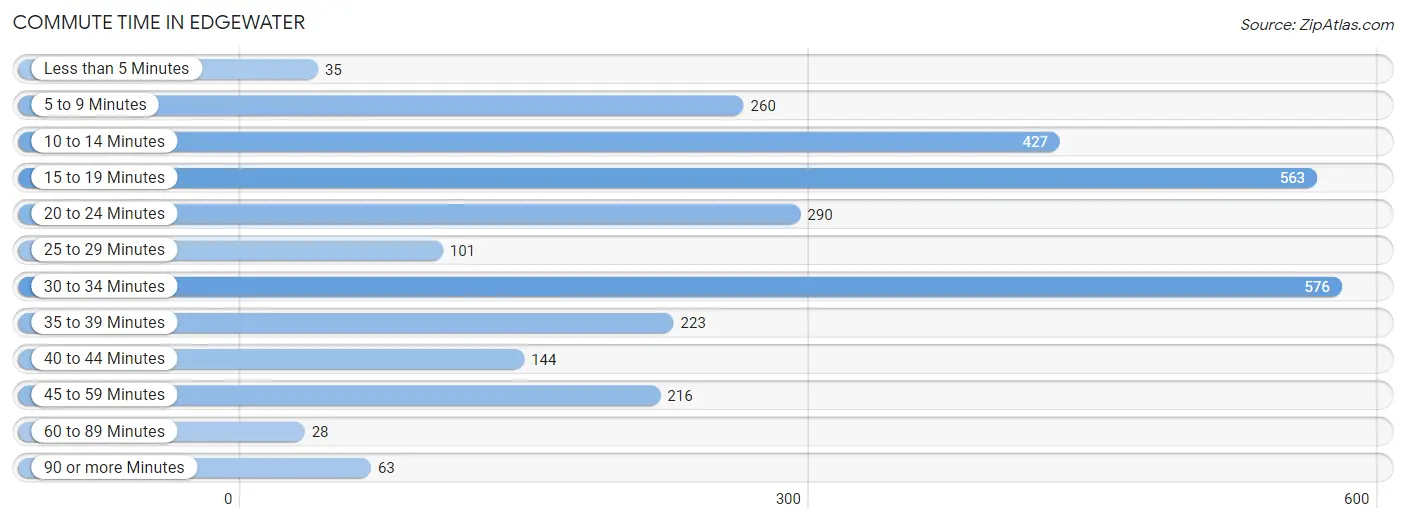
| Commute Time | # Commuters | % Commuters |
| Less than 5 Minutes | 35 | 1.2% |
| 5 to 9 Minutes | 260 | 8.9% |
| 10 to 14 Minutes | 427 | 14.6% |
| 15 to 19 Minutes | 563 | 19.2% |
| 20 to 24 Minutes | 290 | 9.9% |
| 25 to 29 Minutes | 101 | 3.5% |
| 30 to 34 Minutes | 576 | 19.7% |
| 35 to 39 Minutes | 223 | 7.6% |
| 40 to 44 Minutes | 144 | 4.9% |
| 45 to 59 Minutes | 216 | 7.4% |
| 60 to 89 Minutes | 28 | 1.0% |
| 90 or more Minutes | 63 | 2.1% |
Commute Time by Sex in Edgewater
The most common commute times in Edgewater are 30 to 34 minutes (394 commuters, 23.2%) for males and 15 to 19 minutes (254 commuters, 20.7%) for females.
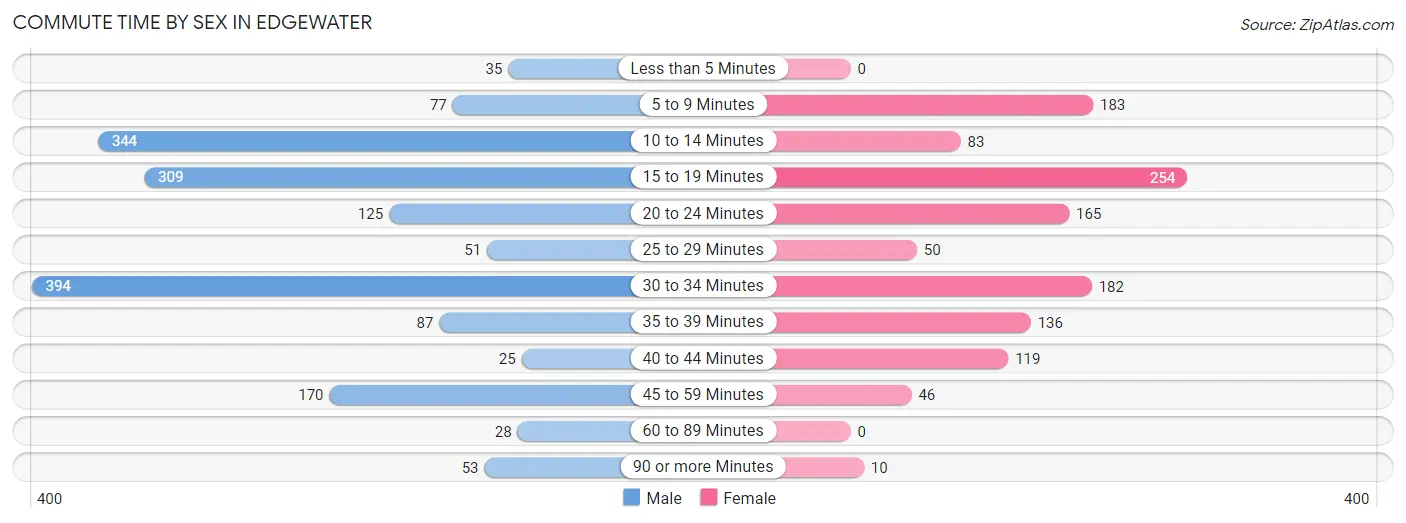
| Commute Time | Male | Female |
| Less than 5 Minutes | 35 (2.1%) | 0 (0.0%) |
| 5 to 9 Minutes | 77 (4.5%) | 183 (14.9%) |
| 10 to 14 Minutes | 344 (20.3%) | 83 (6.8%) |
| 15 to 19 Minutes | 309 (18.2%) | 254 (20.7%) |
| 20 to 24 Minutes | 125 (7.4%) | 165 (13.4%) |
| 25 to 29 Minutes | 51 (3.0%) | 50 (4.1%) |
| 30 to 34 Minutes | 394 (23.2%) | 182 (14.8%) |
| 35 to 39 Minutes | 87 (5.1%) | 136 (11.1%) |
| 40 to 44 Minutes | 25 (1.5%) | 119 (9.7%) |
| 45 to 59 Minutes | 170 (10.0%) | 46 (3.7%) |
| 60 to 89 Minutes | 28 (1.7%) | 0 (0.0%) |
| 90 or more Minutes | 53 (3.1%) | 10 (0.8%) |
Time of Departure to Work by Sex in Edgewater
The most frequent times of departure to work in Edgewater are 6:00 AM to 6:29 AM (257, 15.1%) for males and 7:00 AM to 7:29 AM (284, 23.1%) for females.
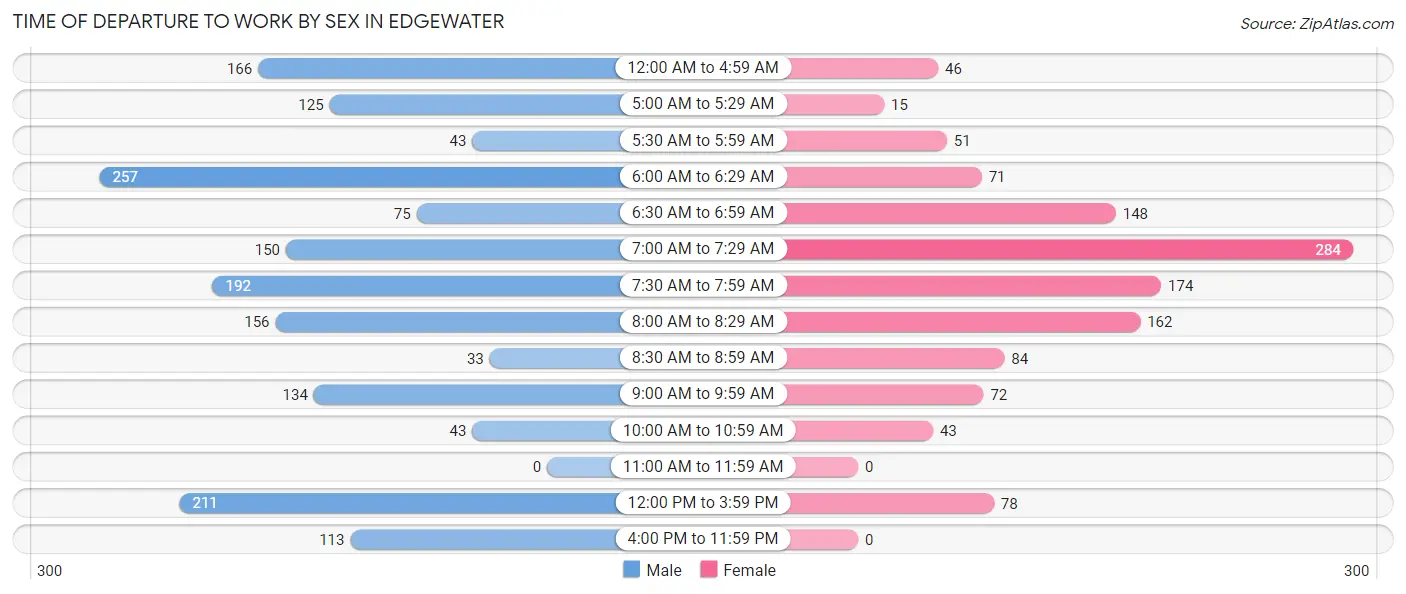
| Time of Departure | Male | Female |
| 12:00 AM to 4:59 AM | 166 (9.8%) | 46 (3.7%) |
| 5:00 AM to 5:29 AM | 125 (7.4%) | 15 (1.2%) |
| 5:30 AM to 5:59 AM | 43 (2.5%) | 51 (4.2%) |
| 6:00 AM to 6:29 AM | 257 (15.1%) | 71 (5.8%) |
| 6:30 AM to 6:59 AM | 75 (4.4%) | 148 (12.0%) |
| 7:00 AM to 7:29 AM | 150 (8.8%) | 284 (23.1%) |
| 7:30 AM to 7:59 AM | 192 (11.3%) | 174 (14.2%) |
| 8:00 AM to 8:29 AM | 156 (9.2%) | 162 (13.2%) |
| 8:30 AM to 8:59 AM | 33 (1.9%) | 84 (6.8%) |
| 9:00 AM to 9:59 AM | 134 (7.9%) | 72 (5.9%) |
| 10:00 AM to 10:59 AM | 43 (2.5%) | 43 (3.5%) |
| 11:00 AM to 11:59 AM | 0 (0.0%) | 0 (0.0%) |
| 12:00 PM to 3:59 PM | 211 (12.4%) | 78 (6.4%) |
| 4:00 PM to 11:59 PM | 113 (6.7%) | 0 (0.0%) |
| Total | 1,698 (100.0%) | 1,228 (100.0%) |
Housing Occupancy in Edgewater
Occupancy by Ownership in Edgewater
Of the total 2,218 dwellings in Edgewater, owner-occupied units account for 773 (34.8%), while renter-occupied units make up 1,445 (65.1%).
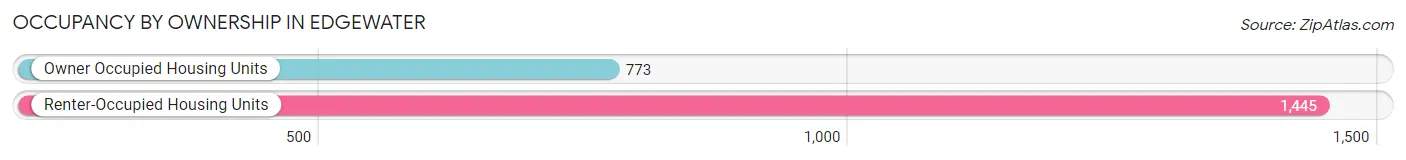
| Occupancy | # Housing Units | % Housing Units |
| Owner Occupied Housing Units | 773 | 34.8% |
| Renter-Occupied Housing Units | 1,445 | 65.1% |
| Total Occupied Housing Units | 2,218 | 100.0% |
Occupancy by Household Size in Edgewater
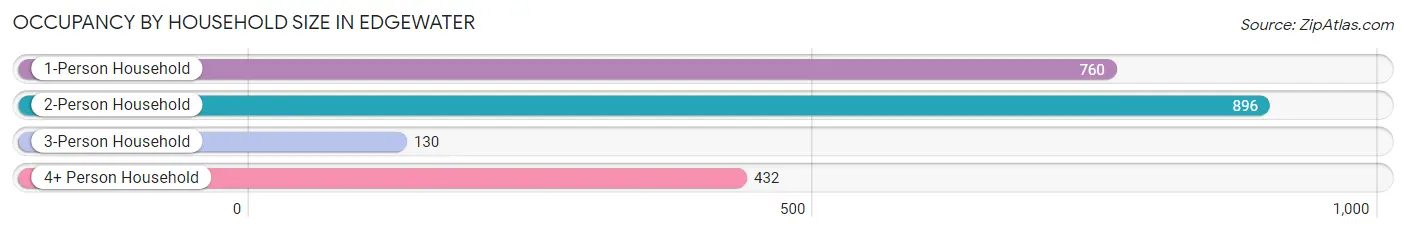
| Household Size | # Housing Units | % Housing Units |
| 1-Person Household | 760 | 34.3% |
| 2-Person Household | 896 | 40.4% |
| 3-Person Household | 130 | 5.9% |
| 4+ Person Household | 432 | 19.5% |
| Total Housing Units | 2,218 | 100.0% |
Occupancy by Ownership by Household Size in Edgewater
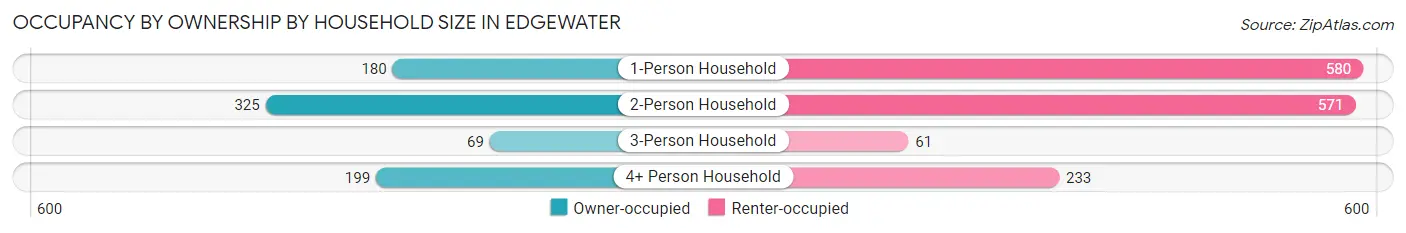
| Household Size | Owner-occupied | Renter-occupied |
| 1-Person Household | 180 (23.7%) | 580 (76.3%) |
| 2-Person Household | 325 (36.3%) | 571 (63.7%) |
| 3-Person Household | 69 (53.1%) | 61 (46.9%) |
| 4+ Person Household | 199 (46.1%) | 233 (53.9%) |
| Total Housing Units | 773 (34.8%) | 1,445 (65.1%) |
Occupancy by Educational Attainment in Edgewater
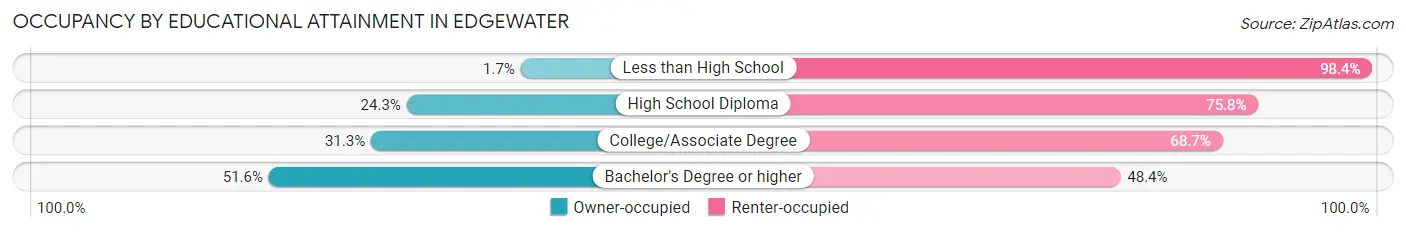
| Household Size | Owner-occupied | Renter-occupied |
| Less than High School | 4 (1.7%) | 238 (98.4%) |
| High School Diploma | 97 (24.2%) | 303 (75.7%) |
| College/Associate Degree | 218 (31.3%) | 478 (68.7%) |
| Bachelor's Degree or higher | 454 (51.6%) | 426 (48.4%) |
Occupancy by Age of Householder in Edgewater
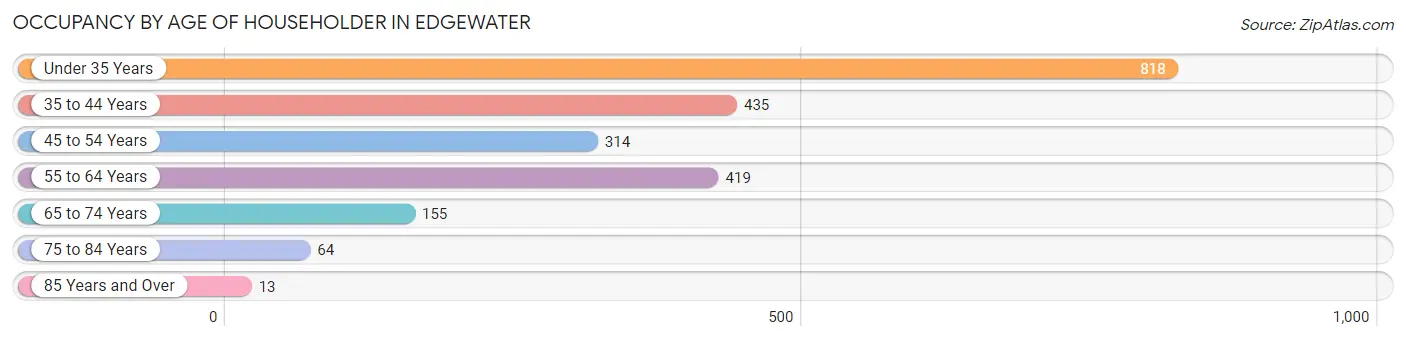
| Age Bracket | # Households | % Households |
| Under 35 Years | 818 | 36.9% |
| 35 to 44 Years | 435 | 19.6% |
| 45 to 54 Years | 314 | 14.2% |
| 55 to 64 Years | 419 | 18.9% |
| 65 to 74 Years | 155 | 7.0% |
| 75 to 84 Years | 64 | 2.9% |
| 85 Years and Over | 13 | 0.6% |
| Total | 2,218 | 100.0% |
Housing Finances in Edgewater
Median Income by Occupancy in Edgewater
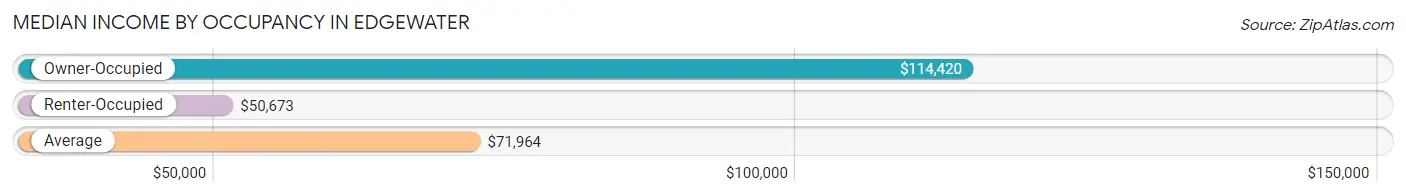
| Occupancy Type | # Households | Median Income |
| Owner-Occupied | 773 (34.8%) | $114,420 |
| Renter-Occupied | 1,445 (65.1%) | $50,673 |
| Average | 2,218 (100.0%) | $71,964 |
Occupancy by Householder Income Bracket in Edgewater
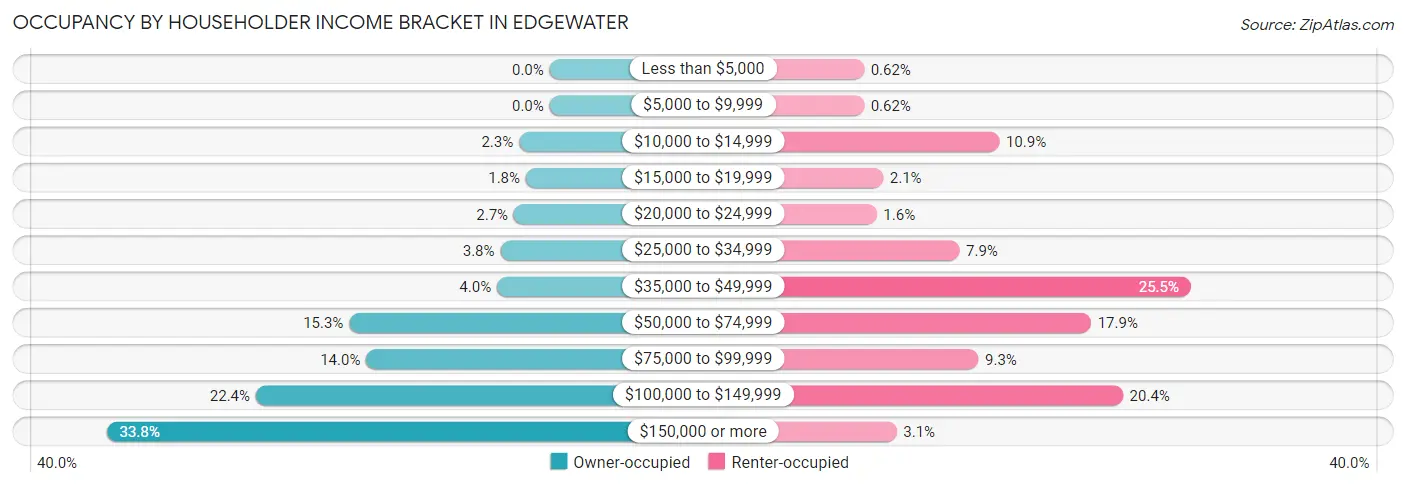
| Income Bracket | Owner-occupied | Renter-occupied |
| Less than $5,000 | 0 (0.0%) | 9 (0.6%) |
| $5,000 to $9,999 | 0 (0.0%) | 9 (0.6%) |
| $10,000 to $14,999 | 18 (2.3%) | 158 (10.9%) |
| $15,000 to $19,999 | 14 (1.8%) | 30 (2.1%) |
| $20,000 to $24,999 | 21 (2.7%) | 23 (1.6%) |
| $25,000 to $34,999 | 29 (3.7%) | 114 (7.9%) |
| $35,000 to $49,999 | 31 (4.0%) | 369 (25.5%) |
| $50,000 to $74,999 | 118 (15.3%) | 259 (17.9%) |
| $75,000 to $99,999 | 108 (14.0%) | 135 (9.3%) |
| $100,000 to $149,999 | 173 (22.4%) | 294 (20.3%) |
| $150,000 or more | 261 (33.8%) | 45 (3.1%) |
| Total | 773 (100.0%) | 1,445 (100.0%) |
Monthly Housing Cost Tiers in Edgewater
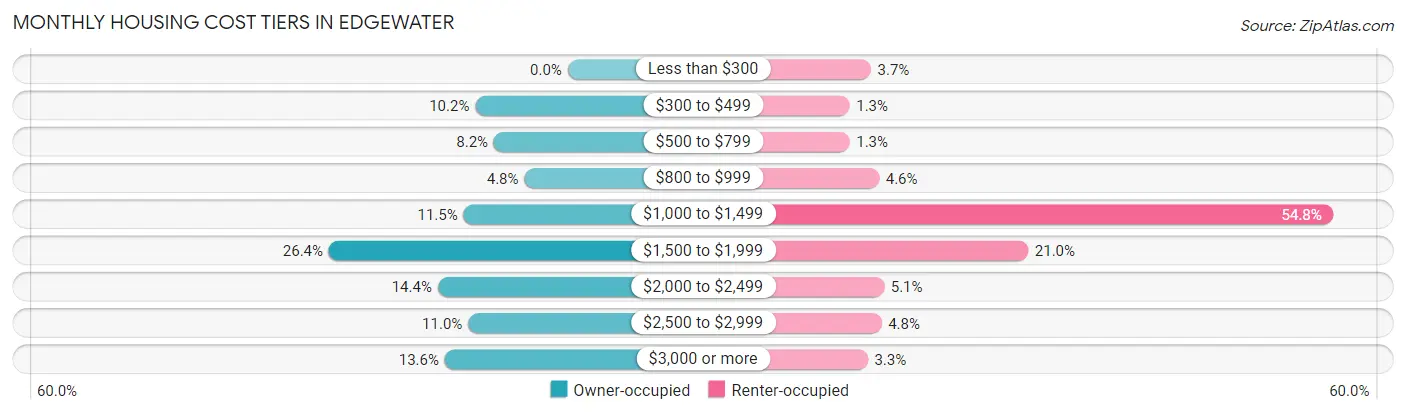
| Monthly Cost | Owner-occupied | Renter-occupied |
| Less than $300 | 0 (0.0%) | 53 (3.7%) |
| $300 to $499 | 79 (10.2%) | 19 (1.3%) |
| $500 to $799 | 63 (8.2%) | 19 (1.3%) |
| $800 to $999 | 37 (4.8%) | 66 (4.6%) |
| $1,000 to $1,499 | 89 (11.5%) | 792 (54.8%) |
| $1,500 to $1,999 | 204 (26.4%) | 304 (21.0%) |
| $2,000 to $2,499 | 111 (14.4%) | 74 (5.1%) |
| $2,500 to $2,999 | 85 (11.0%) | 70 (4.8%) |
| $3,000 or more | 105 (13.6%) | 48 (3.3%) |
| Total | 773 (100.0%) | 1,445 (100.0%) |
Physical Housing Characteristics in Edgewater
Housing Structures in Edgewater
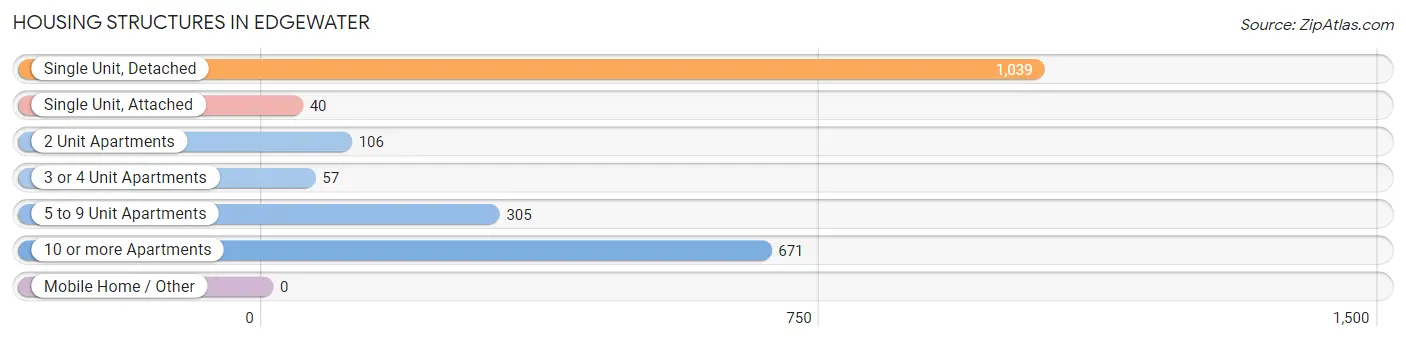
| Structure Type | # Housing Units | % Housing Units |
| Single Unit, Detached | 1,039 | 46.8% |
| Single Unit, Attached | 40 | 1.8% |
| 2 Unit Apartments | 106 | 4.8% |
| 3 or 4 Unit Apartments | 57 | 2.6% |
| 5 to 9 Unit Apartments | 305 | 13.8% |
| 10 or more Apartments | 671 | 30.2% |
| Mobile Home / Other | 0 | 0.0% |
| Total | 2,218 | 100.0% |
Housing Structures by Occupancy in Edgewater
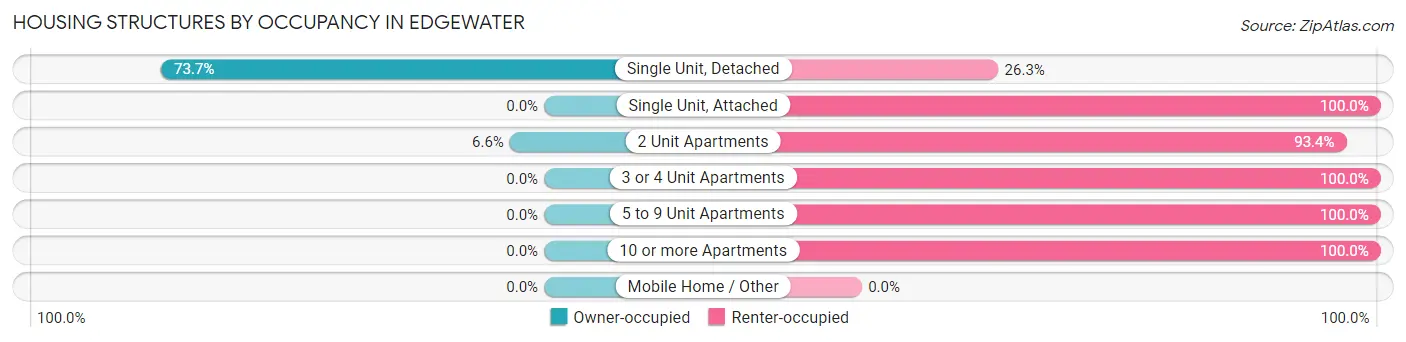
| Structure Type | Owner-occupied | Renter-occupied |
| Single Unit, Detached | 766 (73.7%) | 273 (26.3%) |
| Single Unit, Attached | 0 (0.0%) | 40 (100.0%) |
| 2 Unit Apartments | 7 (6.6%) | 99 (93.4%) |
| 3 or 4 Unit Apartments | 0 (0.0%) | 57 (100.0%) |
| 5 to 9 Unit Apartments | 0 (0.0%) | 305 (100.0%) |
| 10 or more Apartments | 0 (0.0%) | 671 (100.0%) |
| Mobile Home / Other | 0 (0.0%) | 0 (0.0%) |
| Total | 773 (34.8%) | 1,445 (65.1%) |
Housing Structures by Number of Rooms in Edgewater
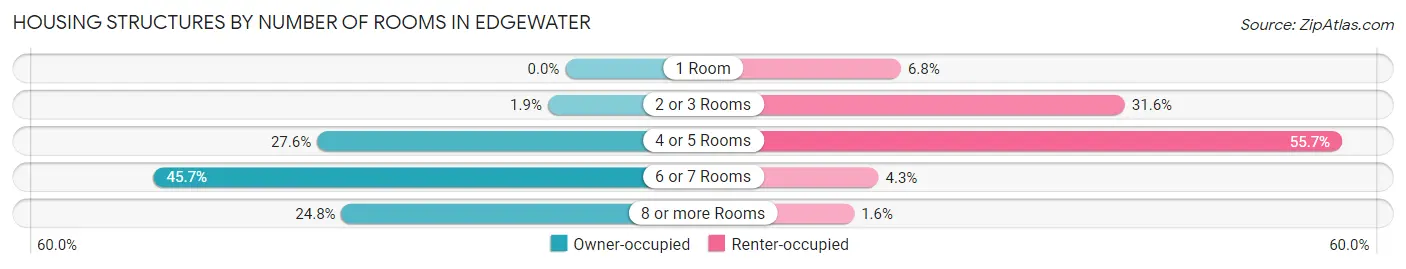
| Number of Rooms | Owner-occupied | Renter-occupied |
| 1 Room | 0 (0.0%) | 98 (6.8%) |
| 2 or 3 Rooms | 15 (1.9%) | 457 (31.6%) |
| 4 or 5 Rooms | 213 (27.6%) | 805 (55.7%) |
| 6 or 7 Rooms | 353 (45.7%) | 62 (4.3%) |
| 8 or more Rooms | 192 (24.8%) | 23 (1.6%) |
| Total | 773 (100.0%) | 1,445 (100.0%) |
Housing Structure by Heating Type in Edgewater
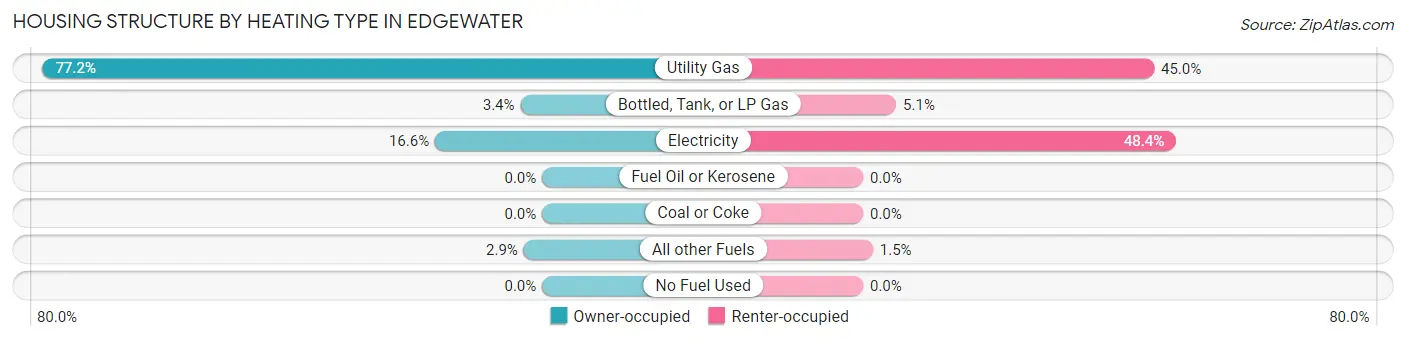
| Heating Type | Owner-occupied | Renter-occupied |
| Utility Gas | 597 (77.2%) | 650 (45.0%) |
| Bottled, Tank, or LP Gas | 26 (3.4%) | 74 (5.1%) |
| Electricity | 128 (16.6%) | 699 (48.4%) |
| Fuel Oil or Kerosene | 0 (0.0%) | 0 (0.0%) |
| Coal or Coke | 0 (0.0%) | 0 (0.0%) |
| All other Fuels | 22 (2.9%) | 22 (1.5%) |
| No Fuel Used | 0 (0.0%) | 0 (0.0%) |
| Total | 773 (100.0%) | 1,445 (100.0%) |
Household Vehicle Usage in Edgewater
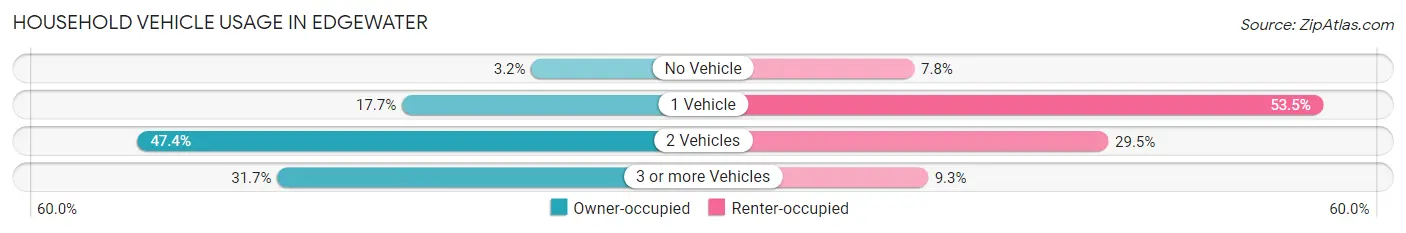
| Vehicles per Household | Owner-occupied | Renter-occupied |
| No Vehicle | 25 (3.2%) | 112 (7.7%) |
| 1 Vehicle | 137 (17.7%) | 773 (53.5%) |
| 2 Vehicles | 366 (47.3%) | 426 (29.5%) |
| 3 or more Vehicles | 245 (31.7%) | 134 (9.3%) |
| Total | 773 (100.0%) | 1,445 (100.0%) |
Real Estate & Mortgages in Edgewater
Real Estate and Mortgage Overview in Edgewater
| Characteristic | Without Mortgage | With Mortgage |
| Housing Units | 159 | 614 |
| Median Property Value | $449,200 | $598,900 |
| Median Household Income | $63,092 | $243 |
| Monthly Housing Costs | $501 | $105 |
| Real Estate Taxes | $2,325 | $18 |
Property Value by Mortgage Status in Edgewater
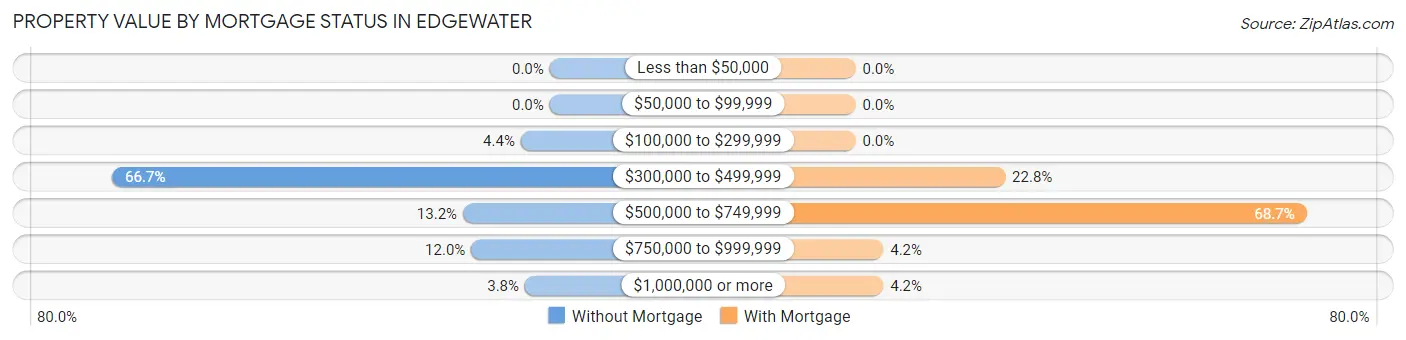
| Property Value | Without Mortgage | With Mortgage |
| Less than $50,000 | 0 (0.0%) | 0 (0.0%) |
| $50,000 to $99,999 | 0 (0.0%) | 0 (0.0%) |
| $100,000 to $299,999 | 7 (4.4%) | 0 (0.0%) |
| $300,000 to $499,999 | 106 (66.7%) | 140 (22.8%) |
| $500,000 to $749,999 | 21 (13.2%) | 422 (68.7%) |
| $750,000 to $999,999 | 19 (11.9%) | 26 (4.2%) |
| $1,000,000 or more | 6 (3.8%) | 26 (4.2%) |
| Total | 159 (100.0%) | 614 (100.0%) |
Household Income by Mortgage Status in Edgewater
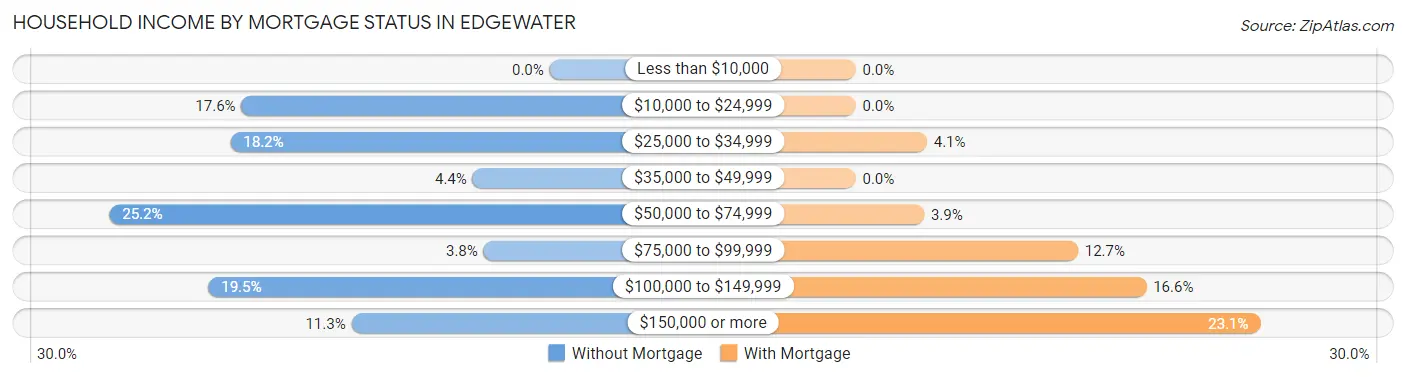
| Household Income | Without Mortgage | With Mortgage |
| Less than $10,000 | 0 (0.0%) | 0 (0.0%) |
| $10,000 to $24,999 | 28 (17.6%) | 0 (0.0%) |
| $25,000 to $34,999 | 29 (18.2%) | 25 (4.1%) |
| $35,000 to $49,999 | 7 (4.4%) | 0 (0.0%) |
| $50,000 to $74,999 | 40 (25.2%) | 24 (3.9%) |
| $75,000 to $99,999 | 6 (3.8%) | 78 (12.7%) |
| $100,000 to $149,999 | 31 (19.5%) | 102 (16.6%) |
| $150,000 or more | 18 (11.3%) | 142 (23.1%) |
| Total | 159 (100.0%) | 614 (100.0%) |
Property Value to Household Income Ratio in Edgewater
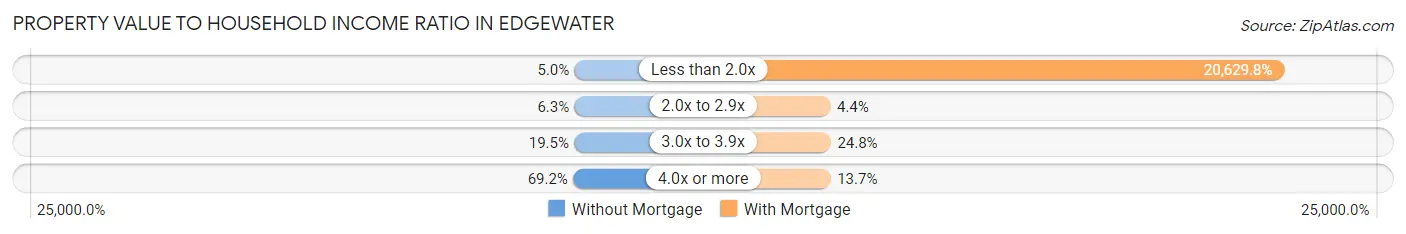
| Value-to-Income Ratio | Without Mortgage | With Mortgage |
| Less than 2.0x | 8 (5.0%) | 126,667 (20,629.8%) |
| 2.0x to 2.9x | 10 (6.3%) | 27 (4.4%) |
| 3.0x to 3.9x | 31 (19.5%) | 152 (24.8%) |
| 4.0x or more | 110 (69.2%) | 84 (13.7%) |
| Total | 159 (100.0%) | 614 (100.0%) |
Real Estate Taxes by Mortgage Status in Edgewater
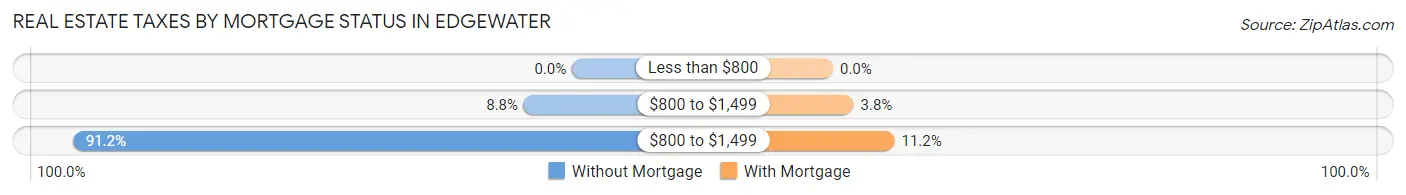
| Property Taxes | Without Mortgage | With Mortgage |
| Less than $800 | 0 (0.0%) | 0 (0.0%) |
| $800 to $1,499 | 14 (8.8%) | 23 (3.7%) |
| $800 to $1,499 | 145 (91.2%) | 69 (11.2%) |
| Total | 159 (100.0%) | 614 (100.0%) |
Health & Disability in Edgewater
Health Insurance Coverage by Age in Edgewater
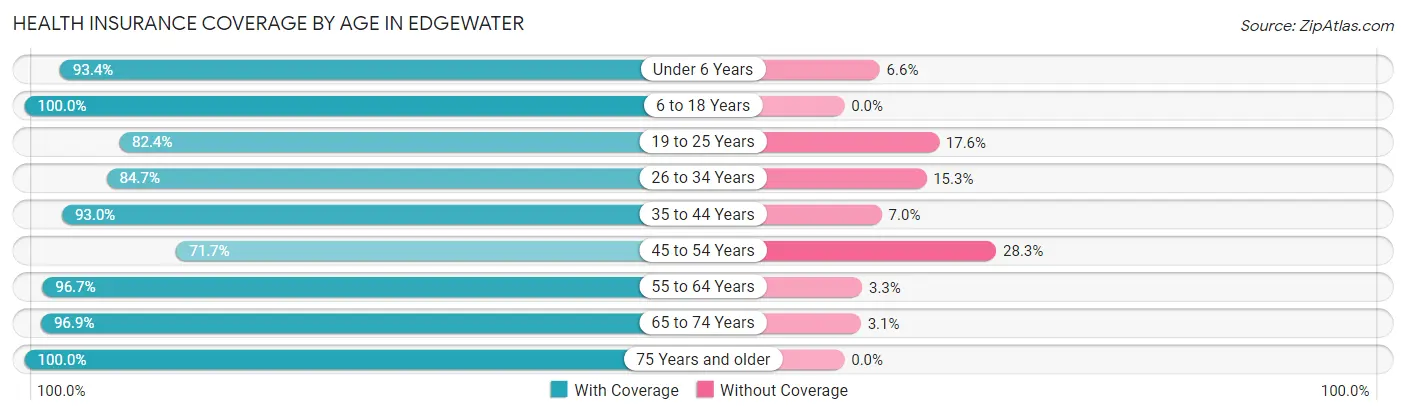
| Age Bracket | With Coverage | Without Coverage |
| Under 6 Years | 312 (93.4%) | 22 (6.6%) |
| 6 to 18 Years | 371 (100.0%) | 0 (0.0%) |
| 19 to 25 Years | 486 (82.4%) | 104 (17.6%) |
| 26 to 34 Years | 1,231 (84.7%) | 222 (15.3%) |
| 35 to 44 Years | 935 (93.0%) | 70 (7.0%) |
| 45 to 54 Years | 319 (71.7%) | 126 (28.3%) |
| 55 to 64 Years | 497 (96.7%) | 17 (3.3%) |
| 65 to 74 Years | 190 (96.9%) | 6 (3.1%) |
| 75 Years and older | 94 (100.0%) | 0 (0.0%) |
| Total | 4,435 (88.7%) | 567 (11.3%) |
Health Insurance Coverage by Citizenship Status in Edgewater
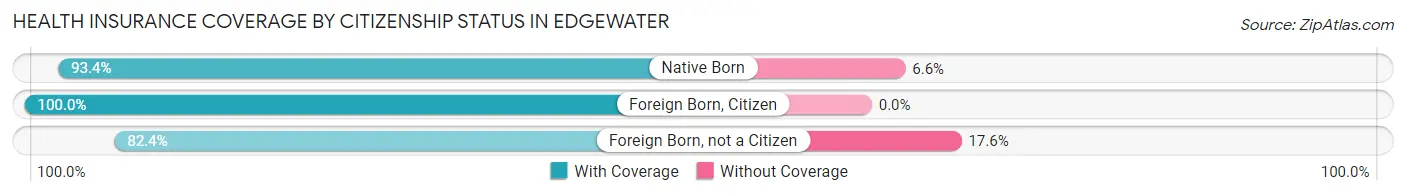
| Citizenship Status | With Coverage | Without Coverage |
| Native Born | 312 (93.4%) | 22 (6.6%) |
| Foreign Born, Citizen | 371 (100.0%) | 0 (0.0%) |
| Foreign Born, not a Citizen | 486 (82.4%) | 104 (17.6%) |
Health Insurance Coverage by Household Income in Edgewater
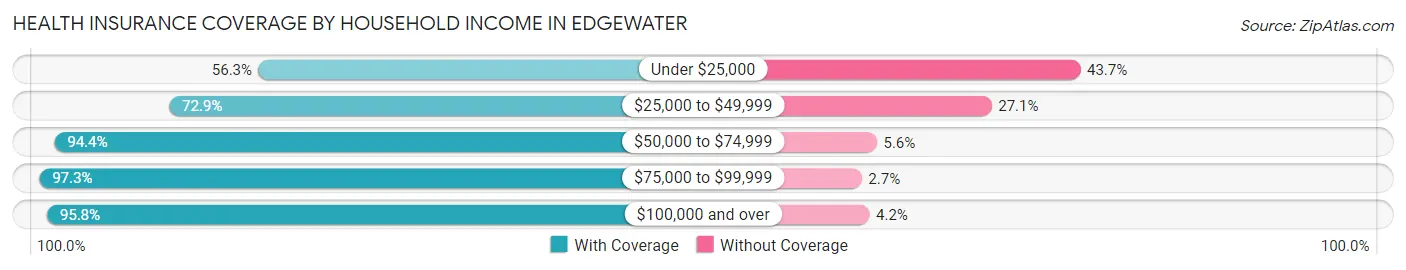
| Household Income | With Coverage | Without Coverage |
| Under $25,000 | 210 (56.3%) | 163 (43.7%) |
| $25,000 to $49,999 | 660 (72.9%) | 245 (27.1%) |
| $50,000 to $74,999 | 898 (94.4%) | 53 (5.6%) |
| $75,000 to $99,999 | 674 (97.3%) | 19 (2.7%) |
| $100,000 and over | 1,993 (95.8%) | 87 (4.2%) |
Public vs Private Health Insurance Coverage by Age in Edgewater
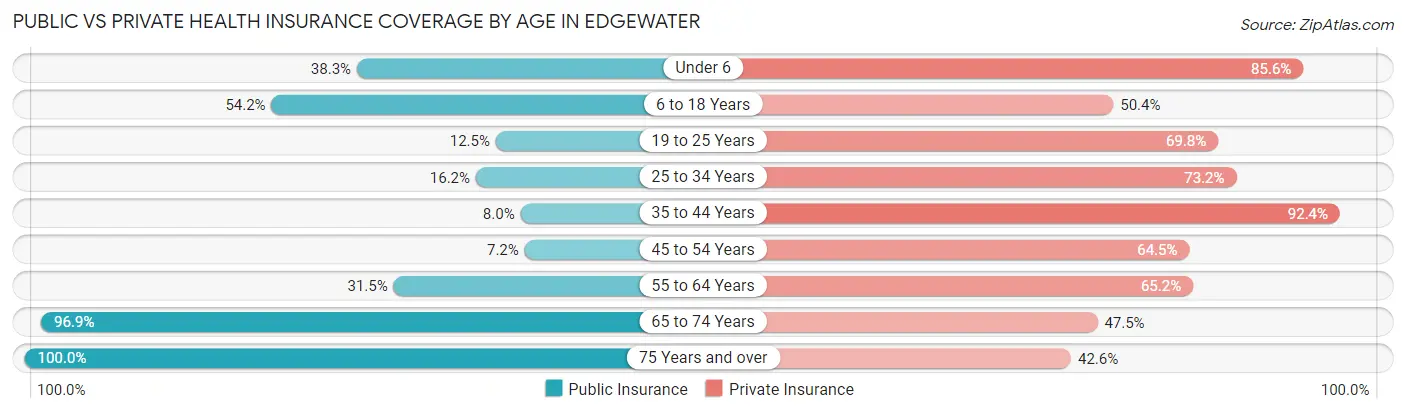
| Age Bracket | Public Insurance | Private Insurance |
| Under 6 | 128 (38.3%) | 286 (85.6%) |
| 6 to 18 Years | 201 (54.2%) | 187 (50.4%) |
| 19 to 25 Years | 74 (12.5%) | 412 (69.8%) |
| 25 to 34 Years | 236 (16.2%) | 1,064 (73.2%) |
| 35 to 44 Years | 80 (8.0%) | 929 (92.4%) |
| 45 to 54 Years | 32 (7.2%) | 287 (64.5%) |
| 55 to 64 Years | 162 (31.5%) | 335 (65.2%) |
| 65 to 74 Years | 190 (96.9%) | 93 (47.4%) |
| 75 Years and over | 94 (100.0%) | 40 (42.5%) |
| Total | 1,197 (23.9%) | 3,633 (72.6%) |
Disability Status by Sex by Age in Edgewater
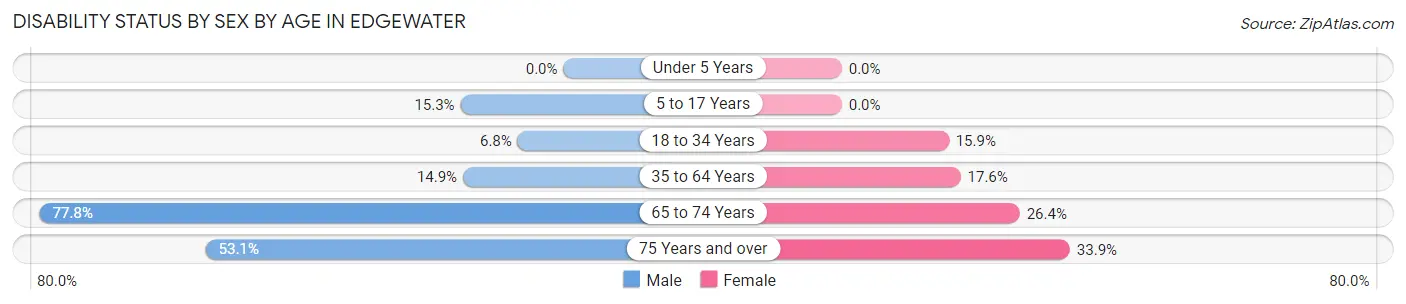
| Age Bracket | Male | Female |
| Under 5 Years | 0 (0.0%) | 0 (0.0%) |
| 5 to 17 Years | 33 (15.3%) | 0 (0.0%) |
| 18 to 34 Years | 84 (6.8%) | 128 (15.9%) |
| 35 to 64 Years | 150 (14.9%) | 169 (17.6%) |
| 65 to 74 Years | 70 (77.8%) | 28 (26.4%) |
| 75 Years and over | 17 (53.1%) | 21 (33.9%) |
Disability Class by Sex by Age in Edgewater
Disability Class: Hearing Difficulty
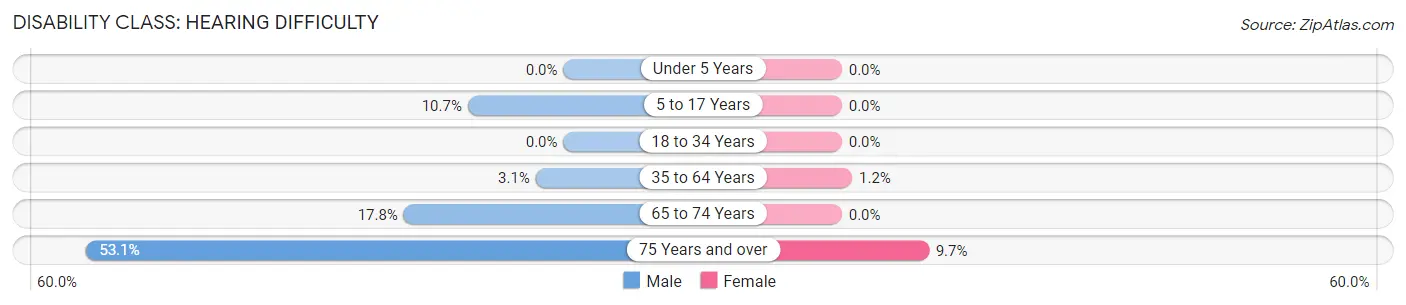
| Age Bracket | Male | Female |
| Under 5 Years | 0 (0.0%) | 0 (0.0%) |
| 5 to 17 Years | 23 (10.6%) | 0 (0.0%) |
| 18 to 34 Years | 0 (0.0%) | 0 (0.0%) |
| 35 to 64 Years | 31 (3.1%) | 11 (1.1%) |
| 65 to 74 Years | 16 (17.8%) | 0 (0.0%) |
| 75 Years and over | 17 (53.1%) | 6 (9.7%) |
Disability Class: Vision Difficulty
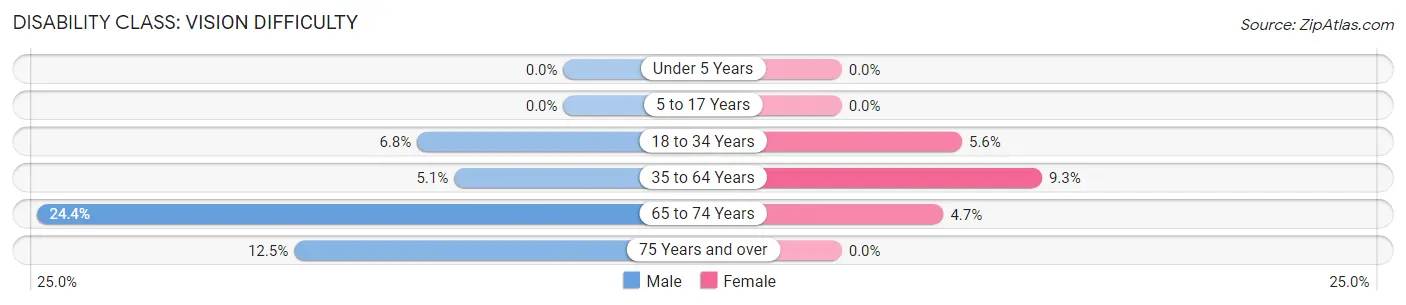
| Age Bracket | Male | Female |
| Under 5 Years | 0 (0.0%) | 0 (0.0%) |
| 5 to 17 Years | 0 (0.0%) | 0 (0.0%) |
| 18 to 34 Years | 84 (6.8%) | 45 (5.6%) |
| 35 to 64 Years | 51 (5.1%) | 89 (9.3%) |
| 65 to 74 Years | 22 (24.4%) | 5 (4.7%) |
| 75 Years and over | 4 (12.5%) | 0 (0.0%) |
Disability Class: Cognitive Difficulty
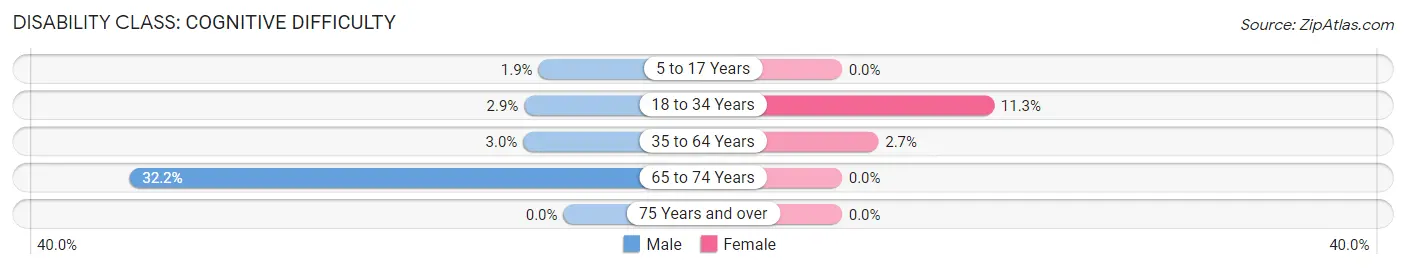
| Age Bracket | Male | Female |
| 5 to 17 Years | 4 (1.8%) | 0 (0.0%) |
| 18 to 34 Years | 36 (2.9%) | 91 (11.3%) |
| 35 to 64 Years | 30 (3.0%) | 26 (2.7%) |
| 65 to 74 Years | 29 (32.2%) | 0 (0.0%) |
| 75 Years and over | 0 (0.0%) | 0 (0.0%) |
Disability Class: Ambulatory Difficulty
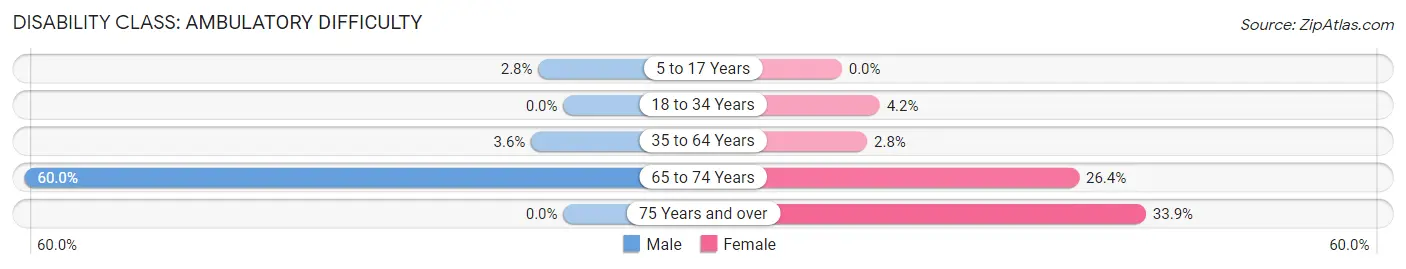
| Age Bracket | Male | Female |
| 5 to 17 Years | 6 (2.8%) | 0 (0.0%) |
| 18 to 34 Years | 0 (0.0%) | 34 (4.2%) |
| 35 to 64 Years | 36 (3.6%) | 27 (2.8%) |
| 65 to 74 Years | 54 (60.0%) | 28 (26.4%) |
| 75 Years and over | 0 (0.0%) | 21 (33.9%) |
Disability Class: Self-Care Difficulty
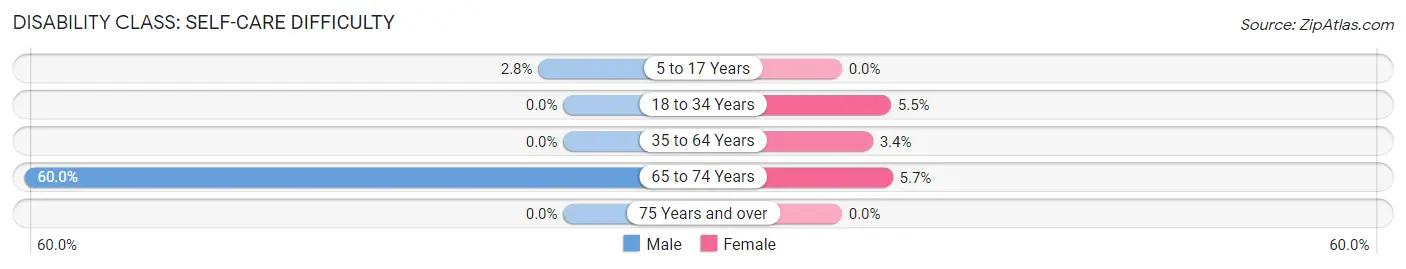
| Age Bracket | Male | Female |
| 5 to 17 Years | 6 (2.8%) | 0 (0.0%) |
| 18 to 34 Years | 0 (0.0%) | 44 (5.5%) |
| 35 to 64 Years | 0 (0.0%) | 33 (3.4%) |
| 65 to 74 Years | 54 (60.0%) | 6 (5.7%) |
| 75 Years and over | 0 (0.0%) | 0 (0.0%) |
Technology Access in Edgewater
Computing Device Access in Edgewater
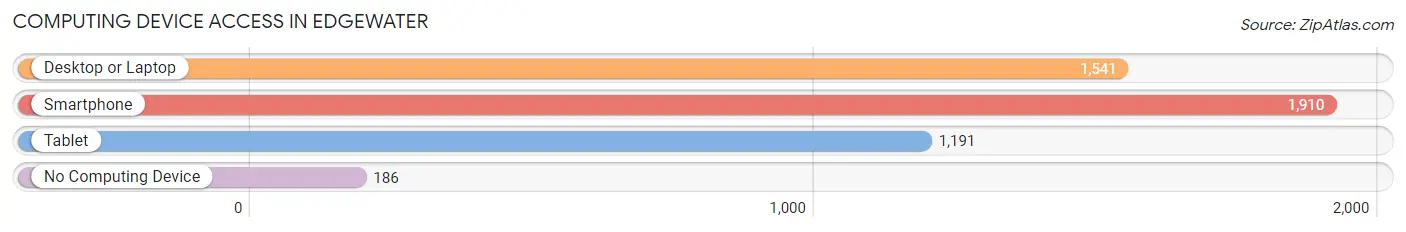
| Device Type | # Households | % Households |
| Desktop or Laptop | 1,541 | 69.5% |
| Smartphone | 1,910 | 86.1% |
| Tablet | 1,191 | 53.7% |
| No Computing Device | 186 | 8.4% |
| Total | 2,218 | 100.0% |
Internet Access in Edgewater
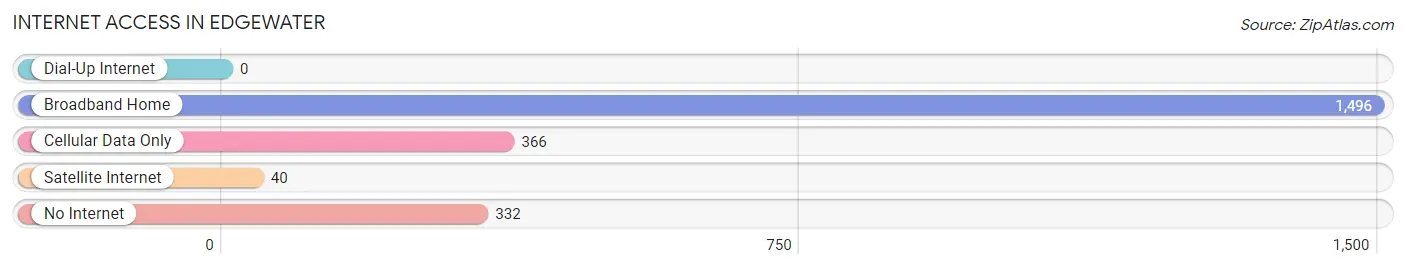
| Internet Type | # Households | % Households |
| Dial-Up Internet | 0 | 0.0% |
| Broadband Home | 1,496 | 67.4% |
| Cellular Data Only | 366 | 16.5% |
| Satellite Internet | 40 | 1.8% |
| No Internet | 332 | 15.0% |
| Total | 2,218 | 100.0% |
Edgewater Summary
Edgewater, Colorado is a small city located in Jefferson County, Colorado, United States. It is a suburb of Denver and is located just west of the city. The population was 5,170 at the 2010 census.
History
Edgewater was founded in 1906 by a group of settlers from the Midwest. The town was named after the nearby Edgewater Hotel, which was built in 1887. The hotel was a popular destination for visitors to the area, and the town grew up around it.
The town was incorporated in 1947 and has since grown to become a thriving community. The city is known for its small-town charm and its proximity to Denver.
Geography
Edgewater is located at 39°44'17" North, 105°05'45" West (39.738, -105.096). It is situated at an elevation of 5,400 feet (1,646 m).
The city is located in the foothills of the Rocky Mountains, and is bordered by the cities of Lakewood, Wheat Ridge, and Arvada. It is also close to the Denver International Airport.
The city covers an area of 2 2 square miles 5 7 km2 all of which is land
Economy
Edgewater's economy is largely based on retail and services. The city is home to several small businesses, including restaurants, shops, and professional services.
The city is also home to several large employers, including the University of Colorado Denver, the Denver Federal Center, and the Denver Health Medical Center.
Demographics
As of the 2010 census, there were 5,170 people, 2,072 households, and 1,323 families residing in the city. The population density was 2,346.2 people per square mile (905.2/km2). There were 2,279 housing units at an average density of 1,037.2 per square mile (400.3/km2).
The racial makeup of the city was 79.2% White, 8.2% African American, 0.7% Native American, 3.2% Asian, 0.1% Pacific Islander, 5.3% from other races, and 3.3% from two or more races. Hispanic or Latino of any race were 13.2% of the population.
There were 2,072 households, out of which 28.2% had children under the age of 18 living with them, 44.2% were married couples living together, 12.2% had a female householder with no husband present, and 38.2% were non-families. 30.2% of all households were made up of individuals, and 8.2% had someone living alone who was 65 years of age or older. The average household size was 2.48 and the average family size was 3.13.
In the city, the population was spread out, with 24.2% under the age of 18, 9.2% from 18 to 24, 33.2% from 25 to 44, 22.2% from 45 to 64, and 11.2% who were 65 years of age or older. The median age was 34 years. For every 100 females, there were 95.2 males. For every 100 females age 18 and over, there were 92.2 males.
The median income for a household in the city was $45,938, and the median income for a family was $54,844. Males had a median income of $37,917 versus $30,917 for females. The per capita income for the city was $22,945. About 6.2% of families and 8.2% of the population were below the poverty line, including 10.2% of those under age 18 and 5.2% of those age 65 or over.
Common Questions
What is the Total Population of Edgewater?
Total Population of Edgewater is 5,002.
What is the Total Male Population of Edgewater?
Total Male Population of Edgewater is 2,612.
What is the Total Female Population of Edgewater?
Total Female Population of Edgewater is 2,390.
What is the Ratio of Males per 100 Females in Edgewater?
There are 109.29 Males per 100 Females in Edgewater.
What is the Ratio of Females per 100 Males in Edgewater?
There are 91.50 Females per 100 Males in Edgewater.
What is the Median Population Age in Edgewater?
Median Population Age in Edgewater is 33.1 Years.
What is the Average Family Size in Edgewater
Average Family Size in Edgewater is 3.0 People.
What is the Average Household Size in Edgewater
Average Household Size in Edgewater is 2.3 People.
What is Per Capita Income in Edgewater?
Per Capita income in Edgewater is $43,238.
What is the Median Family Income in Edgewater?
Median Family Income in Edgewater is $74,426.
What is the Median Household income in Edgewater?
Median Household Income in Edgewater is $71,964.
What is Income or Wage Gap in Edgewater?
Income or Wage Gap in Edgewater is 12.3%.
Women in Edgewater earn 87.7 cents for every dollar earned by a man.
What is Inequality or Gini Index in Edgewater?
Inequality or Gini Index in Edgewater is 0.41.
How Large is the Labor Force in Edgewater?
There are 3,714 People in the Labor Forcein in Edgewater.
What is the Percentage of People in the Labor Force in Edgewater?
86.1% of People are in the Labor Force in Edgewater.
What is the Unemployment Rate in Edgewater?
Unemployment Rate in Edgewater is 4.2%.