Comanche Creek, CO
Comanche Creek Map
Comanche Creek Overview
530
TOTAL POPULATION
222
MALE POPULATION
308
FEMALE POPULATION
72.08
MALES / 100 FEMALES
138.74
FEMALES / 100 MALES
51.8
MEDIAN AGE
4.3
AVG FAMILY SIZE
4.3
AVG HOUSEHOLD SIZE
$51,195
PER CAPITA INCOME
$215,323
AVG FAMILY INCOME
$215,323
AVG HOUSEHOLD INCOME
36.9%
WAGE / INCOME GAP [ % ]
63.1¢/ $1
WAGE / INCOME GAP [ $ ]
0.15
INEQUALITY / GINI INDEX
328
LABOR FORCE [ PEOPLE ]
66.9%
PERCENT IN LABOR FORCE
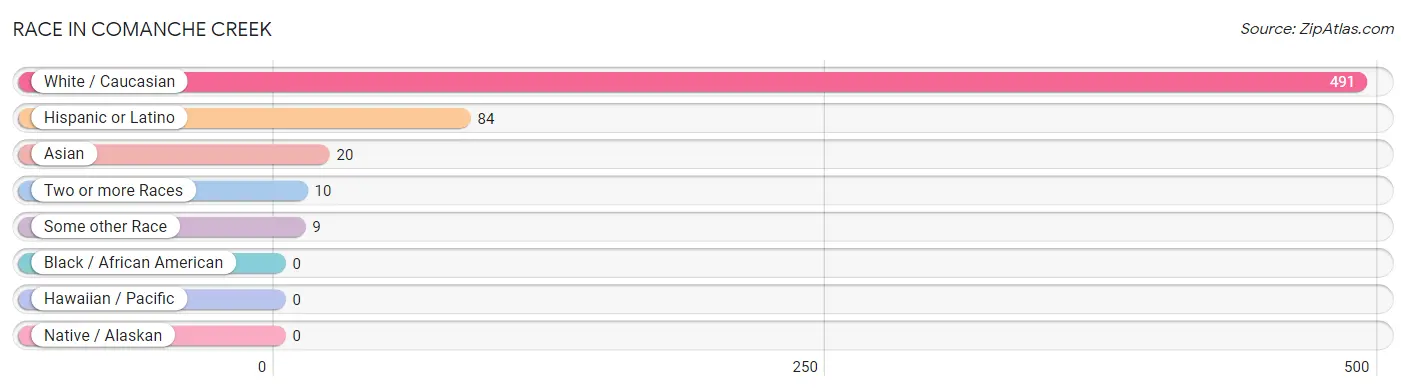
Race in Comanche Creek
The most populous races in Comanche Creek are White / Caucasian (491 | 92.6%), Hispanic or Latino (84 | 15.9%), and Asian (20 | 3.8%).
| Race | # Population | % Population |
| Asian | 20 | 3.8% |
| Black / African American | 0 | 0.0% |
| Hawaiian / Pacific | 0 | 0.0% |
| Hispanic or Latino | 84 | 15.9% |
| Native / Alaskan | 0 | 0.0% |
| White / Caucasian | 491 | 92.6% |
| Two or more Races | 10 | 1.9% |
| Some other Race | 9 | 1.7% |
| Total | 530 | 100.0% |
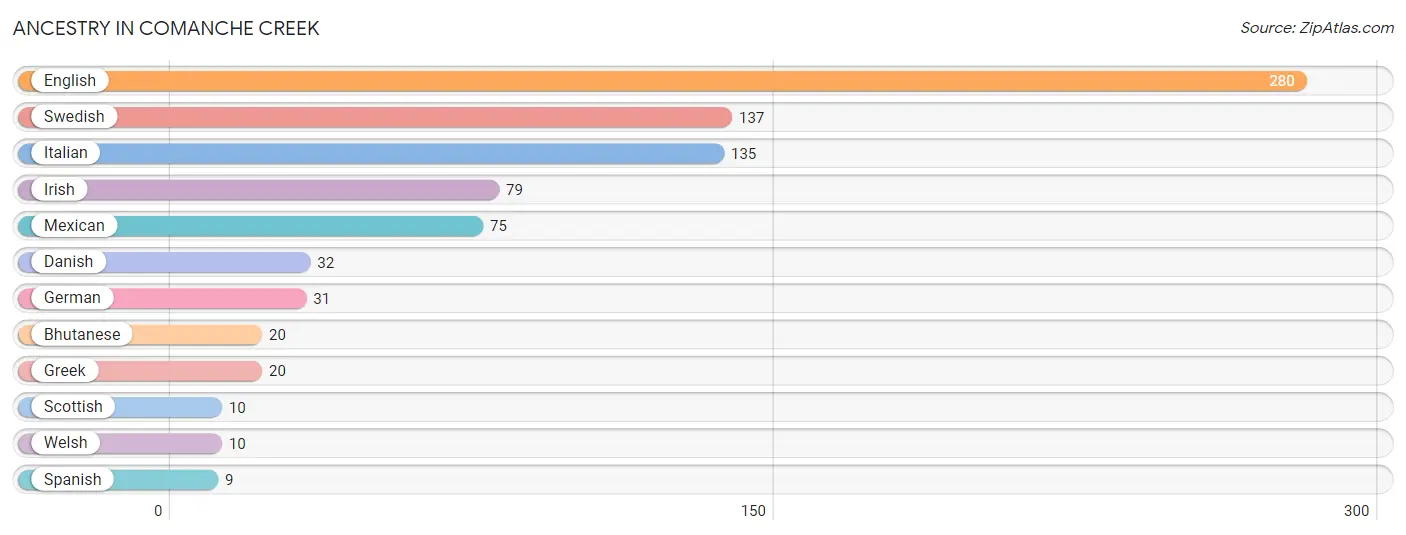
Ancestry in Comanche Creek
The most populous ancestries reported in Comanche Creek are English (280 | 52.8%), Swedish (137 | 25.9%), Italian (135 | 25.5%), Irish (79 | 14.9%), and Mexican (75 | 14.1%), together accounting for 133.2% of all Comanche Creek residents.
| Ancestry | # Population | % Population |
| Bhutanese | 20 | 3.8% |
| Danish | 32 | 6.0% |
| English | 280 | 52.8% |
| German | 31 | 5.9% |
| Greek | 20 | 3.8% |
| Irish | 79 | 14.9% |
| Italian | 135 | 25.5% |
| Mexican | 75 | 14.1% |
| Scottish | 10 | 1.9% |
| Spanish | 9 | 1.7% |
| Swedish | 137 | 25.9% |
| Welsh | 10 | 1.9% | View All 12 Rows |
Immigrants in Comanche Creek

| Immigration Origin | # Population | % Population | View All 0 Rows |
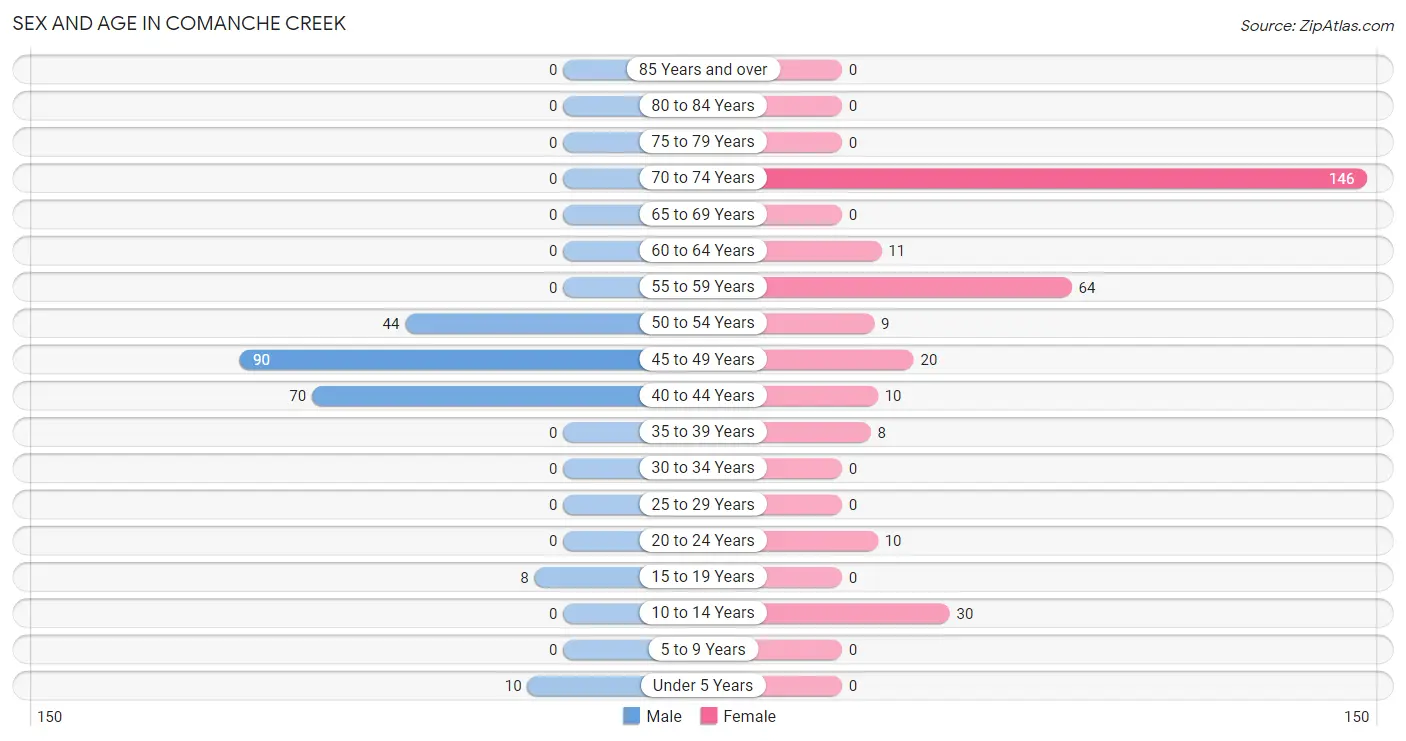
Sex and Age in Comanche Creek
Sex and Age in Comanche Creek
The most populous age groups in Comanche Creek are 45 to 49 Years (90 | 40.5%) for men and 70 to 74 Years (146 | 47.4%) for women.
| Age Bracket | Male | Female |
| Under 5 Years | 10 (4.5%) | 0 (0.0%) |
| 5 to 9 Years | 0 (0.0%) | 0 (0.0%) |
| 10 to 14 Years | 0 (0.0%) | 30 (9.7%) |
| 15 to 19 Years | 8 (3.6%) | 0 (0.0%) |
| 20 to 24 Years | 0 (0.0%) | 10 (3.3%) |
| 25 to 29 Years | 0 (0.0%) | 0 (0.0%) |
| 30 to 34 Years | 0 (0.0%) | 0 (0.0%) |
| 35 to 39 Years | 0 (0.0%) | 8 (2.6%) |
| 40 to 44 Years | 70 (31.5%) | 10 (3.3%) |
| 45 to 49 Years | 90 (40.5%) | 20 (6.5%) |
| 50 to 54 Years | 44 (19.8%) | 9 (2.9%) |
| 55 to 59 Years | 0 (0.0%) | 64 (20.8%) |
| 60 to 64 Years | 0 (0.0%) | 11 (3.6%) |
| 65 to 69 Years | 0 (0.0%) | 0 (0.0%) |
| 70 to 74 Years | 0 (0.0%) | 146 (47.4%) |
| 75 to 79 Years | 0 (0.0%) | 0 (0.0%) |
| 80 to 84 Years | 0 (0.0%) | 0 (0.0%) |
| 85 Years and over | 0 (0.0%) | 0 (0.0%) |
| Total | 222 (100.0%) | 308 (100.0%) |
Families and Households in Comanche Creek
Median Family Size in Comanche Creek
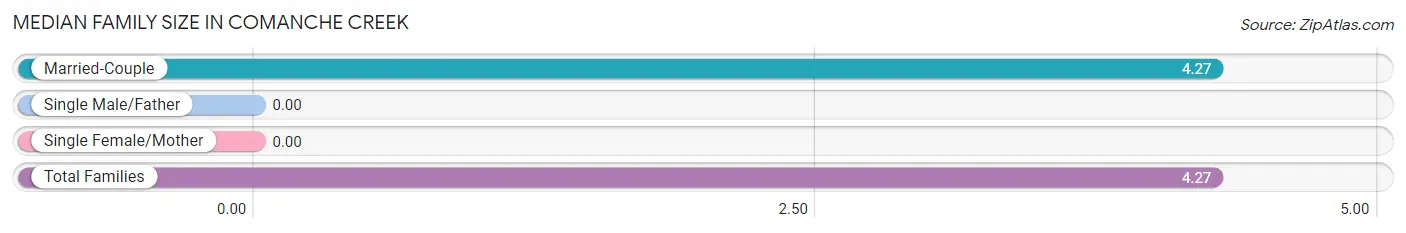
| Family Type | # Families | Family Size |
| Married-Couple | 124 (100.0%) | 4.27 |
| Single Male/Father | 0 (0.0%) | - |
| Single Female/Mother | 0 (0.0%) | - |
| Total Families | 124 (100.0%) | 4.27 |
Median Household Size in Comanche Creek
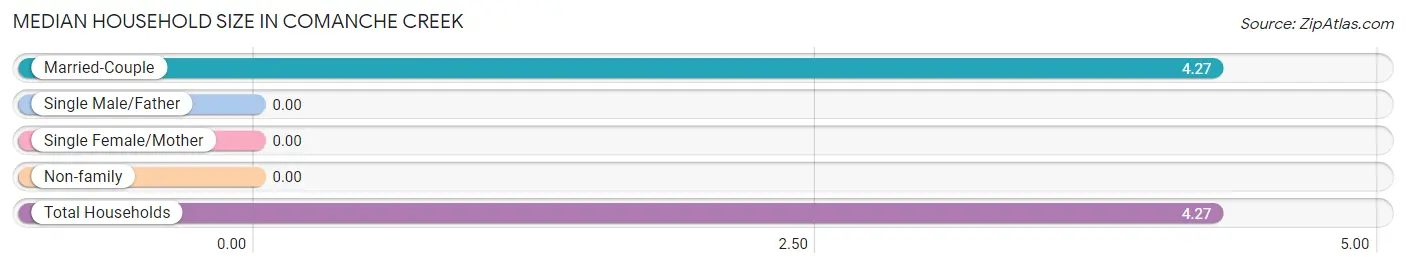
| Household Type | # Households | Household Size |
| Married-Couple | 124 (100.0%) | 4.27 |
| Single Male/Father | 0 (0.0%) | - |
| Single Female/Mother | 0 (0.0%) | - |
| Non-family | 0 (0.0%) | - |
| Total Households | 124 (100.0%) | 4.27 |
Household Size by Marriage Status in Comanche Creek
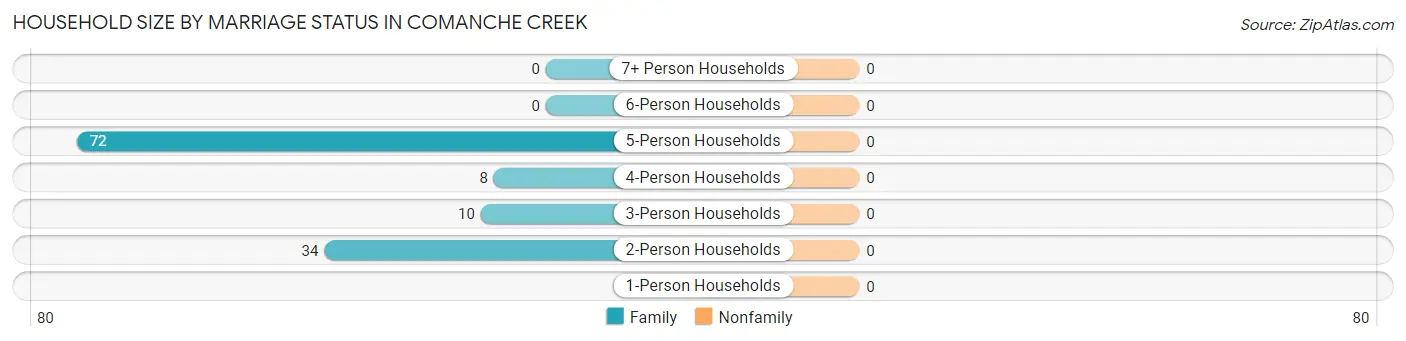
| Household Size | Family Households | Nonfamily Households |
| 1-Person Households | - | 0 (0.0%) |
| 2-Person Households | 34 (27.4%) | 0 (0.0%) |
| 3-Person Households | 10 (8.1%) | 0 (0.0%) |
| 4-Person Households | 8 (6.5%) | 0 (0.0%) |
| 5-Person Households | 72 (58.1%) | 0 (0.0%) |
| 6-Person Households | 0 (0.0%) | 0 (0.0%) |
| 7+ Person Households | 0 (0.0%) | 0 (0.0%) |
| Total | 124 (100.0%) | 0 (0.0%) |
Female Fertility in Comanche Creek
Fertility by Age in Comanche Creek
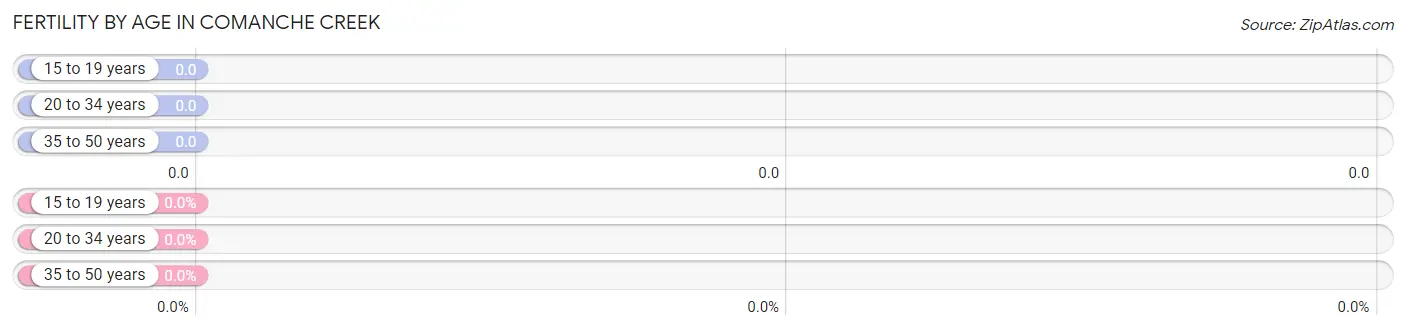
| Age Bracket | Women with Births | Births / 1,000 Women |
| 15 to 19 years | 0 (0.0%) | 0.0 |
| 20 to 34 years | 0 (0.0%) | 0.0 |
| 35 to 50 years | 0 (0.0%) | 0.0 |
| Total | 0 (0.0%) | 0.0 |
Fertility by Age by Marriage Status in Comanche Creek
| Age Bracket | Married | Unmarried |
| 15 to 19 years | 0 (0.0%) | 0 (0.0%) |
| 20 to 34 years | 0 (0.0%) | 0 (0.0%) |
| 35 to 50 years | 0 (0.0%) | 0 (0.0%) |
| Total | 0 (0.0%) | 0 (0.0%) |
Fertility by Education in Comanche Creek
| Educational Attainment | Women with Births | Births / 1,000 Women |
| Less than High School | 0 (0.0%) | 0.0 |
| High School Diploma | 0 (0.0%) | 0.0 |
| College or Associate's Degree | 0 (0.0%) | 0.0 |
| Bachelor's Degree | 0 (0.0%) | 0.0 |
| Graduate Degree | 0 (0.0%) | 0.0 |
| Total | 0 (0.0%) | 0.0 |
Fertility by Education by Marriage Status in Comanche Creek
| Educational Attainment | Married | Unmarried |
| Less than High School | 0 (0.0%) | 0 (0.0%) |
| High School Diploma | 0 (0.0%) | 0 (0.0%) |
| College or Associate's Degree | 0 (0.0%) | 0 (0.0%) |
| Bachelor's Degree | 0 (0.0%) | 0 (0.0%) |
| Graduate Degree | 0 (0.0%) | 0 (0.0%) |
| Total | 0 (0.0%) | 0 (0.0%) |
Income in Comanche Creek
Income Overview in Comanche Creek
Per Capita Income in Comanche Creek is $51,195, while median incomes of families and households are $215,323 and $215,323 respectively.
| Characteristic | Number | Measure |
| Per Capita Income | 530 | $51,195 |
| Median Family Income | 124 | $215,323 |
| Mean Family Income | 124 | $213,447 |
| Median Household Income | 124 | $215,323 |
| Mean Household Income | 124 | $213,447 |
| Income Deficit | 124 | $0 |
| Wage / Income Gap (%) | 530 | 36.88% |
| Wage / Income Gap ($) | 530 | 63.12¢ per $1 |
| Gini / Inequality Index | 530 | 0.15 |
Earnings by Sex in Comanche Creek
Average Earnings in Comanche Creek are $46,914, $72,000 for men and $45,449 for women, a difference of 36.9%.
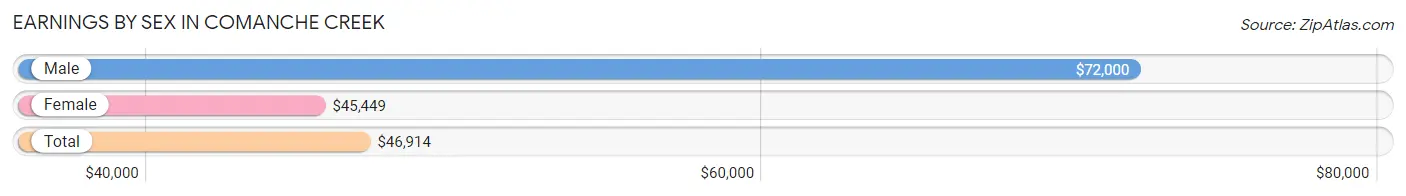
| Sex | Number | Average Earnings |
| Male | 212 (50.8%) | $72,000 |
| Female | 205 (49.2%) | $45,449 |
| Total | 417 (100.0%) | $46,914 |
Earnings by Sex by Income Bracket in Comanche Creek
The most common earnings brackets in Comanche Creek are $100,000+ for men (93 | 43.9%) and $2,500 to $4,999 for women (73 | 35.6%).
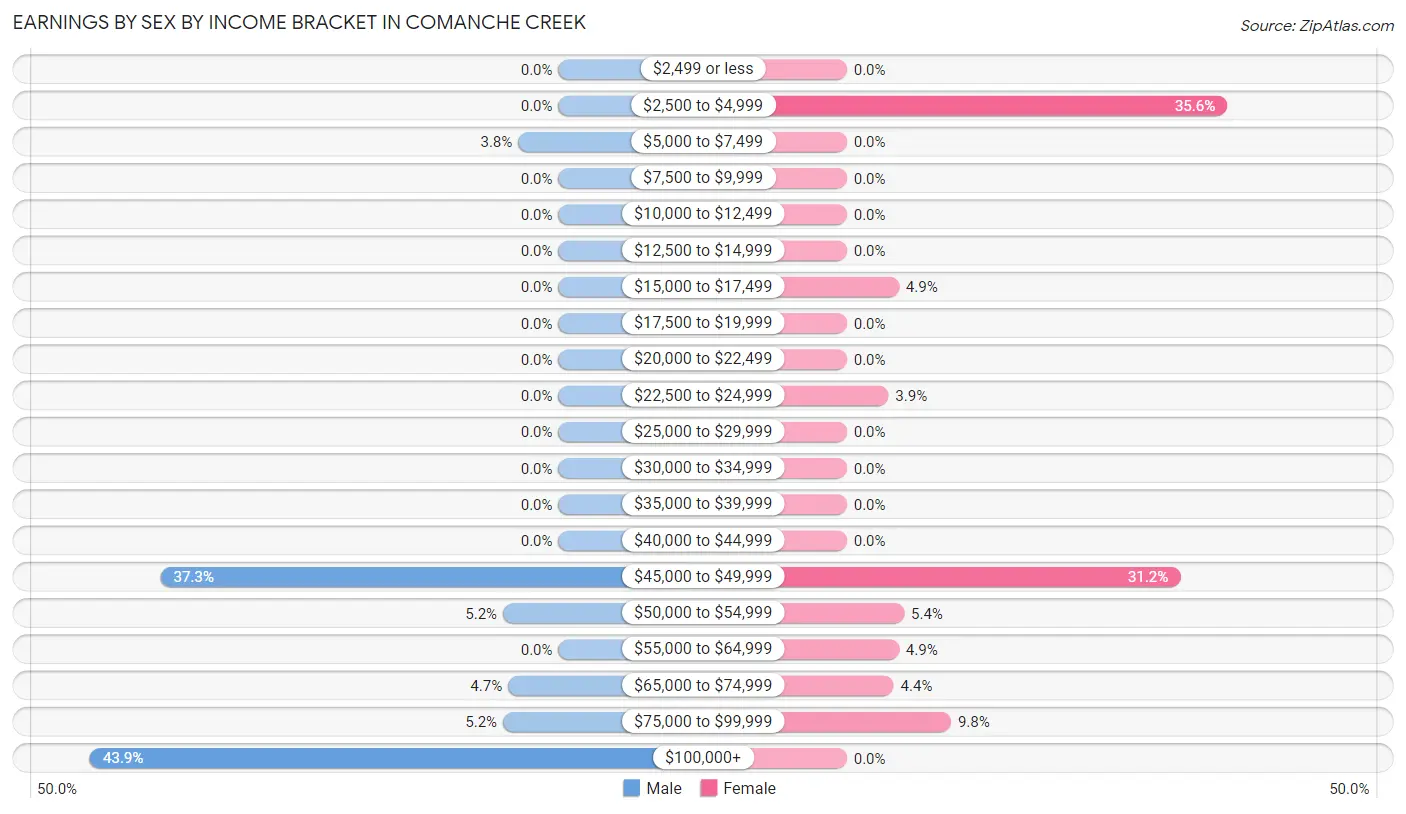
| Income | Male | Female |
| $2,499 or less | 0 (0.0%) | 0 (0.0%) |
| $2,500 to $4,999 | 0 (0.0%) | 73 (35.6%) |
| $5,000 to $7,499 | 8 (3.8%) | 0 (0.0%) |
| $7,500 to $9,999 | 0 (0.0%) | 0 (0.0%) |
| $10,000 to $12,499 | 0 (0.0%) | 0 (0.0%) |
| $12,500 to $14,999 | 0 (0.0%) | 0 (0.0%) |
| $15,000 to $17,499 | 0 (0.0%) | 10 (4.9%) |
| $17,500 to $19,999 | 0 (0.0%) | 0 (0.0%) |
| $20,000 to $22,499 | 0 (0.0%) | 0 (0.0%) |
| $22,500 to $24,999 | 0 (0.0%) | 8 (3.9%) |
| $25,000 to $29,999 | 0 (0.0%) | 0 (0.0%) |
| $30,000 to $34,999 | 0 (0.0%) | 0 (0.0%) |
| $35,000 to $39,999 | 0 (0.0%) | 0 (0.0%) |
| $40,000 to $44,999 | 0 (0.0%) | 0 (0.0%) |
| $45,000 to $49,999 | 79 (37.3%) | 64 (31.2%) |
| $50,000 to $54,999 | 11 (5.2%) | 11 (5.4%) |
| $55,000 to $64,999 | 0 (0.0%) | 10 (4.9%) |
| $65,000 to $74,999 | 10 (4.7%) | 9 (4.4%) |
| $75,000 to $99,999 | 11 (5.2%) | 20 (9.8%) |
| $100,000+ | 93 (43.9%) | 0 (0.0%) |
| Total | 212 (100.0%) | 205 (100.0%) |
Earnings by Sex by Educational Attainment in Comanche Creek
Average earnings in Comanche Creek are $92,955 for men and $45,645 for women, a difference of 50.9%. Men with an educational attainment of college or associate's degree enjoy the highest average annual earnings of $46,598, while those with college or associate's degree education earn the least with $46,598. Women with an educational attainment of college or associate's degree earn the most with the average annual earnings of $69,028, while those with college or associate's degree education have the smallest earnings of $69,028.
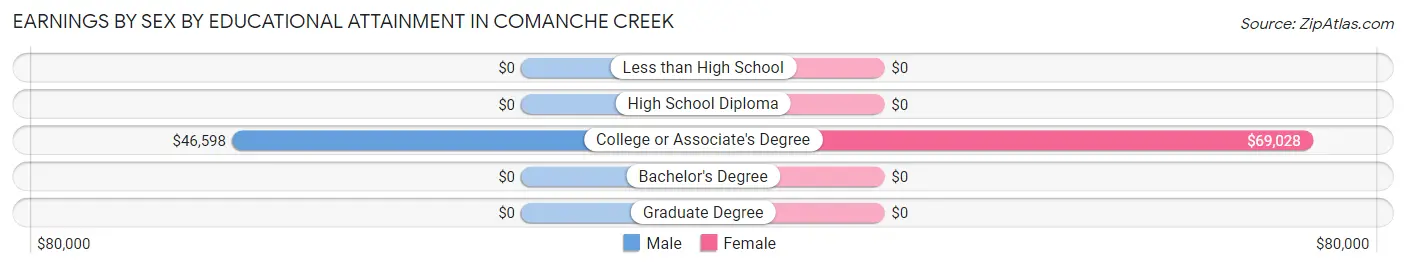
| Educational Attainment | Male Income | Female Income |
| Less than High School | - | - |
| High School Diploma | - | - |
| College or Associate's Degree | $46,598 | $69,028 |
| Bachelor's Degree | - | - |
| Graduate Degree | - | - |
| Total | $92,955 | $45,645 |
Family Income in Comanche Creek
Family Income Brackets in Comanche Creek
According to the Comanche Creek family income data, there are 93 families falling into the $200,000+ income range, which is the most common income bracket and makes up 75.0% of all families.
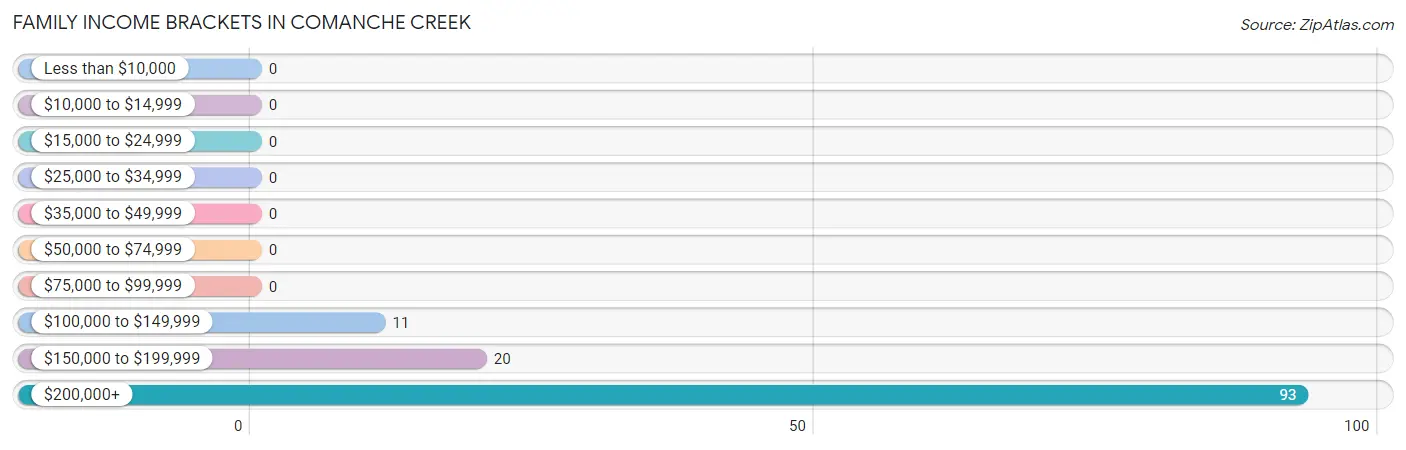
| Income Bracket | # Families | % Families |
| Less than $10,000 | 0 | 0.0% |
| $10,000 to $14,999 | 0 | 0.0% |
| $15,000 to $24,999 | 0 | 0.0% |
| $25,000 to $34,999 | 0 | 0.0% |
| $35,000 to $49,999 | 0 | 0.0% |
| $50,000 to $74,999 | 0 | 0.0% |
| $75,000 to $99,999 | 0 | 0.0% |
| $100,000 to $149,999 | 11 | 8.9% |
| $150,000 to $199,999 | 20 | 16.1% |
| $200,000+ | 93 | 75.0% |
Family Income by Famaliy Size in Comanche Creek
| Income Bracket | # Families | Median Income |
| 2-Person Families | 34 (27.4%) | $0 |
| 3-Person Families | 10 (8.1%) | $0 |
| 4-Person Families | 8 (6.5%) | $0 |
| 5-Person Families | 72 (58.1%) | $0 |
| 6-Person Families | 0 (0.0%) | $0 |
| 7+ Person Families | 0 (0.0%) | $0 |
| Total | 124 (100.0%) | $215,323 |
Family Income by Number of Earners in Comanche Creek
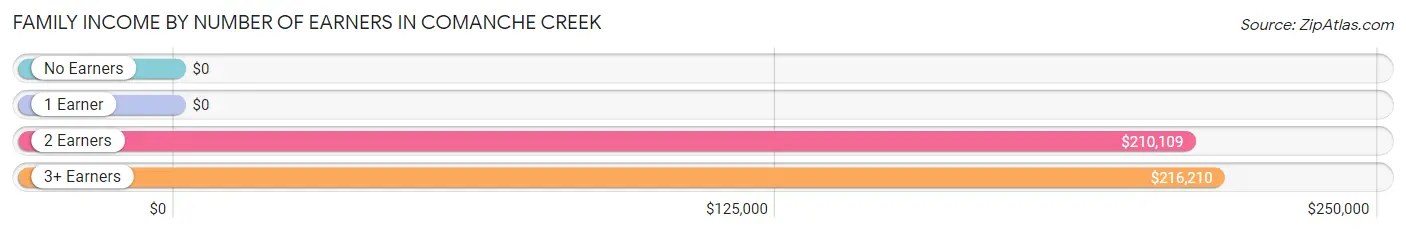
| Number of Earners | # Families | Median Income |
| No Earners | 0 (0.0%) | $0 |
| 1 Earner | 0 (0.0%) | $0 |
| 2 Earners | 44 (35.5%) | $210,109 |
| 3+ Earners | 80 (64.5%) | $216,210 |
| Total | 124 (100.0%) | $215,323 |
Household Income in Comanche Creek
Household Income Brackets in Comanche Creek
With 93 households falling in the category, the $200,000+ income range is the most frequent in Comanche Creek, accounting for 75.0% of all households.
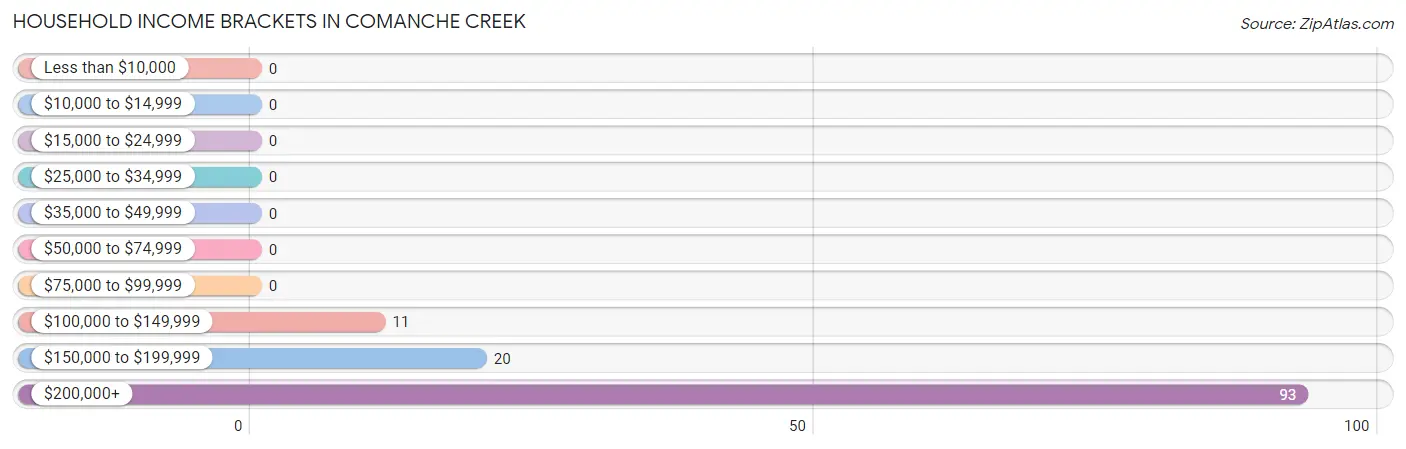
| Income Bracket | # Households | % Households |
| Less than $10,000 | 0 | 0.0% |
| $10,000 to $14,999 | 0 | 0.0% |
| $15,000 to $24,999 | 0 | 0.0% |
| $25,000 to $34,999 | 0 | 0.0% |
| $35,000 to $49,999 | 0 | 0.0% |
| $50,000 to $74,999 | 0 | 0.0% |
| $75,000 to $99,999 | 0 | 0.0% |
| $100,000 to $149,999 | 11 | 8.9% |
| $150,000 to $199,999 | 20 | 16.1% |
| $200,000+ | 93 | 75.0% |
Household Income by Householder Age in Comanche Creek
The median household income in Comanche Creek is $215,323, with the highest median household income of $216,210 found in the 25 to 44 years age bracket for the primary householder. A total of 80 households (64.5%) fall into this category.
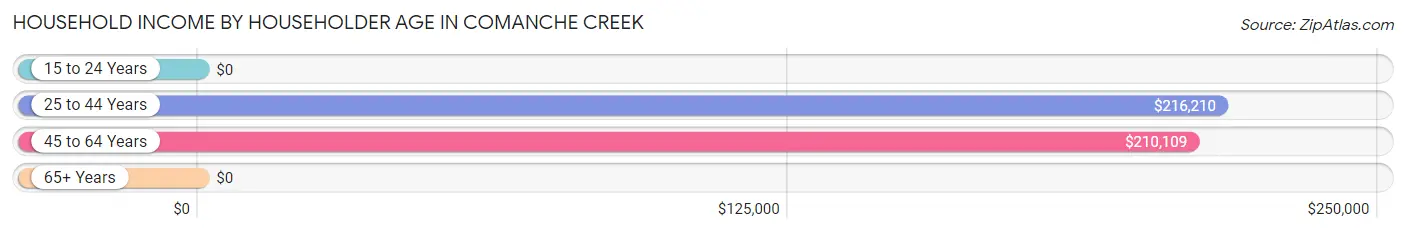
| Income Bracket | # Households | Median Income |
| 15 to 24 Years | 0 (0.0%) | $0 |
| 25 to 44 Years | 80 (64.5%) | $216,210 |
| 45 to 64 Years | 44 (35.5%) | $210,109 |
| 65+ Years | 0 (0.0%) | $0 |
| Total | 124 (100.0%) | $215,323 |
Poverty in Comanche Creek
Income Below Poverty by Sex and Age in Comanche Creek
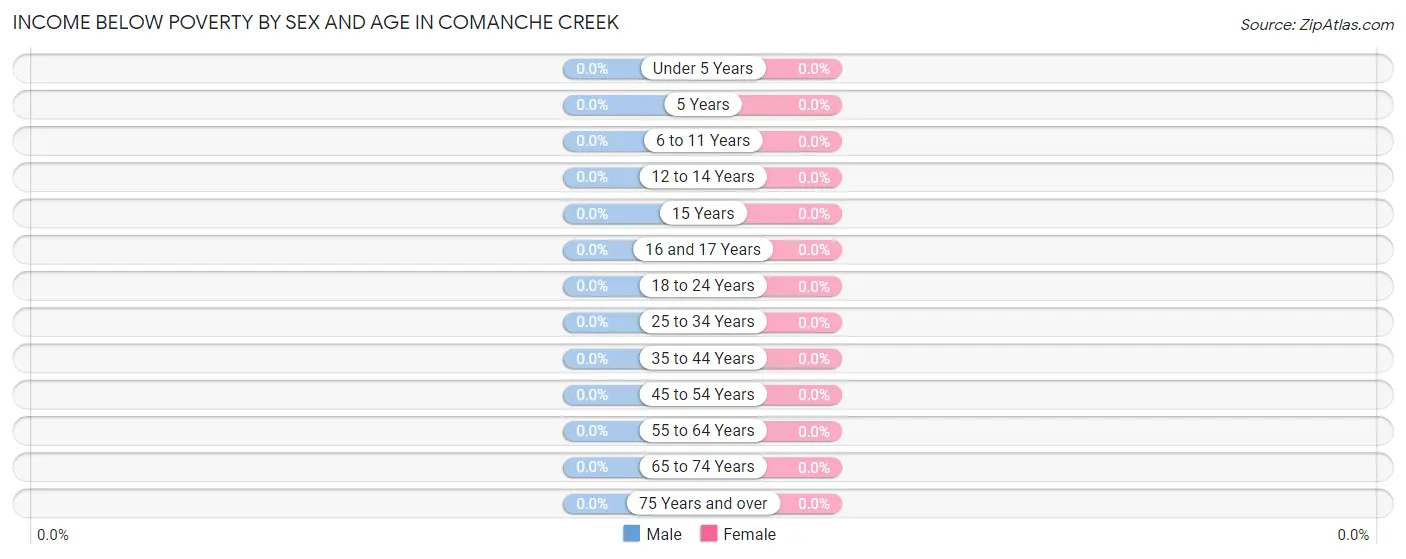
| Age Bracket | Male | Female |
| Under 5 Years | 0 (0.0%) | 0 (0.0%) |
| 5 Years | 0 (0.0%) | 0 (0.0%) |
| 6 to 11 Years | 0 (0.0%) | 0 (0.0%) |
| 12 to 14 Years | 0 (0.0%) | 0 (0.0%) |
| 15 Years | 0 (0.0%) | 0 (0.0%) |
| 16 and 17 Years | 0 (0.0%) | 0 (0.0%) |
| 18 to 24 Years | 0 (0.0%) | 0 (0.0%) |
| 25 to 34 Years | 0 (0.0%) | 0 (0.0%) |
| 35 to 44 Years | 0 (0.0%) | 0 (0.0%) |
| 45 to 54 Years | 0 (0.0%) | 0 (0.0%) |
| 55 to 64 Years | 0 (0.0%) | 0 (0.0%) |
| 65 to 74 Years | 0 (0.0%) | 0 (0.0%) |
| 75 Years and over | 0 (0.0%) | 0 (0.0%) |
| Total | 0 (0.0%) | 0 (0.0%) |
Income Above Poverty by Sex and Age in Comanche Creek
According to the poverty statistics in Comanche Creek, males aged under 5 years and females aged 6 to 11 years are the age groups that are most secure financially, with 100.0% of males and 100.0% of females in these age groups living above the poverty line.
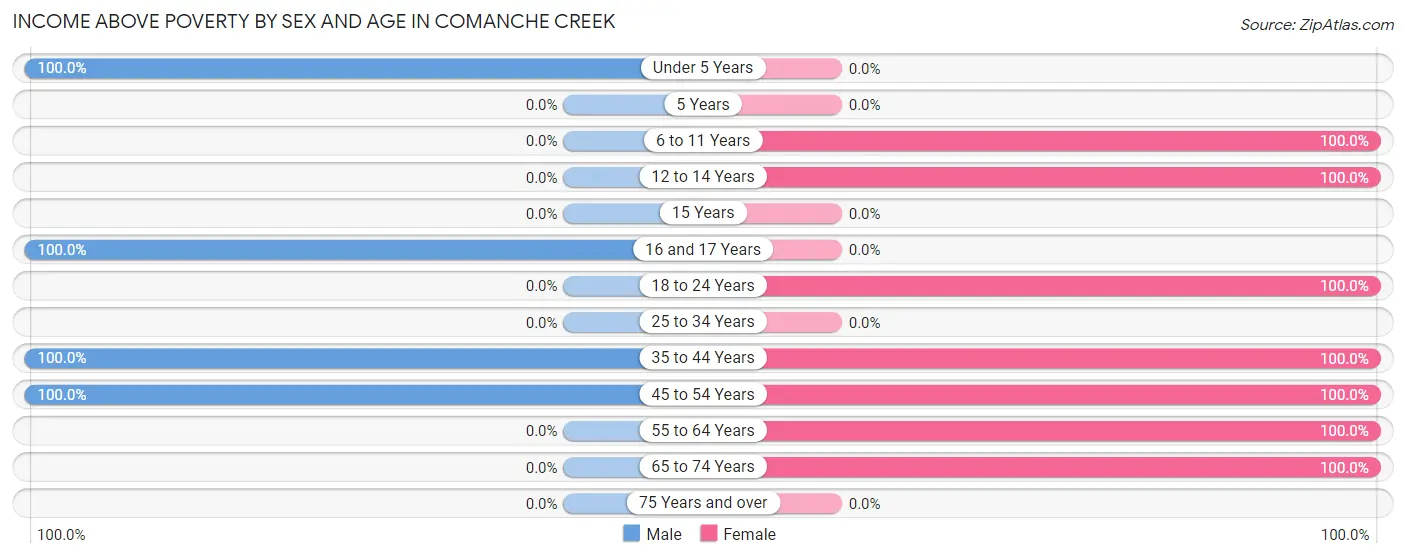
| Age Bracket | Male | Female |
| Under 5 Years | 10 (100.0%) | 0 (0.0%) |
| 5 Years | 0 (0.0%) | 0 (0.0%) |
| 6 to 11 Years | 0 (0.0%) | 19 (100.0%) |
| 12 to 14 Years | 0 (0.0%) | 11 (100.0%) |
| 15 Years | 0 (0.0%) | 0 (0.0%) |
| 16 and 17 Years | 8 (100.0%) | 0 (0.0%) |
| 18 to 24 Years | 0 (0.0%) | 10 (100.0%) |
| 25 to 34 Years | 0 (0.0%) | 0 (0.0%) |
| 35 to 44 Years | 70 (100.0%) | 18 (100.0%) |
| 45 to 54 Years | 134 (100.0%) | 29 (100.0%) |
| 55 to 64 Years | 0 (0.0%) | 75 (100.0%) |
| 65 to 74 Years | 0 (0.0%) | 146 (100.0%) |
| 75 Years and over | 0 (0.0%) | 0 (0.0%) |
| Total | 222 (100.0%) | 308 (100.0%) |
Income Below Poverty Among Married-Couple Families in Comanche Creek
| Children | Above Poverty | Below Poverty |
| No Children | 106 (100.0%) | 0 (0.0%) |
| 1 or 2 Children | 8 (100.0%) | 0 (0.0%) |
| 3 or 4 Children | 10 (100.0%) | 0 (0.0%) |
| 5 or more Children | 0 (0.0%) | 0 (0.0%) |
| Total | 124 (100.0%) | 0 (0.0%) |
Income Below Poverty Among Single-Parent Households in Comanche Creek
| Children | Single Father | Single Mother |
| No Children | 0 (0.0%) | 0 (0.0%) |
| 1 or 2 Children | 0 (0.0%) | 0 (0.0%) |
| 3 or 4 Children | 0 (0.0%) | 0 (0.0%) |
| 5 or more Children | 0 (0.0%) | 0 (0.0%) |
| Total | 0 (0.0%) | 0 (0.0%) |
Income Below Poverty Among Married-Couple vs Single-Parent Households in Comanche Creek
| Children | Married-Couple Families | Single-Parent Households |
| No Children | 0 (0.0%) | 0 (0.0%) |
| 1 or 2 Children | 0 (0.0%) | 0 (0.0%) |
| 3 or 4 Children | 0 (0.0%) | 0 (0.0%) |
| 5 or more Children | 0 (0.0%) | 0 (0.0%) |
| Total | 0 (0.0%) | 0 (0.0%) |
Employment Characteristics in Comanche Creek
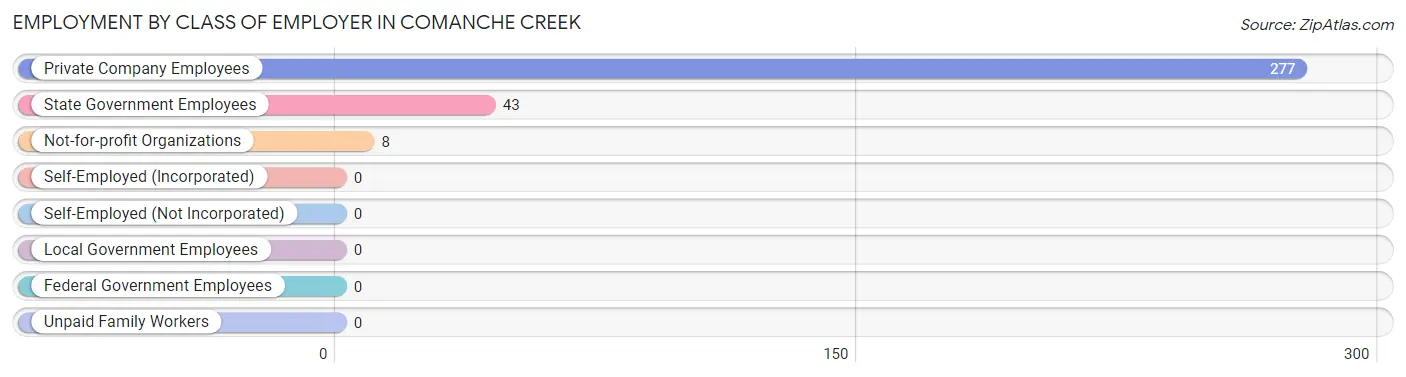
Employment by Class of Employer in Comanche Creek
Among the 328 employed individuals in Comanche Creek, private company employees (277 | 84.5%), state government employees (43 | 13.1%), and not-for-profit organizations (8 | 2.4%) make up the most common classes of employment.
| Employer Class | # Employees | % Employees |
| Private Company Employees | 277 | 84.5% |
| Self-Employed (Incorporated) | 0 | 0.0% |
| Self-Employed (Not Incorporated) | 0 | 0.0% |
| Not-for-profit Organizations | 8 | 2.4% |
| Local Government Employees | 0 | 0.0% |
| State Government Employees | 43 | 13.1% |
| Federal Government Employees | 0 | 0.0% |
| Unpaid Family Workers | 0 | 0.0% |
| Total | 328 | 100.0% |
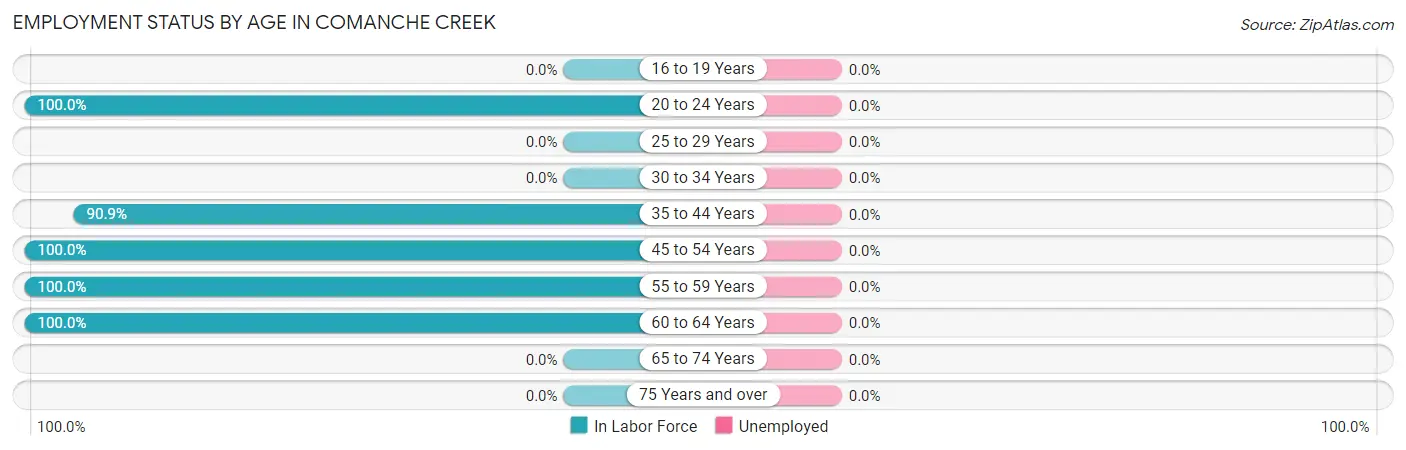
Employment Status by Age in Comanche Creek
| Age Bracket | In Labor Force | Unemployed |
| 16 to 19 Years | 0 (0.0%) | 0 (0.0%) |
| 20 to 24 Years | 10 (100.0%) | 0 (0.0%) |
| 25 to 29 Years | 0 (0.0%) | 0 (0.0%) |
| 30 to 34 Years | 0 (0.0%) | 0 (0.0%) |
| 35 to 44 Years | 80 (90.9%) | 0 (0.0%) |
| 45 to 54 Years | 163 (100.0%) | 0 (0.0%) |
| 55 to 59 Years | 64 (100.0%) | 0 (0.0%) |
| 60 to 64 Years | 11 (100.0%) | 0 (0.0%) |
| 65 to 74 Years | 0 (0.0%) | 0 (0.0%) |
| 75 Years and over | 0 (0.0%) | 0 (0.0%) |
| Total | 328 (66.9%) | 0 (0.0%) |
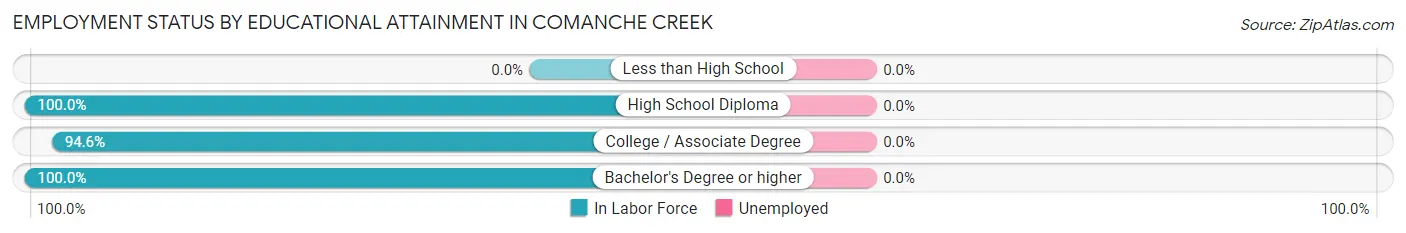
Employment Status by Educational Attainment in Comanche Creek
| Educational Attainment | In Labor Force | Unemployed |
| Less than High School | 0 (0.0%) | 0 (0.0%) |
| High School Diploma | 21 (100.0%) | 0 (0.0%) |
| College / Associate Degree | 140 (94.6%) | 0 (0.0%) |
| Bachelor's Degree or higher | 157 (100.0%) | 0 (0.0%) |
| Total | 318 (97.5%) | 0 (0.0%) |
Employment Occupations by Sex in Comanche Creek
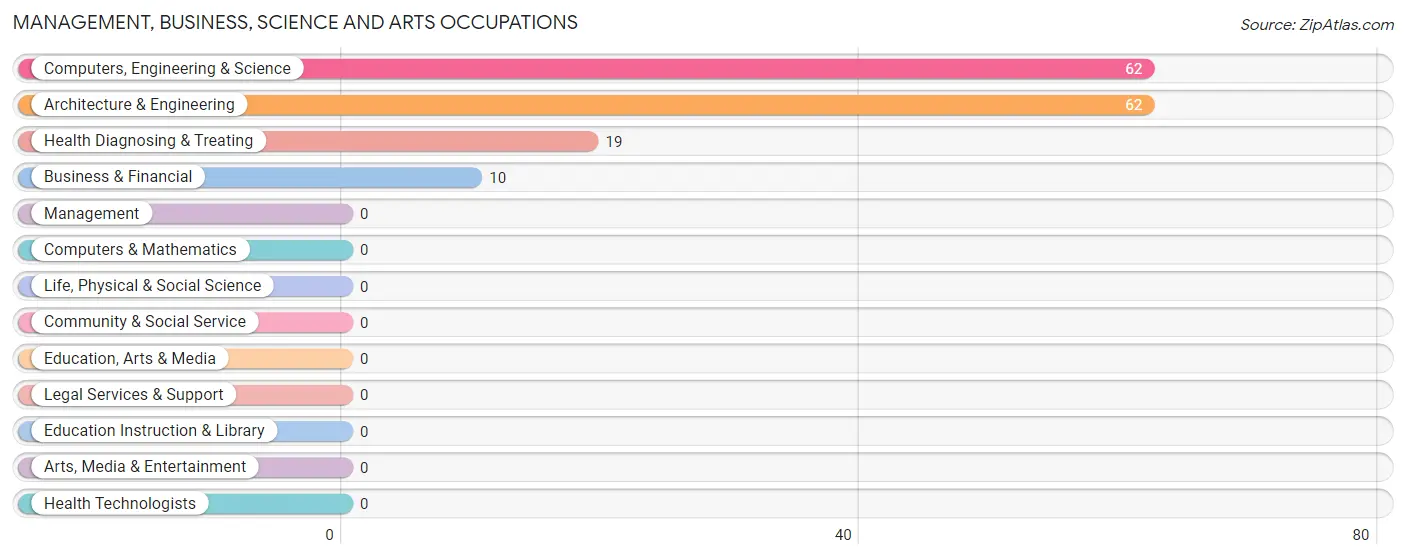
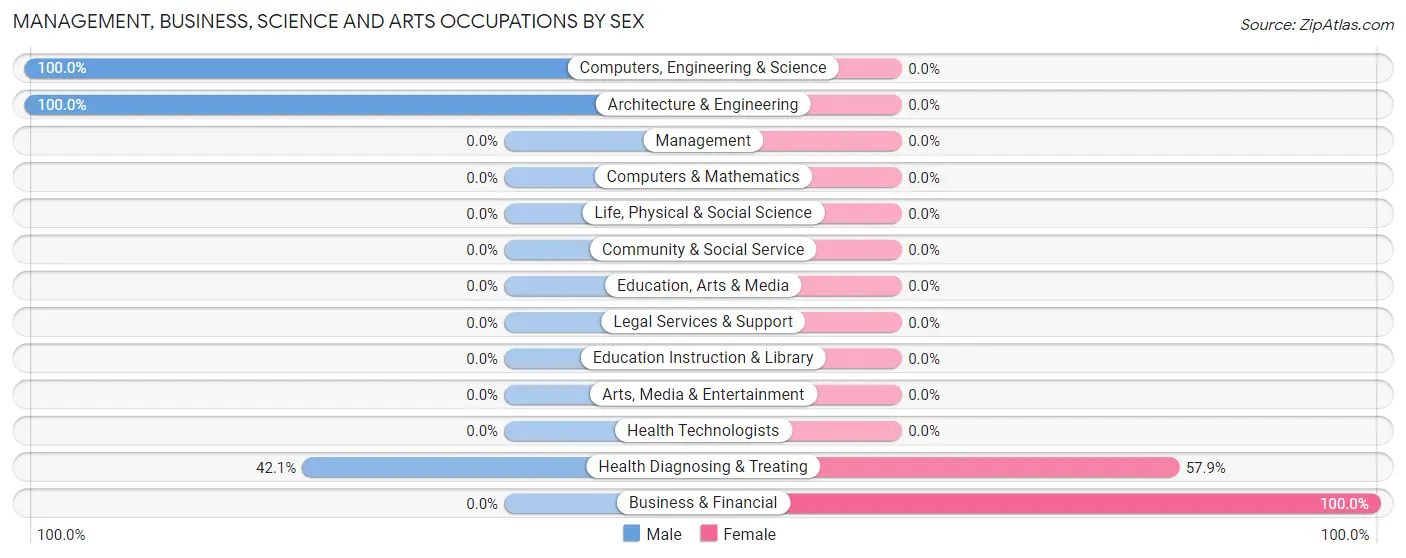
Management, Business, Science and Arts Occupations
The most common Management, Business, Science and Arts occupations in Comanche Creek are Computers, Engineering & Science (62 | 18.9%), Architecture & Engineering (62 | 18.9%), Health Diagnosing & Treating (19 | 5.8%), and Business & Financial (10 | 3.0%).
Management, Business, Science and Arts Occupations by Sex
Within the Management, Business, Science and Arts occupations in Comanche Creek, the most male-oriented occupations are Computers, Engineering & Science (100.0%), Architecture & Engineering (100.0%), and Health Diagnosing & Treating (42.1%), while the most female-oriented occupations are Business & Financial (100.0%), and Health Diagnosing & Treating (57.9%).
| Occupation | Male | Female |
| Management | 0 (0.0%) | 0 (0.0%) |
| Business & Financial | 0 (0.0%) | 10 (100.0%) |
| Computers, Engineering & Science | 62 (100.0%) | 0 (0.0%) |
| Computers & Mathematics | 0 (0.0%) | 0 (0.0%) |
| Architecture & Engineering | 62 (100.0%) | 0 (0.0%) |
| Life, Physical & Social Science | 0 (0.0%) | 0 (0.0%) |
| Community & Social Service | 0 (0.0%) | 0 (0.0%) |
| Education, Arts & Media | 0 (0.0%) | 0 (0.0%) |
| Legal Services & Support | 0 (0.0%) | 0 (0.0%) |
| Education Instruction & Library | 0 (0.0%) | 0 (0.0%) |
| Arts, Media & Entertainment | 0 (0.0%) | 0 (0.0%) |
| Health Diagnosing & Treating | 8 (42.1%) | 11 (57.9%) |
| Health Technologists | 0 (0.0%) | 0 (0.0%) |
| Total (Category) | 70 (76.9%) | 21 (23.1%) |
| Total (Overall) | 204 (62.2%) | 124 (37.8%) |
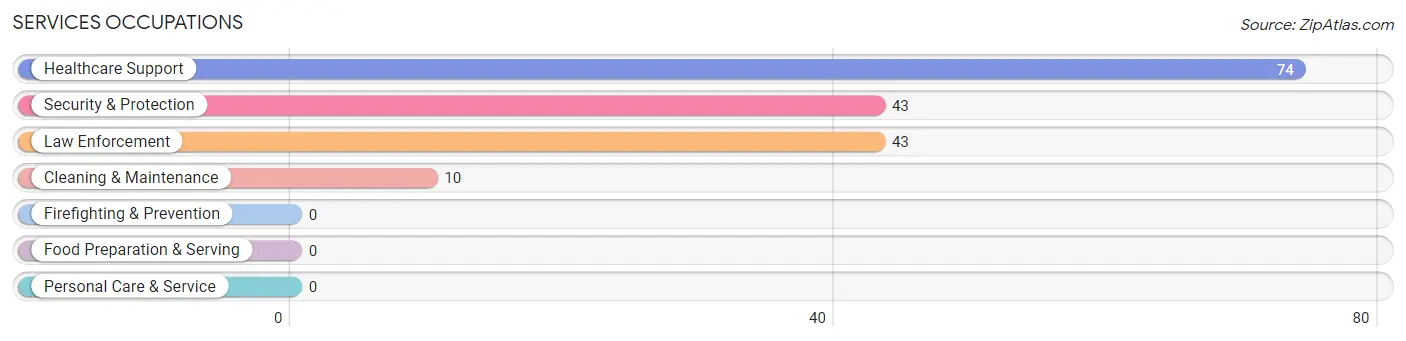
Services Occupations
The most common Services occupations in Comanche Creek are Healthcare Support (74 | 22.6%), Security & Protection (43 | 13.1%), Law Enforcement (43 | 13.1%), and Cleaning & Maintenance (10 | 3.0%).
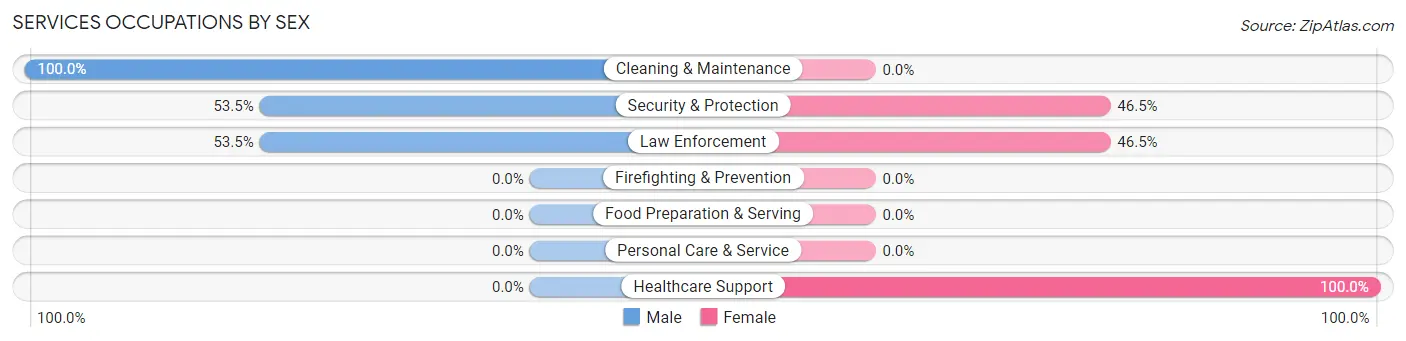
Services Occupations by Sex
Within the Services occupations in Comanche Creek, the most male-oriented occupations are Cleaning & Maintenance (100.0%), Security & Protection (53.5%), and Law Enforcement (53.5%), while the most female-oriented occupations are Healthcare Support (100.0%), Security & Protection (46.5%), and Law Enforcement (46.5%).
| Occupation | Male | Female |
| Healthcare Support | 0 (0.0%) | 74 (100.0%) |
| Security & Protection | 23 (53.5%) | 20 (46.5%) |
| Firefighting & Prevention | 0 (0.0%) | 0 (0.0%) |
| Law Enforcement | 23 (53.5%) | 20 (46.5%) |
| Food Preparation & Serving | 0 (0.0%) | 0 (0.0%) |
| Cleaning & Maintenance | 10 (100.0%) | 0 (0.0%) |
| Personal Care & Service | 0 (0.0%) | 0 (0.0%) |
| Total (Category) | 33 (26.0%) | 94 (74.0%) |
| Total (Overall) | 204 (62.2%) | 124 (37.8%) |
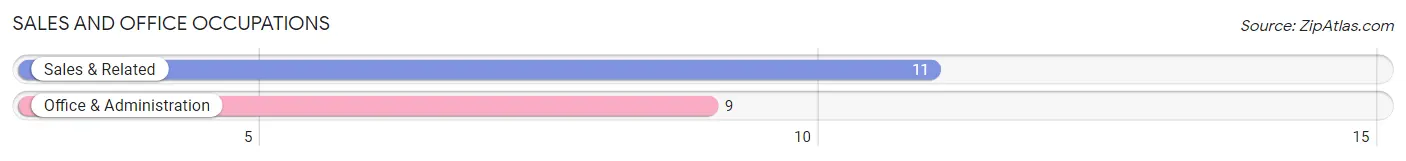
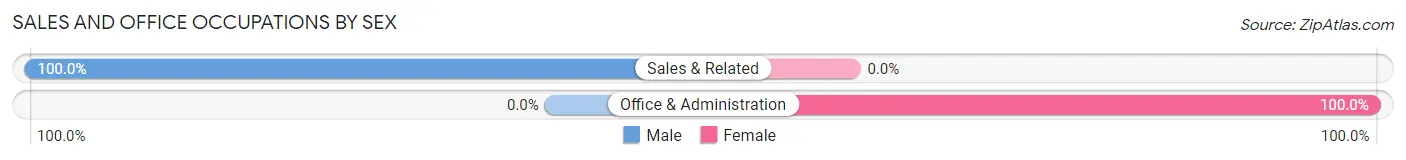
Sales and Office Occupations
The most common Sales and Office occupations in Comanche Creek are Sales & Related (11 | 3.4%), and Office & Administration (9 | 2.7%).
Sales and Office Occupations by Sex
| Occupation | Male | Female |
| Sales & Related | 11 (100.0%) | 0 (0.0%) |
| Office & Administration | 0 (0.0%) | 9 (100.0%) |
| Total (Category) | 11 (55.0%) | 9 (45.0%) |
| Total (Overall) | 204 (62.2%) | 124 (37.8%) |
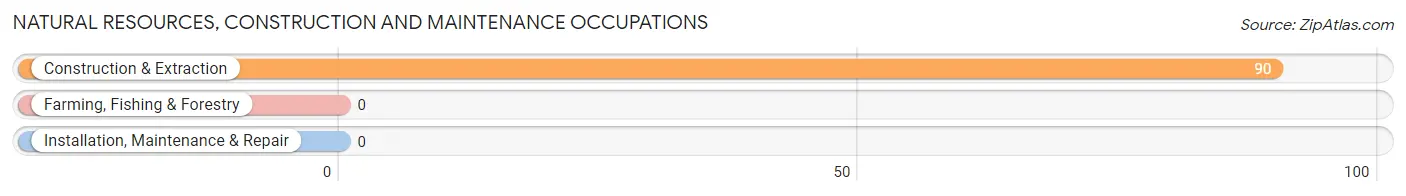
Natural Resources, Construction and Maintenance Occupations
The most common Natural Resources, Construction and Maintenance occupations in Comanche Creek are , and Construction & Extraction (90 | 27.4%).
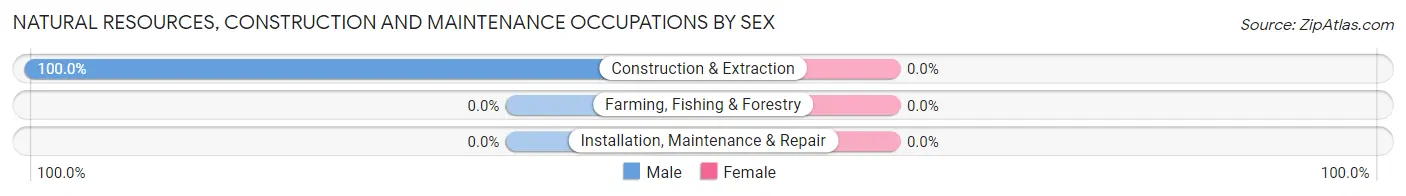
Natural Resources, Construction and Maintenance Occupations by Sex
| Occupation | Male | Female |
| Farming, Fishing & Forestry | 0 (0.0%) | 0 (0.0%) |
| Construction & Extraction | 90 (100.0%) | 0 (0.0%) |
| Installation, Maintenance & Repair | 0 (0.0%) | 0 (0.0%) |
| Total (Category) | 90 (100.0%) | 0 (0.0%) |
| Total (Overall) | 204 (62.2%) | 124 (37.8%) |
Production, Transportation and Moving Occupations
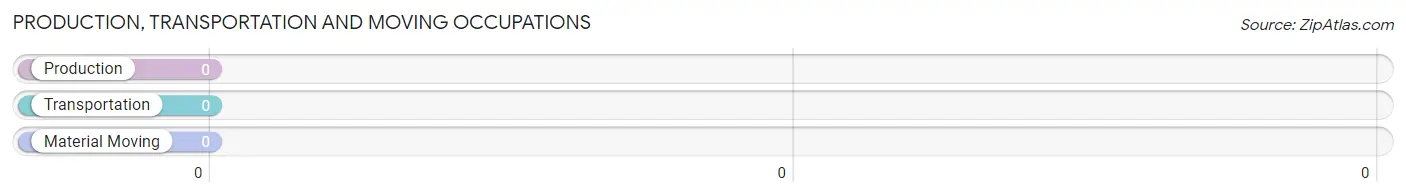
Production, Transportation and Moving Occupations by Sex
| Occupation | Male | Female |
| Production | 0 (0.0%) | 0 (0.0%) |
| Transportation | 0 (0.0%) | 0 (0.0%) |
| Material Moving | 0 (0.0%) | 0 (0.0%) |
| Total (Category) | 0 (0.0%) | 0 (0.0%) |
| Total (Overall) | 204 (62.2%) | 124 (37.8%) |
Employment Industries by Sex in Comanche Creek
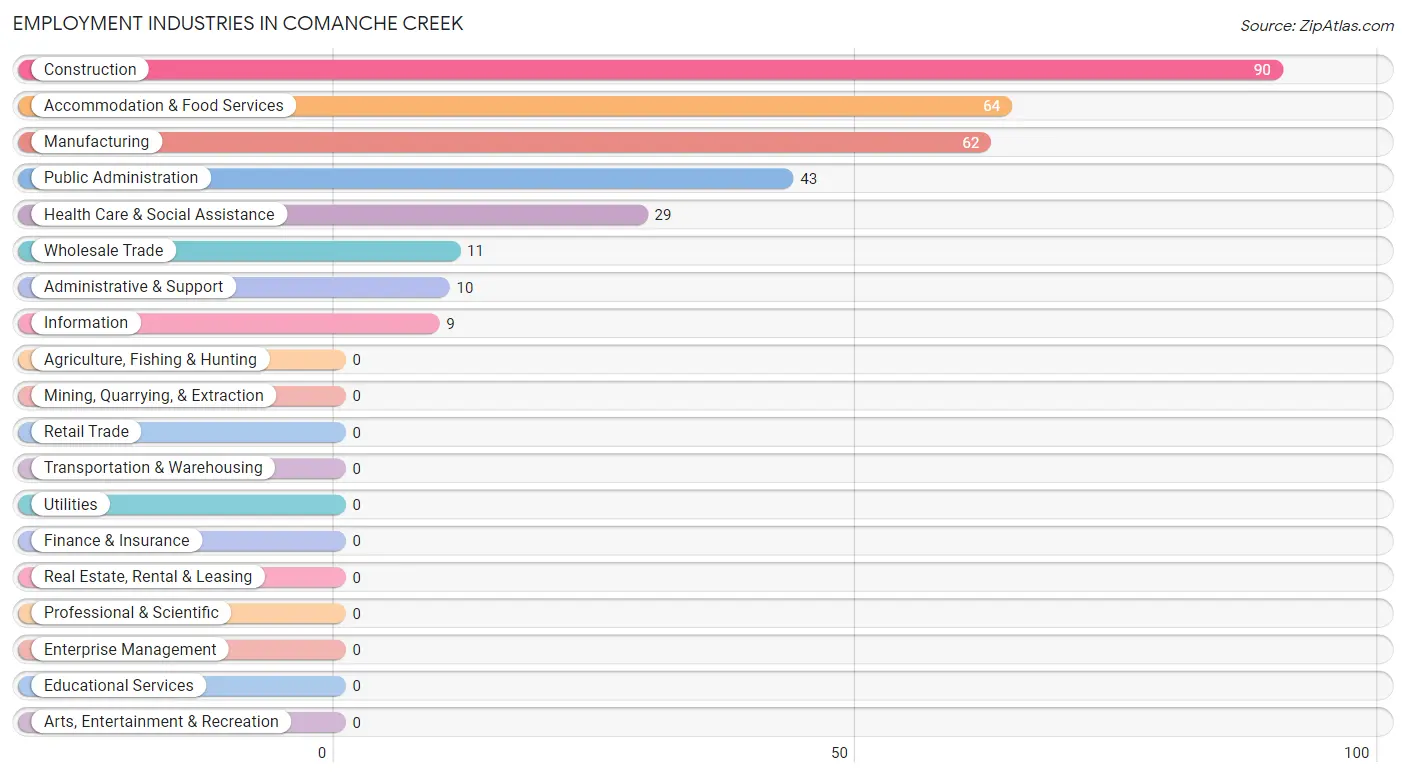
Employment Industries in Comanche Creek
The major employment industries in Comanche Creek include Construction (90 | 27.4%), Accommodation & Food Services (64 | 19.5%), Manufacturing (62 | 18.9%), Public Administration (43 | 13.1%), and Health Care & Social Assistance (29 | 8.8%).
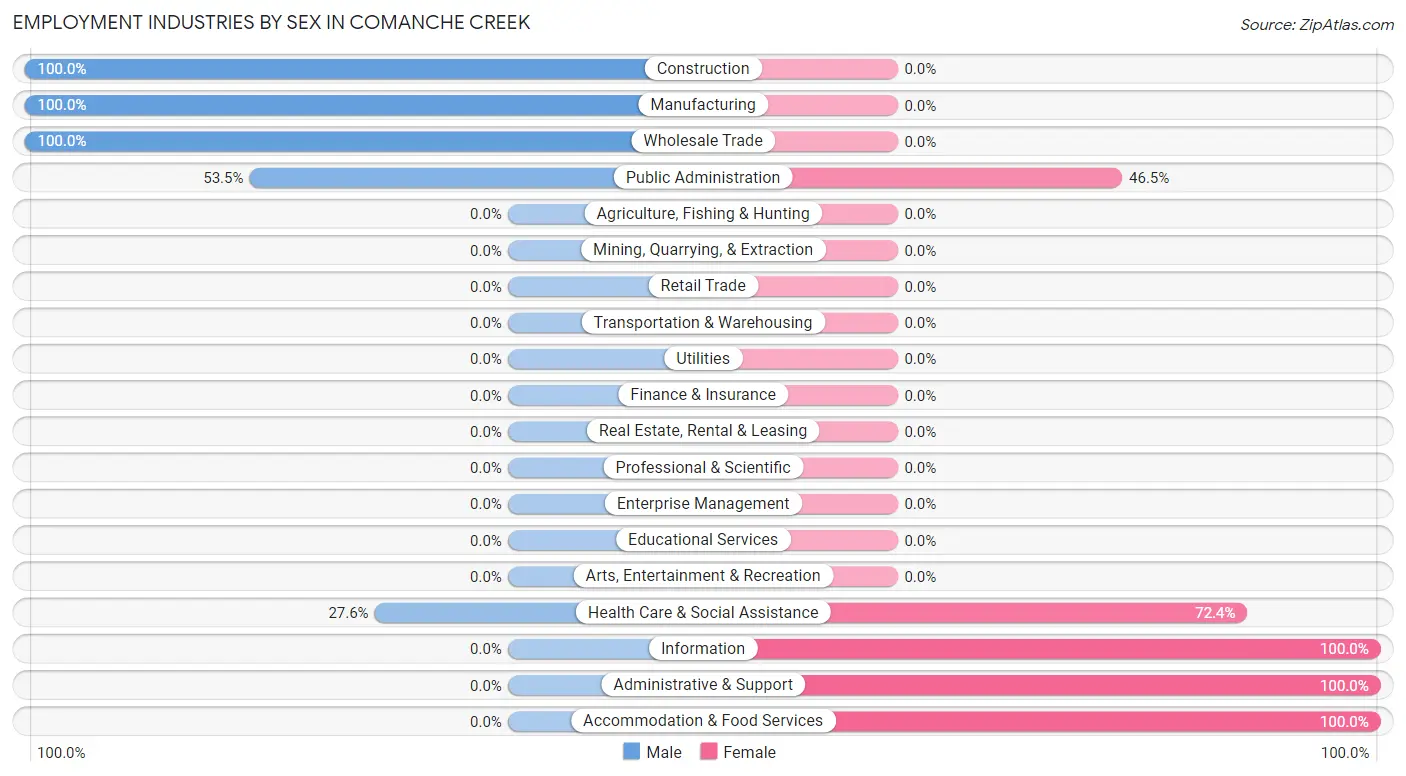
Employment Industries by Sex in Comanche Creek
The Comanche Creek industries that see more men than women are Construction (100.0%), Manufacturing (100.0%), and Wholesale Trade (100.0%), whereas the industries that tend to have a higher number of women are Information (100.0%), Administrative & Support (100.0%), and Accommodation & Food Services (100.0%).
| Industry | Male | Female |
| Agriculture, Fishing & Hunting | 0 (0.0%) | 0 (0.0%) |
| Mining, Quarrying, & Extraction | 0 (0.0%) | 0 (0.0%) |
| Construction | 90 (100.0%) | 0 (0.0%) |
| Manufacturing | 62 (100.0%) | 0 (0.0%) |
| Wholesale Trade | 11 (100.0%) | 0 (0.0%) |
| Retail Trade | 0 (0.0%) | 0 (0.0%) |
| Transportation & Warehousing | 0 (0.0%) | 0 (0.0%) |
| Utilities | 0 (0.0%) | 0 (0.0%) |
| Information | 0 (0.0%) | 9 (100.0%) |
| Finance & Insurance | 0 (0.0%) | 0 (0.0%) |
| Real Estate, Rental & Leasing | 0 (0.0%) | 0 (0.0%) |
| Professional & Scientific | 0 (0.0%) | 0 (0.0%) |
| Enterprise Management | 0 (0.0%) | 0 (0.0%) |
| Administrative & Support | 0 (0.0%) | 10 (100.0%) |
| Educational Services | 0 (0.0%) | 0 (0.0%) |
| Health Care & Social Assistance | 8 (27.6%) | 21 (72.4%) |
| Arts, Entertainment & Recreation | 0 (0.0%) | 0 (0.0%) |
| Accommodation & Food Services | 0 (0.0%) | 64 (100.0%) |
| Public Administration | 23 (53.5%) | 20 (46.5%) |
| Total | 204 (62.2%) | 124 (37.8%) |
Education in Comanche Creek
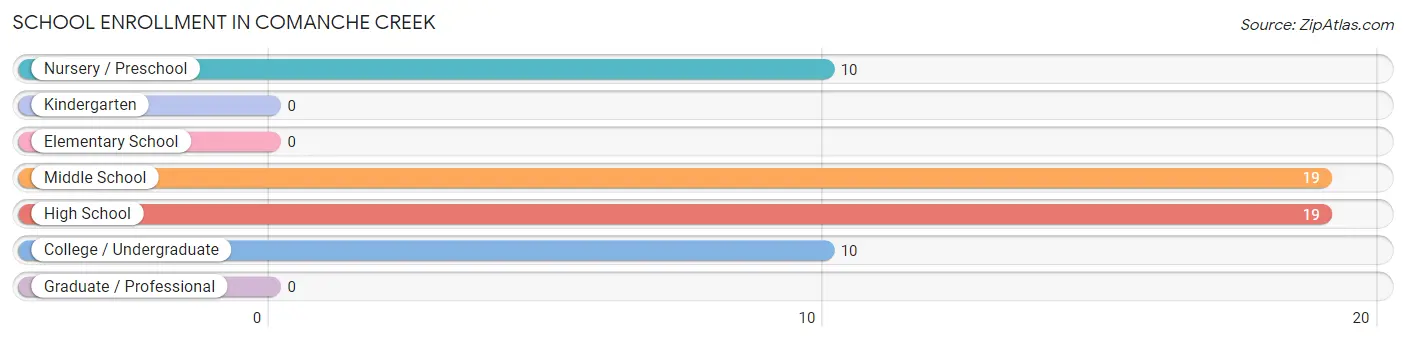
School Enrollment in Comanche Creek
The most common levels of schooling among the 58 students in Comanche Creek are middle school (19 | 32.8%), high school (19 | 32.8%), and nursery / preschool (10 | 17.2%).
| School Level | # Students | % Students |
| Nursery / Preschool | 10 | 17.2% |
| Kindergarten | 0 | 0.0% |
| Elementary School | 0 | 0.0% |
| Middle School | 19 | 32.8% |
| High School | 19 | 32.8% |
| College / Undergraduate | 10 | 17.2% |
| Graduate / Professional | 0 | 0.0% |
| Total | 58 | 100.0% |
School Enrollment by Age by Funding Source in Comanche Creek
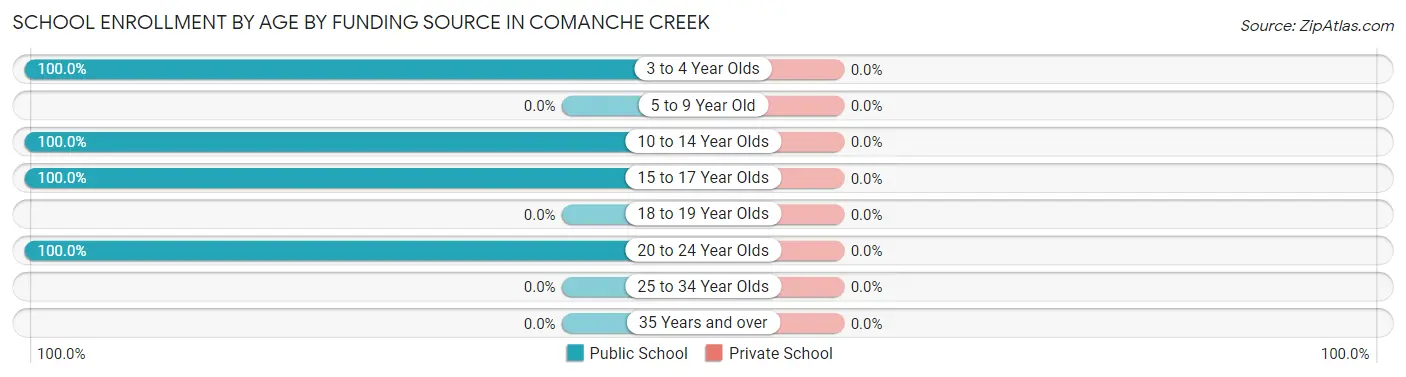
| Age Bracket | Public School | Private School |
| 3 to 4 Year Olds | 10 (100.0%) | 0 (0.0%) |
| 5 to 9 Year Old | 0 (0.0%) | 0 (0.0%) |
| 10 to 14 Year Olds | 30 (100.0%) | 0 (0.0%) |
| 15 to 17 Year Olds | 8 (100.0%) | 0 (0.0%) |
| 18 to 19 Year Olds | 0 (0.0%) | 0 (0.0%) |
| 20 to 24 Year Olds | 10 (100.0%) | 0 (0.0%) |
| 25 to 34 Year Olds | 0 (0.0%) | 0 (0.0%) |
| 35 Years and over | 0 (0.0%) | 0 (0.0%) |
| Total | 58 (100.0%) | 0 (0.0%) |
Educational Attainment by Field of Study in Comanche Creek
Communications (64 | 40.8%), business (62 | 39.5%), education (23 | 14.6%), and liberal arts & history (8 | 5.1%) are the most common fields of study among 157 individuals in Comanche Creek who have obtained a bachelor's degree or higher.
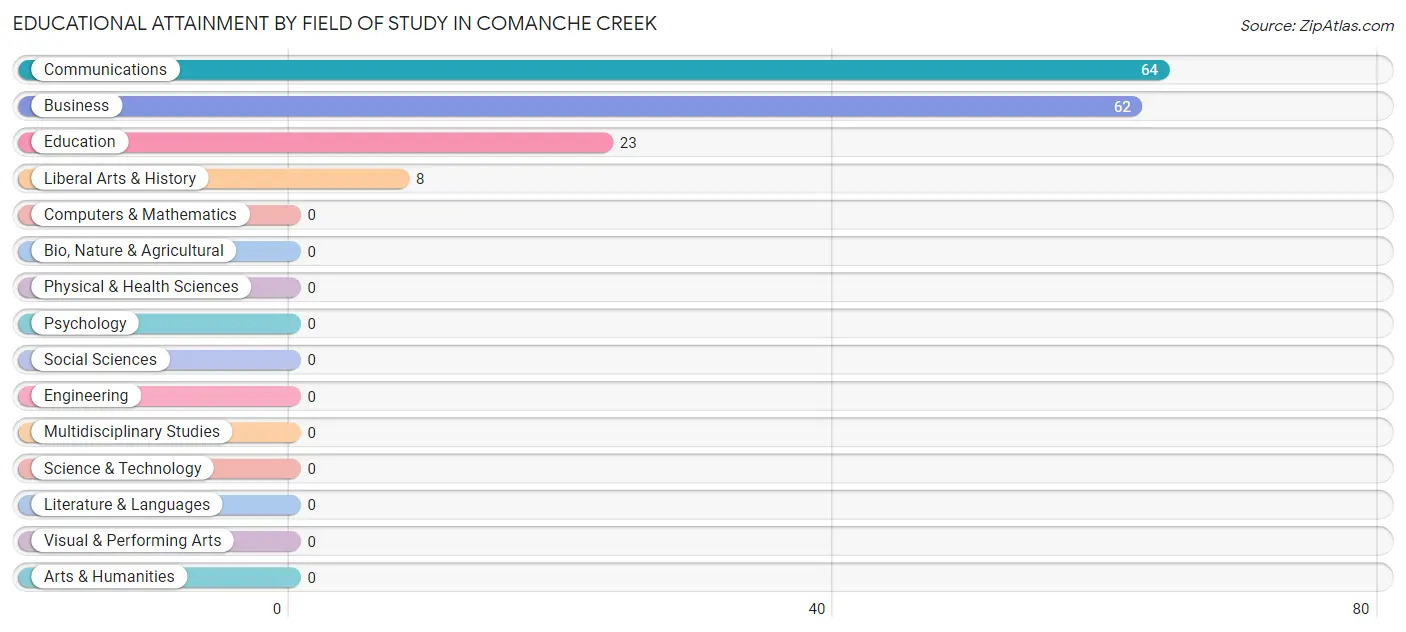
| Field of Study | # Graduates | % Graduates |
| Computers & Mathematics | 0 | 0.0% |
| Bio, Nature & Agricultural | 0 | 0.0% |
| Physical & Health Sciences | 0 | 0.0% |
| Psychology | 0 | 0.0% |
| Social Sciences | 0 | 0.0% |
| Engineering | 0 | 0.0% |
| Multidisciplinary Studies | 0 | 0.0% |
| Science & Technology | 0 | 0.0% |
| Business | 62 | 39.5% |
| Education | 23 | 14.6% |
| Literature & Languages | 0 | 0.0% |
| Liberal Arts & History | 8 | 5.1% |
| Visual & Performing Arts | 0 | 0.0% |
| Communications | 64 | 40.8% |
| Arts & Humanities | 0 | 0.0% |
| Total | 157 | 100.0% |
Transportation & Commute in Comanche Creek
Vehicle Availability by Sex in Comanche Creek
The most prevalent vehicle ownership categories in Comanche Creek are males with 4 vehicles (152, accounting for 74.5%) and females with 4 vehicles (75, making up 122.6%).
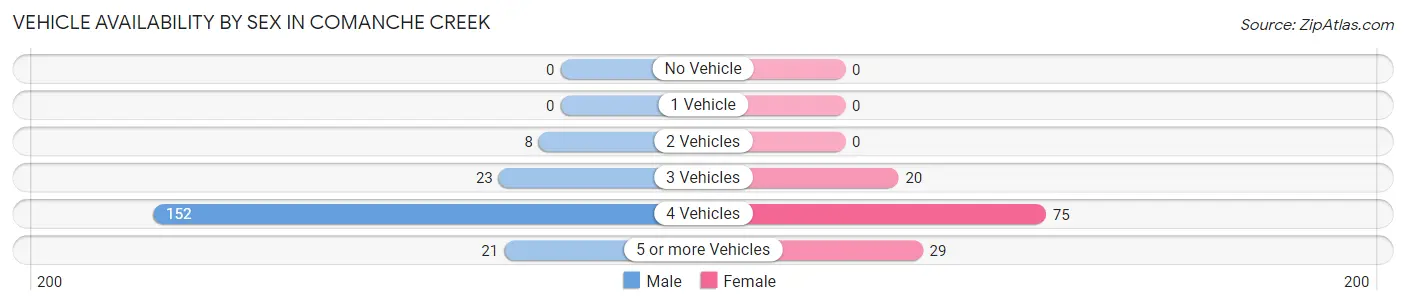
| Vehicles Available | Male | Female |
| No Vehicle | 0 (0.0%) | 0 (0.0%) |
| 1 Vehicle | 0 (0.0%) | 0 (0.0%) |
| 2 Vehicles | 8 (3.9%) | 0 (0.0%) |
| 3 Vehicles | 23 (11.3%) | 20 (16.1%) |
| 4 Vehicles | 152 (74.5%) | 75 (60.5%) |
| 5 or more Vehicles | 21 (10.3%) | 29 (23.4%) |
| Total | 204 (100.0%) | 124 (100.0%) |
Commute Time in Comanche Creek
The most frequently occuring commute durations in Comanche Creek are 60 to 89 minutes (102 commuters, 36.3%), 45 to 59 minutes (75 commuters, 26.7%), and 40 to 44 minutes (62 commuters, 22.1%).
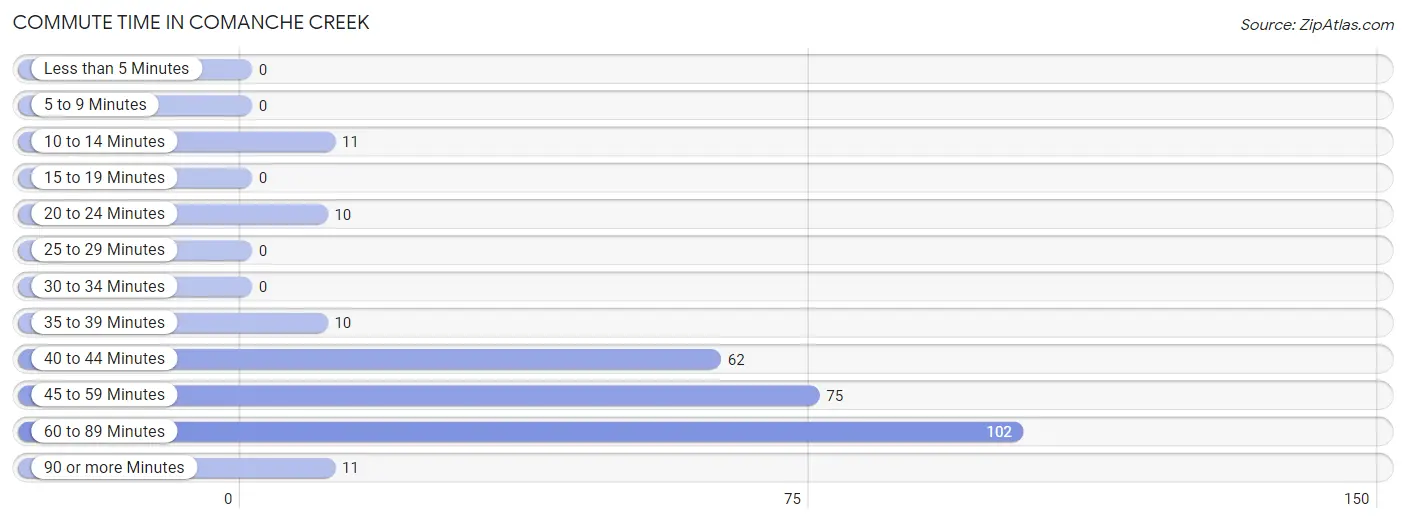
| Commute Time | # Commuters | % Commuters |
| Less than 5 Minutes | 0 | 0.0% |
| 5 to 9 Minutes | 0 | 0.0% |
| 10 to 14 Minutes | 11 | 3.9% |
| 15 to 19 Minutes | 0 | 0.0% |
| 20 to 24 Minutes | 10 | 3.6% |
| 25 to 29 Minutes | 0 | 0.0% |
| 30 to 34 Minutes | 0 | 0.0% |
| 35 to 39 Minutes | 10 | 3.6% |
| 40 to 44 Minutes | 62 | 22.1% |
| 45 to 59 Minutes | 75 | 26.7% |
| 60 to 89 Minutes | 102 | 36.3% |
| 90 or more Minutes | 11 | 3.9% |
Commute Time by Sex in Comanche Creek
The most common commute times in Comanche Creek are 60 to 89 minutes (102 commuters, 52.0%) for males and 45 to 59 minutes (64 commuters, 75.3%) for females.
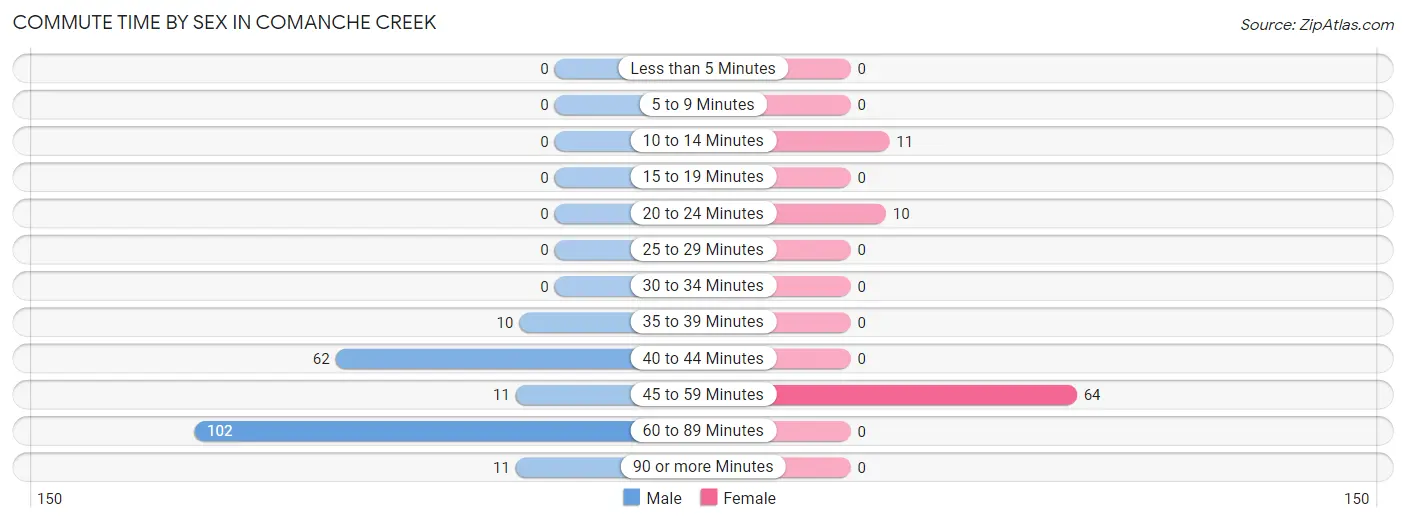
| Commute Time | Male | Female |
| Less than 5 Minutes | 0 (0.0%) | 0 (0.0%) |
| 5 to 9 Minutes | 0 (0.0%) | 0 (0.0%) |
| 10 to 14 Minutes | 0 (0.0%) | 11 (12.9%) |
| 15 to 19 Minutes | 0 (0.0%) | 0 (0.0%) |
| 20 to 24 Minutes | 0 (0.0%) | 10 (11.8%) |
| 25 to 29 Minutes | 0 (0.0%) | 0 (0.0%) |
| 30 to 34 Minutes | 0 (0.0%) | 0 (0.0%) |
| 35 to 39 Minutes | 10 (5.1%) | 0 (0.0%) |
| 40 to 44 Minutes | 62 (31.6%) | 0 (0.0%) |
| 45 to 59 Minutes | 11 (5.6%) | 64 (75.3%) |
| 60 to 89 Minutes | 102 (52.0%) | 0 (0.0%) |
| 90 or more Minutes | 11 (5.6%) | 0 (0.0%) |
Time of Departure to Work by Sex in Comanche Creek
The most frequent times of departure to work in Comanche Creek are 5:00 AM to 5:29 AM (79, 40.3%) for males and 10:00 AM to 10:59 AM (64, 75.3%) for females.
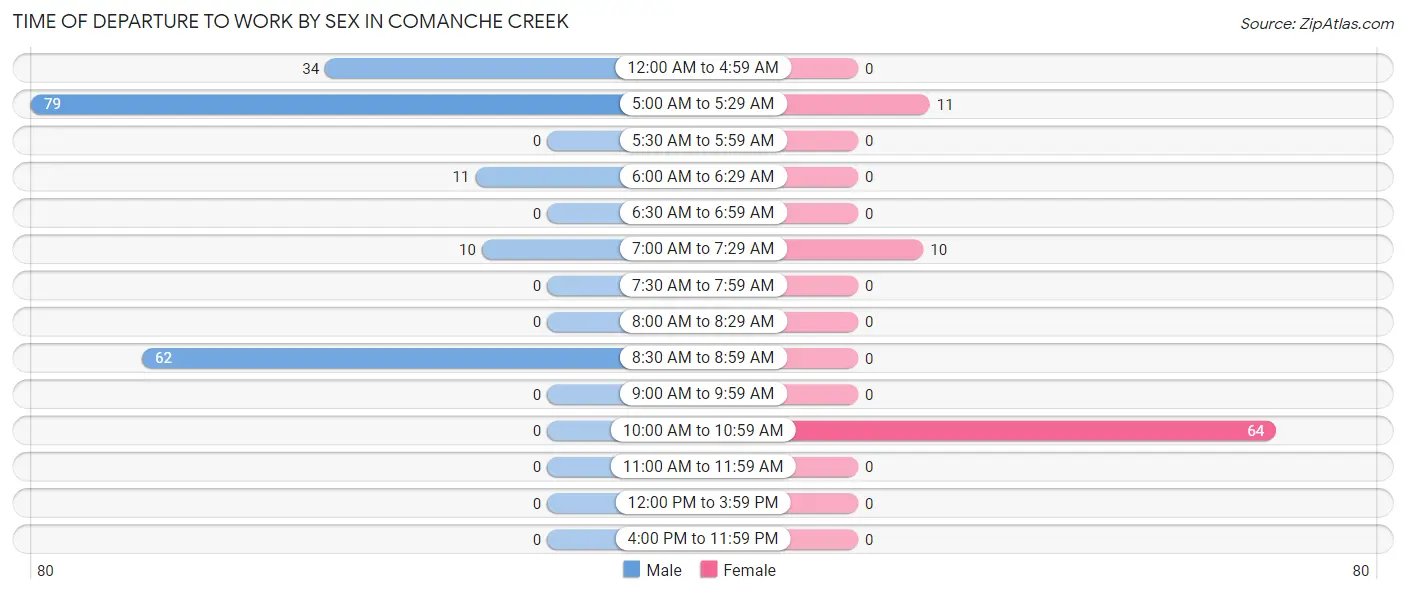
| Time of Departure | Male | Female |
| 12:00 AM to 4:59 AM | 34 (17.3%) | 0 (0.0%) |
| 5:00 AM to 5:29 AM | 79 (40.3%) | 11 (12.9%) |
| 5:30 AM to 5:59 AM | 0 (0.0%) | 0 (0.0%) |
| 6:00 AM to 6:29 AM | 11 (5.6%) | 0 (0.0%) |
| 6:30 AM to 6:59 AM | 0 (0.0%) | 0 (0.0%) |
| 7:00 AM to 7:29 AM | 10 (5.1%) | 10 (11.8%) |
| 7:30 AM to 7:59 AM | 0 (0.0%) | 0 (0.0%) |
| 8:00 AM to 8:29 AM | 0 (0.0%) | 0 (0.0%) |
| 8:30 AM to 8:59 AM | 62 (31.6%) | 0 (0.0%) |
| 9:00 AM to 9:59 AM | 0 (0.0%) | 0 (0.0%) |
| 10:00 AM to 10:59 AM | 0 (0.0%) | 64 (75.3%) |
| 11:00 AM to 11:59 AM | 0 (0.0%) | 0 (0.0%) |
| 12:00 PM to 3:59 PM | 0 (0.0%) | 0 (0.0%) |
| 4:00 PM to 11:59 PM | 0 (0.0%) | 0 (0.0%) |
| Total | 196 (100.0%) | 85 (100.0%) |
Housing Occupancy in Comanche Creek
Occupancy by Ownership in Comanche Creek
Of the total 124 dwellings in Comanche Creek, owner-occupied units account for 124 (100.0%), while renter-occupied units make up 0 (0.0%).
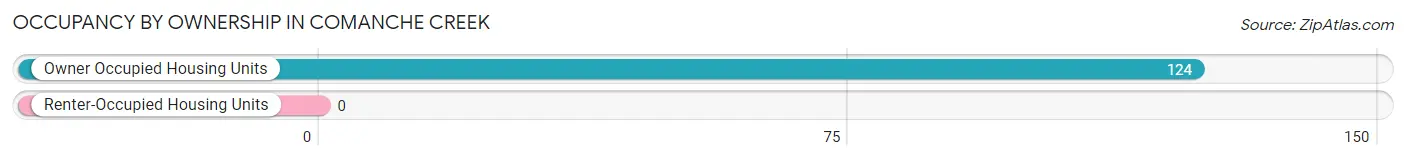
| Occupancy | # Housing Units | % Housing Units |
| Owner Occupied Housing Units | 124 | 100.0% |
| Renter-Occupied Housing Units | 0 | 0.0% |
| Total Occupied Housing Units | 124 | 100.0% |
Occupancy by Household Size in Comanche Creek
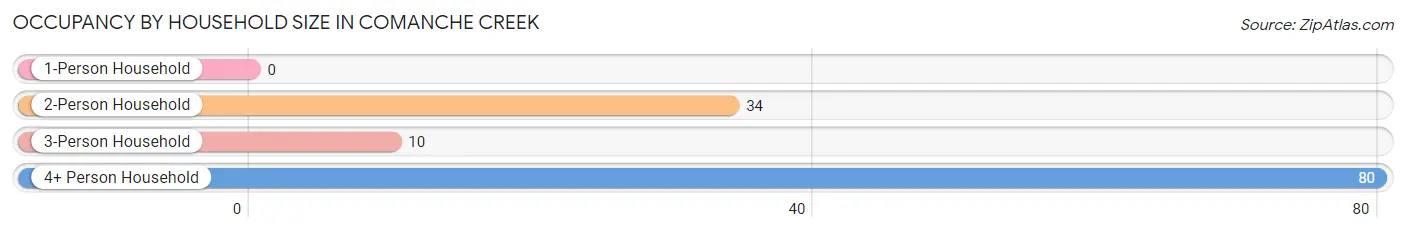
| Household Size | # Housing Units | % Housing Units |
| 1-Person Household | 0 | 0.0% |
| 2-Person Household | 34 | 27.4% |
| 3-Person Household | 10 | 8.1% |
| 4+ Person Household | 80 | 64.5% |
| Total Housing Units | 124 | 100.0% |
Occupancy by Ownership by Household Size in Comanche Creek
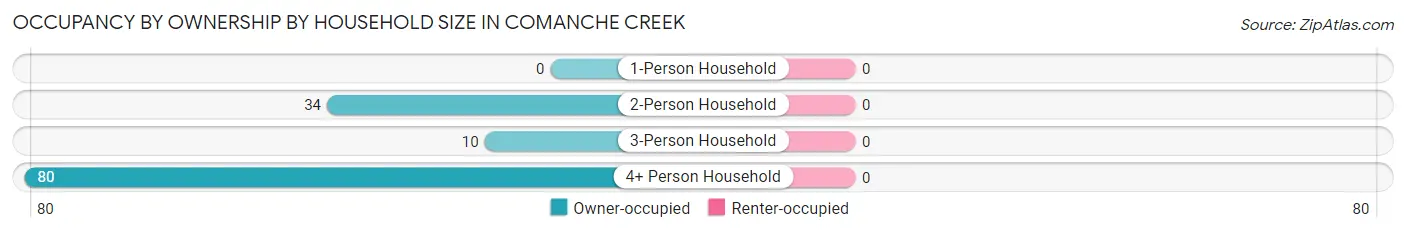
| Household Size | Owner-occupied | Renter-occupied |
| 1-Person Household | 0 (0.0%) | 0 (0.0%) |
| 2-Person Household | 34 (100.0%) | 0 (0.0%) |
| 3-Person Household | 10 (100.0%) | 0 (0.0%) |
| 4+ Person Household | 80 (100.0%) | 0 (0.0%) |
| Total Housing Units | 124 (100.0%) | 0 (0.0%) |
Occupancy by Educational Attainment in Comanche Creek
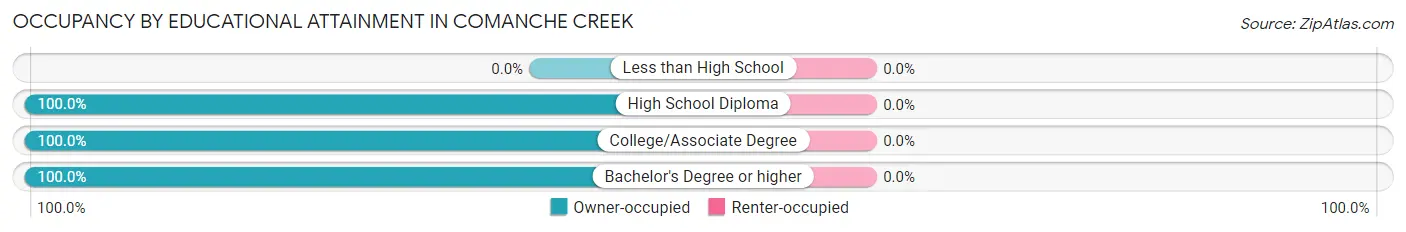
| Household Size | Owner-occupied | Renter-occupied |
| Less than High School | 0 (0.0%) | 0 (0.0%) |
| High School Diploma | 10 (100.0%) | 0 (0.0%) |
| College/Associate Degree | 29 (100.0%) | 0 (0.0%) |
| Bachelor's Degree or higher | 85 (100.0%) | 0 (0.0%) |
Occupancy by Age of Householder in Comanche Creek
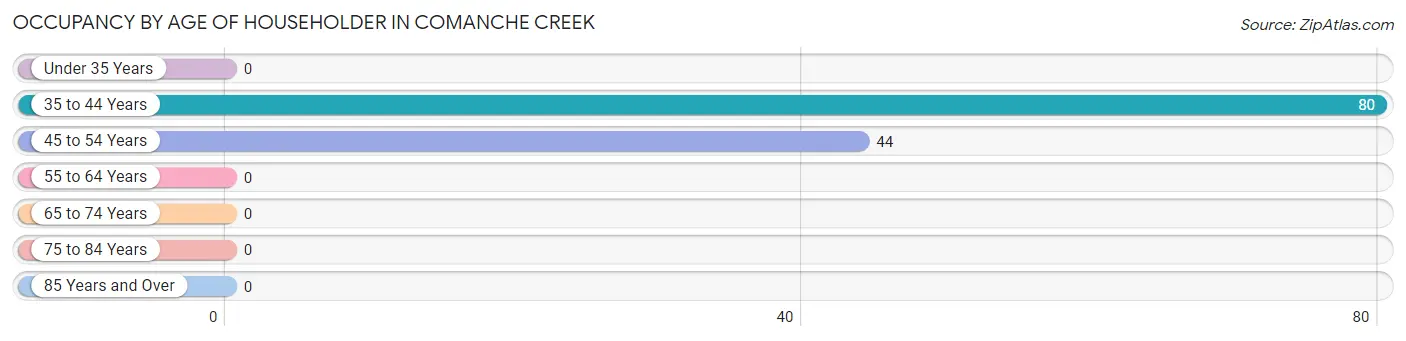
| Age Bracket | # Households | % Households |
| Under 35 Years | 0 | 0.0% |
| 35 to 44 Years | 80 | 64.5% |
| 45 to 54 Years | 44 | 35.5% |
| 55 to 64 Years | 0 | 0.0% |
| 65 to 74 Years | 0 | 0.0% |
| 75 to 84 Years | 0 | 0.0% |
| 85 Years and Over | 0 | 0.0% |
| Total | 124 | 100.0% |
Housing Finances in Comanche Creek
Median Income by Occupancy in Comanche Creek
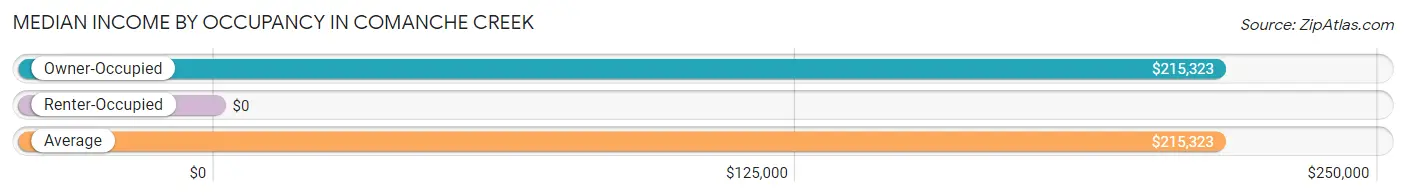
| Occupancy Type | # Households | Median Income |
| Owner-Occupied | 124 (100.0%) | $215,323 |
| Renter-Occupied | 0 (0.0%) | $0 |
| Average | 124 (100.0%) | $215,323 |
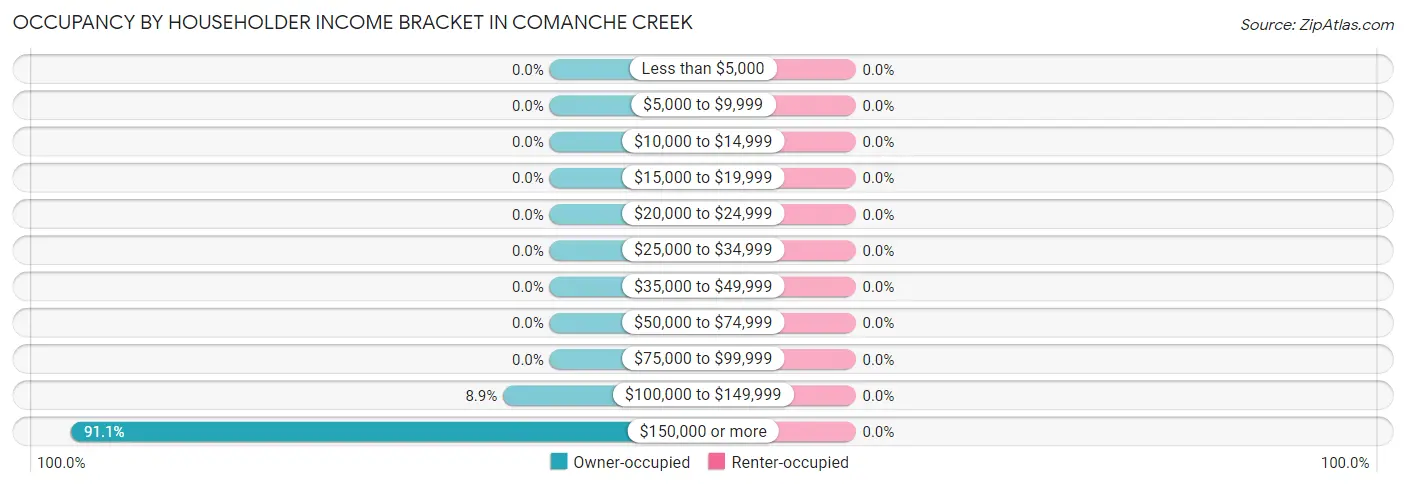
Occupancy by Householder Income Bracket in Comanche Creek
| Income Bracket | Owner-occupied | Renter-occupied |
| Less than $5,000 | 0 (0.0%) | 0 (0.0%) |
| $5,000 to $9,999 | 0 (0.0%) | 0 (0.0%) |
| $10,000 to $14,999 | 0 (0.0%) | 0 (0.0%) |
| $15,000 to $19,999 | 0 (0.0%) | 0 (0.0%) |
| $20,000 to $24,999 | 0 (0.0%) | 0 (0.0%) |
| $25,000 to $34,999 | 0 (0.0%) | 0 (0.0%) |
| $35,000 to $49,999 | 0 (0.0%) | 0 (0.0%) |
| $50,000 to $74,999 | 0 (0.0%) | 0 (0.0%) |
| $75,000 to $99,999 | 0 (0.0%) | 0 (0.0%) |
| $100,000 to $149,999 | 11 (8.9%) | 0 (0.0%) |
| $150,000 or more | 113 (91.1%) | 0 (0.0%) |
| Total | 124 (100.0%) | 0 (0.0%) |
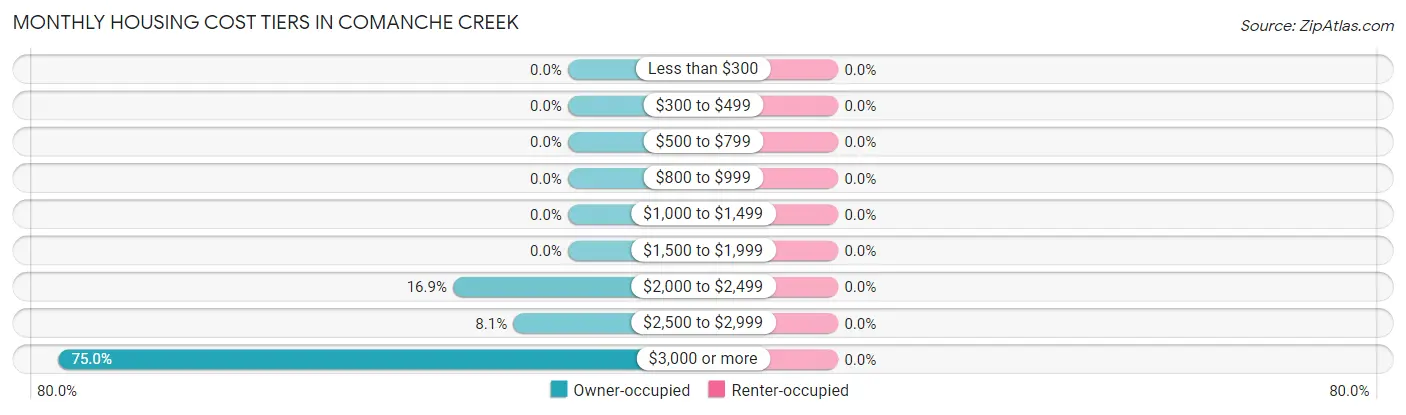
Monthly Housing Cost Tiers in Comanche Creek
| Monthly Cost | Owner-occupied | Renter-occupied |
| Less than $300 | 0 (0.0%) | 0 (0.0%) |
| $300 to $499 | 0 (0.0%) | 0 (0.0%) |
| $500 to $799 | 0 (0.0%) | 0 (0.0%) |
| $800 to $999 | 0 (0.0%) | 0 (0.0%) |
| $1,000 to $1,499 | 0 (0.0%) | 0 (0.0%) |
| $1,500 to $1,999 | 0 (0.0%) | 0 (0.0%) |
| $2,000 to $2,499 | 21 (16.9%) | 0 (0.0%) |
| $2,500 to $2,999 | 10 (8.1%) | 0 (0.0%) |
| $3,000 or more | 93 (75.0%) | 0 (0.0%) |
| Total | 124 (100.0%) | 0 (0.0%) |
Physical Housing Characteristics in Comanche Creek
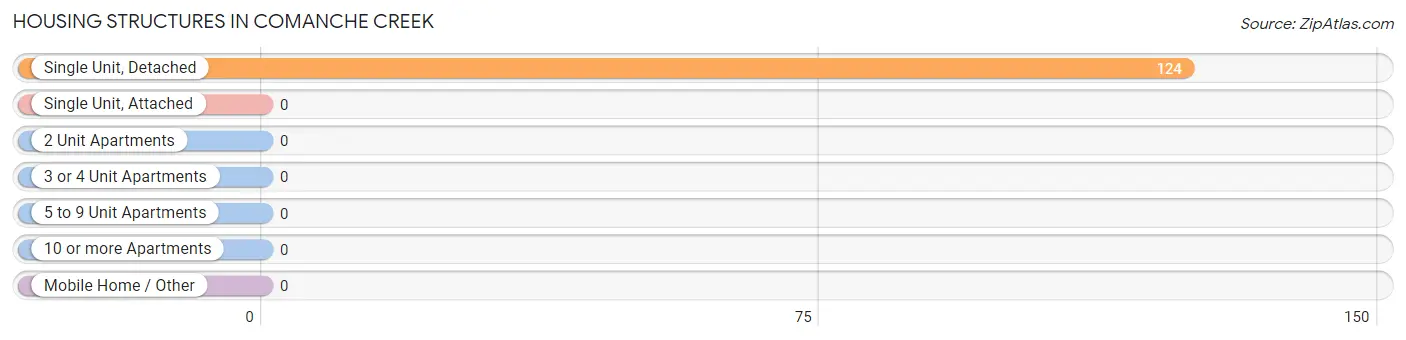
Housing Structures in Comanche Creek
| Structure Type | # Housing Units | % Housing Units |
| Single Unit, Detached | 124 | 100.0% |
| Single Unit, Attached | 0 | 0.0% |
| 2 Unit Apartments | 0 | 0.0% |
| 3 or 4 Unit Apartments | 0 | 0.0% |
| 5 to 9 Unit Apartments | 0 | 0.0% |
| 10 or more Apartments | 0 | 0.0% |
| Mobile Home / Other | 0 | 0.0% |
| Total | 124 | 100.0% |
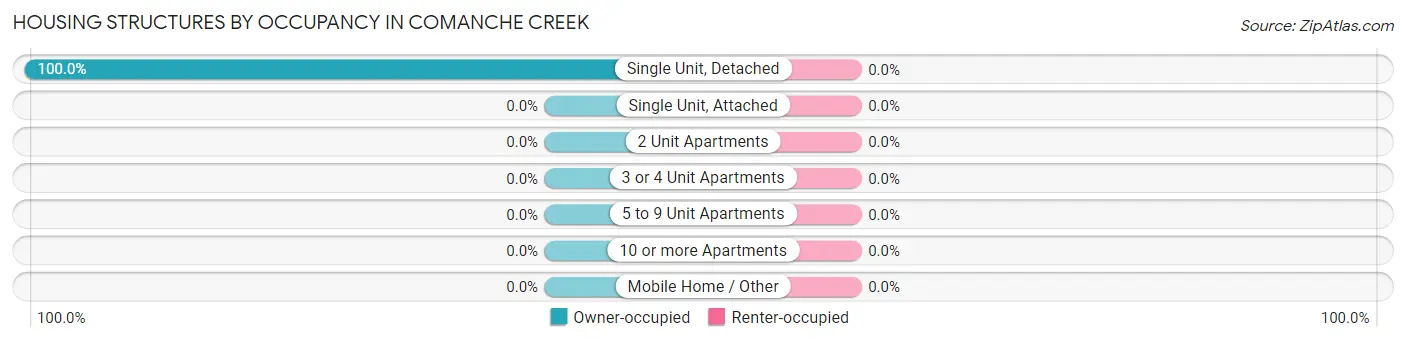
Housing Structures by Occupancy in Comanche Creek
| Structure Type | Owner-occupied | Renter-occupied |
| Single Unit, Detached | 124 (100.0%) | 0 (0.0%) |
| Single Unit, Attached | 0 (0.0%) | 0 (0.0%) |
| 2 Unit Apartments | 0 (0.0%) | 0 (0.0%) |
| 3 or 4 Unit Apartments | 0 (0.0%) | 0 (0.0%) |
| 5 to 9 Unit Apartments | 0 (0.0%) | 0 (0.0%) |
| 10 or more Apartments | 0 (0.0%) | 0 (0.0%) |
| Mobile Home / Other | 0 (0.0%) | 0 (0.0%) |
| Total | 124 (100.0%) | 0 (0.0%) |
Housing Structures by Number of Rooms in Comanche Creek
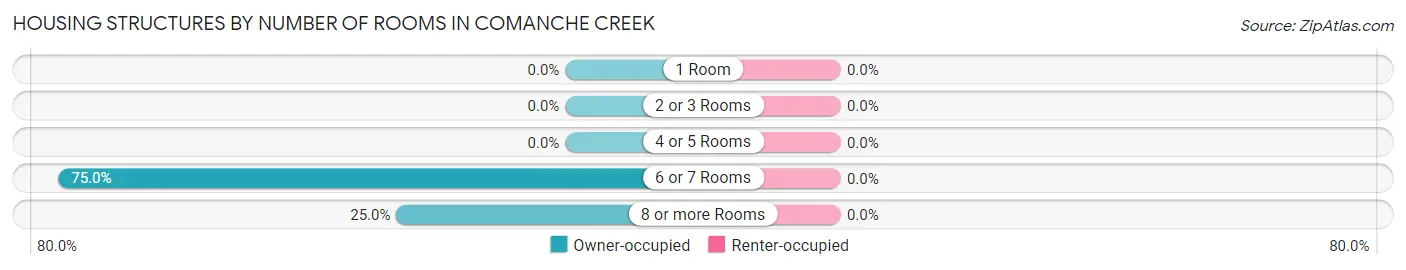
| Number of Rooms | Owner-occupied | Renter-occupied |
| 1 Room | 0 (0.0%) | 0 (0.0%) |
| 2 or 3 Rooms | 0 (0.0%) | 0 (0.0%) |
| 4 or 5 Rooms | 0 (0.0%) | 0 (0.0%) |
| 6 or 7 Rooms | 93 (75.0%) | 0 (0.0%) |
| 8 or more Rooms | 31 (25.0%) | 0 (0.0%) |
| Total | 124 (100.0%) | 0 (0.0%) |
Housing Structure by Heating Type in Comanche Creek
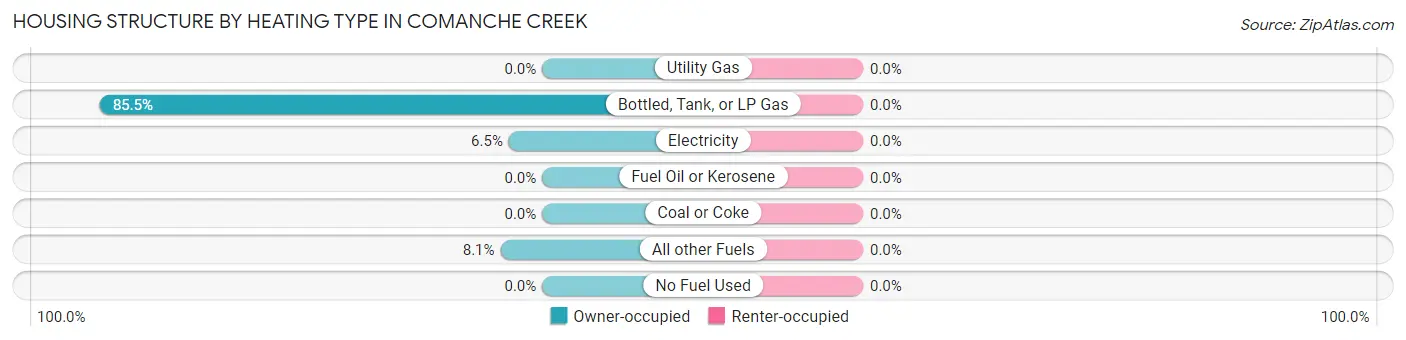
| Heating Type | Owner-occupied | Renter-occupied |
| Utility Gas | 0 (0.0%) | 0 (0.0%) |
| Bottled, Tank, or LP Gas | 106 (85.5%) | 0 (0.0%) |
| Electricity | 8 (6.5%) | 0 (0.0%) |
| Fuel Oil or Kerosene | 0 (0.0%) | 0 (0.0%) |
| Coal or Coke | 0 (0.0%) | 0 (0.0%) |
| All other Fuels | 10 (8.1%) | 0 (0.0%) |
| No Fuel Used | 0 (0.0%) | 0 (0.0%) |
| Total | 124 (100.0%) | 0 (0.0%) |
Household Vehicle Usage in Comanche Creek
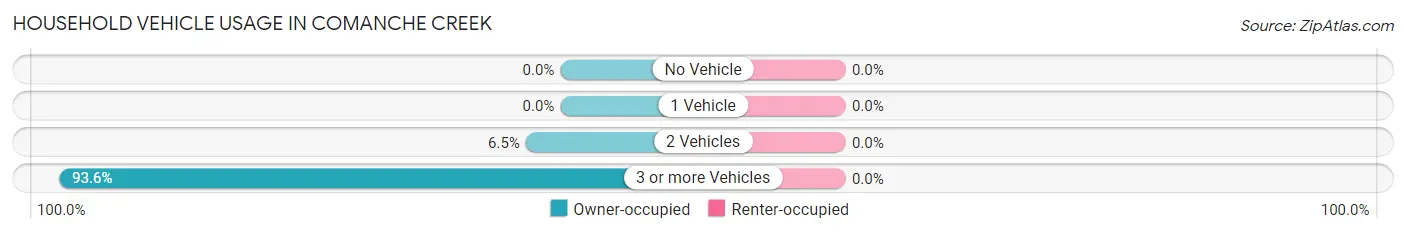
| Vehicles per Household | Owner-occupied | Renter-occupied |
| No Vehicle | 0 (0.0%) | 0 (0.0%) |
| 1 Vehicle | 0 (0.0%) | 0 (0.0%) |
| 2 Vehicles | 8 (6.5%) | 0 (0.0%) |
| 3 or more Vehicles | 116 (93.5%) | 0 (0.0%) |
| Total | 124 (100.0%) | 0 (0.0%) |
Real Estate & Mortgages in Comanche Creek
Real Estate and Mortgage Overview in Comanche Creek
| Characteristic | Without Mortgage | With Mortgage |
| Housing Units | 0 | 124 |
| Median Property Value | - | - |
| Median Household Income | - | - |
| Monthly Housing Costs | - | - |
| Real Estate Taxes | - | - |
Property Value by Mortgage Status in Comanche Creek
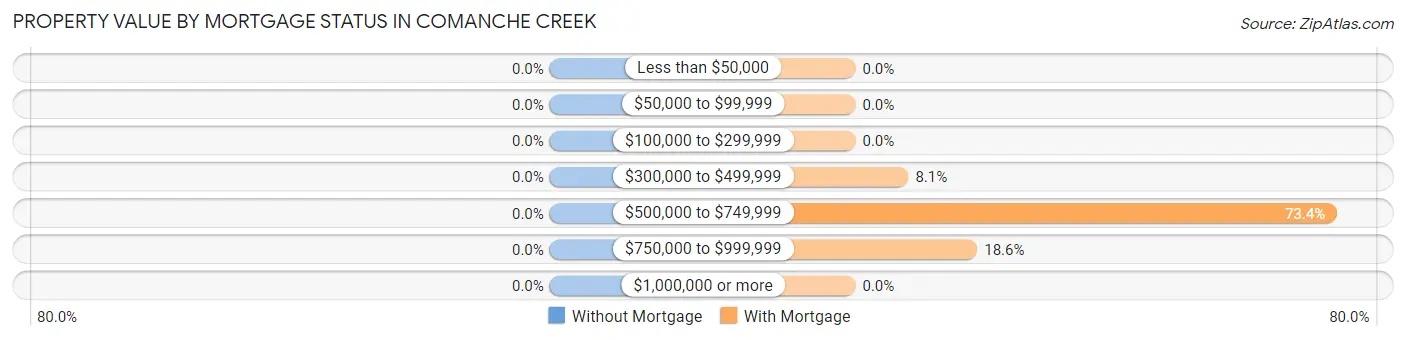
| Property Value | Without Mortgage | With Mortgage |
| Less than $50,000 | 0 (0.0%) | 0 (0.0%) |
| $50,000 to $99,999 | 0 (0.0%) | 0 (0.0%) |
| $100,000 to $299,999 | 0 (0.0%) | 0 (0.0%) |
| $300,000 to $499,999 | 0 (0.0%) | 10 (8.1%) |
| $500,000 to $749,999 | 0 (0.0%) | 91 (73.4%) |
| $750,000 to $999,999 | 0 (0.0%) | 23 (18.5%) |
| $1,000,000 or more | 0 (0.0%) | 0 (0.0%) |
| Total | 0 (0.0%) | 124 (100.0%) |
Household Income by Mortgage Status in Comanche Creek
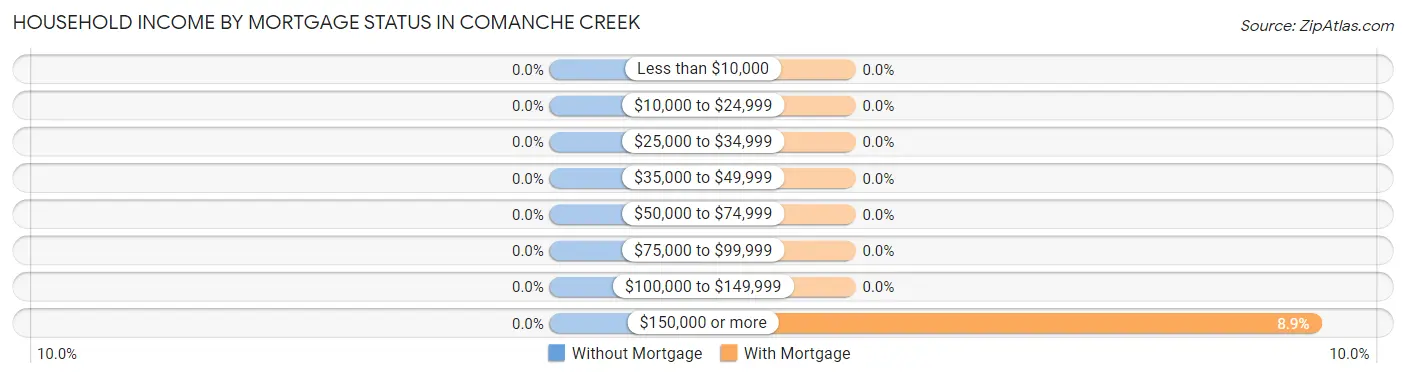
| Household Income | Without Mortgage | With Mortgage |
| Less than $10,000 | 0 (0.0%) | 0 (0.0%) |
| $10,000 to $24,999 | 0 (0.0%) | 0 (0.0%) |
| $25,000 to $34,999 | 0 (0.0%) | 0 (0.0%) |
| $35,000 to $49,999 | 0 (0.0%) | 0 (0.0%) |
| $50,000 to $74,999 | 0 (0.0%) | 0 (0.0%) |
| $75,000 to $99,999 | 0 (0.0%) | 0 (0.0%) |
| $100,000 to $149,999 | 0 (0.0%) | 0 (0.0%) |
| $150,000 or more | 0 (0.0%) | 11 (8.9%) |
| Total | 0 (0.0%) | 124 (100.0%) |
Property Value to Household Income Ratio in Comanche Creek
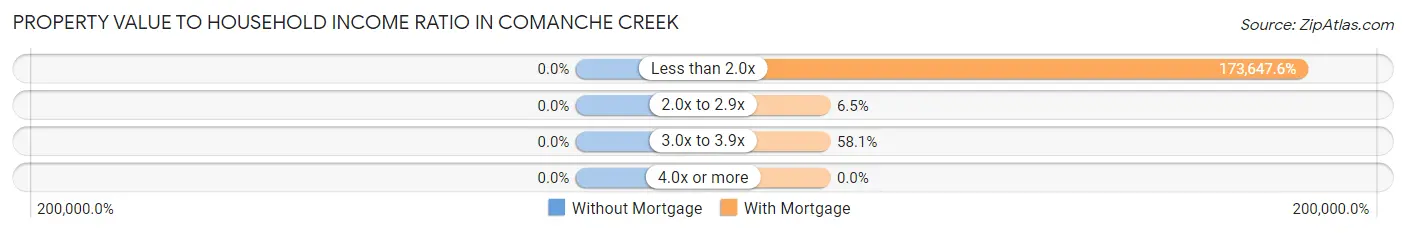
| Value-to-Income Ratio | Without Mortgage | With Mortgage |
| Less than 2.0x | 0 (0.0%) | 215,323 (173,647.6%) |
| 2.0x to 2.9x | 0 (0.0%) | 8 (6.5%) |
| 3.0x to 3.9x | 0 (0.0%) | 72 (58.1%) |
| 4.0x or more | 0 (0.0%) | 0 (0.0%) |
| Total | 0 (0.0%) | 124 (100.0%) |
Real Estate Taxes by Mortgage Status in Comanche Creek
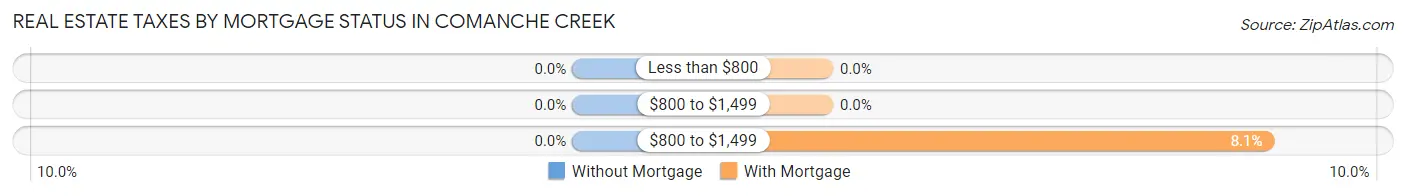
| Property Taxes | Without Mortgage | With Mortgage |
| Less than $800 | 0 (0.0%) | 0 (0.0%) |
| $800 to $1,499 | 0 (0.0%) | 0 (0.0%) |
| $800 to $1,499 | 0 (0.0%) | 10 (8.1%) |
| Total | 0 (0.0%) | 124 (100.0%) |
Health & Disability in Comanche Creek
Health Insurance Coverage by Age in Comanche Creek
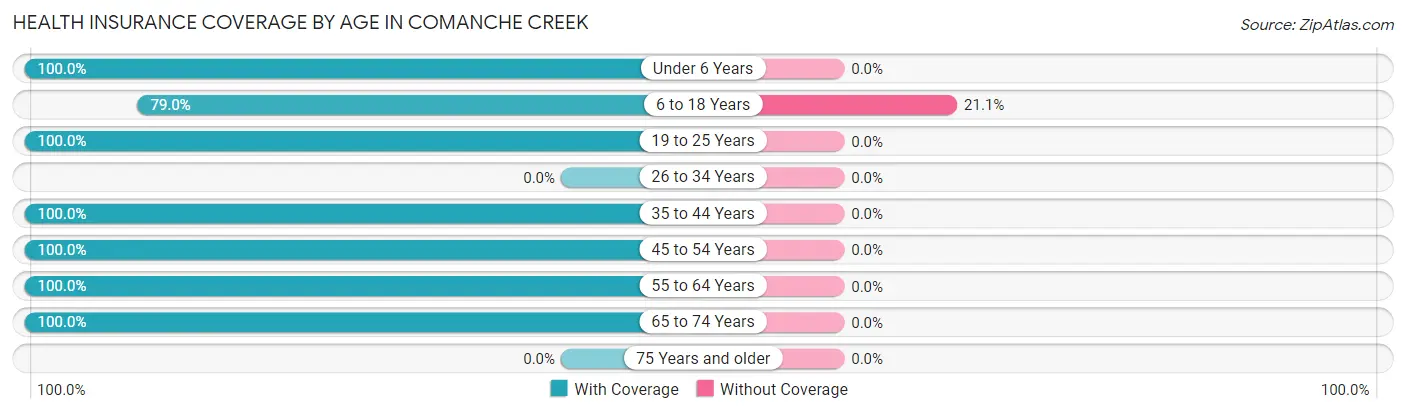
| Age Bracket | With Coverage | Without Coverage |
| Under 6 Years | 10 (100.0%) | 0 (0.0%) |
| 6 to 18 Years | 30 (78.9%) | 8 (21.0%) |
| 19 to 25 Years | 10 (100.0%) | 0 (0.0%) |
| 26 to 34 Years | 0 (0.0%) | 0 (0.0%) |
| 35 to 44 Years | 88 (100.0%) | 0 (0.0%) |
| 45 to 54 Years | 163 (100.0%) | 0 (0.0%) |
| 55 to 64 Years | 75 (100.0%) | 0 (0.0%) |
| 65 to 74 Years | 146 (100.0%) | 0 (0.0%) |
| 75 Years and older | 0 (0.0%) | 0 (0.0%) |
| Total | 522 (98.5%) | 8 (1.5%) |
Health Insurance Coverage by Citizenship Status in Comanche Creek
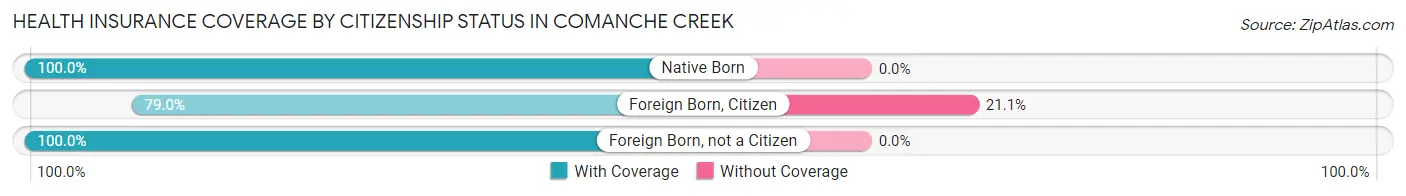
| Citizenship Status | With Coverage | Without Coverage |
| Native Born | 10 (100.0%) | 0 (0.0%) |
| Foreign Born, Citizen | 30 (78.9%) | 8 (21.0%) |
| Foreign Born, not a Citizen | 10 (100.0%) | 0 (0.0%) |
Health Insurance Coverage by Household Income in Comanche Creek
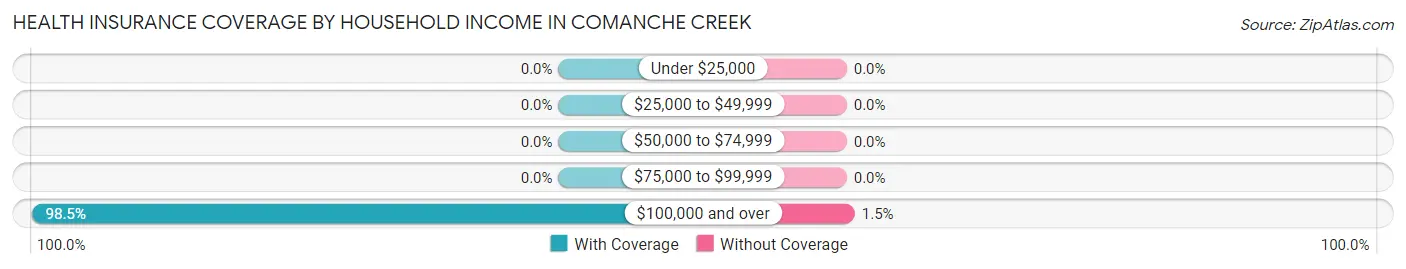
| Household Income | With Coverage | Without Coverage |
| Under $25,000 | 0 (0.0%) | 0 (0.0%) |
| $25,000 to $49,999 | 0 (0.0%) | 0 (0.0%) |
| $50,000 to $74,999 | 0 (0.0%) | 0 (0.0%) |
| $75,000 to $99,999 | 0 (0.0%) | 0 (0.0%) |
| $100,000 and over | 522 (98.5%) | 8 (1.5%) |
Public vs Private Health Insurance Coverage by Age in Comanche Creek
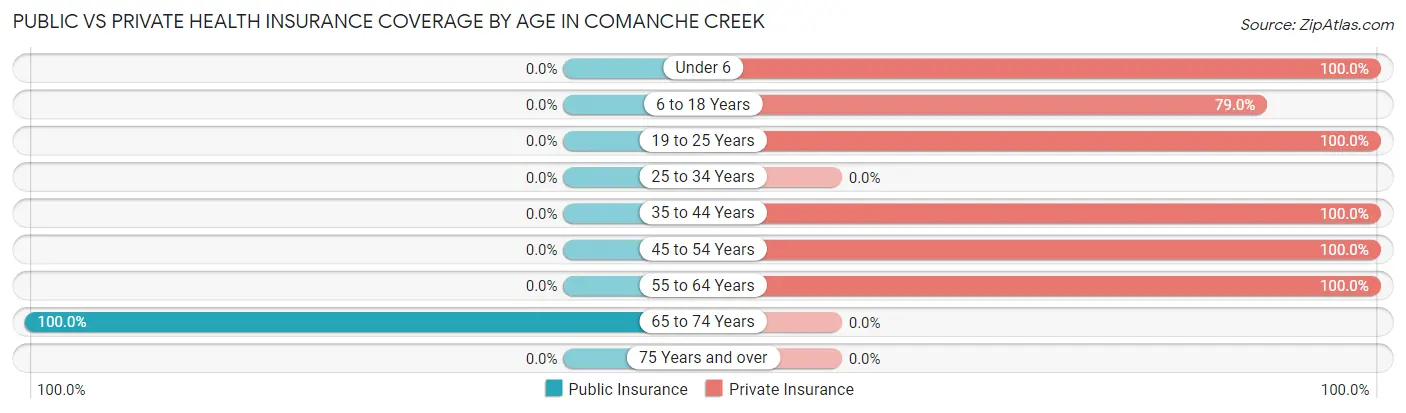
| Age Bracket | Public Insurance | Private Insurance |
| Under 6 | 0 (0.0%) | 10 (100.0%) |
| 6 to 18 Years | 0 (0.0%) | 30 (78.9%) |
| 19 to 25 Years | 0 (0.0%) | 10 (100.0%) |
| 25 to 34 Years | 0 (0.0%) | 0 (0.0%) |
| 35 to 44 Years | 0 (0.0%) | 88 (100.0%) |
| 45 to 54 Years | 0 (0.0%) | 163 (100.0%) |
| 55 to 64 Years | 0 (0.0%) | 75 (100.0%) |
| 65 to 74 Years | 146 (100.0%) | 0 (0.0%) |
| 75 Years and over | 0 (0.0%) | 0 (0.0%) |
| Total | 146 (27.6%) | 376 (70.9%) |
Disability Status by Sex by Age in Comanche Creek
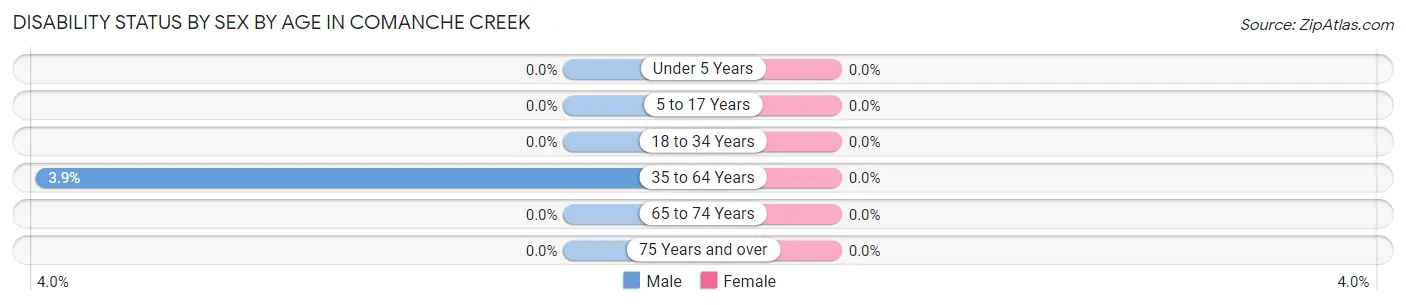
| Age Bracket | Male | Female |
| Under 5 Years | 0 (0.0%) | 0 (0.0%) |
| 5 to 17 Years | 0 (0.0%) | 0 (0.0%) |
| 18 to 34 Years | 0 (0.0%) | 0 (0.0%) |
| 35 to 64 Years | 8 (3.9%) | 0 (0.0%) |
| 65 to 74 Years | 0 (0.0%) | 0 (0.0%) |
| 75 Years and over | 0 (0.0%) | 0 (0.0%) |
Disability Class by Sex by Age in Comanche Creek
Disability Class: Hearing Difficulty
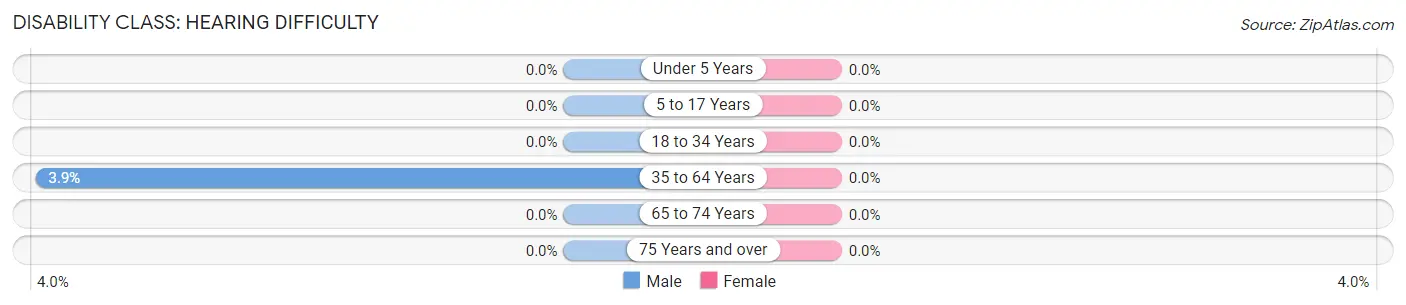
| Age Bracket | Male | Female |
| Under 5 Years | 0 (0.0%) | 0 (0.0%) |
| 5 to 17 Years | 0 (0.0%) | 0 (0.0%) |
| 18 to 34 Years | 0 (0.0%) | 0 (0.0%) |
| 35 to 64 Years | 8 (3.9%) | 0 (0.0%) |
| 65 to 74 Years | 0 (0.0%) | 0 (0.0%) |
| 75 Years and over | 0 (0.0%) | 0 (0.0%) |
Disability Class: Vision Difficulty
| Age Bracket | Male | Female |
| Under 5 Years | 0 (0.0%) | 0 (0.0%) |
| 5 to 17 Years | 0 (0.0%) | 0 (0.0%) |
| 18 to 34 Years | 0 (0.0%) | 0 (0.0%) |
| 35 to 64 Years | 0 (0.0%) | 0 (0.0%) |
| 65 to 74 Years | 0 (0.0%) | 0 (0.0%) |
| 75 Years and over | 0 (0.0%) | 0 (0.0%) |
Disability Class: Cognitive Difficulty
| Age Bracket | Male | Female |
| 5 to 17 Years | 0 (0.0%) | 0 (0.0%) |
| 18 to 34 Years | 0 (0.0%) | 0 (0.0%) |
| 35 to 64 Years | 0 (0.0%) | 0 (0.0%) |
| 65 to 74 Years | 0 (0.0%) | 0 (0.0%) |
| 75 Years and over | 0 (0.0%) | 0 (0.0%) |
Disability Class: Ambulatory Difficulty
| Age Bracket | Male | Female |
| 5 to 17 Years | 0 (0.0%) | 0 (0.0%) |
| 18 to 34 Years | 0 (0.0%) | 0 (0.0%) |
| 35 to 64 Years | 0 (0.0%) | 0 (0.0%) |
| 65 to 74 Years | 0 (0.0%) | 0 (0.0%) |
| 75 Years and over | 0 (0.0%) | 0 (0.0%) |
Disability Class: Self-Care Difficulty
| Age Bracket | Male | Female |
| 5 to 17 Years | 0 (0.0%) | 0 (0.0%) |
| 18 to 34 Years | 0 (0.0%) | 0 (0.0%) |
| 35 to 64 Years | 0 (0.0%) | 0 (0.0%) |
| 65 to 74 Years | 0 (0.0%) | 0 (0.0%) |
| 75 Years and over | 0 (0.0%) | 0 (0.0%) |
Technology Access in Comanche Creek
Computing Device Access in Comanche Creek
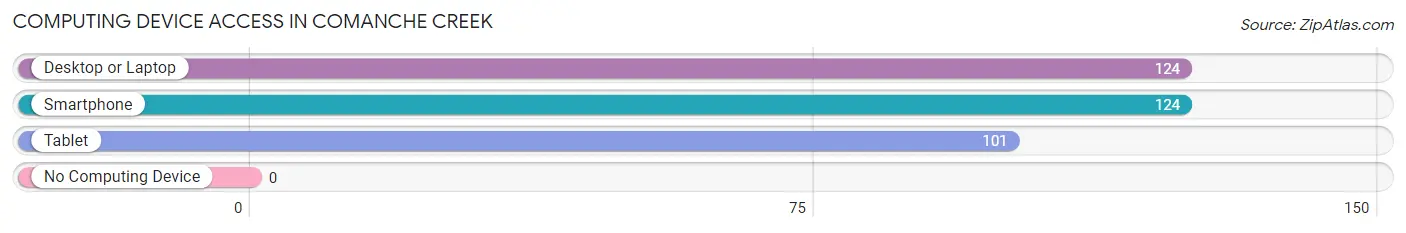
| Device Type | # Households | % Households |
| Desktop or Laptop | 124 | 100.0% |
| Smartphone | 124 | 100.0% |
| Tablet | 101 | 81.5% |
| No Computing Device | 0 | 0.0% |
| Total | 124 | 100.0% |
Internet Access in Comanche Creek
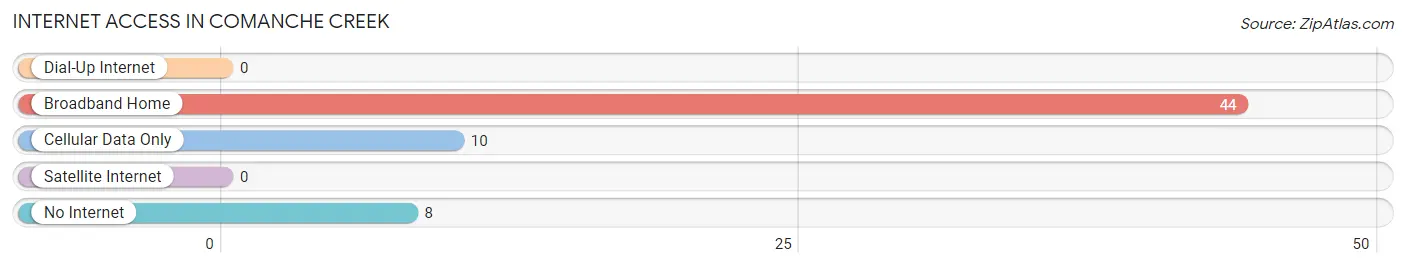
| Internet Type | # Households | % Households |
| Dial-Up Internet | 0 | 0.0% |
| Broadband Home | 44 | 35.5% |
| Cellular Data Only | 10 | 8.1% |
| Satellite Internet | 0 | 0.0% |
| No Internet | 8 | 6.5% |
| Total | 124 | 100.0% |
Comanche Creek Summary
Comanche Creek is a small unincorporated community located in the San Luis Valley of Colorado. It is situated in the northern part of the valley, approximately 20 miles south of Alamosa and 40 miles north of Monte Vista. The community is located in the San Luis Valley, which is the largest alpine valley in the world. The valley is surrounded by the Sangre de Cristo Mountains to the east and the San Juan Mountains to the west.
History
Comanche Creek was first settled in the late 1800s by ranchers and farmers. The area was originally inhabited by the Ute Indians, who were later displaced by the settlers. The first settlers were mostly of Spanish and Mexican descent, and the area was known as “El Valle de los Comanches”, or “Valley of the Comanches”. The name was later changed to Comanche Creek.
The area was originally used for ranching and farming, but in the early 1900s, the area began to be used for mining. The first mine in the area was the Comanche Creek Mine, which was opened in 1906. The mine was operated by the Comanche Creek Mining Company, and it produced gold, silver, and copper. The mine was eventually closed in the 1930s due to a lack of ore.
Geography
Comanche Creek is located in the San Luis Valley of Colorado. The valley is surrounded by the Sangre de Cristo Mountains to the east and the San Juan Mountains to the west. The valley is approximately 8,000 feet above sea level and is the largest alpine valley in the world. The area is known for its wide open spaces, and the valley is home to a variety of wildlife, including elk, deer, antelope, and bighorn sheep.
The climate in the area is semi-arid, with hot summers and cold winters. The average annual temperature is around 50 degrees Fahrenheit, and the average annual precipitation is around 10 inches.
Economy
The economy of Comanche Creek is largely based on agriculture and ranching. The area is home to several large farms and ranches, and the area is known for its production of hay, alfalfa, and other crops. The area is also home to several small businesses, including a gas station, a grocery store, and a few restaurants.
The area is also home to several recreational activities, including camping, fishing, and hunting. The area is also home to several ski resorts, including Wolf Creek Ski Area and Monarch Mountain.
Demographics
As of the 2010 census, the population of Comanche Creek was 545. The population is mostly of Hispanic or Latino descent, and the median age is 37. The median household income is $35,000, and the median home value is $150,000. The area is mostly rural, and the majority of the population is employed in agriculture and ranching.
Conclusion
Comanche Creek is a small unincorporated community located in the San Luis Valley of Colorado. The area was originally inhabited by the Ute Indians, and it was later settled by ranchers and farmers in the late 1800s. The area is known for its wide open spaces and its production of hay, alfalfa, and other crops. The population of Comanche Creek is mostly of Hispanic or Latino descent, and the area is home to several small businesses and recreational activities. The area is also home to several ski resorts, and the majority of the population is employed in agriculture and ranching.
Common Questions
What is the Total Population of Comanche Creek?
Total Population of Comanche Creek is 530.
What is the Total Male Population of Comanche Creek?
Total Male Population of Comanche Creek is 222.
What is the Total Female Population of Comanche Creek?
Total Female Population of Comanche Creek is 308.
What is the Ratio of Males per 100 Females in Comanche Creek?
There are 72.08 Males per 100 Females in Comanche Creek.
What is the Ratio of Females per 100 Males in Comanche Creek?
There are 138.74 Females per 100 Males in Comanche Creek.
What is the Median Population Age in Comanche Creek?
Median Population Age in Comanche Creek is 51.8 Years.
What is the Average Family Size in Comanche Creek
Average Family Size in Comanche Creek is 4.3 People.
What is the Average Household Size in Comanche Creek
Average Household Size in Comanche Creek is 4.3 People.
What is Per Capita Income in Comanche Creek?
Per Capita income in Comanche Creek is $51,195.
What is the Median Family Income in Comanche Creek?
Median Family Income in Comanche Creek is $215,323.
What is the Median Household income in Comanche Creek?
Median Household Income in Comanche Creek is $215,323.
What is Income or Wage Gap in Comanche Creek?
Income or Wage Gap in Comanche Creek is 36.9%.
Women in Comanche Creek earn 63.1 cents for every dollar earned by a man.
What is Inequality or Gini Index in Comanche Creek?
Inequality or Gini Index in Comanche Creek is 0.15.
How Large is the Labor Force in Comanche Creek?
There are 328 People in the Labor Forcein in Comanche Creek.
What is the Percentage of People in the Labor Force in Comanche Creek?
66.9% of People are in the Labor Force in Comanche Creek.