Weld County, CO
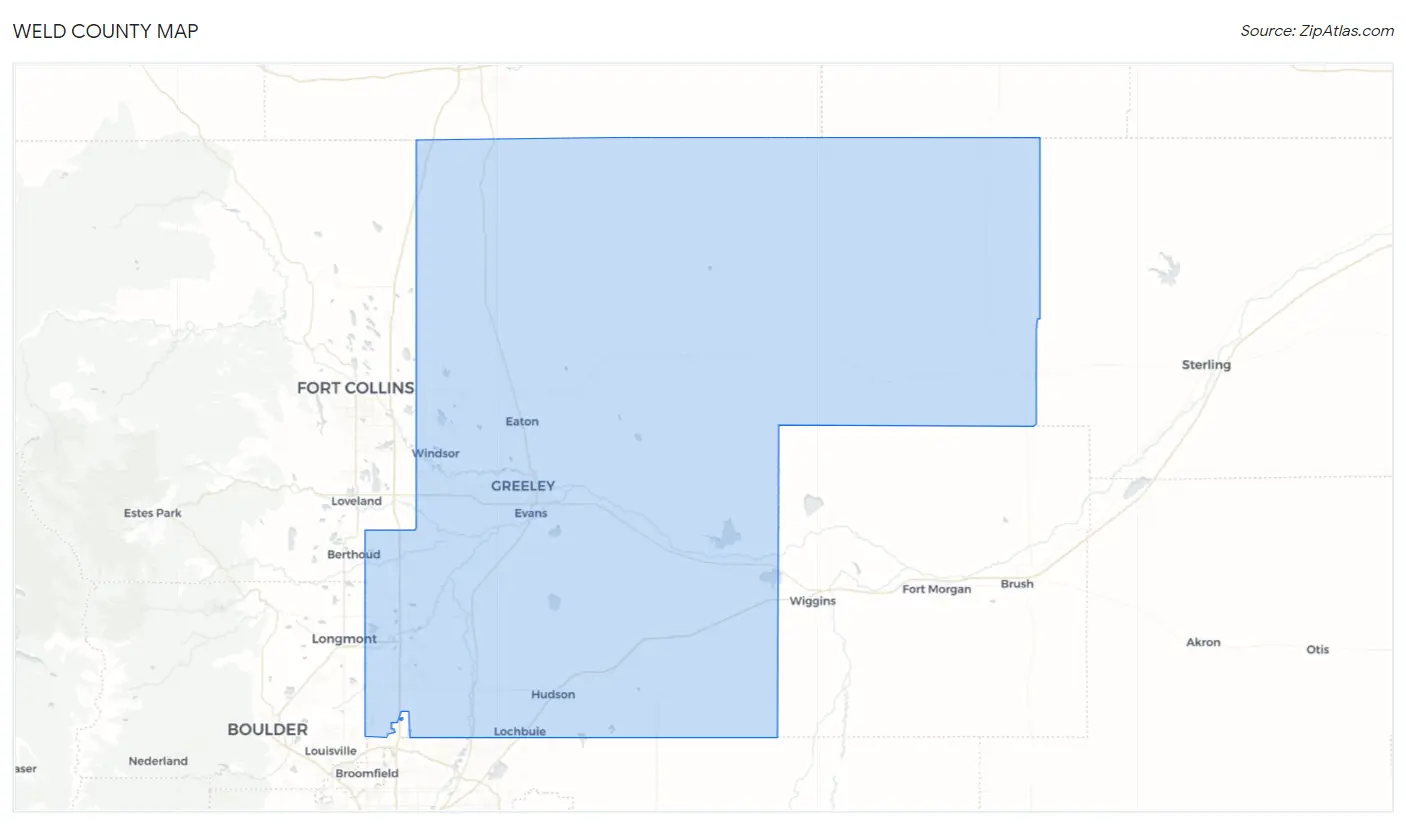
Weld County Map
Weld County Overview
331,466
TOTAL POPULATION
168,644
MALE POPULATION
162,822
FEMALE POPULATION
103.58
MALES / 100 FEMALES
96.55
FEMALES / 100 MALES
35.0
MEDIAN AGE
3.3
AVG FAMILY SIZE
2.8
AVG HOUSEHOLD SIZE
$39,480
PER CAPITA INCOME
$102,620
AVG FAMILY INCOME
$89,182
AVG HOUSEHOLD INCOME
35.3%
WAGE / INCOME GAP [ % ]
64.7¢/ $1
WAGE / INCOME GAP [ $ ]
$11,505
FAMILY INCOME DEFICIT
0.42
INEQUALITY / GINI INDEX
177,690
LABOR FORCE [ PEOPLE ]
69.6%
PERCENT IN LABOR FORCE
4.9%
UNEMPLOYMENT RATE
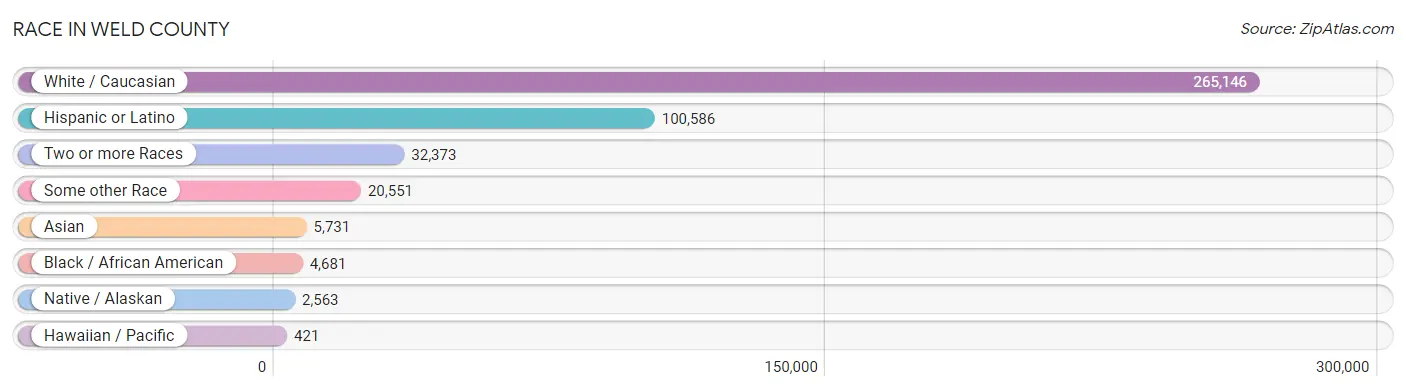
Race in Weld County
The most populous races in Weld County are White / Caucasian (265,146 | 80.0%), Hispanic or Latino (100,586 | 30.3%), and Two or more Races (32,373 | 9.8%).
| Race | # Population | % Population |
| Asian | 5,731 | 1.7% |
| Black / African American | 4,681 | 1.4% |
| Hawaiian / Pacific | 421 | 0.1% |
| Hispanic or Latino | 100,586 | 30.3% |
| Native / Alaskan | 2,563 | 0.8% |
| White / Caucasian | 265,146 | 80.0% |
| Two or more Races | 32,373 | 9.8% |
| Some other Race | 20,551 | 6.2% |
| Total | 331,466 | 100.0% |
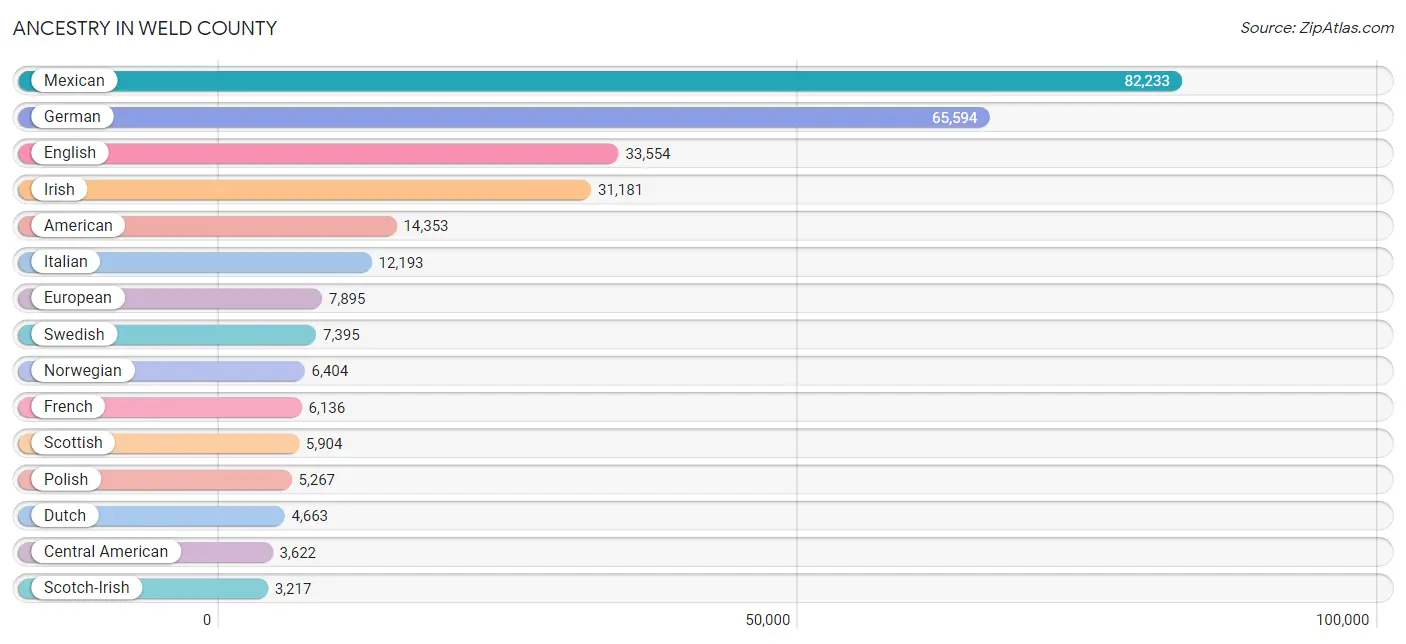
Ancestry in Weld County
The most populous ancestries reported in Weld County are Mexican (82,233 | 24.8%), German (65,594 | 19.8%), English (33,554 | 10.1%), Irish (31,181 | 9.4%), and American (14,353 | 4.3%), together accounting for 68.5% of all Weld County residents.
| Ancestry | # Population | % Population |
| Afghan | 16 | 0.0% |
| African | 432 | 0.1% |
| Alaskan Athabascan | 6 | 0.0% |
| American | 14,353 | 4.3% |
| Apache | 458 | 0.1% |
| Arab | 829 | 0.3% |
| Argentinean | 99 | 0.0% |
| Armenian | 81 | 0.0% |
| Australian | 21 | 0.0% |
| Austrian | 540 | 0.2% |
| Bangladeshi | 767 | 0.2% |
| Barbadian | 9 | 0.0% |
| Basque | 113 | 0.0% |
| Belgian | 255 | 0.1% |
| Bhutanese | 1,276 | 0.4% |
| Blackfeet | 143 | 0.0% |
| Bolivian | 11 | 0.0% |
| Brazilian | 164 | 0.1% |
| British | 1,714 | 0.5% |
| Bulgarian | 184 | 0.1% |
| Burmese | 802 | 0.2% |
| Cajun | 64 | 0.0% |
| Cambodian | 10 | 0.0% |
| Canadian | 464 | 0.1% |
| Celtic | 54 | 0.0% |
| Central American | 3,622 | 1.1% |
| Central American Indian | 292 | 0.1% |
| Cherokee | 1,281 | 0.4% |
| Cheyenne | 61 | 0.0% |
| Chinese | 13 | 0.0% |
| Chippewa | 164 | 0.1% |
| Choctaw | 170 | 0.1% |
| Colombian | 267 | 0.1% |
| Comanche | 57 | 0.0% |
| Costa Rican | 58 | 0.0% |
| Cree | 50 | 0.0% |
| Creek | 131 | 0.0% |
| Croatian | 380 | 0.1% |
| Crow | 3 | 0.0% |
| Cuban | 557 | 0.2% |
| Czech | 1,312 | 0.4% |
| Czechoslovakian | 308 | 0.1% |
| Danish | 1,818 | 0.5% |
| Dominican | 28 | 0.0% |
| Dutch | 4,663 | 1.4% |
| Eastern European | 568 | 0.2% |
| Ecuadorian | 197 | 0.1% |
| Egyptian | 15 | 0.0% |
| English | 33,554 | 10.1% |
| Estonian | 26 | 0.0% |
| Ethiopian | 385 | 0.1% |
| European | 7,895 | 2.4% |
| Filipino | 190 | 0.1% |
| Finnish | 412 | 0.1% |
| French | 6,136 | 1.8% |
| French American Indian | 28 | 0.0% |
| French Canadian | 1,192 | 0.4% |
| German | 65,594 | 19.8% |
| German Russian | 246 | 0.1% |
| Ghanaian | 5 | 0.0% |
| Greek | 803 | 0.2% |
| Guamanian / Chamorro | 343 | 0.1% |
| Guatemalan | 1,191 | 0.4% |
| Haitian | 70 | 0.0% |
| Hmong | 6 | 0.0% |
| Honduran | 279 | 0.1% |
| Hopi | 24 | 0.0% |
| Hungarian | 725 | 0.2% |
| Icelander | 20 | 0.0% |
| Indian (Asian) | 1,011 | 0.3% |
| Indonesian | 514 | 0.2% |
| Inupiat | 3 | 0.0% |
| Iranian | 206 | 0.1% |
| Irish | 31,181 | 9.4% |
| Iroquois | 39 | 0.0% |
| Italian | 12,193 | 3.7% |
| Jamaican | 26 | 0.0% |
| Japanese | 441 | 0.1% |
| Kenyan | 278 | 0.1% |
| Kiowa | 57 | 0.0% |
| Korean | 1,300 | 0.4% |
| Laotian | 17 | 0.0% |
| Latvian | 12 | 0.0% |
| Lebanese | 236 | 0.1% |
| Lithuanian | 274 | 0.1% |
| Luxembourger | 40 | 0.0% |
| Macedonian | 7 | 0.0% |
| Malaysian | 132 | 0.0% |
| Maltese | 2 | 0.0% |
| Marshallese | 15 | 0.0% |
| Mexican | 82,233 | 24.8% |
| Mexican American Indian | 1,195 | 0.4% |
| Mongolian | 10 | 0.0% |
| Moroccan | 31 | 0.0% |
| Native Hawaiian | 399 | 0.1% |
| Navajo | 1,067 | 0.3% |
| Nicaraguan | 143 | 0.0% |
| Nigerian | 113 | 0.0% |
| Northern European | 913 | 0.3% |
| Norwegian | 6,404 | 1.9% |
| Osage | 7 | 0.0% |
| Pakistani | 274 | 0.1% |
| Panamanian | 82 | 0.0% |
| Paraguayan | 8 | 0.0% |
| Pennsylvania German | 86 | 0.0% |
| Peruvian | 711 | 0.2% |
| Polish | 5,267 | 1.6% |
| Portuguese | 322 | 0.1% |
| Pueblo | 313 | 0.1% |
| Puerto Rican | 1,697 | 0.5% |
| Romanian | 161 | 0.1% |
| Russian | 2,855 | 0.9% |
| Salvadoran | 1,869 | 0.6% |
| Samoan | 94 | 0.0% |
| Scandinavian | 1,807 | 0.5% |
| Scotch-Irish | 3,217 | 1.0% |
| Scottish | 5,904 | 1.8% |
| Seminole | 54 | 0.0% |
| Serbian | 69 | 0.0% |
| Shoshone | 19 | 0.0% |
| Sierra Leonean | 15 | 0.0% |
| Sioux | 466 | 0.1% |
| Slavic | 218 | 0.1% |
| Slovak | 227 | 0.1% |
| Slovene | 225 | 0.1% |
| Somali | 244 | 0.1% |
| South African | 279 | 0.1% |
| South American | 1,415 | 0.4% |
| South American Indian | 18 | 0.0% |
| Spaniard | 2,960 | 0.9% |
| Spanish | 2,792 | 0.8% |
| Spanish American | 62 | 0.0% |
| Spanish American Indian | 58 | 0.0% |
| Sri Lankan | 1,089 | 0.3% |
| Subsaharan African | 1,864 | 0.6% |
| Swedish | 7,395 | 2.2% |
| Swiss | 898 | 0.3% |
| Syrian | 48 | 0.0% |
| Thai | 472 | 0.1% |
| Tlingit-Haida | 7 | 0.0% |
| Tohono O'Odham | 42 | 0.0% |
| Tongan | 20 | 0.0% |
| Trinidadian and Tobagonian | 49 | 0.0% |
| Turkish | 217 | 0.1% |
| Ugandan | 8 | 0.0% |
| Ukrainian | 425 | 0.1% |
| Ute | 86 | 0.0% |
| Venezuelan | 122 | 0.0% |
| Welsh | 3,051 | 0.9% |
| West Indian | 7 | 0.0% |
| Yaqui | 173 | 0.1% |
| Yugoslavian | 101 | 0.0% |
| Yuman | 16 | 0.0% |
| Yup'ik | 19 | 0.0% | View All 154 Rows |
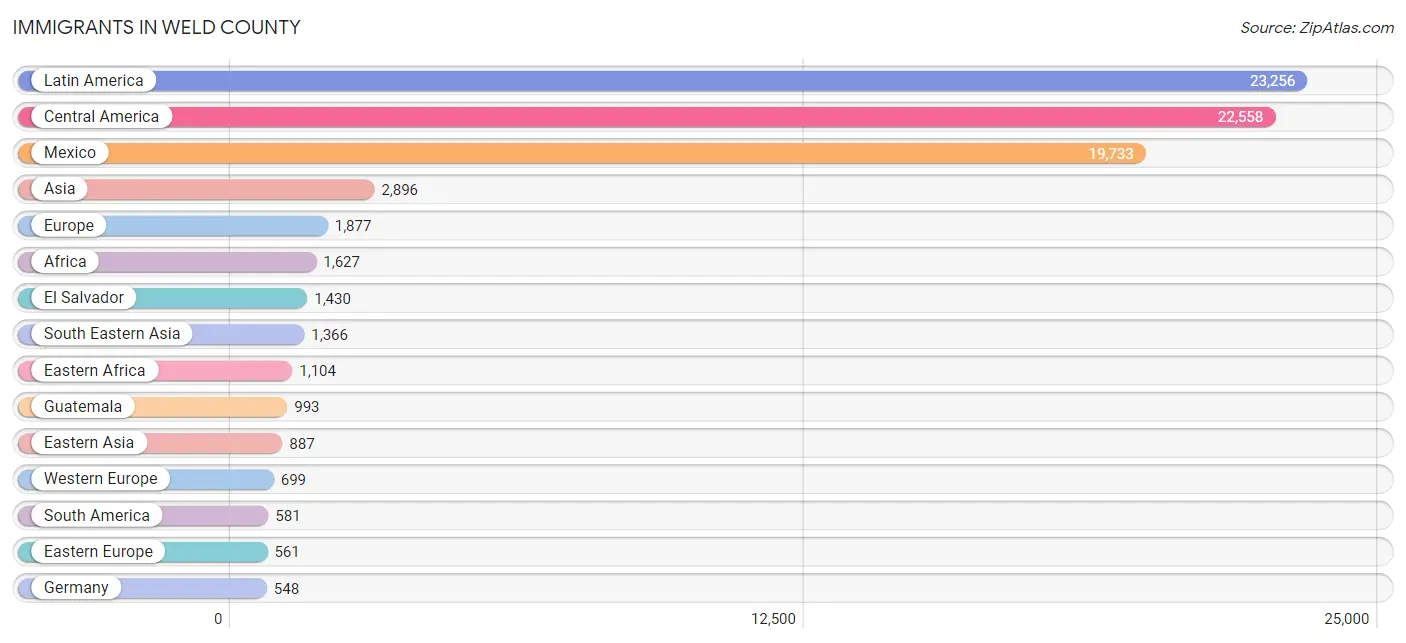
Immigrants in Weld County
The most numerous immigrant groups reported in Weld County came from Latin America (23,256 | 7.0%), Central America (22,558 | 6.8%), Mexico (19,733 | 5.9%), Asia (2,896 | 0.9%), and Europe (1,877 | 0.6%), together accounting for 21.2% of all Weld County residents.
| Immigration Origin | # Population | % Population |
| Afghanistan | 16 | 0.0% |
| Africa | 1,627 | 0.5% |
| Argentina | 56 | 0.0% |
| Asia | 2,896 | 0.9% |
| Australia | 49 | 0.0% |
| Austria | 30 | 0.0% |
| Barbados | 9 | 0.0% |
| Belarus | 4 | 0.0% |
| Belgium | 7 | 0.0% |
| Bolivia | 11 | 0.0% |
| Bosnia and Herzegovina | 25 | 0.0% |
| Brazil | 110 | 0.0% |
| Cambodia | 83 | 0.0% |
| Canada | 426 | 0.1% |
| Caribbean | 117 | 0.0% |
| Central America | 22,558 | 6.8% |
| China | 387 | 0.1% |
| Colombia | 119 | 0.0% |
| Congo | 30 | 0.0% |
| Costa Rica | 72 | 0.0% |
| Cuba | 14 | 0.0% |
| Czechoslovakia | 26 | 0.0% |
| Denmark | 62 | 0.0% |
| Eastern Africa | 1,104 | 0.3% |
| Eastern Asia | 887 | 0.3% |
| Eastern Europe | 561 | 0.2% |
| Ecuador | 45 | 0.0% |
| El Salvador | 1,430 | 0.4% |
| England | 182 | 0.1% |
| Eritrea | 314 | 0.1% |
| Ethiopia | 94 | 0.0% |
| Europe | 1,877 | 0.6% |
| France | 3 | 0.0% |
| Germany | 548 | 0.2% |
| Ghana | 14 | 0.0% |
| Guatemala | 993 | 0.3% |
| Haiti | 45 | 0.0% |
| Honduras | 251 | 0.1% |
| Hong Kong | 9 | 0.0% |
| Hungary | 112 | 0.0% |
| India | 119 | 0.0% |
| Iran | 59 | 0.0% |
| Iraq | 55 | 0.0% |
| Ireland | 31 | 0.0% |
| Israel | 9 | 0.0% |
| Italy | 18 | 0.0% |
| Japan | 58 | 0.0% |
| Kenya | 256 | 0.1% |
| Korea | 442 | 0.1% |
| Kuwait | 44 | 0.0% |
| Laos | 229 | 0.1% |
| Latin America | 23,256 | 7.0% |
| Liberia | 53 | 0.0% |
| Mexico | 19,733 | 5.9% |
| Middle Africa | 53 | 0.0% |
| Morocco | 31 | 0.0% |
| Nepal | 161 | 0.1% |
| Netherlands | 26 | 0.0% |
| Nicaragua | 79 | 0.0% |
| Nigeria | 55 | 0.0% |
| Northern Africa | 31 | 0.0% |
| Northern Europe | 490 | 0.2% |
| Oceania | 72 | 0.0% |
| Pakistan | 38 | 0.0% |
| Peru | 114 | 0.0% |
| Philippines | 298 | 0.1% |
| Poland | 131 | 0.0% |
| Romania | 68 | 0.0% |
| Russia | 140 | 0.0% |
| Scotland | 24 | 0.0% |
| Somalia | 270 | 0.1% |
| South Africa | 147 | 0.0% |
| South America | 581 | 0.2% |
| South Central Asia | 464 | 0.1% |
| South Eastern Asia | 1,366 | 0.4% |
| Southern Europe | 117 | 0.0% |
| Spain | 99 | 0.0% |
| Sri Lanka | 32 | 0.0% |
| Sweden | 42 | 0.0% |
| Switzerland | 85 | 0.0% |
| Syria | 42 | 0.0% |
| Taiwan | 89 | 0.0% |
| Thailand | 121 | 0.0% |
| Trinidad and Tobago | 49 | 0.0% |
| Turkey | 29 | 0.0% |
| Ukraine | 26 | 0.0% |
| Venezuela | 118 | 0.0% |
| Vietnam | 293 | 0.1% |
| Western Africa | 269 | 0.1% |
| Western Asia | 179 | 0.1% |
| Western Europe | 699 | 0.2% |
| Zimbabwe | 13 | 0.0% | View All 92 Rows |
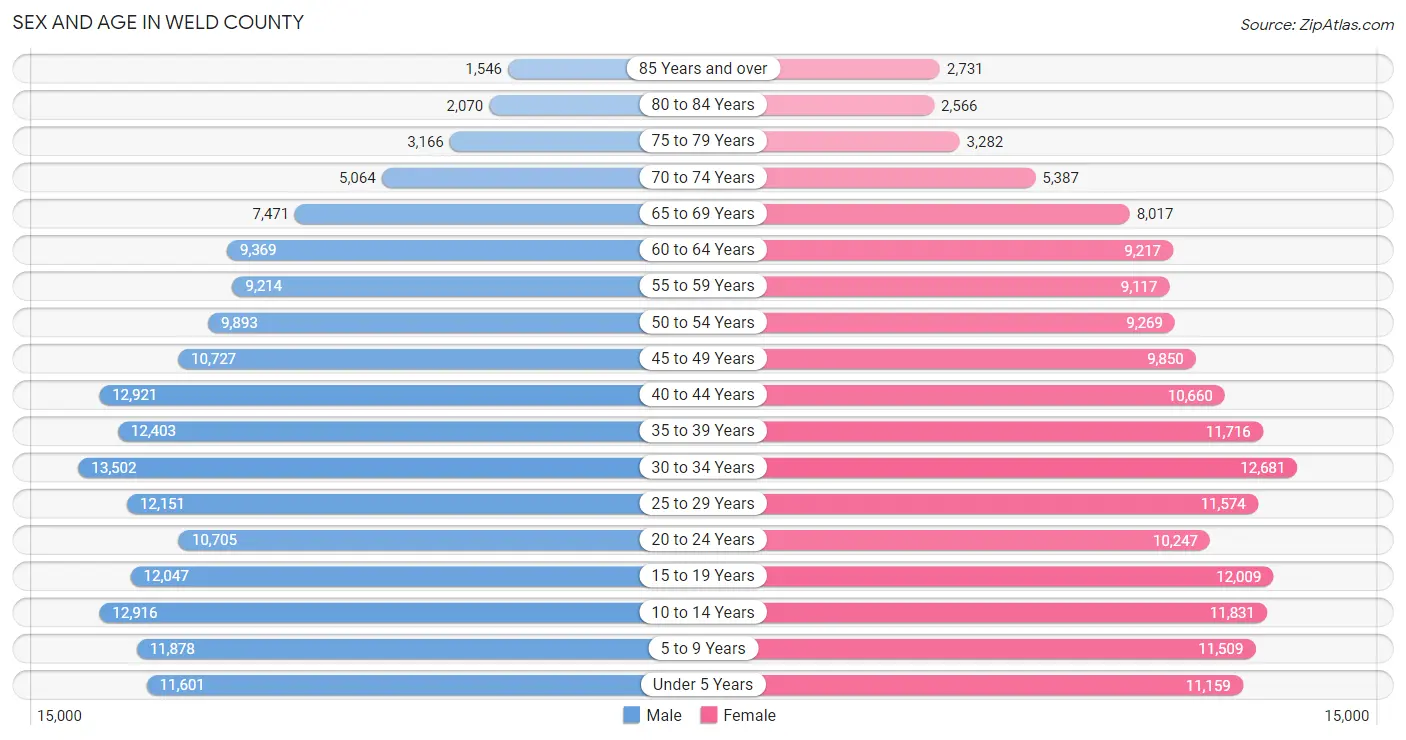
Sex and Age in Weld County
Sex and Age in Weld County
The most populous age groups in Weld County are 30 to 34 Years (13,502 | 8.0%) for men and 30 to 34 Years (12,681 | 7.8%) for women.
| Age Bracket | Male | Female |
| Under 5 Years | 11,601 (6.9%) | 11,159 (6.9%) |
| 5 to 9 Years | 11,878 (7.0%) | 11,509 (7.1%) |
| 10 to 14 Years | 12,916 (7.7%) | 11,831 (7.3%) |
| 15 to 19 Years | 12,047 (7.1%) | 12,009 (7.4%) |
| 20 to 24 Years | 10,705 (6.4%) | 10,247 (6.3%) |
| 25 to 29 Years | 12,151 (7.2%) | 11,574 (7.1%) |
| 30 to 34 Years | 13,502 (8.0%) | 12,681 (7.8%) |
| 35 to 39 Years | 12,403 (7.3%) | 11,716 (7.2%) |
| 40 to 44 Years | 12,921 (7.7%) | 10,660 (6.6%) |
| 45 to 49 Years | 10,727 (6.4%) | 9,850 (6.0%) |
| 50 to 54 Years | 9,893 (5.9%) | 9,269 (5.7%) |
| 55 to 59 Years | 9,214 (5.5%) | 9,117 (5.6%) |
| 60 to 64 Years | 9,369 (5.6%) | 9,217 (5.7%) |
| 65 to 69 Years | 7,471 (4.4%) | 8,017 (4.9%) |
| 70 to 74 Years | 5,064 (3.0%) | 5,387 (3.3%) |
| 75 to 79 Years | 3,166 (1.9%) | 3,282 (2.0%) |
| 80 to 84 Years | 2,070 (1.2%) | 2,566 (1.6%) |
| 85 Years and over | 1,546 (0.9%) | 2,731 (1.7%) |
| Total | 168,644 (100.0%) | 162,822 (100.0%) |
Families and Households in Weld County
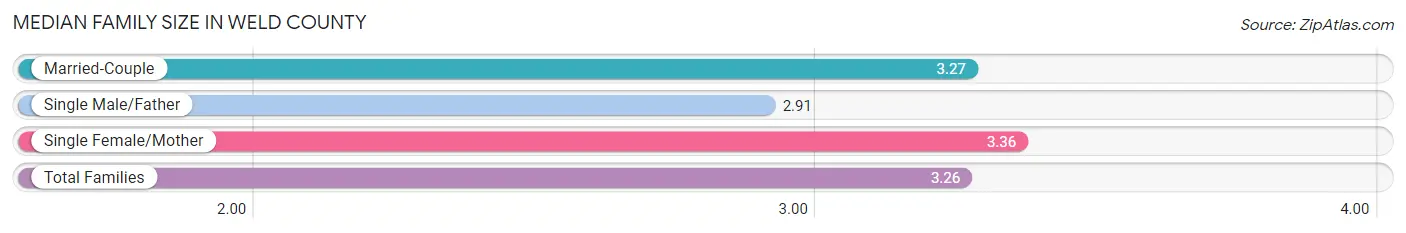
Median Family Size in Weld County
The median family size in Weld County is 3.26 persons per family, with single female/mother families (11,438 | 13.6%) accounting for the largest median family size of 3.36 persons per family. On the other hand, single male/father families (5,885 | 7.0%) represent the smallest median family size with 2.91 persons per family.
| Family Type | # Families | Family Size |
| Married-Couple | 66,986 (79.4%) | 3.27 |
| Single Male/Father | 5,885 (7.0%) | 2.91 |
| Single Female/Mother | 11,438 (13.6%) | 3.36 |
| Total Families | 84,309 (100.0%) | 3.26 |
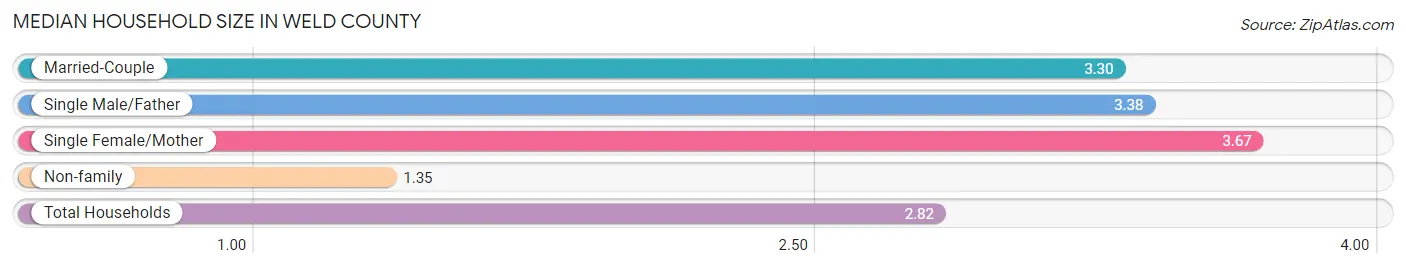
Median Household Size in Weld County
The median household size in Weld County is 2.82 persons per household, with single female/mother households (11,438 | 9.9%) accounting for the largest median household size of 3.67 persons per household. non-family households (31,227 | 27.0%) represent the smallest median household size with 1.35 persons per household.
| Household Type | # Households | Household Size |
| Married-Couple | 66,986 (58.0%) | 3.30 |
| Single Male/Father | 5,885 (5.1%) | 3.38 |
| Single Female/Mother | 11,438 (9.9%) | 3.67 |
| Non-family | 31,227 (27.0%) | 1.35 |
| Total Households | 115,536 (100.0%) | 2.82 |
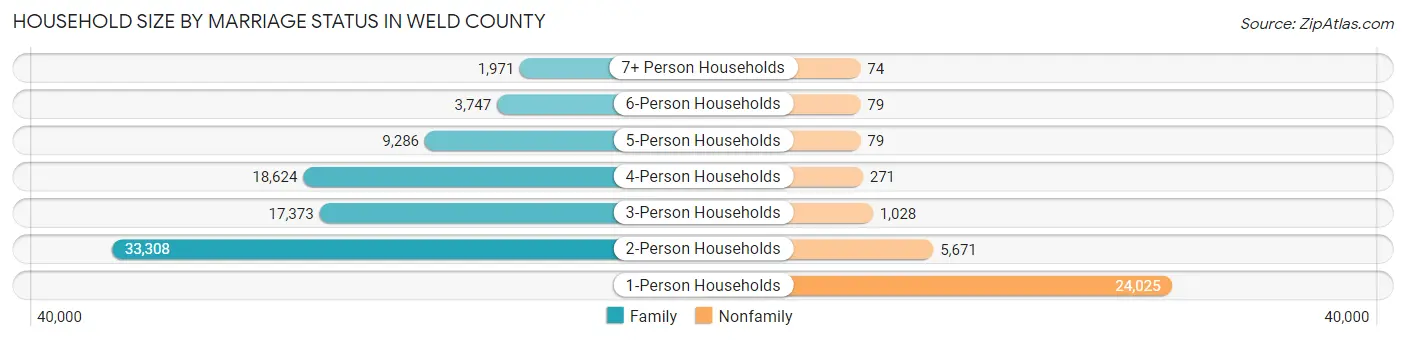
Household Size by Marriage Status in Weld County
Out of a total of 115,536 households in Weld County, 84,309 (73.0%) are family households, while 31,227 (27.0%) are nonfamily households. The most numerous type of family households are 2-person households, comprising 33,308, and the most common type of nonfamily households are 1-person households, comprising 24,025.
| Household Size | Family Households | Nonfamily Households |
| 1-Person Households | - | 24,025 (20.8%) |
| 2-Person Households | 33,308 (28.8%) | 5,671 (4.9%) |
| 3-Person Households | 17,373 (15.0%) | 1,028 (0.9%) |
| 4-Person Households | 18,624 (16.1%) | 271 (0.2%) |
| 5-Person Households | 9,286 (8.0%) | 79 (0.1%) |
| 6-Person Households | 3,747 (3.2%) | 79 (0.1%) |
| 7+ Person Households | 1,971 (1.7%) | 74 (0.1%) |
| Total | 84,309 (73.0%) | 31,227 (27.0%) |
Female Fertility in Weld County
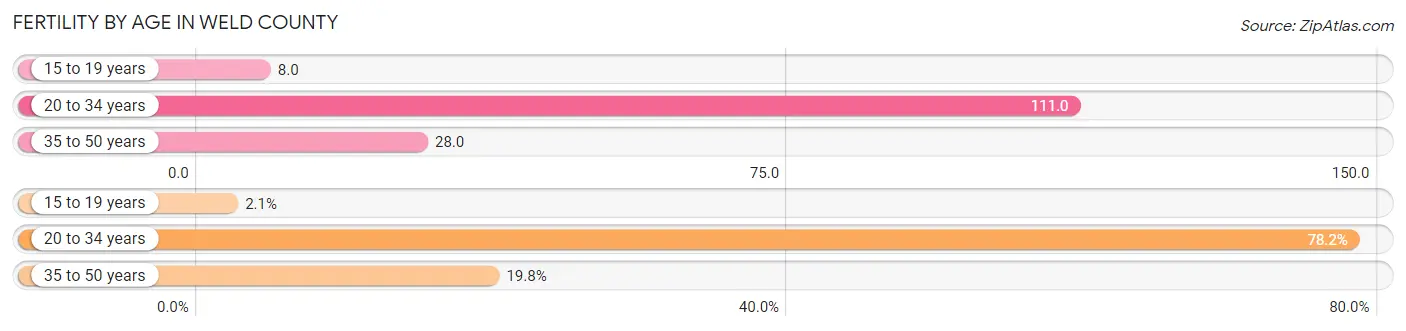
Fertility by Age in Weld County
Average fertility rate in Weld County is 61.0 births per 1,000 women. Women in the age bracket of 20 to 34 years have the highest fertility rate with 111.0 births per 1,000 women. Women in the age bracket of 20 to 34 years acount for 78.2% of all women with births.
| Age Bracket | Women with Births | Births / 1,000 Women |
| 15 to 19 years | 101 (2.1%) | 8.0 |
| 20 to 34 years | 3,844 (78.2%) | 111.0 |
| 35 to 50 years | 973 (19.8%) | 28.0 |
| Total | 4,918 (100.0%) | 61.0 |
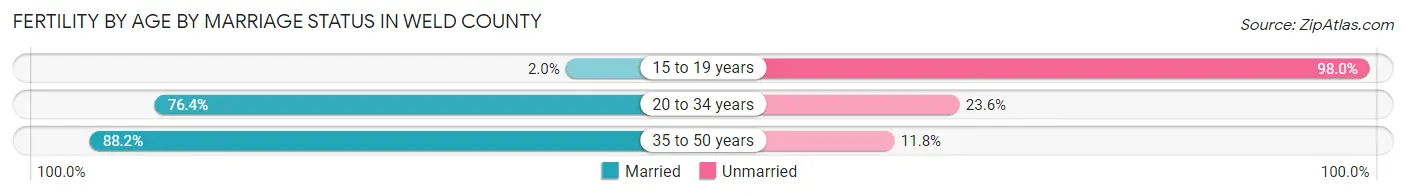
Fertility by Age by Marriage Status in Weld County
77.2% of women with births (4,918) in Weld County are married. The highest percentage of unmarried women with births falls into 15 to 19 years age bracket with 98.0% of them unmarried at the time of birth, while the lowest percentage of unmarried women with births belong to 35 to 50 years age bracket with 11.8% of them unmarried.
| Age Bracket | Married | Unmarried |
| 15 to 19 years | 2 (2.0%) | 99 (98.0%) |
| 20 to 34 years | 2,937 (76.4%) | 907 (23.6%) |
| 35 to 50 years | 858 (88.2%) | 115 (11.8%) |
| Total | 3,797 (77.2%) | 1,121 (22.8%) |
Fertility by Education in Weld County
Average fertility rate in Weld County is 61.0 births per 1,000 women. Women with the education attainment of graduate degree have the highest fertility rate of 79.0 births per 1,000 women, while women with the education attainment of less than high school have the lowest fertility at 33.0 births per 1,000 women. Women with the education attainment of college or associate's degree represent 31.3% of all women with births.

| Educational Attainment | Women with Births | Births / 1,000 Women |
| Less than High School | 492 (10.0%) | 33.0 |
| High School Diploma | 1,076 (21.9%) | 64.0 |
| College or Associate's Degree | 1,540 (31.3%) | 62.0 |
| Bachelor's Degree | 1,181 (24.0%) | 72.0 |
| Graduate Degree | 629 (12.8%) | 79.0 |
| Total | 4,918 (100.0%) | 61.0 |
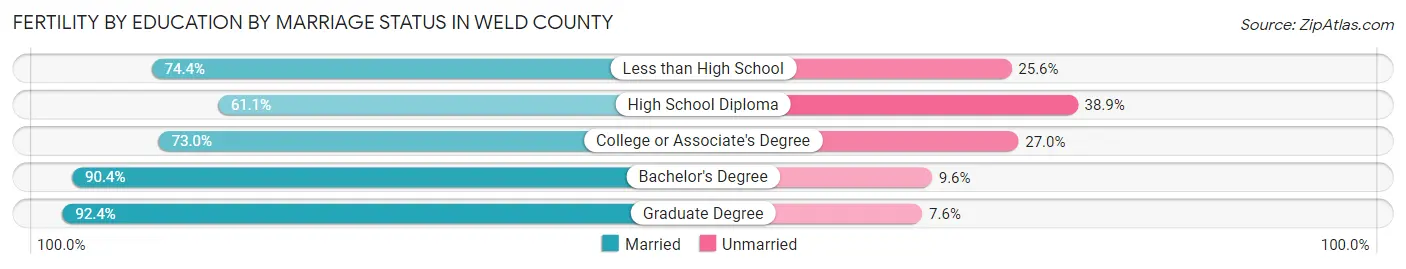
Fertility by Education by Marriage Status in Weld County
22.8% of women with births in Weld County are unmarried. Women with the educational attainment of graduate degree are most likely to be married with 92.4% of them married at childbirth, while women with the educational attainment of high school diploma are least likely to be married with 38.9% of them unmarried at childbirth.
| Educational Attainment | Married | Unmarried |
| Less than High School | 366 (74.4%) | 126 (25.6%) |
| High School Diploma | 657 (61.1%) | 419 (38.9%) |
| College or Associate's Degree | 1,124 (73.0%) | 416 (27.0%) |
| Bachelor's Degree | 1,068 (90.4%) | 113 (9.6%) |
| Graduate Degree | 581 (92.4%) | 48 (7.6%) |
| Total | 3,797 (77.2%) | 1,121 (22.8%) |
Income in Weld County
Income Overview in Weld County
Per Capita Income in Weld County is $39,480, while median incomes of families and households are $102,620 and $89,182 respectively.
| Characteristic | Number | Measure |
| Per Capita Income | 331,466 | $39,480 |
| Median Family Income | 84,309 | $102,620 |
| Mean Family Income | 84,309 | $122,610 |
| Median Household Income | 115,536 | $89,182 |
| Mean Household Income | 115,536 | $109,274 |
| Income Deficit | 84,309 | $11,505 |
| Wage / Income Gap (%) | 331,466 | 35.30% |
| Wage / Income Gap ($) | 331,466 | 64.70¢ per $1 |
| Gini / Inequality Index | 331,466 | 0.42 |
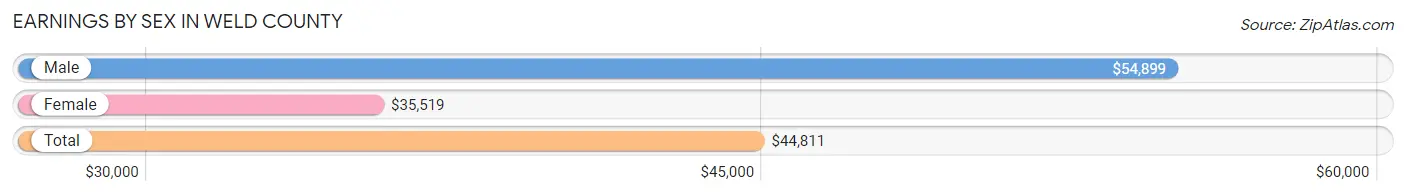
Earnings by Sex in Weld County
Average Earnings in Weld County are $44,811, $54,899 for men and $35,519 for women, a difference of 35.3%.
| Sex | Number | Average Earnings |
| Male | 102,361 (55.5%) | $54,899 |
| Female | 82,183 (44.5%) | $35,519 |
| Total | 184,544 (100.0%) | $44,811 |
Earnings by Sex by Income Bracket in Weld County
The most common earnings brackets in Weld County are $100,000+ for men (20,750 | 20.3%) and $75,000 to $99,999 for women (7,238 | 8.8%).
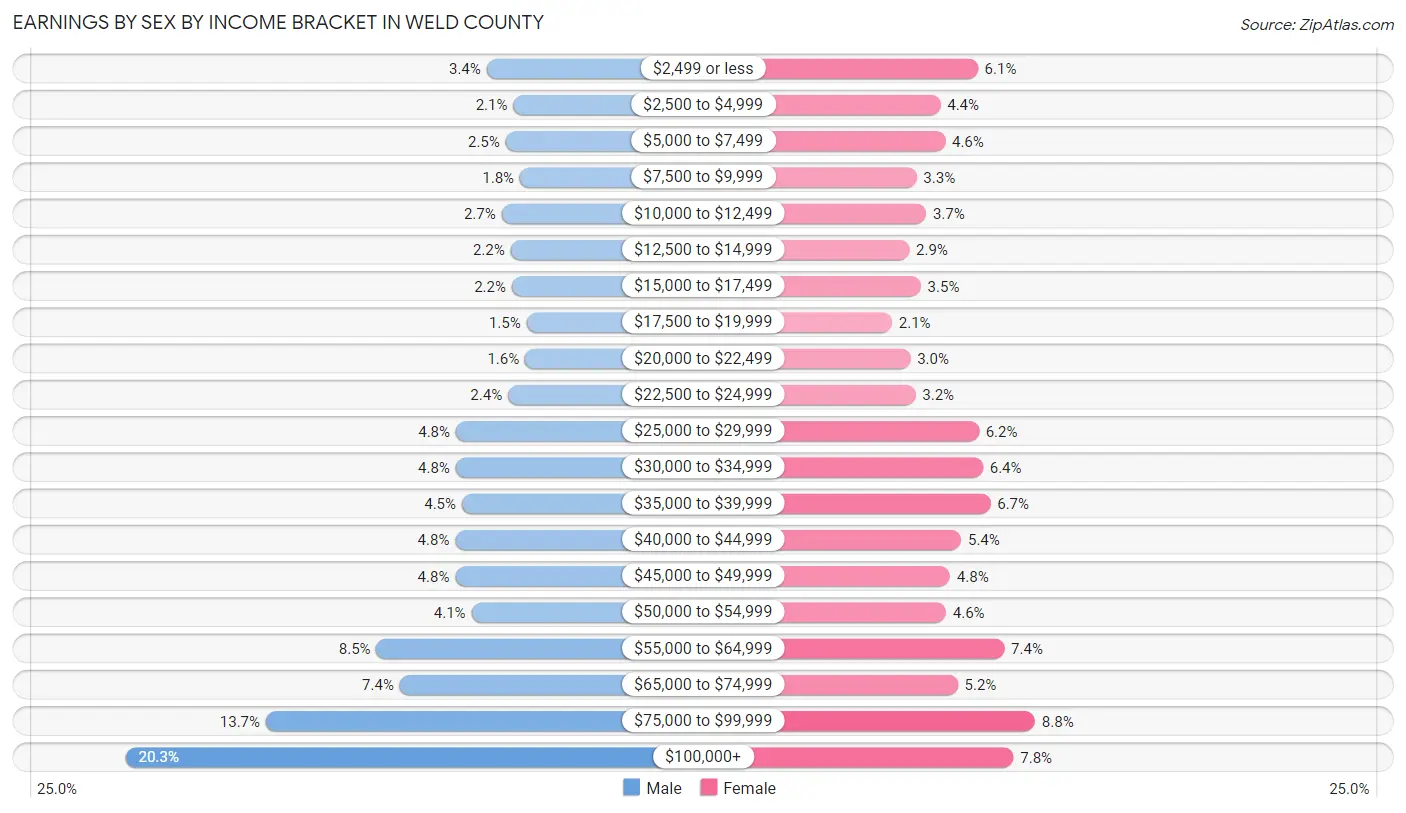
| Income | Male | Female |
| $2,499 or less | 3,440 (3.4%) | 5,035 (6.1%) |
| $2,500 to $4,999 | 2,156 (2.1%) | 3,597 (4.4%) |
| $5,000 to $7,499 | 2,526 (2.5%) | 3,783 (4.6%) |
| $7,500 to $9,999 | 1,840 (1.8%) | 2,679 (3.3%) |
| $10,000 to $12,499 | 2,726 (2.7%) | 3,049 (3.7%) |
| $12,500 to $14,999 | 2,292 (2.2%) | 2,402 (2.9%) |
| $15,000 to $17,499 | 2,235 (2.2%) | 2,843 (3.5%) |
| $17,500 to $19,999 | 1,525 (1.5%) | 1,736 (2.1%) |
| $20,000 to $22,499 | 1,592 (1.6%) | 2,440 (3.0%) |
| $22,500 to $24,999 | 2,415 (2.4%) | 2,636 (3.2%) |
| $25,000 to $29,999 | 4,910 (4.8%) | 5,083 (6.2%) |
| $30,000 to $34,999 | 4,923 (4.8%) | 5,233 (6.4%) |
| $35,000 to $39,999 | 4,628 (4.5%) | 5,526 (6.7%) |
| $40,000 to $44,999 | 4,939 (4.8%) | 4,393 (5.3%) |
| $45,000 to $49,999 | 4,944 (4.8%) | 3,967 (4.8%) |
| $50,000 to $54,999 | 4,170 (4.1%) | 3,815 (4.6%) |
| $55,000 to $64,999 | 8,725 (8.5%) | 6,057 (7.4%) |
| $65,000 to $74,999 | 7,602 (7.4%) | 4,262 (5.2%) |
| $75,000 to $99,999 | 14,023 (13.7%) | 7,238 (8.8%) |
| $100,000+ | 20,750 (20.3%) | 6,409 (7.8%) |
| Total | 102,361 (100.0%) | 82,183 (100.0%) |
Earnings by Sex by Educational Attainment in Weld County
Average earnings in Weld County are $62,521 for men and $41,104 for women, a difference of 34.3%. Men with an educational attainment of graduate degree enjoy the highest average annual earnings of $96,563, while those with less than high school education earn the least with $42,746. Women with an educational attainment of graduate degree earn the most with the average annual earnings of $64,724, while those with less than high school education have the smallest earnings of $29,151.
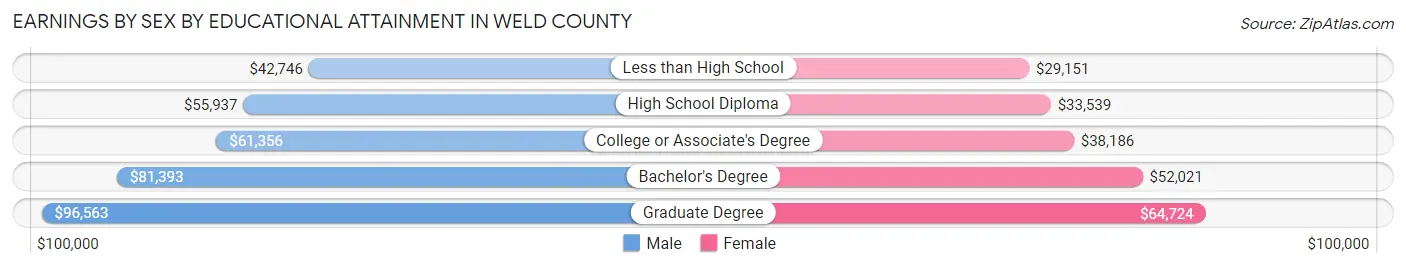
| Educational Attainment | Male Income | Female Income |
| Less than High School | $42,746 | $29,151 |
| High School Diploma | $55,937 | $33,539 |
| College or Associate's Degree | $61,356 | $38,186 |
| Bachelor's Degree | $81,393 | $52,021 |
| Graduate Degree | $96,563 | $64,724 |
| Total | $62,521 | $41,104 |
Family Income in Weld County
Family Income Brackets in Weld County
According to the Weld County family income data, there are 21,246 families falling into the $100,000 to $149,999 income range, which is the most common income bracket and makes up 25.2% of all families. Conversely, the $10,000 to $14,999 income bracket is the least frequent group with only 1,433 families (1.7%) belonging to this category.
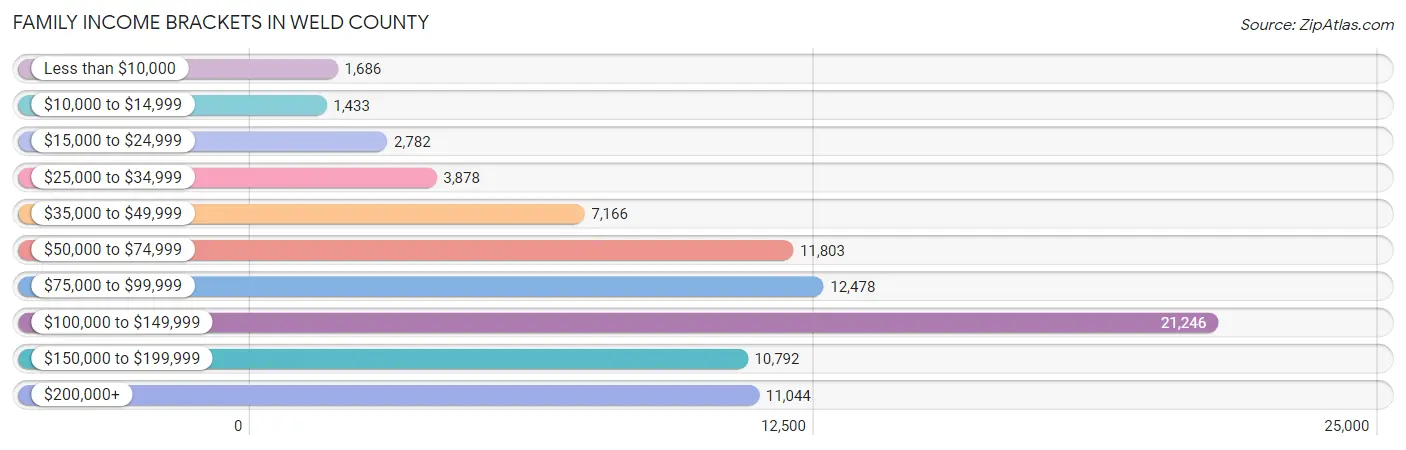
| Income Bracket | # Families | % Families |
| Less than $10,000 | 1,686 | 2.0% |
| $10,000 to $14,999 | 1,433 | 1.7% |
| $15,000 to $24,999 | 2,782 | 3.3% |
| $25,000 to $34,999 | 3,878 | 4.6% |
| $35,000 to $49,999 | 7,166 | 8.5% |
| $50,000 to $74,999 | 11,803 | 14.0% |
| $75,000 to $99,999 | 12,478 | 14.8% |
| $100,000 to $149,999 | 21,246 | 25.2% |
| $150,000 to $199,999 | 10,792 | 12.8% |
| $200,000+ | 11,044 | 13.1% |
Family Income by Famaliy Size in Weld County
4-person families (17,698 | 21.0%) account for the highest median family income in Weld County with $117,237 per family, while 2-person families (35,605 | 42.2%) have the highest median income of $45,057 per family member.
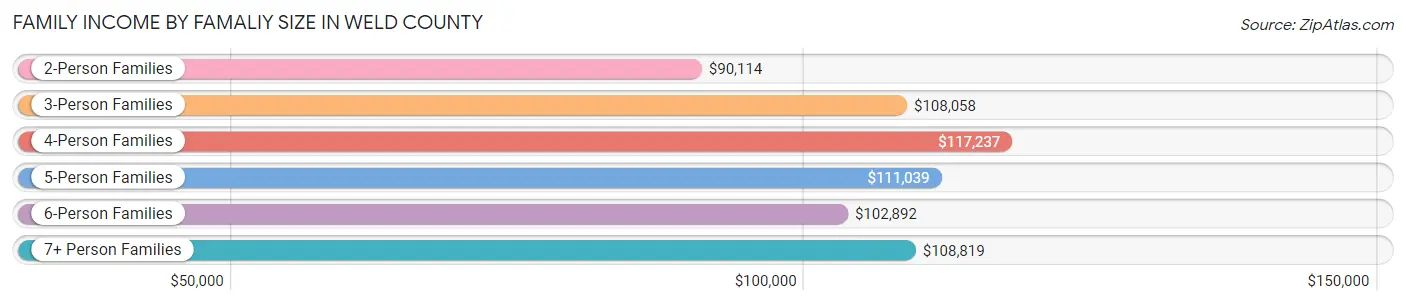
| Income Bracket | # Families | Median Income |
| 2-Person Families | 35,605 (42.2%) | $90,114 |
| 3-Person Families | 17,385 (20.6%) | $108,058 |
| 4-Person Families | 17,698 (21.0%) | $117,237 |
| 5-Person Families | 8,719 (10.3%) | $111,039 |
| 6-Person Families | 3,162 (3.7%) | $102,892 |
| 7+ Person Families | 1,740 (2.1%) | $108,819 |
| Total | 84,309 (100.0%) | $102,620 |
Family Income by Number of Earners in Weld County
The median family income in Weld County is $102,620, with families comprising 3+ earners (11,665) having the highest median family income of $142,197, while families with no earners (9,000) have the lowest median family income of $52,724, accounting for 13.8% and 10.7% of families, respectively.
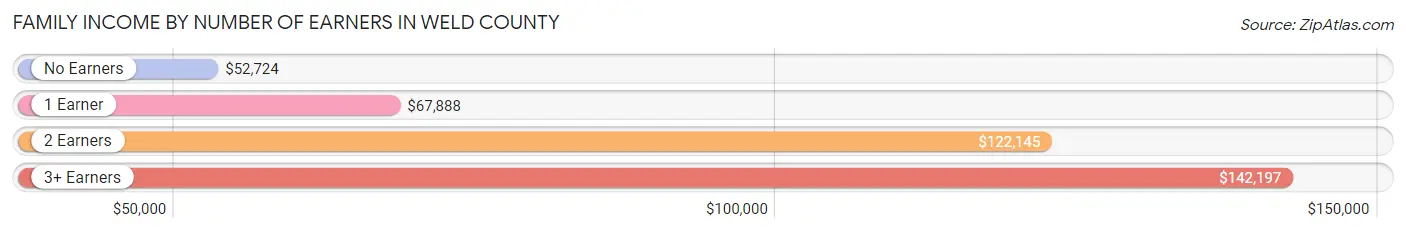
| Number of Earners | # Families | Median Income |
| No Earners | 9,000 (10.7%) | $52,724 |
| 1 Earner | 24,326 (28.8%) | $67,888 |
| 2 Earners | 39,318 (46.6%) | $122,145 |
| 3+ Earners | 11,665 (13.8%) | $142,197 |
| Total | 84,309 (100.0%) | $102,620 |
Household Income in Weld County
Household Income Brackets in Weld County
With 25,996 households falling in the category, the $100,000 to $149,999 income range is the most frequent in Weld County, accounting for 22.5% of all households. In contrast, only 3,004 households (2.6%) fall into the $10,000 to $14,999 income bracket, making it the least populous group.
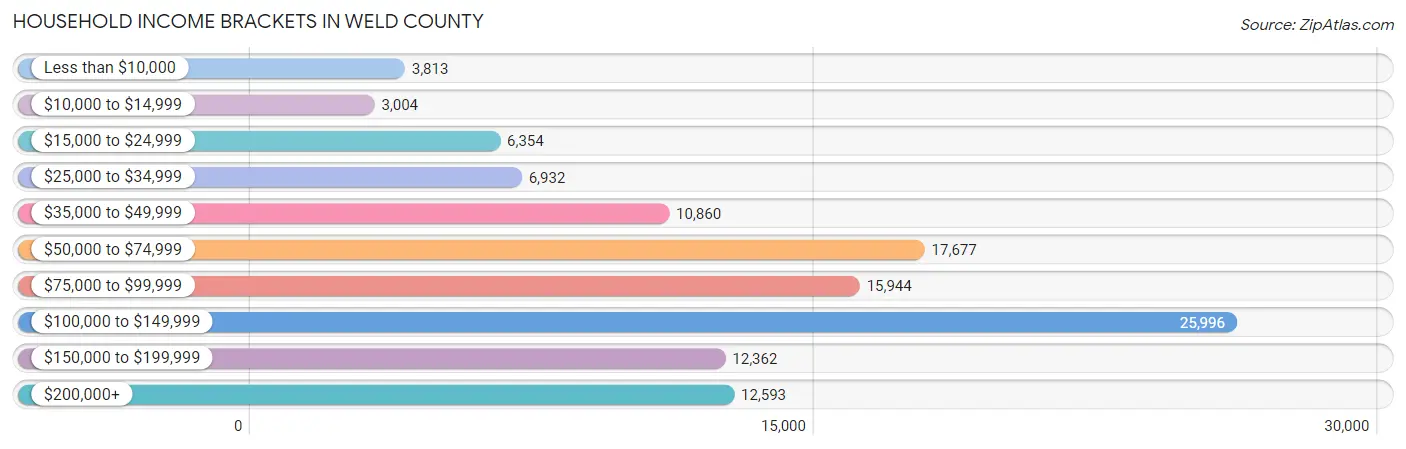
| Income Bracket | # Households | % Households |
| Less than $10,000 | 3,813 | 3.3% |
| $10,000 to $14,999 | 3,004 | 2.6% |
| $15,000 to $24,999 | 6,354 | 5.5% |
| $25,000 to $34,999 | 6,932 | 6.0% |
| $35,000 to $49,999 | 10,860 | 9.4% |
| $50,000 to $74,999 | 17,677 | 15.3% |
| $75,000 to $99,999 | 15,944 | 13.8% |
| $100,000 to $149,999 | 25,996 | 22.5% |
| $150,000 to $199,999 | 12,362 | 10.7% |
| $200,000+ | 12,593 | 10.9% |
Household Income by Householder Age in Weld County
The median household income in Weld County is $89,182, with the highest median household income of $108,051 found in the 45 to 64 years age bracket for the primary householder. A total of 42,052 households (36.4%) fall into this category. Meanwhile, the 15 to 24 years age bracket for the primary householder has the lowest median household income of $53,104, with 4,550 households (3.9%) in this group.
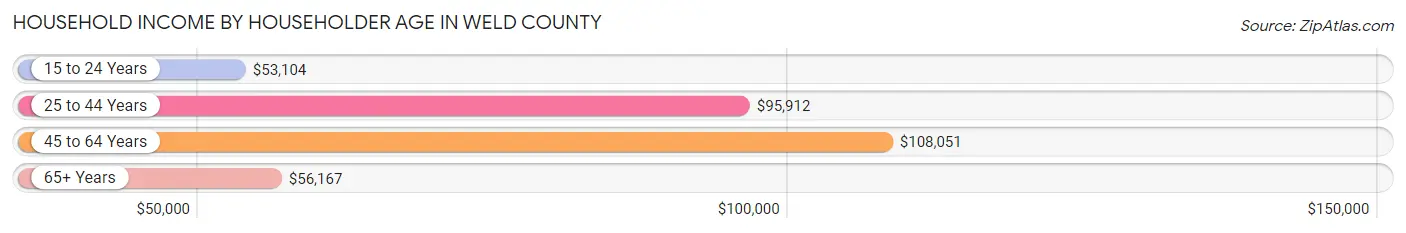
| Income Bracket | # Households | Median Income |
| 15 to 24 Years | 4,550 (3.9%) | $53,104 |
| 25 to 44 Years | 43,840 (37.9%) | $95,912 |
| 45 to 64 Years | 42,052 (36.4%) | $108,051 |
| 65+ Years | 25,094 (21.7%) | $56,167 |
| Total | 115,536 (100.0%) | $89,182 |
Poverty in Weld County
Income Below Poverty by Sex and Age in Weld County
With 8.4% poverty level for males and 11.0% for females among the residents of Weld County, 18 to 24 year old males and 18 to 24 year old females are the most vulnerable to poverty, with 1,748 males (12.5%) and 2,544 females (19.3%) in their respective age groups living below the poverty level.
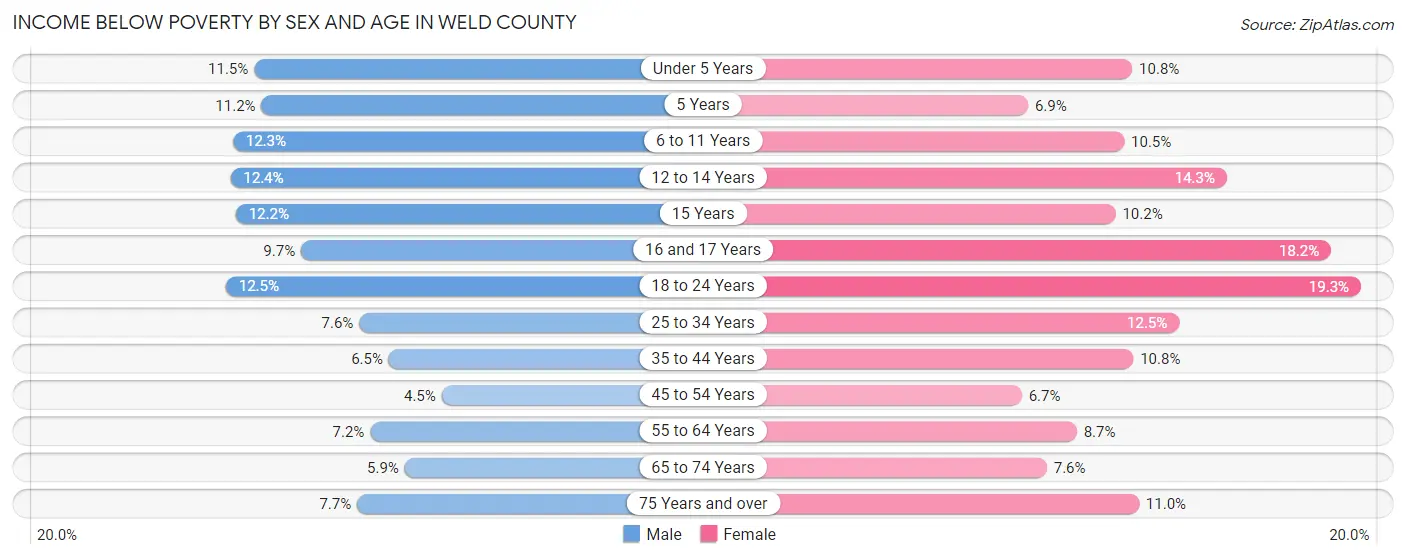
| Age Bracket | Male | Female |
| Under 5 Years | 1,303 (11.5%) | 1,178 (10.8%) |
| 5 Years | 218 (11.2%) | 171 (6.9%) |
| 6 to 11 Years | 1,864 (12.3%) | 1,458 (10.5%) |
| 12 to 14 Years | 918 (12.4%) | 946 (14.3%) |
| 15 Years | 347 (12.2%) | 245 (10.2%) |
| 16 and 17 Years | 423 (9.7%) | 825 (18.2%) |
| 18 to 24 Years | 1,748 (12.5%) | 2,544 (19.3%) |
| 25 to 34 Years | 1,914 (7.6%) | 3,018 (12.5%) |
| 35 to 44 Years | 1,625 (6.5%) | 2,416 (10.8%) |
| 45 to 54 Years | 925 (4.5%) | 1,275 (6.7%) |
| 55 to 64 Years | 1,328 (7.2%) | 1,592 (8.7%) |
| 65 to 74 Years | 738 (5.9%) | 1,020 (7.6%) |
| 75 Years and over | 499 (7.7%) | 894 (11.0%) |
| Total | 13,850 (8.4%) | 17,582 (11.0%) |
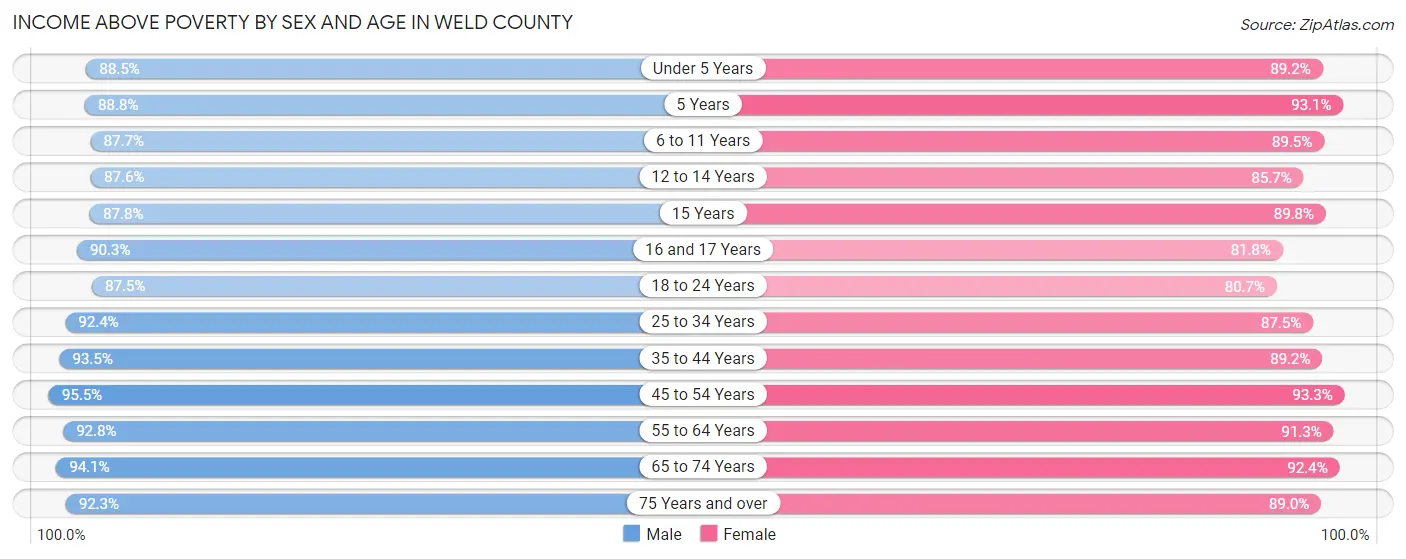
Income Above Poverty by Sex and Age in Weld County
According to the poverty statistics in Weld County, males aged 45 to 54 years and females aged 45 to 54 years are the age groups that are most secure financially, with 95.5% of males and 93.3% of females in these age groups living above the poverty line.
| Age Bracket | Male | Female |
| Under 5 Years | 10,046 (88.5%) | 9,746 (89.2%) |
| 5 Years | 1,727 (88.8%) | 2,303 (93.1%) |
| 6 to 11 Years | 13,326 (87.7%) | 12,456 (89.5%) |
| 12 to 14 Years | 6,512 (87.6%) | 5,675 (85.7%) |
| 15 Years | 2,507 (87.8%) | 2,167 (89.8%) |
| 16 and 17 Years | 3,922 (90.3%) | 3,719 (81.8%) |
| 18 to 24 Years | 12,205 (87.5%) | 10,655 (80.7%) |
| 25 to 34 Years | 23,347 (92.4%) | 21,097 (87.5%) |
| 35 to 44 Years | 23,439 (93.5%) | 19,907 (89.2%) |
| 45 to 54 Years | 19,536 (95.5%) | 17,819 (93.3%) |
| 55 to 64 Years | 17,195 (92.8%) | 16,674 (91.3%) |
| 65 to 74 Years | 11,790 (94.1%) | 12,377 (92.4%) |
| 75 Years and over | 6,017 (92.3%) | 7,214 (89.0%) |
| Total | 151,569 (91.6%) | 141,809 (89.0%) |
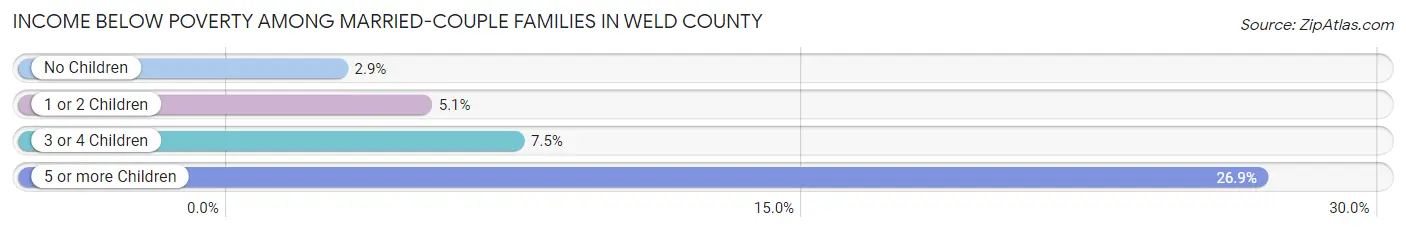
Income Below Poverty Among Married-Couple Families in Weld County
The poverty statistics for married-couple families in Weld County show that 4.3% or 2,903 of the total 66,986 families live below the poverty line. Families with 5 or more children have the highest poverty rate of 26.9%, comprising of 134 families. On the other hand, families with no children have the lowest poverty rate of 2.9%, which includes 989 families.
| Children | Above Poverty | Below Poverty |
| No Children | 33,578 (97.1%) | 989 (2.9%) |
| 1 or 2 Children | 23,796 (94.9%) | 1,268 (5.1%) |
| 3 or 4 Children | 6,345 (92.5%) | 512 (7.5%) |
| 5 or more Children | 364 (73.1%) | 134 (26.9%) |
| Total | 64,083 (95.7%) | 2,903 (4.3%) |
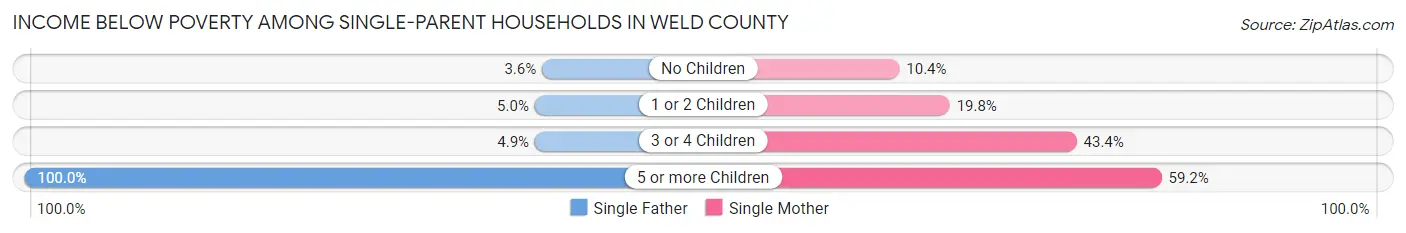
Income Below Poverty Among Single-Parent Households in Weld County
According to the poverty data in Weld County, 4.8% or 282 single-father households and 20.7% or 2,372 single-mother households are living below the poverty line. Among single-father households, those with 5 or more children have the highest poverty rate, with 24 households (100.0%) experiencing poverty. Likewise, among single-mother households, those with 5 or more children have the highest poverty rate, with 90 households (59.2%) falling below the poverty line.
| Children | Single Father | Single Mother |
| No Children | 90 (3.6%) | 394 (10.4%) |
| 1 or 2 Children | 136 (5.0%) | 1,136 (19.8%) |
| 3 or 4 Children | 32 (4.9%) | 752 (43.4%) |
| 5 or more Children | 24 (100.0%) | 90 (59.2%) |
| Total | 282 (4.8%) | 2,372 (20.7%) |
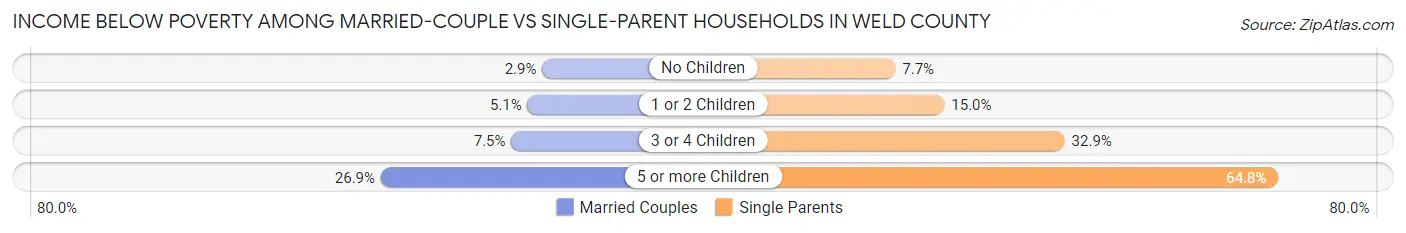
Income Below Poverty Among Married-Couple vs Single-Parent Households in Weld County
The poverty data for Weld County shows that 2,903 of the married-couple family households (4.3%) and 2,654 of the single-parent households (15.3%) are living below the poverty level. Within the married-couple family households, those with 5 or more children have the highest poverty rate, with 134 households (26.9%) falling below the poverty line. Among the single-parent households, those with 5 or more children have the highest poverty rate, with 114 household (64.8%) living below poverty.
| Children | Married-Couple Families | Single-Parent Households |
| No Children | 989 (2.9%) | 484 (7.7%) |
| 1 or 2 Children | 1,268 (5.1%) | 1,272 (15.0%) |
| 3 or 4 Children | 512 (7.5%) | 784 (32.9%) |
| 5 or more Children | 134 (26.9%) | 114 (64.8%) |
| Total | 2,903 (4.3%) | 2,654 (15.3%) |
Employment Characteristics in Weld County
Employment by Class of Employer in Weld County
Among the 166,155 employed individuals in Weld County, private company employees (115,165 | 69.3%), local government employees (13,445 | 8.1%), and not-for-profit organizations (11,542 | 7.0%) make up the most common classes of employment.
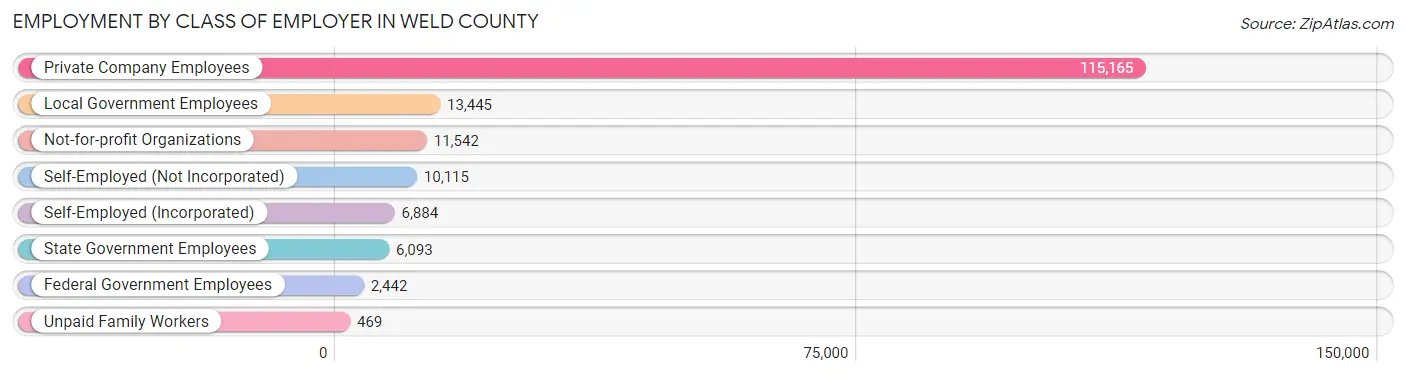
| Employer Class | # Employees | % Employees |
| Private Company Employees | 115,165 | 69.3% |
| Self-Employed (Incorporated) | 6,884 | 4.1% |
| Self-Employed (Not Incorporated) | 10,115 | 6.1% |
| Not-for-profit Organizations | 11,542 | 7.0% |
| Local Government Employees | 13,445 | 8.1% |
| State Government Employees | 6,093 | 3.7% |
| Federal Government Employees | 2,442 | 1.5% |
| Unpaid Family Workers | 469 | 0.3% |
| Total | 166,155 | 100.0% |
Employment Status by Age in Weld County
According to the labor force statistics for Weld County, out of the total population over 16 years of age (255,302), 69.6% or 177,690 individuals are in the labor force, with 4.9% or 8,707 of them unemployed. The age group with the highest labor force participation rate is 45 to 54 years, with 86.1% or 34,215 individuals in the labor force. Within the labor force, the 16 to 19 years age range has the highest percentage of unemployed individuals, with 15.1% or 1,393 of them being unemployed.
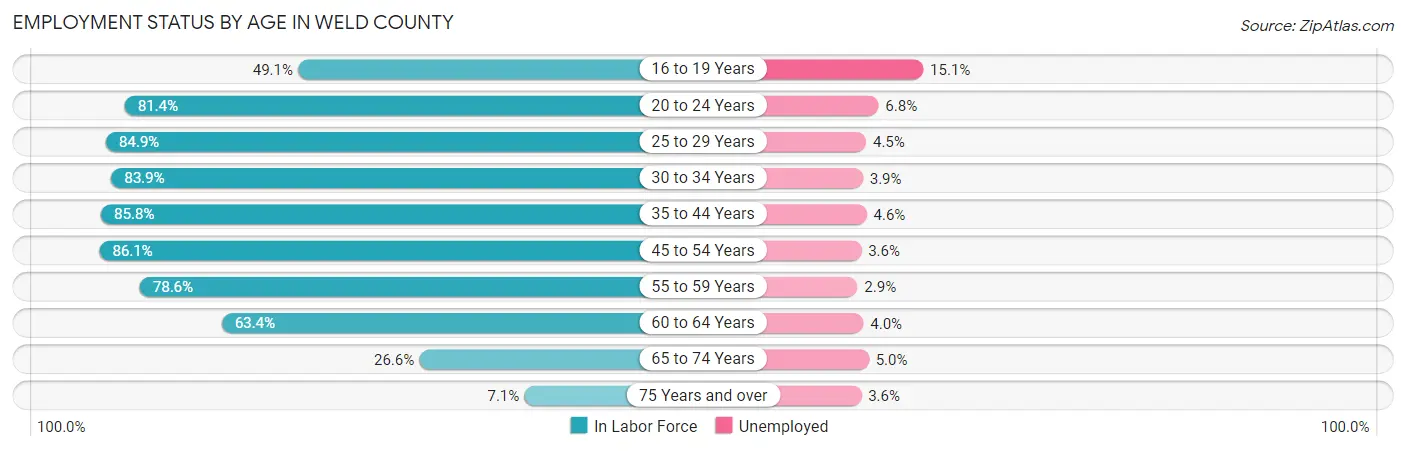
| Age Bracket | In Labor Force | Unemployed |
| 16 to 19 Years | 9,224 (49.1%) | 1,393 (15.1%) |
| 20 to 24 Years | 17,055 (81.4%) | 1,160 (6.8%) |
| 25 to 29 Years | 20,143 (84.9%) | 906 (4.5%) |
| 30 to 34 Years | 21,968 (83.9%) | 857 (3.9%) |
| 35 to 44 Years | 40,927 (85.8%) | 1,883 (4.6%) |
| 45 to 54 Years | 34,215 (86.1%) | 1,232 (3.6%) |
| 55 to 59 Years | 14,408 (78.6%) | 418 (2.9%) |
| 60 to 64 Years | 11,784 (63.4%) | 471 (4.0%) |
| 65 to 74 Years | 6,900 (26.6%) | 345 (5.0%) |
| 75 Years and over | 1,091 (7.1%) | 39 (3.6%) |
| Total | 177,690 (69.6%) | 8,707 (4.9%) |
Employment Status by Educational Attainment in Weld County
According to labor force statistics for Weld County, 82.3% of individuals (143,419) out of the total population between 25 and 64 years of age (174,264) are in the labor force, with 4.0% or 5,737 of them being unemployed. The group with the highest labor force participation rate are those with the educational attainment of bachelor's degree or higher, with 88.9% or 48,968 individuals in the labor force. Within the labor force, individuals with less than high school education have the highest percentage of unemployment, with 6.6% or 936 of them being unemployed.
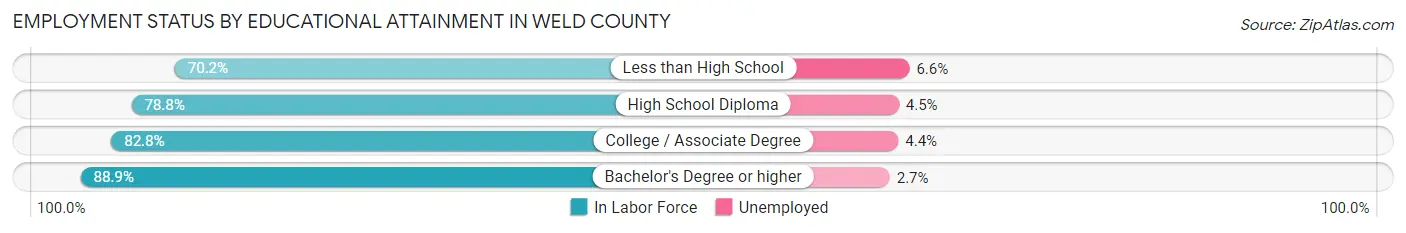
| Educational Attainment | In Labor Force | Unemployed |
| Less than High School | 14,176 (70.2%) | 1,333 (6.6%) |
| High School Diploma | 33,081 (78.8%) | 1,889 (4.5%) |
| College / Associate Degree | 47,202 (82.8%) | 2,508 (4.4%) |
| Bachelor's Degree or higher | 48,968 (88.9%) | 1,487 (2.7%) |
| Total | 143,419 (82.3%) | 6,971 (4.0%) |
Employment Occupations by Sex in Weld County
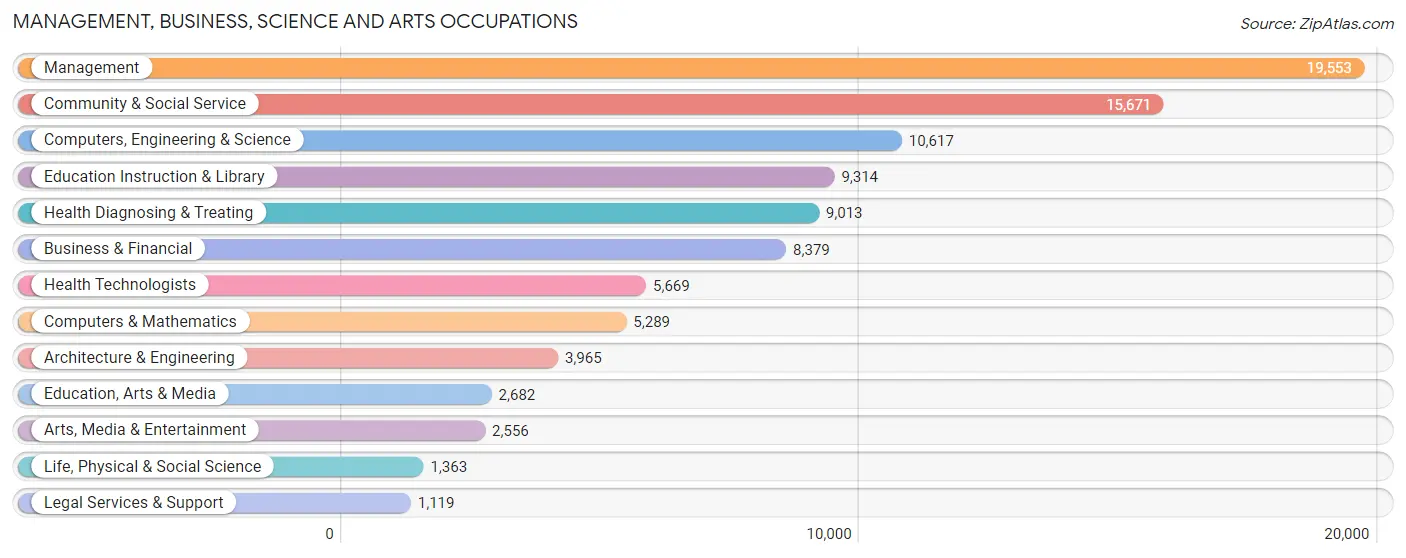
Management, Business, Science and Arts Occupations
The most common Management, Business, Science and Arts occupations in Weld County are Management (19,553 | 11.6%), Community & Social Service (15,671 | 9.3%), Computers, Engineering & Science (10,617 | 6.3%), Education Instruction & Library (9,314 | 5.5%), and Health Diagnosing & Treating (9,013 | 5.3%).
Management, Business, Science and Arts Occupations by Sex
Within the Management, Business, Science and Arts occupations in Weld County, the most male-oriented occupations are Architecture & Engineering (82.5%), Computers & Mathematics (76.9%), and Computers, Engineering & Science (76.8%), while the most female-oriented occupations are Health Diagnosing & Treating (75.2%), Education Instruction & Library (74.9%), and Health Technologists (74.3%).
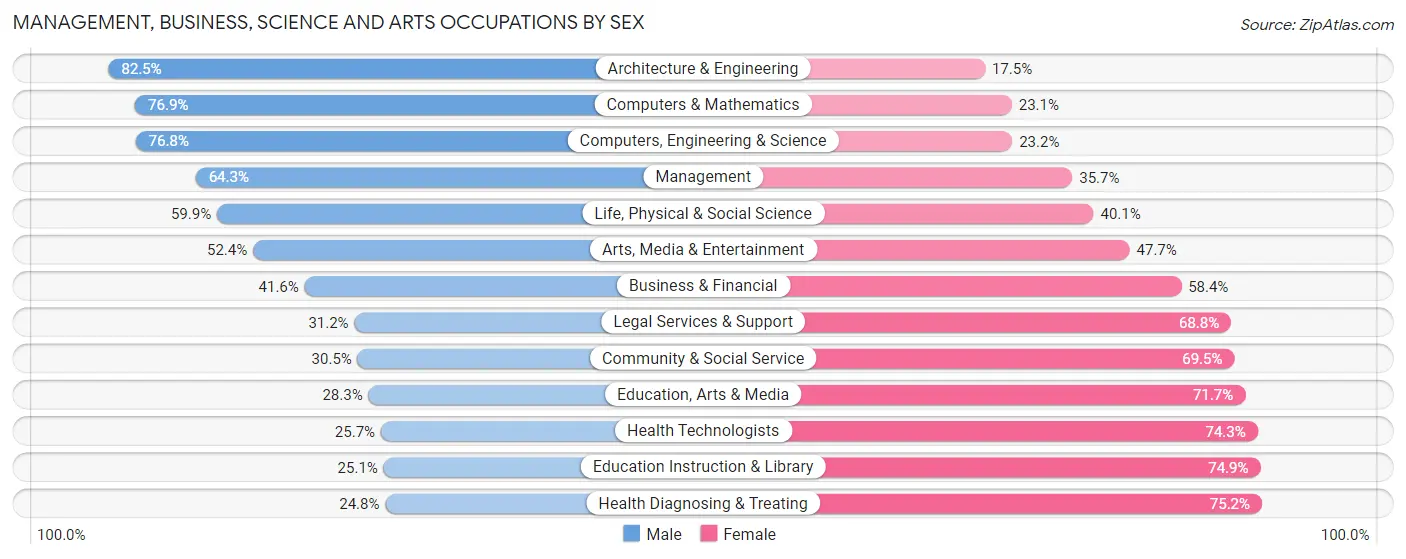
| Occupation | Male | Female |
| Management | 12,573 (64.3%) | 6,980 (35.7%) |
| Business & Financial | 3,485 (41.6%) | 4,894 (58.4%) |
| Computers, Engineering & Science | 8,157 (76.8%) | 2,460 (23.2%) |
| Computers & Mathematics | 4,069 (76.9%) | 1,220 (23.1%) |
| Architecture & Engineering | 3,272 (82.5%) | 693 (17.5%) |
| Life, Physical & Social Science | 816 (59.9%) | 547 (40.1%) |
| Community & Social Service | 4,783 (30.5%) | 10,888 (69.5%) |
| Education, Arts & Media | 758 (28.3%) | 1,924 (71.7%) |
| Legal Services & Support | 349 (31.2%) | 770 (68.8%) |
| Education Instruction & Library | 2,338 (25.1%) | 6,976 (74.9%) |
| Arts, Media & Entertainment | 1,338 (52.3%) | 1,218 (47.6%) |
| Health Diagnosing & Treating | 2,232 (24.8%) | 6,781 (75.2%) |
| Health Technologists | 1,455 (25.7%) | 4,214 (74.3%) |
| Total (Category) | 31,230 (49.4%) | 32,003 (50.6%) |
| Total (Overall) | 94,848 (56.2%) | 73,972 (43.8%) |
Services Occupations
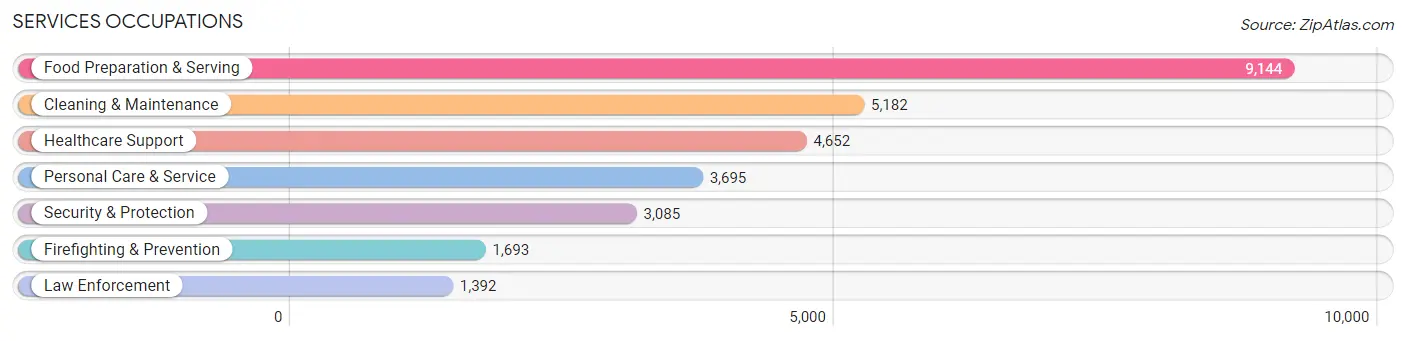
The most common Services occupations in Weld County are Food Preparation & Serving (9,144 | 5.4%), Cleaning & Maintenance (5,182 | 3.1%), Healthcare Support (4,652 | 2.8%), Personal Care & Service (3,695 | 2.2%), and Security & Protection (3,085 | 1.8%).
Services Occupations by Sex
Within the Services occupations in Weld County, the most male-oriented occupations are Law Enforcement (85.2%), Security & Protection (78.8%), and Firefighting & Prevention (73.5%), while the most female-oriented occupations are Healthcare Support (91.1%), Personal Care & Service (80.6%), and Food Preparation & Serving (55.2%).
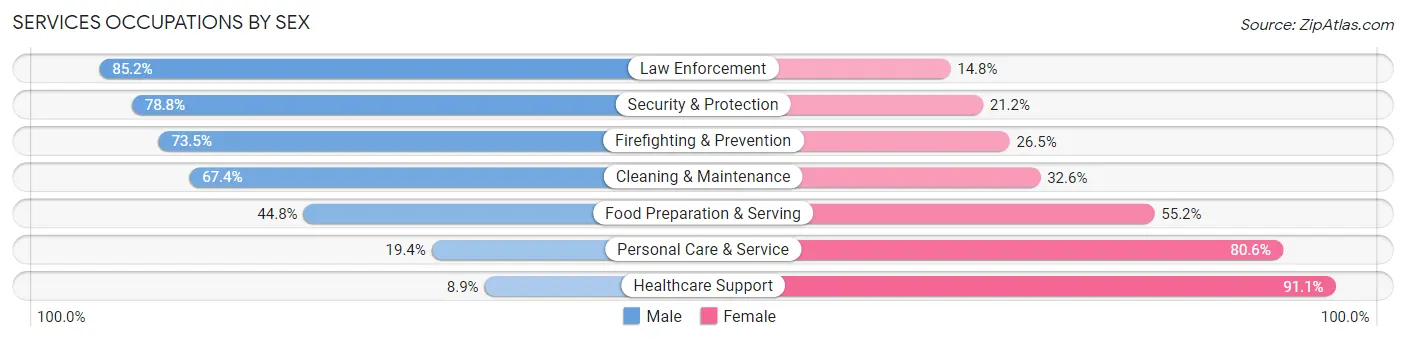
| Occupation | Male | Female |
| Healthcare Support | 416 (8.9%) | 4,236 (91.1%) |
| Security & Protection | 2,430 (78.8%) | 655 (21.2%) |
| Firefighting & Prevention | 1,244 (73.5%) | 449 (26.5%) |
| Law Enforcement | 1,186 (85.2%) | 206 (14.8%) |
| Food Preparation & Serving | 4,096 (44.8%) | 5,048 (55.2%) |
| Cleaning & Maintenance | 3,492 (67.4%) | 1,690 (32.6%) |
| Personal Care & Service | 717 (19.4%) | 2,978 (80.6%) |
| Total (Category) | 11,151 (43.3%) | 14,607 (56.7%) |
| Total (Overall) | 94,848 (56.2%) | 73,972 (43.8%) |
Sales and Office Occupations
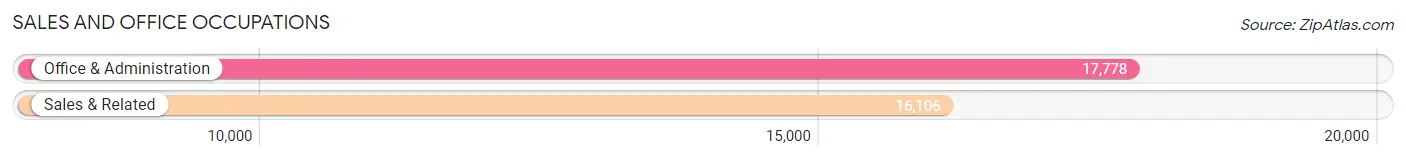
The most common Sales and Office occupations in Weld County are Office & Administration (17,778 | 10.5%), and Sales & Related (16,106 | 9.5%).
Sales and Office Occupations by Sex
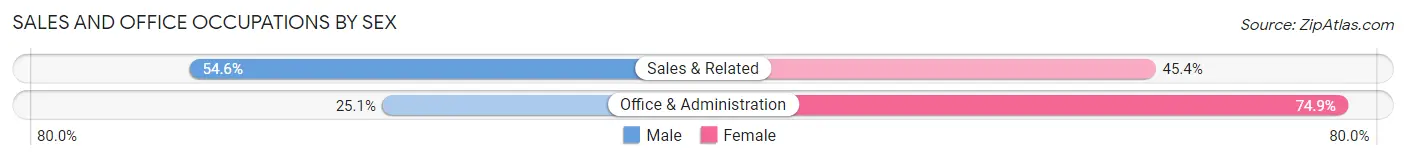
| Occupation | Male | Female |
| Sales & Related | 8,795 (54.6%) | 7,311 (45.4%) |
| Office & Administration | 4,456 (25.1%) | 13,322 (74.9%) |
| Total (Category) | 13,251 (39.1%) | 20,633 (60.9%) |
| Total (Overall) | 94,848 (56.2%) | 73,972 (43.8%) |
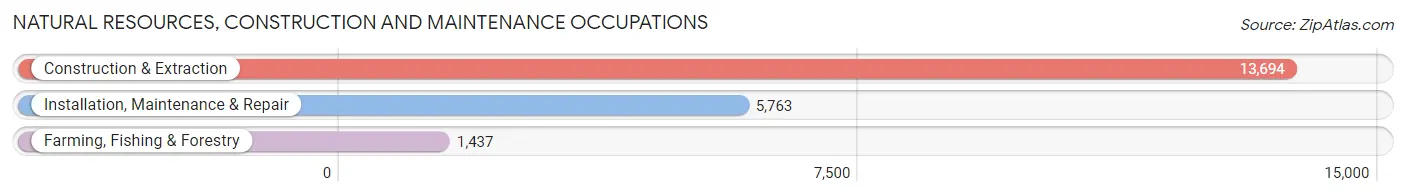
Natural Resources, Construction and Maintenance Occupations
The most common Natural Resources, Construction and Maintenance occupations in Weld County are Construction & Extraction (13,694 | 8.1%), Installation, Maintenance & Repair (5,763 | 3.4%), and Farming, Fishing & Forestry (1,437 | 0.9%).
Natural Resources, Construction and Maintenance Occupations by Sex
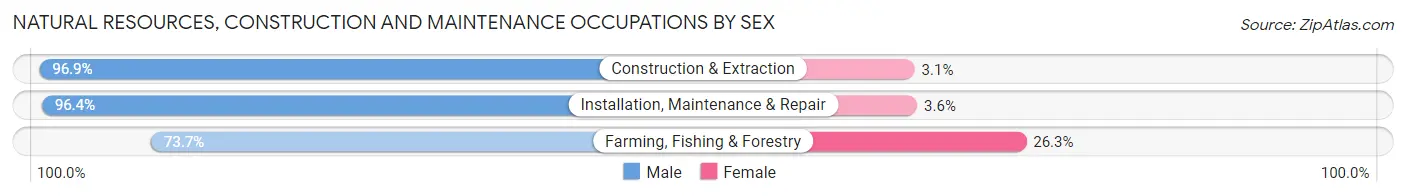
| Occupation | Male | Female |
| Farming, Fishing & Forestry | 1,059 (73.7%) | 378 (26.3%) |
| Construction & Extraction | 13,274 (96.9%) | 420 (3.1%) |
| Installation, Maintenance & Repair | 5,556 (96.4%) | 207 (3.6%) |
| Total (Category) | 19,889 (95.2%) | 1,005 (4.8%) |
| Total (Overall) | 94,848 (56.2%) | 73,972 (43.8%) |
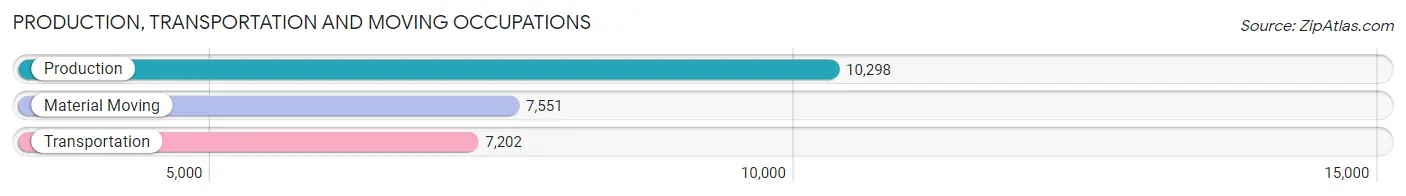
Production, Transportation and Moving Occupations
The most common Production, Transportation and Moving occupations in Weld County are Production (10,298 | 6.1%), Material Moving (7,551 | 4.5%), and Transportation (7,202 | 4.3%).
Production, Transportation and Moving Occupations by Sex
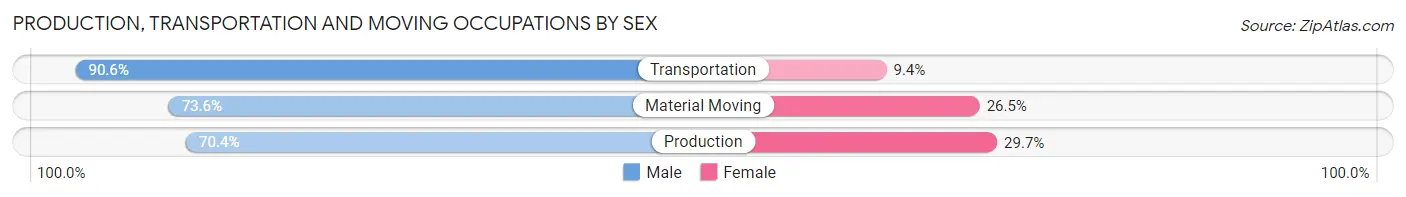
| Occupation | Male | Female |
| Production | 7,245 (70.4%) | 3,053 (29.6%) |
| Transportation | 6,528 (90.6%) | 674 (9.4%) |
| Material Moving | 5,554 (73.6%) | 1,997 (26.5%) |
| Total (Category) | 19,327 (77.1%) | 5,724 (22.9%) |
| Total (Overall) | 94,848 (56.2%) | 73,972 (43.8%) |
Employment Industries by Sex in Weld County
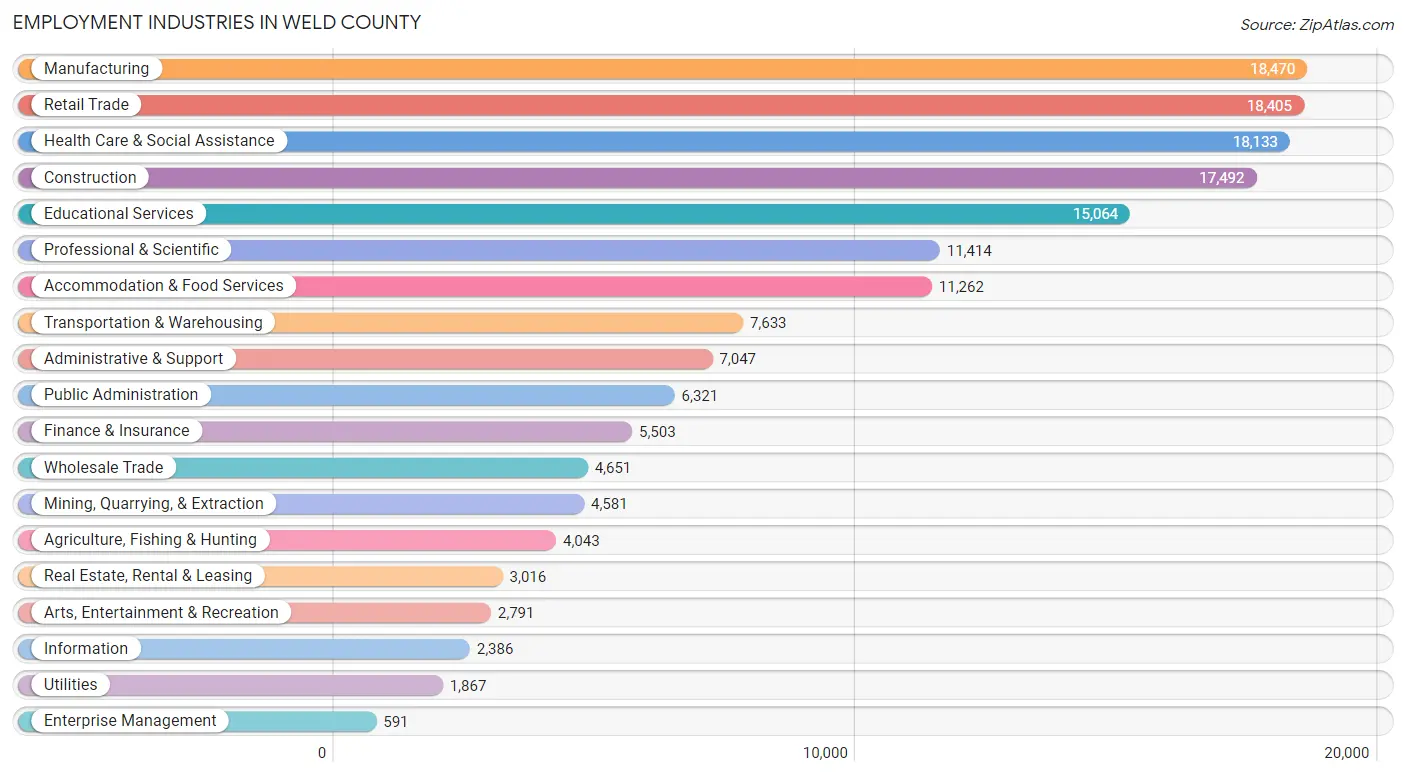
Employment Industries in Weld County
The major employment industries in Weld County include Manufacturing (18,470 | 10.9%), Retail Trade (18,405 | 10.9%), Health Care & Social Assistance (18,133 | 10.7%), Construction (17,492 | 10.4%), and Educational Services (15,064 | 8.9%).
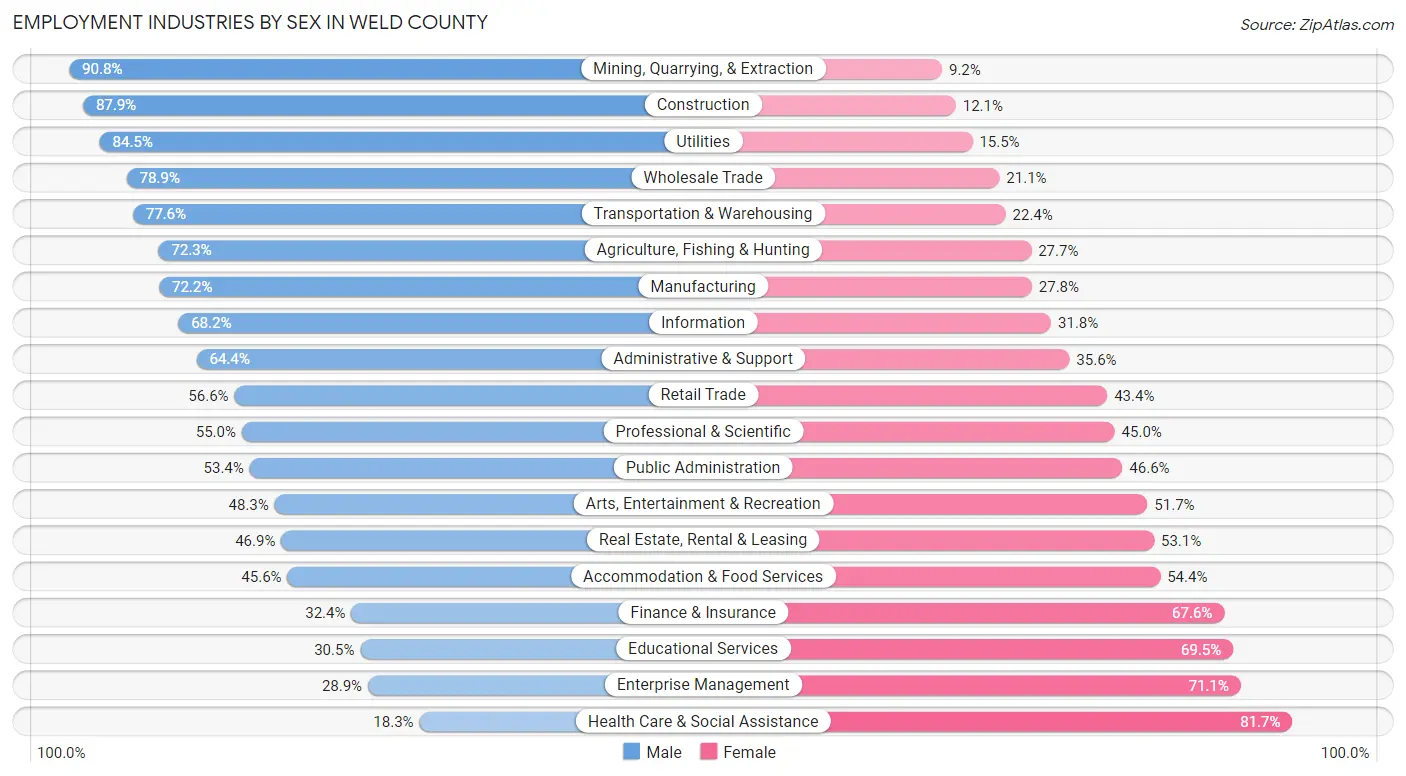
Employment Industries by Sex in Weld County
The Weld County industries that see more men than women are Mining, Quarrying, & Extraction (90.8%), Construction (87.9%), and Utilities (84.5%), whereas the industries that tend to have a higher number of women are Health Care & Social Assistance (81.7%), Enterprise Management (71.1%), and Educational Services (69.5%).
| Industry | Male | Female |
| Agriculture, Fishing & Hunting | 2,923 (72.3%) | 1,120 (27.7%) |
| Mining, Quarrying, & Extraction | 4,158 (90.8%) | 423 (9.2%) |
| Construction | 15,379 (87.9%) | 2,113 (12.1%) |
| Manufacturing | 13,329 (72.2%) | 5,141 (27.8%) |
| Wholesale Trade | 3,669 (78.9%) | 982 (21.1%) |
| Retail Trade | 10,411 (56.6%) | 7,994 (43.4%) |
| Transportation & Warehousing | 5,923 (77.6%) | 1,710 (22.4%) |
| Utilities | 1,577 (84.5%) | 290 (15.5%) |
| Information | 1,627 (68.2%) | 759 (31.8%) |
| Finance & Insurance | 1,782 (32.4%) | 3,721 (67.6%) |
| Real Estate, Rental & Leasing | 1,414 (46.9%) | 1,602 (53.1%) |
| Professional & Scientific | 6,282 (55.0%) | 5,132 (45.0%) |
| Enterprise Management | 171 (28.9%) | 420 (71.1%) |
| Administrative & Support | 4,538 (64.4%) | 2,509 (35.6%) |
| Educational Services | 4,599 (30.5%) | 10,465 (69.5%) |
| Health Care & Social Assistance | 3,315 (18.3%) | 14,818 (81.7%) |
| Arts, Entertainment & Recreation | 1,347 (48.3%) | 1,444 (51.7%) |
| Accommodation & Food Services | 5,136 (45.6%) | 6,126 (54.4%) |
| Public Administration | 3,377 (53.4%) | 2,944 (46.6%) |
| Total | 94,848 (56.2%) | 73,972 (43.8%) |
Education in Weld County
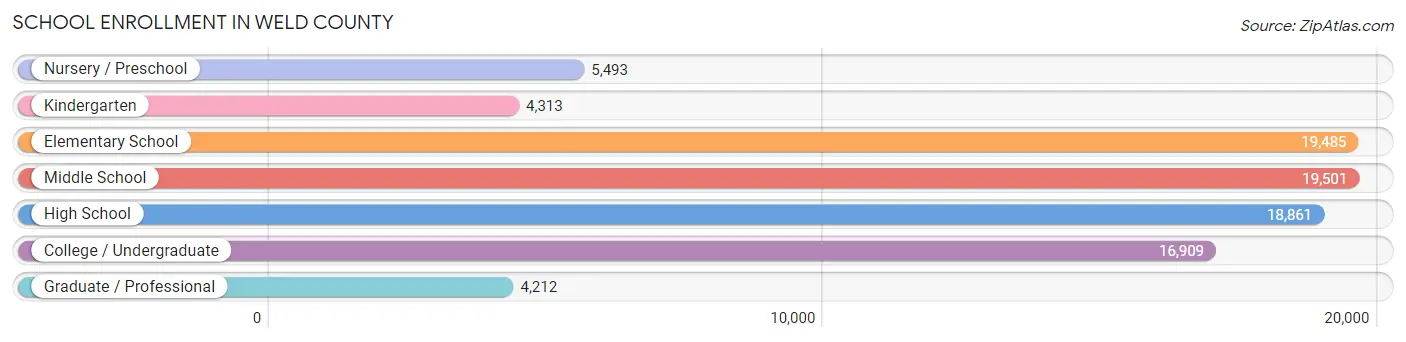
School Enrollment in Weld County
The most common levels of schooling among the 88,774 students in Weld County are middle school (19,501 | 22.0%), elementary school (19,485 | 22.0%), and high school (18,861 | 21.2%).
| School Level | # Students | % Students |
| Nursery / Preschool | 5,493 | 6.2% |
| Kindergarten | 4,313 | 4.9% |
| Elementary School | 19,485 | 22.0% |
| Middle School | 19,501 | 22.0% |
| High School | 18,861 | 21.2% |
| College / Undergraduate | 16,909 | 19.1% |
| Graduate / Professional | 4,212 | 4.7% |
| Total | 88,774 | 100.0% |
School Enrollment by Age by Funding Source in Weld County
Out of a total of 88,774 students who are enrolled in schools in Weld County, 8,611 (9.7%) attend a private institution, while the remaining 80,163 (90.3%) are enrolled in public schools. The age group of 3 to 4 year olds has the highest likelihood of being enrolled in private schools, with 1,191 (27.9% in the age bracket) enrolled. Conversely, the age group of 18 to 19 year olds has the lowest likelihood of being enrolled in a private school, with 7,063 (95.9% in the age bracket) attending a public institution.
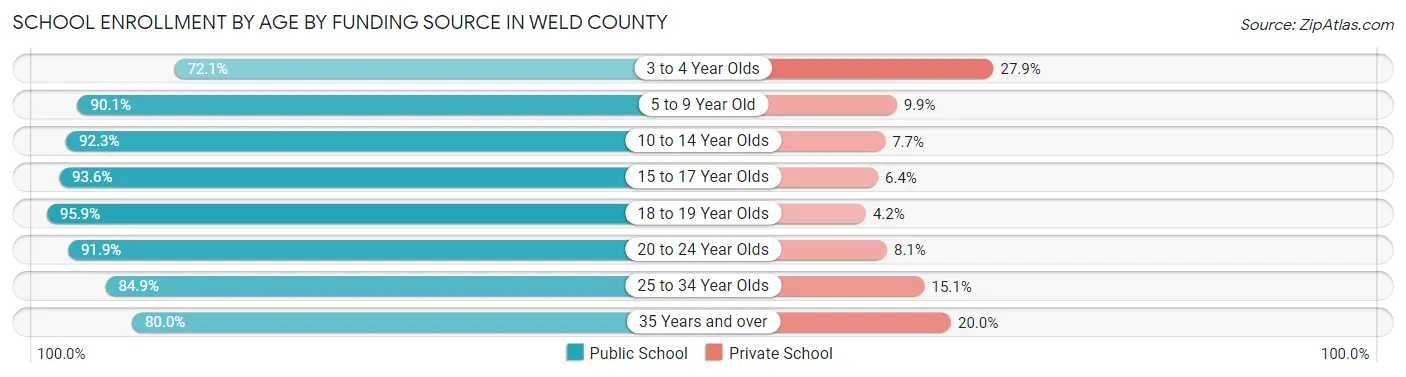
| Age Bracket | Public School | Private School |
| 3 to 4 Year Olds | 3,075 (72.1%) | 1,191 (27.9%) |
| 5 to 9 Year Old | 19,774 (90.1%) | 2,171 (9.9%) |
| 10 to 14 Year Olds | 22,417 (92.3%) | 1,881 (7.7%) |
| 15 to 17 Year Olds | 13,053 (93.6%) | 896 (6.4%) |
| 18 to 19 Year Olds | 7,063 (95.9%) | 306 (4.2%) |
| 20 to 24 Year Olds | 7,210 (91.9%) | 634 (8.1%) |
| 25 to 34 Year Olds | 4,232 (84.9%) | 751 (15.1%) |
| 35 Years and over | 3,296 (80.0%) | 824 (20.0%) |
| Total | 80,163 (90.3%) | 8,611 (9.7%) |
Educational Attainment by Field of Study in Weld County
Business (13,892 | 19.1%), education (8,894 | 12.2%), science & technology (7,388 | 10.2%), bio, nature & agricultural (6,660 | 9.2%), and arts & humanities (5,964 | 8.2%) are the most common fields of study among 72,595 individuals in Weld County who have obtained a bachelor's degree or higher.
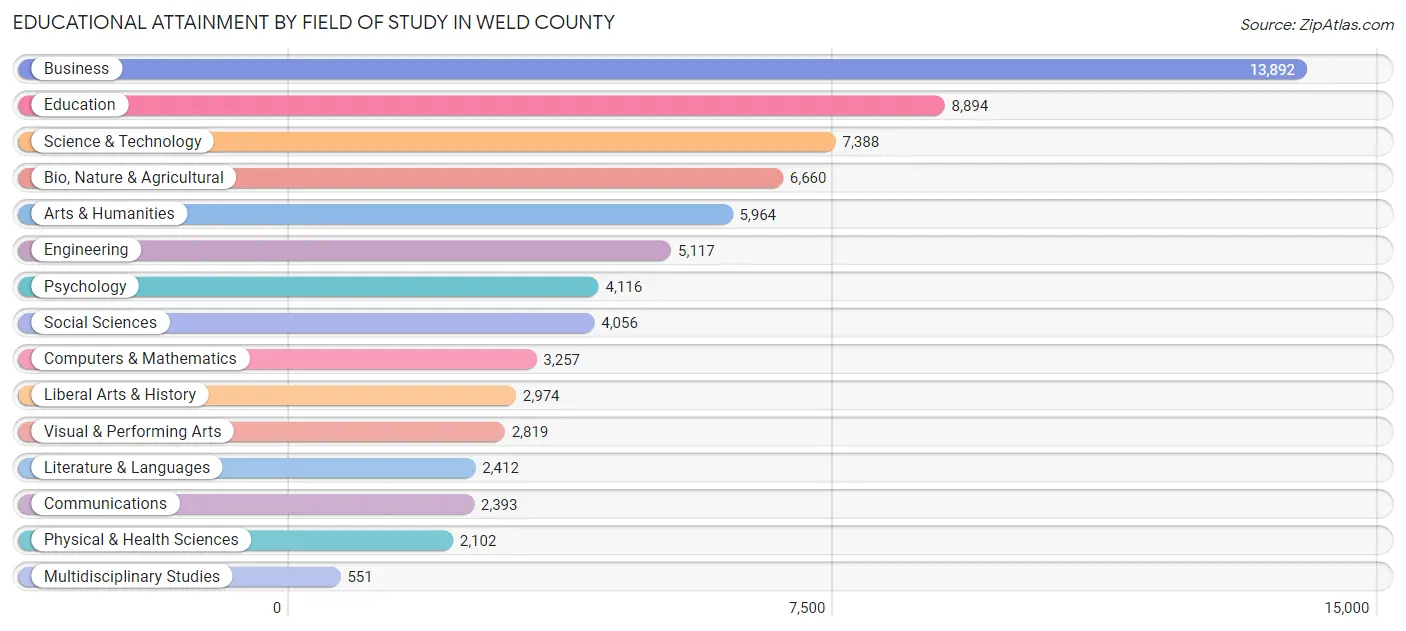
| Field of Study | # Graduates | % Graduates |
| Computers & Mathematics | 3,257 | 4.5% |
| Bio, Nature & Agricultural | 6,660 | 9.2% |
| Physical & Health Sciences | 2,102 | 2.9% |
| Psychology | 4,116 | 5.7% |
| Social Sciences | 4,056 | 5.6% |
| Engineering | 5,117 | 7.0% |
| Multidisciplinary Studies | 551 | 0.8% |
| Science & Technology | 7,388 | 10.2% |
| Business | 13,892 | 19.1% |
| Education | 8,894 | 12.2% |
| Literature & Languages | 2,412 | 3.3% |
| Liberal Arts & History | 2,974 | 4.1% |
| Visual & Performing Arts | 2,819 | 3.9% |
| Communications | 2,393 | 3.3% |
| Arts & Humanities | 5,964 | 8.2% |
| Total | 72,595 | 100.0% |
Transportation & Commute in Weld County
Vehicle Availability by Sex in Weld County
The most prevalent vehicle ownership categories in Weld County are males with 2 vehicles (35,101, accounting for 37.8%) and females with 2 vehicles (26,577, making up 49.0%).
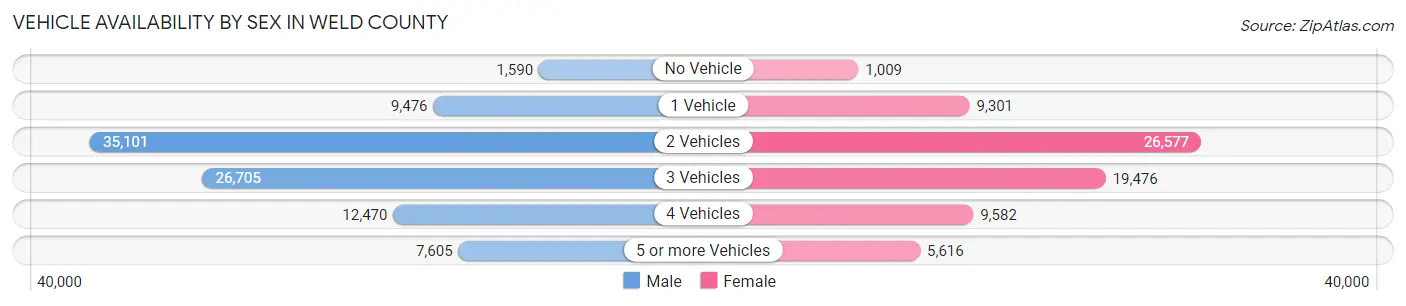
| Vehicles Available | Male | Female |
| No Vehicle | 1,590 (1.7%) | 1,009 (1.4%) |
| 1 Vehicle | 9,476 (10.2%) | 9,301 (13.0%) |
| 2 Vehicles | 35,101 (37.8%) | 26,577 (37.1%) |
| 3 Vehicles | 26,705 (28.7%) | 19,476 (27.2%) |
| 4 Vehicles | 12,470 (13.4%) | 9,582 (13.4%) |
| 5 or more Vehicles | 7,605 (8.2%) | 5,616 (7.9%) |
| Total | 92,947 (100.0%) | 71,561 (100.0%) |
Commute Time in Weld County
The most frequently occuring commute durations in Weld County are 30 to 34 minutes (20,644 commuters, 14.0%), 15 to 19 minutes (20,483 commuters, 13.9%), and 20 to 24 minutes (19,361 commuters, 13.1%).
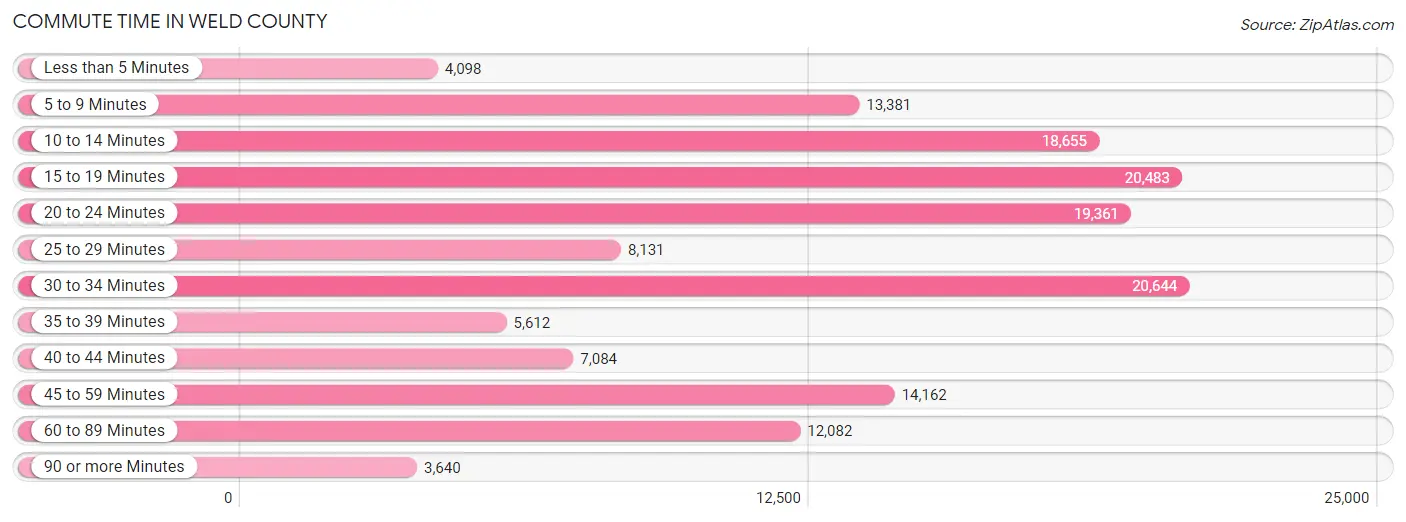
| Commute Time | # Commuters | % Commuters |
| Less than 5 Minutes | 4,098 | 2.8% |
| 5 to 9 Minutes | 13,381 | 9.1% |
| 10 to 14 Minutes | 18,655 | 12.7% |
| 15 to 19 Minutes | 20,483 | 13.9% |
| 20 to 24 Minutes | 19,361 | 13.1% |
| 25 to 29 Minutes | 8,131 | 5.5% |
| 30 to 34 Minutes | 20,644 | 14.0% |
| 35 to 39 Minutes | 5,612 | 3.8% |
| 40 to 44 Minutes | 7,084 | 4.8% |
| 45 to 59 Minutes | 14,162 | 9.6% |
| 60 to 89 Minutes | 12,082 | 8.2% |
| 90 or more Minutes | 3,640 | 2.5% |
Commute Time by Sex in Weld County
The most common commute times in Weld County are 30 to 34 minutes (12,485 commuters, 14.8%) for males and 10 to 14 minutes (9,627 commuters, 15.3%) for females.
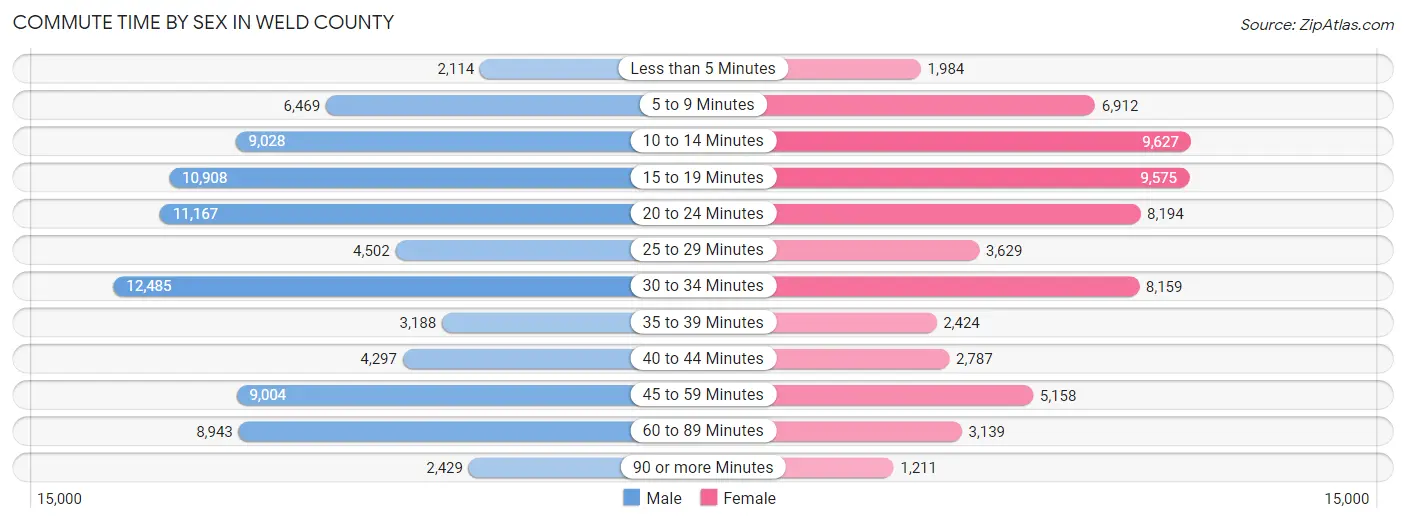
| Commute Time | Male | Female |
| Less than 5 Minutes | 2,114 (2.5%) | 1,984 (3.2%) |
| 5 to 9 Minutes | 6,469 (7.6%) | 6,912 (11.0%) |
| 10 to 14 Minutes | 9,028 (10.7%) | 9,627 (15.3%) |
| 15 to 19 Minutes | 10,908 (12.9%) | 9,575 (15.2%) |
| 20 to 24 Minutes | 11,167 (13.2%) | 8,194 (13.1%) |
| 25 to 29 Minutes | 4,502 (5.3%) | 3,629 (5.8%) |
| 30 to 34 Minutes | 12,485 (14.8%) | 8,159 (13.0%) |
| 35 to 39 Minutes | 3,188 (3.8%) | 2,424 (3.9%) |
| 40 to 44 Minutes | 4,297 (5.1%) | 2,787 (4.4%) |
| 45 to 59 Minutes | 9,004 (10.6%) | 5,158 (8.2%) |
| 60 to 89 Minutes | 8,943 (10.6%) | 3,139 (5.0%) |
| 90 or more Minutes | 2,429 (2.9%) | 1,211 (1.9%) |
Time of Departure to Work by Sex in Weld County
The most frequent times of departure to work in Weld County are 6:00 AM to 6:29 AM (12,220, 14.5%) for males and 7:00 AM to 7:29 AM (10,441, 16.6%) for females.
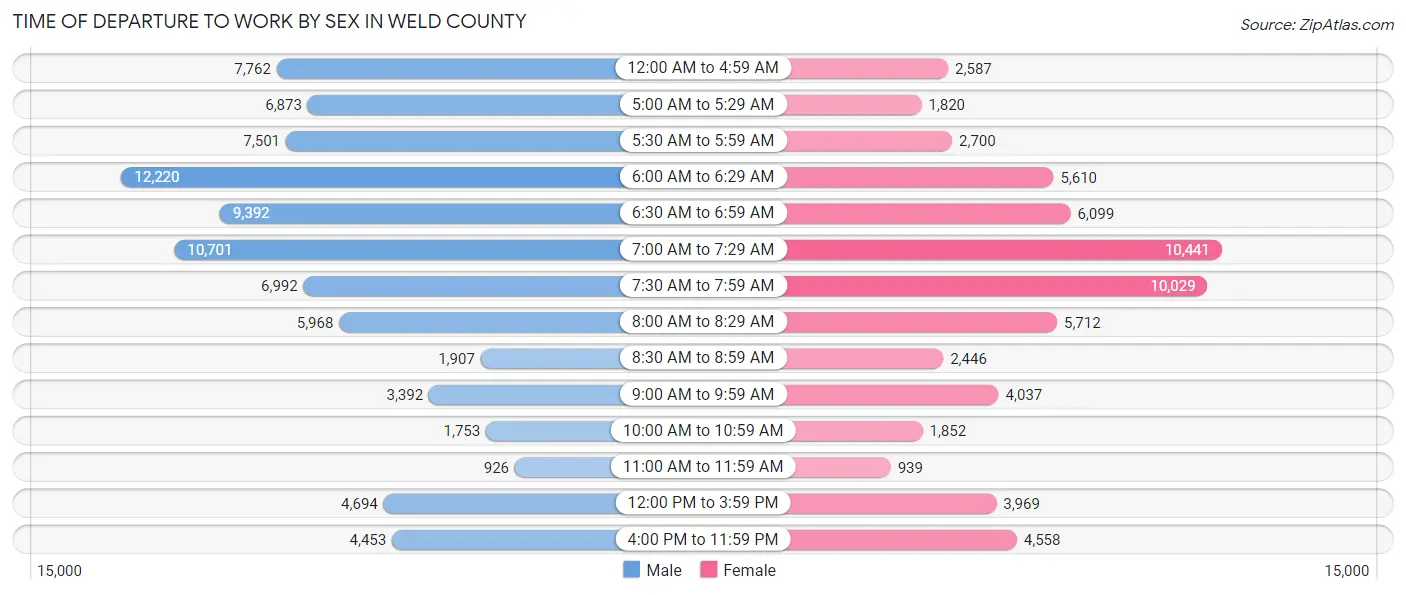
| Time of Departure | Male | Female |
| 12:00 AM to 4:59 AM | 7,762 (9.2%) | 2,587 (4.1%) |
| 5:00 AM to 5:29 AM | 6,873 (8.1%) | 1,820 (2.9%) |
| 5:30 AM to 5:59 AM | 7,501 (8.9%) | 2,700 (4.3%) |
| 6:00 AM to 6:29 AM | 12,220 (14.5%) | 5,610 (8.9%) |
| 6:30 AM to 6:59 AM | 9,392 (11.1%) | 6,099 (9.7%) |
| 7:00 AM to 7:29 AM | 10,701 (12.7%) | 10,441 (16.6%) |
| 7:30 AM to 7:59 AM | 6,992 (8.3%) | 10,029 (16.0%) |
| 8:00 AM to 8:29 AM | 5,968 (7.1%) | 5,712 (9.1%) |
| 8:30 AM to 8:59 AM | 1,907 (2.3%) | 2,446 (3.9%) |
| 9:00 AM to 9:59 AM | 3,392 (4.0%) | 4,037 (6.4%) |
| 10:00 AM to 10:59 AM | 1,753 (2.1%) | 1,852 (2.9%) |
| 11:00 AM to 11:59 AM | 926 (1.1%) | 939 (1.5%) |
| 12:00 PM to 3:59 PM | 4,694 (5.6%) | 3,969 (6.3%) |
| 4:00 PM to 11:59 PM | 4,453 (5.3%) | 4,558 (7.3%) |
| Total | 84,534 (100.0%) | 62,799 (100.0%) |
Housing Occupancy in Weld County
Occupancy by Ownership in Weld County
Of the total 115,536 dwellings in Weld County, owner-occupied units account for 86,836 (75.2%), while renter-occupied units make up 28,700 (24.8%).
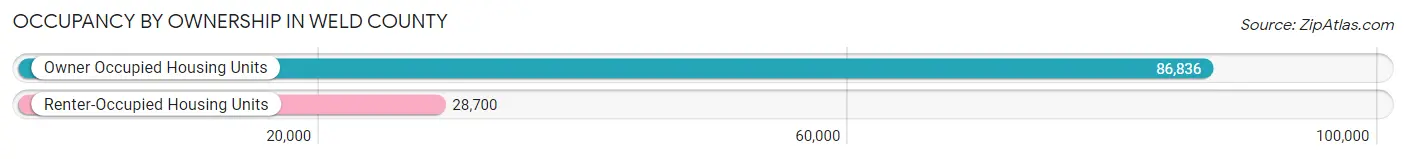
| Occupancy | # Housing Units | % Housing Units |
| Owner Occupied Housing Units | 86,836 | 75.2% |
| Renter-Occupied Housing Units | 28,700 | 24.8% |
| Total Occupied Housing Units | 115,536 | 100.0% |
Occupancy by Household Size in Weld County
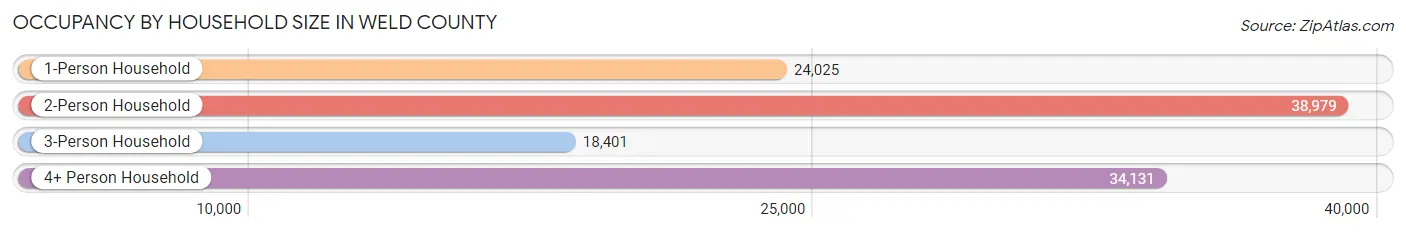
| Household Size | # Housing Units | % Housing Units |
| 1-Person Household | 24,025 | 20.8% |
| 2-Person Household | 38,979 | 33.7% |
| 3-Person Household | 18,401 | 15.9% |
| 4+ Person Household | 34,131 | 29.5% |
| Total Housing Units | 115,536 | 100.0% |
Occupancy by Ownership by Household Size in Weld County
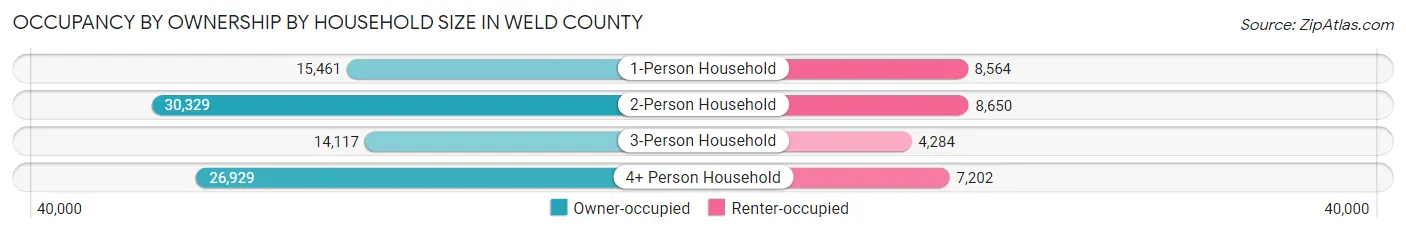
| Household Size | Owner-occupied | Renter-occupied |
| 1-Person Household | 15,461 (64.3%) | 8,564 (35.6%) |
| 2-Person Household | 30,329 (77.8%) | 8,650 (22.2%) |
| 3-Person Household | 14,117 (76.7%) | 4,284 (23.3%) |
| 4+ Person Household | 26,929 (78.9%) | 7,202 (21.1%) |
| Total Housing Units | 86,836 (75.2%) | 28,700 (24.8%) |
Occupancy by Educational Attainment in Weld County
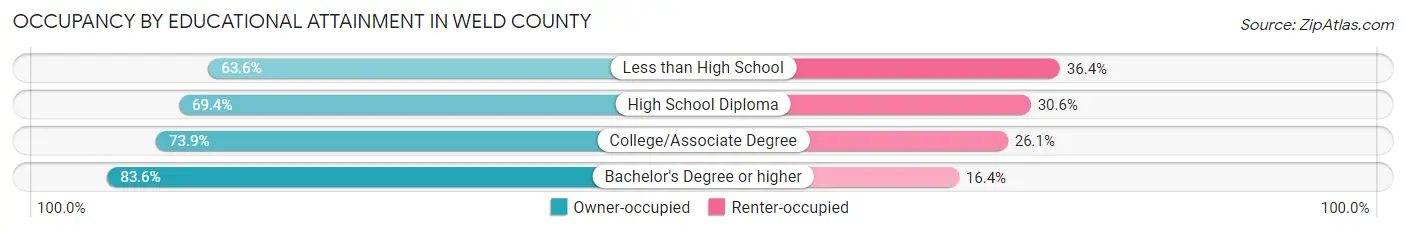
| Household Size | Owner-occupied | Renter-occupied |
| Less than High School | 7,448 (63.6%) | 4,268 (36.4%) |
| High School Diploma | 17,242 (69.4%) | 7,618 (30.6%) |
| College/Associate Degree | 29,454 (73.9%) | 10,399 (26.1%) |
| Bachelor's Degree or higher | 32,692 (83.6%) | 6,415 (16.4%) |
Occupancy by Age of Householder in Weld County
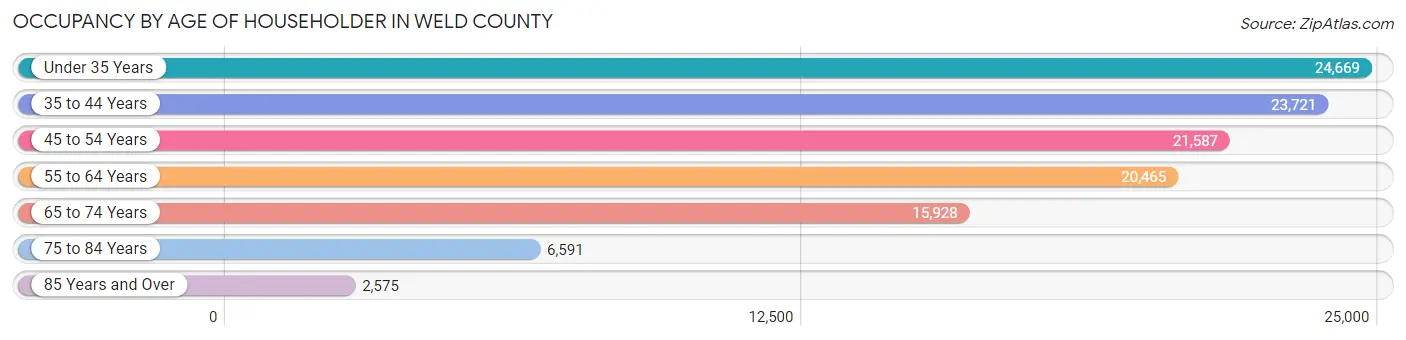
| Age Bracket | # Households | % Households |
| Under 35 Years | 24,669 | 21.3% |
| 35 to 44 Years | 23,721 | 20.5% |
| 45 to 54 Years | 21,587 | 18.7% |
| 55 to 64 Years | 20,465 | 17.7% |
| 65 to 74 Years | 15,928 | 13.8% |
| 75 to 84 Years | 6,591 | 5.7% |
| 85 Years and Over | 2,575 | 2.2% |
| Total | 115,536 | 100.0% |
Housing Finances in Weld County
Median Income by Occupancy in Weld County
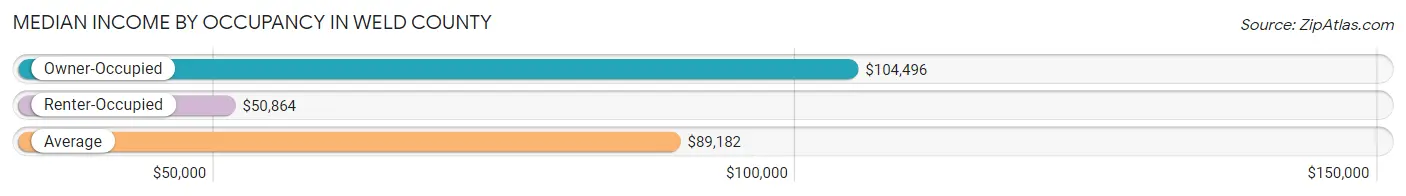
| Occupancy Type | # Households | Median Income |
| Owner-Occupied | 86,836 (75.2%) | $104,496 |
| Renter-Occupied | 28,700 (24.8%) | $50,864 |
| Average | 115,536 (100.0%) | $89,182 |
Occupancy by Householder Income Bracket in Weld County
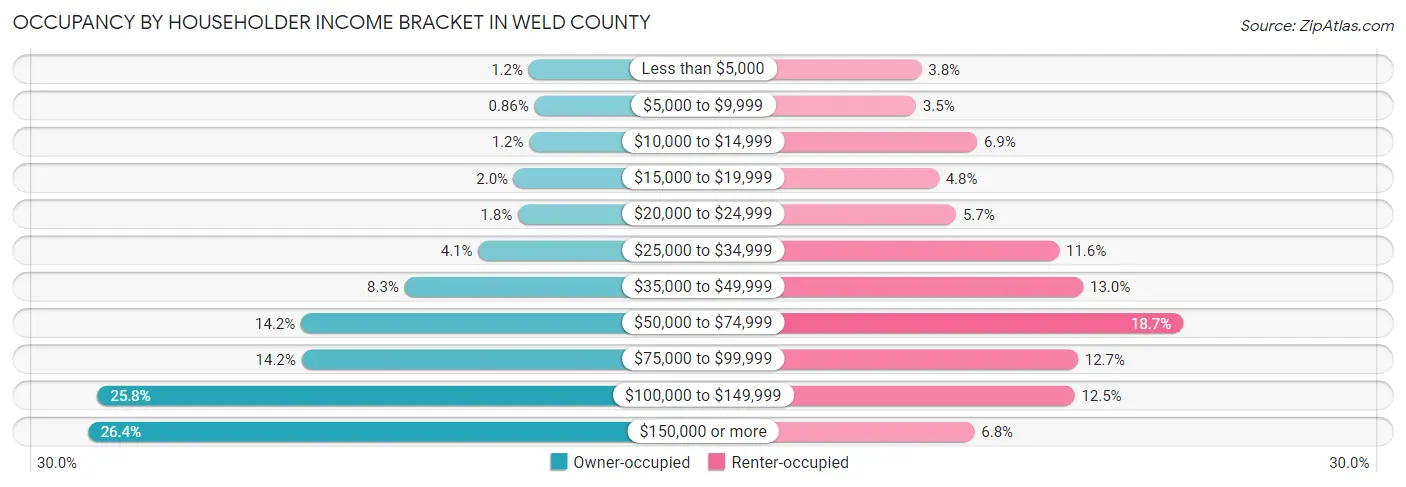
| Income Bracket | Owner-occupied | Renter-occupied |
| Less than $5,000 | 1,033 (1.2%) | 1,080 (3.8%) |
| $5,000 to $9,999 | 749 (0.9%) | 991 (3.5%) |
| $10,000 to $14,999 | 1,009 (1.2%) | 1,991 (6.9%) |
| $15,000 to $19,999 | 1,770 (2.0%) | 1,364 (4.8%) |
| $20,000 to $24,999 | 1,562 (1.8%) | 1,648 (5.7%) |
| $25,000 to $34,999 | 3,538 (4.1%) | 3,339 (11.6%) |
| $35,000 to $49,999 | 7,187 (8.3%) | 3,731 (13.0%) |
| $50,000 to $74,999 | 12,331 (14.2%) | 5,371 (18.7%) |
| $75,000 to $99,999 | 12,304 (14.2%) | 3,645 (12.7%) |
| $100,000 to $149,999 | 22,437 (25.8%) | 3,591 (12.5%) |
| $150,000 or more | 22,916 (26.4%) | 1,949 (6.8%) |
| Total | 86,836 (100.0%) | 28,700 (100.0%) |
Monthly Housing Cost Tiers in Weld County
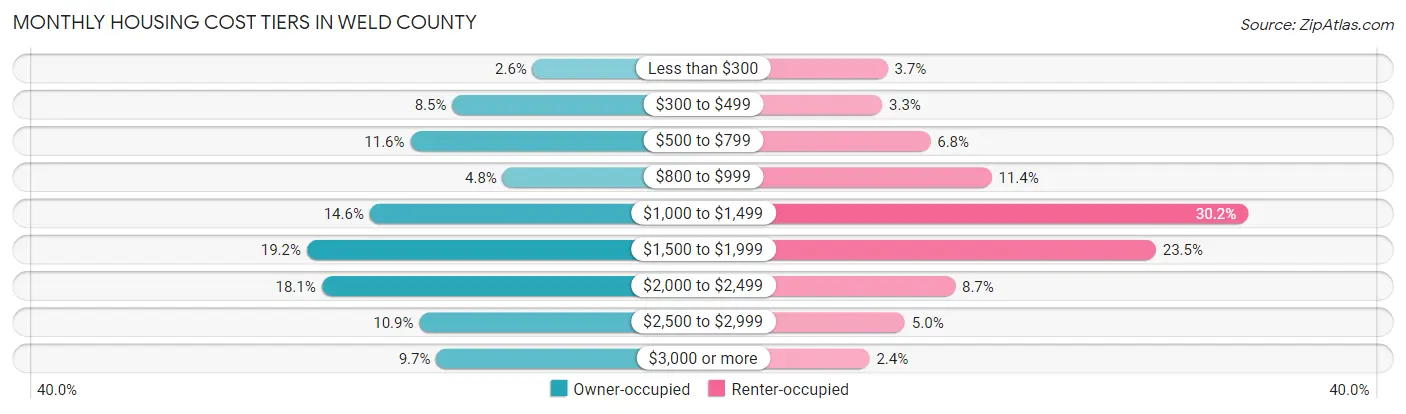
| Monthly Cost | Owner-occupied | Renter-occupied |
| Less than $300 | 2,238 (2.6%) | 1,059 (3.7%) |
| $300 to $499 | 7,380 (8.5%) | 943 (3.3%) |
| $500 to $799 | 10,066 (11.6%) | 1,962 (6.8%) |
| $800 to $999 | 4,158 (4.8%) | 3,257 (11.4%) |
| $1,000 to $1,499 | 12,665 (14.6%) | 8,678 (30.2%) |
| $1,500 to $1,999 | 16,693 (19.2%) | 6,729 (23.4%) |
| $2,000 to $2,499 | 15,742 (18.1%) | 2,485 (8.7%) |
| $2,500 to $2,999 | 9,491 (10.9%) | 1,426 (5.0%) |
| $3,000 or more | 8,403 (9.7%) | 677 (2.4%) |
| Total | 86,836 (100.0%) | 28,700 (100.0%) |
Physical Housing Characteristics in Weld County
Housing Structures in Weld County
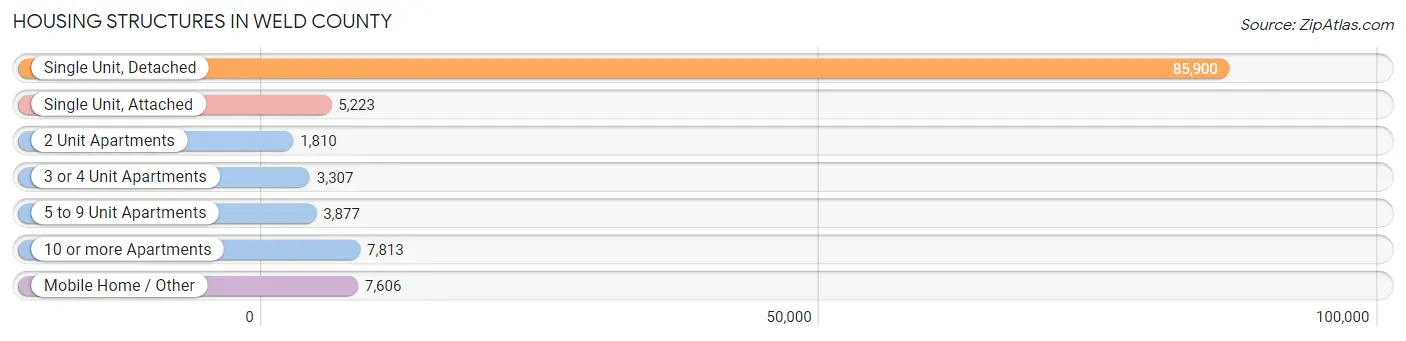
| Structure Type | # Housing Units | % Housing Units |
| Single Unit, Detached | 85,900 | 74.4% |
| Single Unit, Attached | 5,223 | 4.5% |
| 2 Unit Apartments | 1,810 | 1.6% |
| 3 or 4 Unit Apartments | 3,307 | 2.9% |
| 5 to 9 Unit Apartments | 3,877 | 3.4% |
| 10 or more Apartments | 7,813 | 6.8% |
| Mobile Home / Other | 7,606 | 6.6% |
| Total | 115,536 | 100.0% |
Housing Structures by Occupancy in Weld County
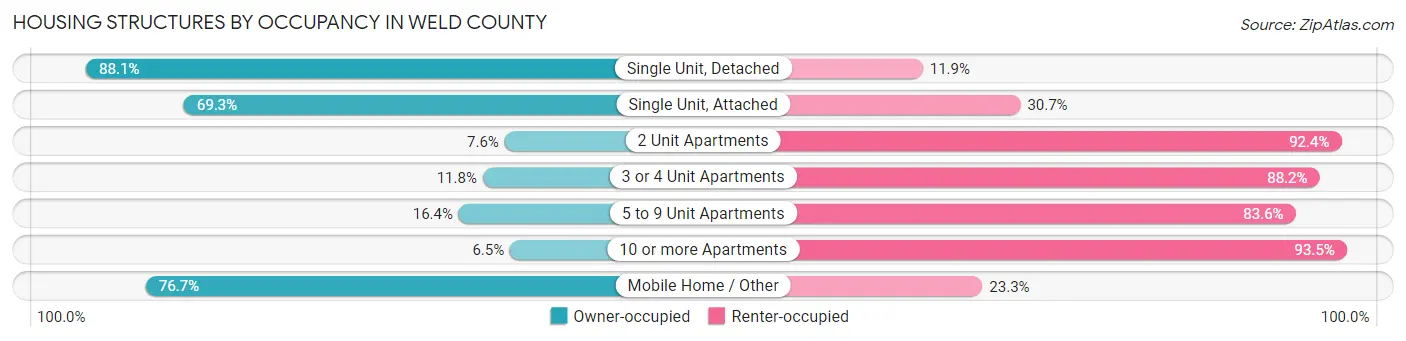
| Structure Type | Owner-occupied | Renter-occupied |
| Single Unit, Detached | 75,711 (88.1%) | 10,189 (11.9%) |
| Single Unit, Attached | 3,621 (69.3%) | 1,602 (30.7%) |
| 2 Unit Apartments | 137 (7.6%) | 1,673 (92.4%) |
| 3 or 4 Unit Apartments | 390 (11.8%) | 2,917 (88.2%) |
| 5 to 9 Unit Apartments | 636 (16.4%) | 3,241 (83.6%) |
| 10 or more Apartments | 510 (6.5%) | 7,303 (93.5%) |
| Mobile Home / Other | 5,831 (76.7%) | 1,775 (23.3%) |
| Total | 86,836 (75.2%) | 28,700 (24.8%) |
Housing Structures by Number of Rooms in Weld County
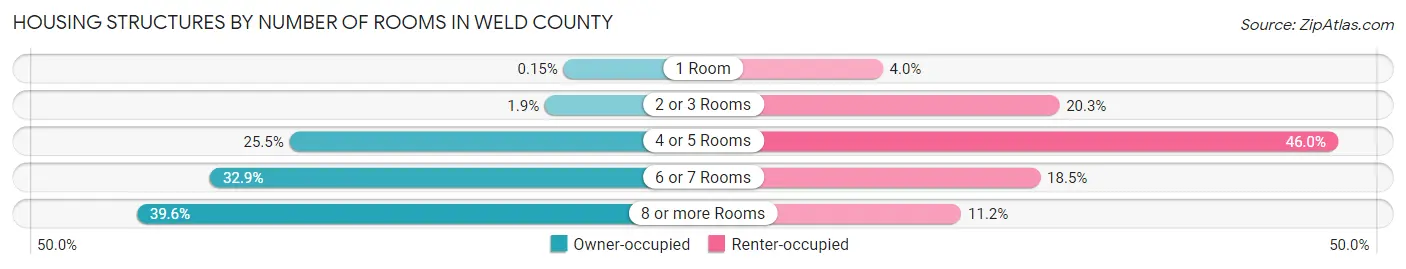
| Number of Rooms | Owner-occupied | Renter-occupied |
| 1 Room | 132 (0.2%) | 1,135 (4.0%) |
| 2 or 3 Rooms | 1,625 (1.9%) | 5,819 (20.3%) |
| 4 or 5 Rooms | 22,144 (25.5%) | 13,214 (46.0%) |
| 6 or 7 Rooms | 28,527 (32.9%) | 5,315 (18.5%) |
| 8 or more Rooms | 34,408 (39.6%) | 3,217 (11.2%) |
| Total | 86,836 (100.0%) | 28,700 (100.0%) |
Housing Structure by Heating Type in Weld County
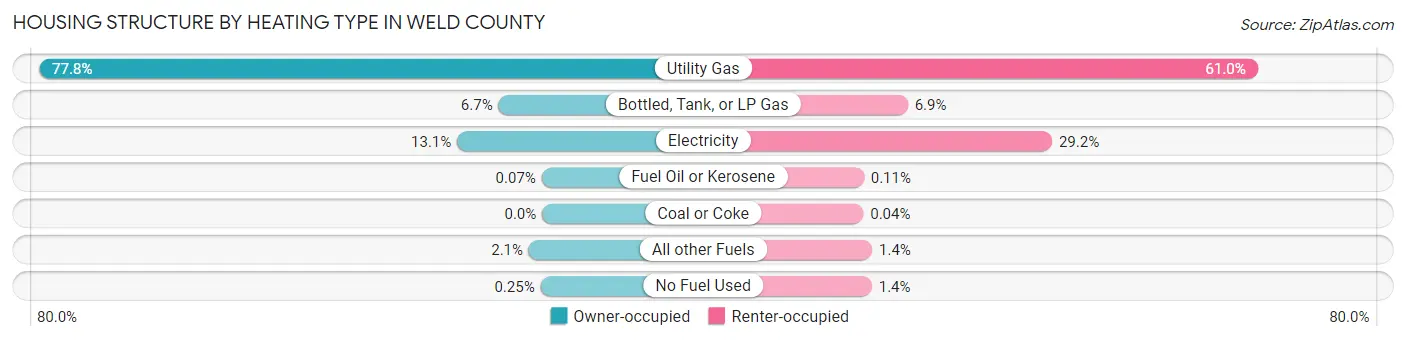
| Heating Type | Owner-occupied | Renter-occupied |
| Utility Gas | 67,519 (77.7%) | 17,505 (61.0%) |
| Bottled, Tank, or LP Gas | 5,857 (6.7%) | 1,981 (6.9%) |
| Electricity | 11,406 (13.1%) | 8,382 (29.2%) |
| Fuel Oil or Kerosene | 58 (0.1%) | 33 (0.1%) |
| Coal or Coke | 0 (0.0%) | 11 (0.0%) |
| All other Fuels | 1,783 (2.1%) | 401 (1.4%) |
| No Fuel Used | 213 (0.3%) | 387 (1.3%) |
| Total | 86,836 (100.0%) | 28,700 (100.0%) |
Household Vehicle Usage in Weld County
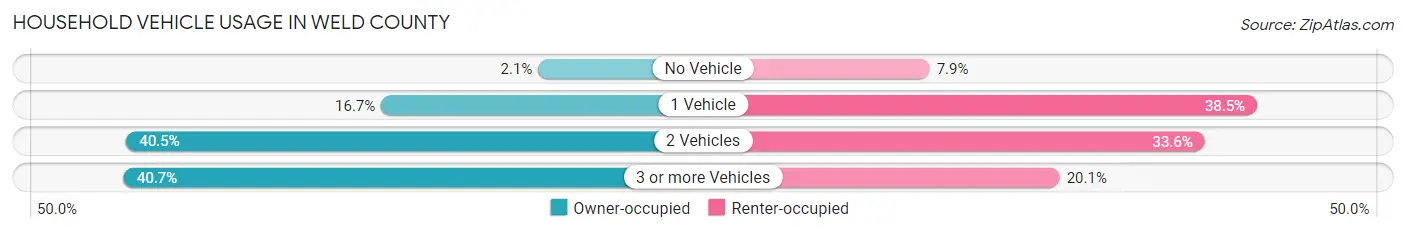
| Vehicles per Household | Owner-occupied | Renter-occupied |
| No Vehicle | 1,785 (2.1%) | 2,272 (7.9%) |
| 1 Vehicle | 14,518 (16.7%) | 11,037 (38.5%) |
| 2 Vehicles | 35,165 (40.5%) | 9,637 (33.6%) |
| 3 or more Vehicles | 35,368 (40.7%) | 5,754 (20.1%) |
| Total | 86,836 (100.0%) | 28,700 (100.0%) |
Real Estate & Mortgages in Weld County
Real Estate and Mortgage Overview in Weld County
| Characteristic | Without Mortgage | With Mortgage |
| Housing Units | 22,189 | 64,647 |
| Median Property Value | $373,300 | $422,400 |
| Median Household Income | $73,655 | $18,798 |
| Monthly Housing Costs | $550 | $8,347 |
| Real Estate Taxes | $1,705 | $1,469 |
Property Value by Mortgage Status in Weld County
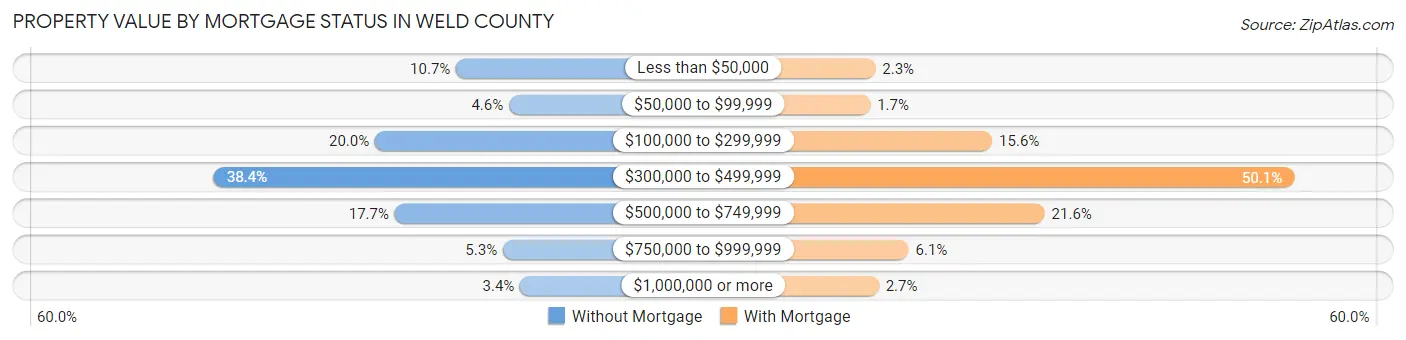
| Property Value | Without Mortgage | With Mortgage |
| Less than $50,000 | 2,369 (10.7%) | 1,462 (2.3%) |
| $50,000 to $99,999 | 1,027 (4.6%) | 1,084 (1.7%) |
| $100,000 to $299,999 | 4,427 (20.0%) | 10,093 (15.6%) |
| $300,000 to $499,999 | 8,514 (38.4%) | 32,404 (50.1%) |
| $500,000 to $749,999 | 3,925 (17.7%) | 13,972 (21.6%) |
| $750,000 to $999,999 | 1,182 (5.3%) | 3,920 (6.1%) |
| $1,000,000 or more | 745 (3.4%) | 1,712 (2.6%) |
| Total | 22,189 (100.0%) | 64,647 (100.0%) |
Household Income by Mortgage Status in Weld County
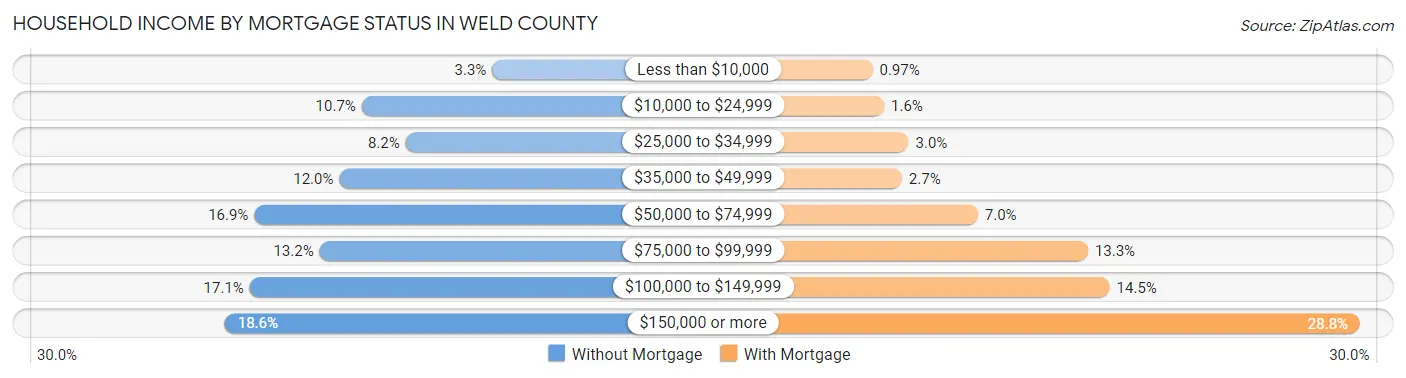
| Household Income | Without Mortgage | With Mortgage |
| Less than $10,000 | 727 (3.3%) | 626 (1.0%) |
| $10,000 to $24,999 | 2,384 (10.7%) | 1,055 (1.6%) |
| $25,000 to $34,999 | 1,826 (8.2%) | 1,957 (3.0%) |
| $35,000 to $49,999 | 2,667 (12.0%) | 1,712 (2.6%) |
| $50,000 to $74,999 | 3,746 (16.9%) | 4,520 (7.0%) |
| $75,000 to $99,999 | 2,918 (13.2%) | 8,585 (13.3%) |
| $100,000 to $149,999 | 3,803 (17.1%) | 9,386 (14.5%) |
| $150,000 or more | 4,118 (18.6%) | 18,634 (28.8%) |
| Total | 22,189 (100.0%) | 64,647 (100.0%) |
Property Value to Household Income Ratio in Weld County
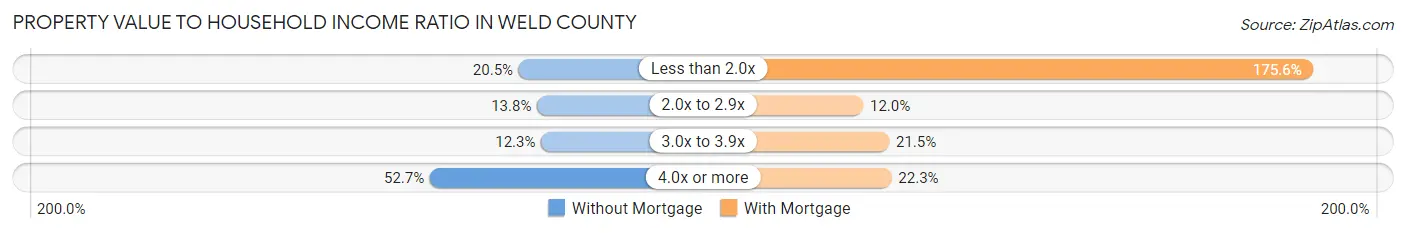
| Value-to-Income Ratio | Without Mortgage | With Mortgage |
| Less than 2.0x | 4,538 (20.4%) | 113,543 (175.6%) |
| 2.0x to 2.9x | 3,063 (13.8%) | 7,778 (12.0%) |
| 3.0x to 3.9x | 2,731 (12.3%) | 13,876 (21.5%) |
| 4.0x or more | 11,702 (52.7%) | 14,437 (22.3%) |
| Total | 22,189 (100.0%) | 64,647 (100.0%) |
Real Estate Taxes by Mortgage Status in Weld County
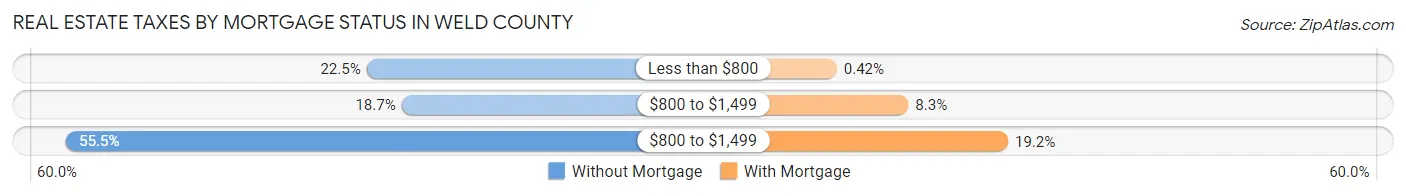
| Property Taxes | Without Mortgage | With Mortgage |
| Less than $800 | 4,999 (22.5%) | 274 (0.4%) |
| $800 to $1,499 | 4,150 (18.7%) | 5,340 (8.3%) |
| $800 to $1,499 | 12,304 (55.4%) | 12,399 (19.2%) |
| Total | 22,189 (100.0%) | 64,647 (100.0%) |
Health & Disability in Weld County
Health Insurance Coverage by Age in Weld County
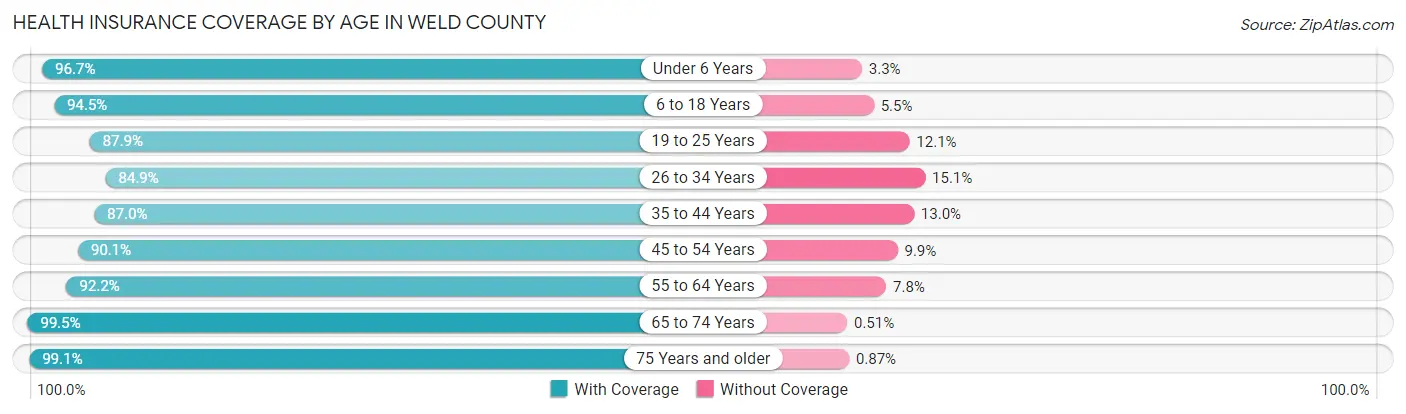
| Age Bracket | With Coverage | Without Coverage |
| Under 6 Years | 26,450 (96.7%) | 893 (3.3%) |
| 6 to 18 Years | 59,419 (94.5%) | 3,445 (5.5%) |
| 19 to 25 Years | 26,366 (87.9%) | 3,643 (12.1%) |
| 26 to 34 Years | 38,058 (84.9%) | 6,752 (15.1%) |
| 35 to 44 Years | 41,220 (87.0%) | 6,146 (13.0%) |
| 45 to 54 Years | 35,599 (90.1%) | 3,925 (9.9%) |
| 55 to 64 Years | 33,920 (92.2%) | 2,869 (7.8%) |
| 65 to 74 Years | 25,793 (99.5%) | 132 (0.5%) |
| 75 Years and older | 14,497 (99.1%) | 127 (0.9%) |
| Total | 301,322 (91.5%) | 27,932 (8.5%) |
Health Insurance Coverage by Citizenship Status in Weld County
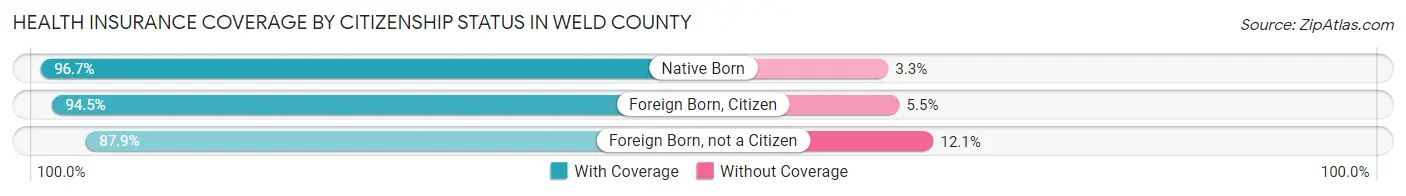
| Citizenship Status | With Coverage | Without Coverage |
| Native Born | 26,450 (96.7%) | 893 (3.3%) |
| Foreign Born, Citizen | 59,419 (94.5%) | 3,445 (5.5%) |
| Foreign Born, not a Citizen | 26,366 (87.9%) | 3,643 (12.1%) |
Health Insurance Coverage by Household Income in Weld County
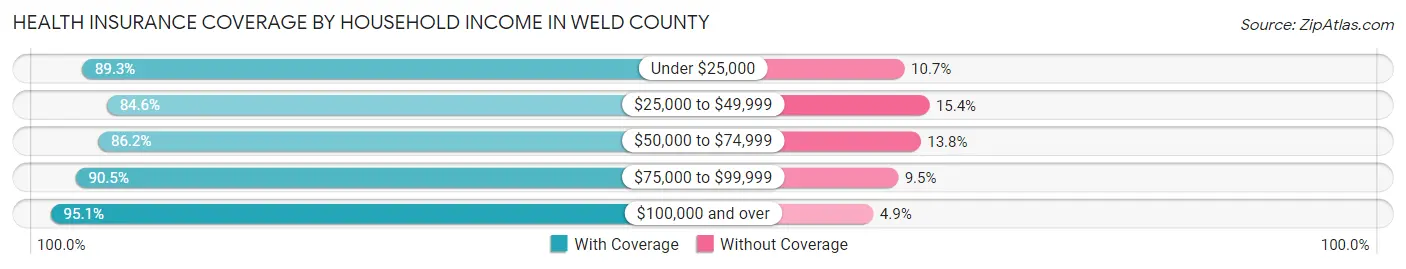
| Household Income | With Coverage | Without Coverage |
| Under $25,000 | 23,318 (89.3%) | 2,807 (10.7%) |
| $25,000 to $49,999 | 32,898 (84.6%) | 5,986 (15.4%) |
| $50,000 to $74,999 | 39,607 (86.2%) | 6,324 (13.8%) |
| $75,000 to $99,999 | 42,227 (90.5%) | 4,454 (9.5%) |
| $100,000 and over | 159,321 (95.1%) | 8,198 (4.9%) |
Public vs Private Health Insurance Coverage by Age in Weld County
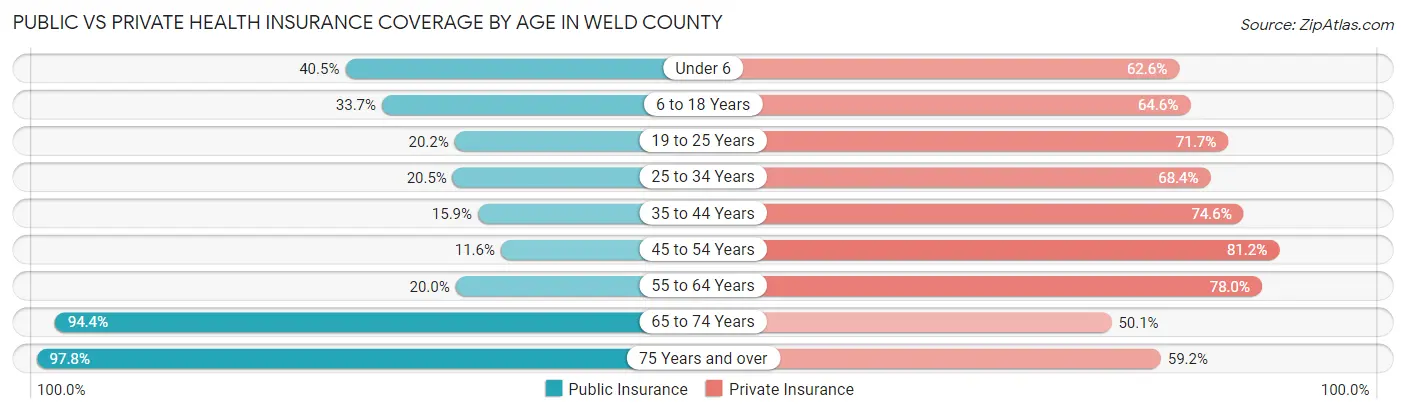
| Age Bracket | Public Insurance | Private Insurance |
| Under 6 | 11,071 (40.5%) | 17,111 (62.6%) |
| 6 to 18 Years | 21,180 (33.7%) | 40,631 (64.6%) |
| 19 to 25 Years | 6,062 (20.2%) | 21,519 (71.7%) |
| 25 to 34 Years | 9,202 (20.5%) | 30,651 (68.4%) |
| 35 to 44 Years | 7,517 (15.9%) | 35,319 (74.6%) |
| 45 to 54 Years | 4,590 (11.6%) | 32,074 (81.1%) |
| 55 to 64 Years | 7,362 (20.0%) | 28,677 (77.9%) |
| 65 to 74 Years | 24,470 (94.4%) | 12,975 (50.0%) |
| 75 Years and over | 14,298 (97.8%) | 8,659 (59.2%) |
| Total | 105,752 (32.1%) | 227,616 (69.1%) |
Disability Status by Sex by Age in Weld County
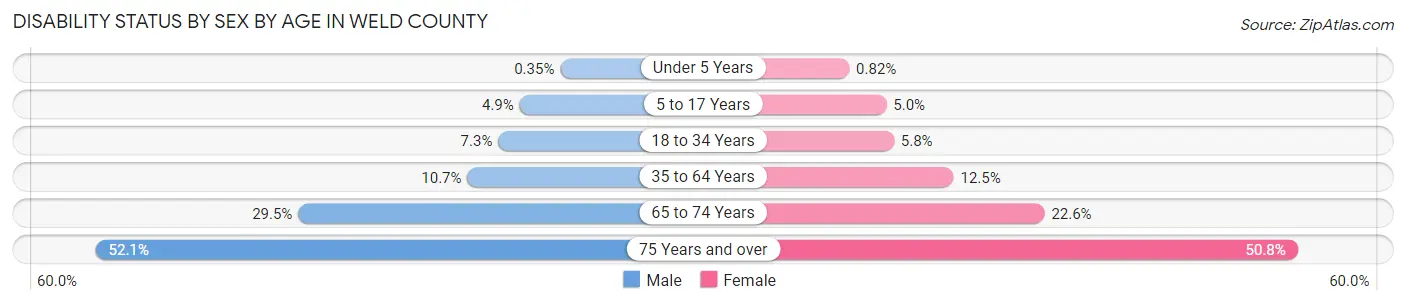
| Age Bracket | Male | Female |
| Under 5 Years | 41 (0.4%) | 91 (0.8%) |
| 5 to 17 Years | 1,562 (4.9%) | 1,502 (5.0%) |
| 18 to 34 Years | 2,941 (7.2%) | 2,288 (5.8%) |
| 35 to 64 Years | 6,844 (10.7%) | 7,427 (12.4%) |
| 65 to 74 Years | 3,699 (29.5%) | 3,024 (22.6%) |
| 75 Years and over | 3,394 (52.1%) | 4,116 (50.8%) |
Disability Class by Sex by Age in Weld County
Disability Class: Hearing Difficulty
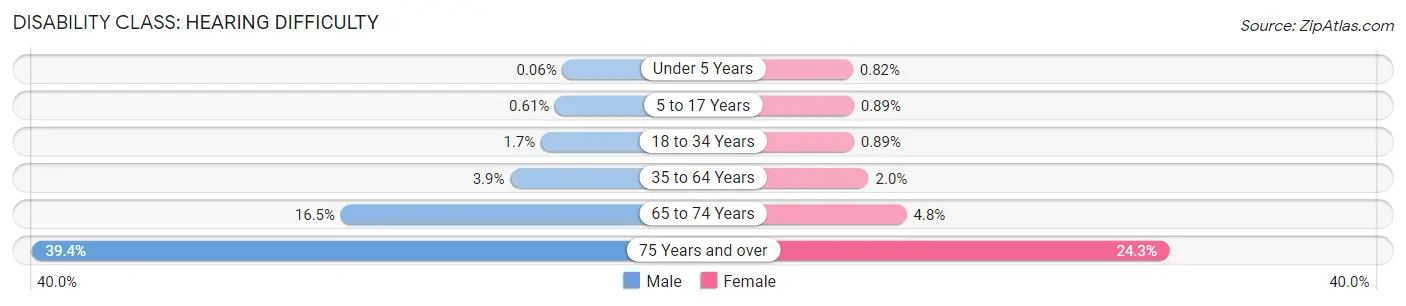
| Age Bracket | Male | Female |
| Under 5 Years | 7 (0.1%) | 91 (0.8%) |
| 5 to 17 Years | 194 (0.6%) | 271 (0.9%) |
| 18 to 34 Years | 667 (1.7%) | 349 (0.9%) |
| 35 to 64 Years | 2,523 (3.9%) | 1,190 (2.0%) |
| 65 to 74 Years | 2,069 (16.5%) | 644 (4.8%) |
| 75 Years and over | 2,567 (39.4%) | 1,968 (24.3%) |
Disability Class: Vision Difficulty
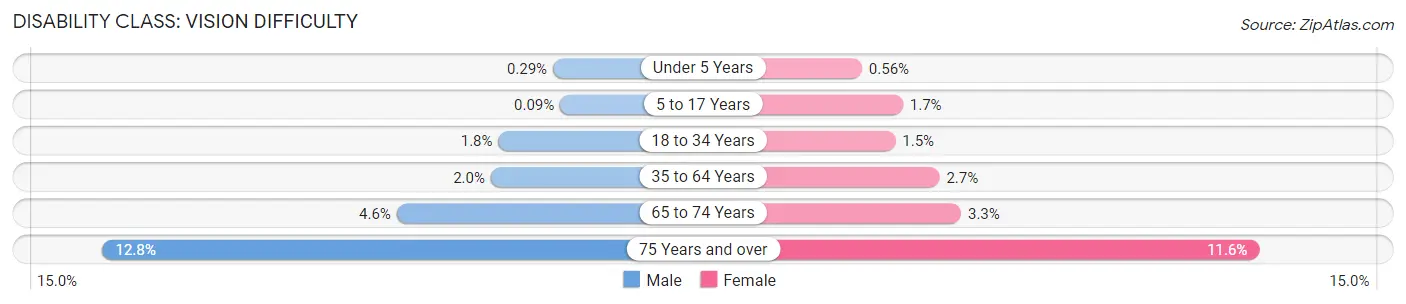
| Age Bracket | Male | Female |
| Under 5 Years | 34 (0.3%) | 63 (0.6%) |
| 5 to 17 Years | 29 (0.1%) | 514 (1.7%) |
| 18 to 34 Years | 735 (1.8%) | 588 (1.5%) |
| 35 to 64 Years | 1,291 (2.0%) | 1,624 (2.7%) |
| 65 to 74 Years | 581 (4.6%) | 445 (3.3%) |
| 75 Years and over | 836 (12.8%) | 942 (11.6%) |
Disability Class: Cognitive Difficulty
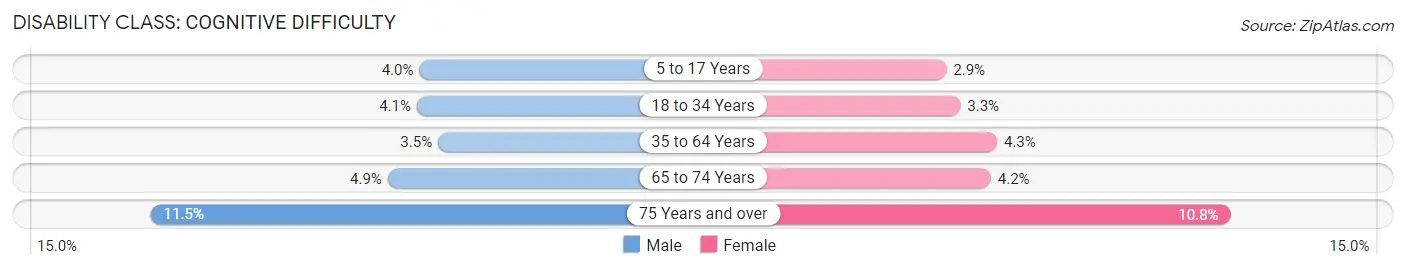
| Age Bracket | Male | Female |
| 5 to 17 Years | 1,283 (4.0%) | 880 (2.9%) |
| 18 to 34 Years | 1,656 (4.1%) | 1,299 (3.3%) |
| 35 to 64 Years | 2,232 (3.5%) | 2,580 (4.3%) |
| 65 to 74 Years | 612 (4.9%) | 556 (4.2%) |
| 75 Years and over | 749 (11.5%) | 877 (10.8%) |
Disability Class: Ambulatory Difficulty
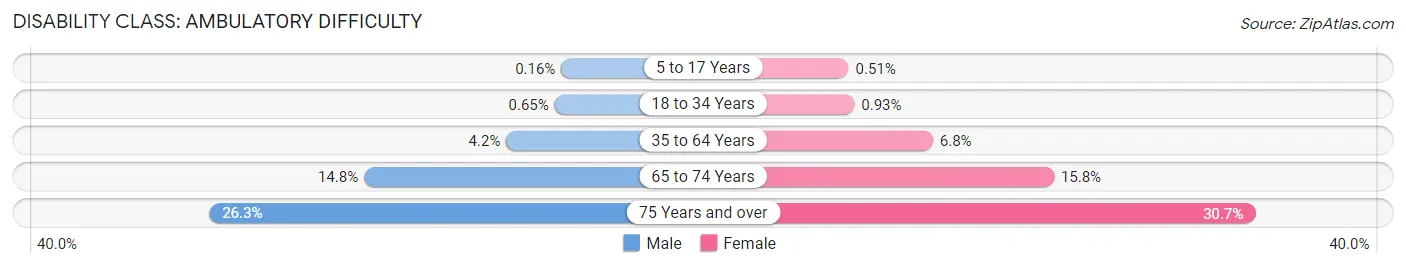
| Age Bracket | Male | Female |
| 5 to 17 Years | 52 (0.2%) | 154 (0.5%) |
| 18 to 34 Years | 264 (0.6%) | 366 (0.9%) |
| 35 to 64 Years | 2,716 (4.2%) | 4,036 (6.8%) |
| 65 to 74 Years | 1,854 (14.8%) | 2,110 (15.8%) |
| 75 Years and over | 1,713 (26.3%) | 2,488 (30.7%) |
Disability Class: Self-Care Difficulty
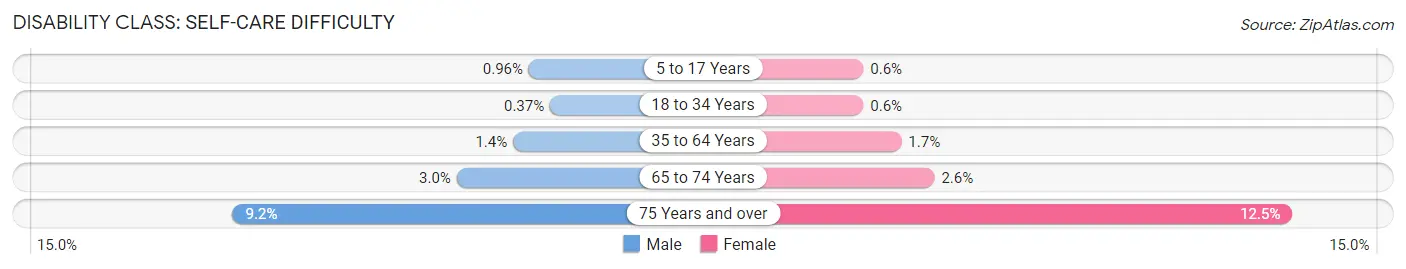
| Age Bracket | Male | Female |
| 5 to 17 Years | 306 (1.0%) | 181 (0.6%) |
| 18 to 34 Years | 150 (0.4%) | 237 (0.6%) |
| 35 to 64 Years | 896 (1.4%) | 993 (1.7%) |
| 65 to 74 Years | 372 (3.0%) | 346 (2.6%) |
| 75 Years and over | 600 (9.2%) | 1,017 (12.5%) |
Technology Access in Weld County
Computing Device Access in Weld County
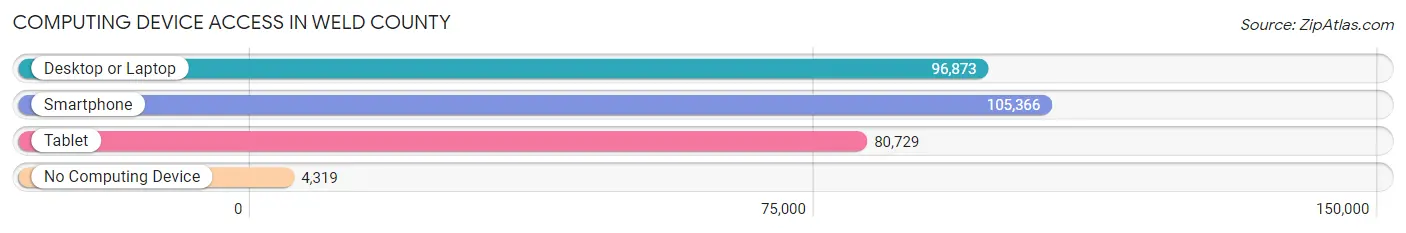
| Device Type | # Households | % Households |
| Desktop or Laptop | 96,873 | 83.9% |
| Smartphone | 105,366 | 91.2% |
| Tablet | 80,729 | 69.9% |
| No Computing Device | 4,319 | 3.7% |
| Total | 115,536 | 100.0% |
Internet Access in Weld County
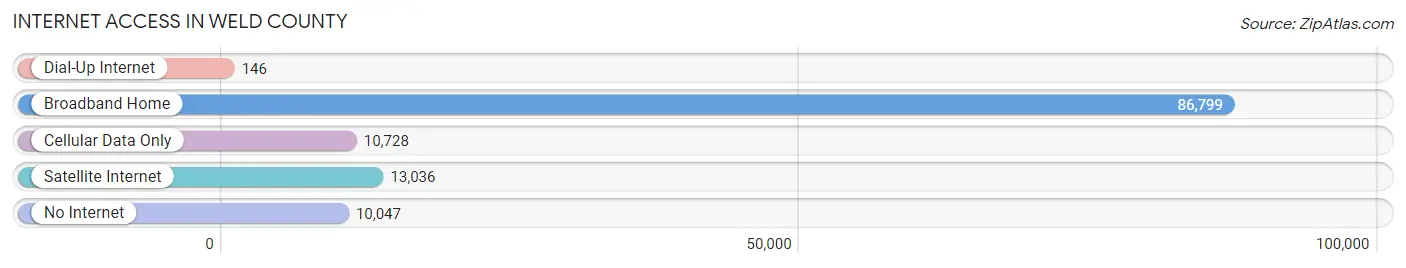
| Internet Type | # Households | % Households |
| Dial-Up Internet | 146 | 0.1% |
| Broadband Home | 86,799 | 75.1% |
| Cellular Data Only | 10,728 | 9.3% |
| Satellite Internet | 13,036 | 11.3% |
| No Internet | 10,047 | 8.7% |
| Total | 115,536 | 100.0% |
Weld County Summary
Weld County is located in the northeastern corner of Colorado and is the fourth most populous county in the state. It is bordered by Wyoming to the north, Nebraska to the northeast, and the South Platte River to the east. The county seat is Greeley, and the county is named after Lewis Ledyard Weld, a former governor of the Colorado Territory.
Geography
Weld County covers an area of 4,017 square miles, making it the fourth largest county in Colorado. It is located in the High Plains region of the state, with the Rocky Mountains to the west and the Great Plains to the east. The county is divided into two distinct regions: the eastern plains and the western foothills. The eastern plains are characterized by flat terrain and are home to the majority of the county’s population. The western foothills are more rugged and are home to the Pawnee National Grassland.
The county is home to several rivers, including the South Platte, Cache la Poudre, and Big Thompson. The South Platte River is the main water source for the county, and it is also a popular destination for fishing and recreation.
Economy
Weld County has a diverse economy, with agriculture, energy, and manufacturing being the main industries. Agriculture is the largest industry in the county, with wheat, corn, and sugar beets being the main crops. The county is also home to several energy companies, including Anadarko Petroleum Corporation and Noble Energy. Manufacturing is also an important part of the economy, with companies such as Vestas Wind Systems and JBS USA having a presence in the county.
Demographics
As of the 2010 census, Weld County had a population of 252,825. The population is predominantly white (87.3%), with Hispanics making up the largest minority group (11.2%). The median household income is $60,945, and the median home value is $219,400.
The county is home to several cities and towns, including Greeley, Fort Lupton, and Windsor. Greeley is the largest city in the county, with a population of 92,889. It is home to the University of Northern Colorado and is a major center for agriculture and energy production.
Conclusion
Weld County is a diverse and vibrant county in northeastern Colorado. It is home to a variety of industries, including agriculture, energy, and manufacturing. The county is also home to several cities and towns, with Greeley being the largest. The population is predominantly white, with Hispanics making up the largest minority group. The median household income is $60,945, and the median home value is $219,400.
Common Questions
What is the Total Population of Weld County?
Total Population of Weld County is 331,466.
What is the Total Male Population of Weld County?
Total Male Population of Weld County is 168,644.
What is the Total Female Population of Weld County?
Total Female Population of Weld County is 162,822.
What is the Ratio of Males per 100 Females in Weld County?
There are 103.58 Males per 100 Females in Weld County.
What is the Ratio of Females per 100 Males in Weld County?
There are 96.55 Females per 100 Males in Weld County.
What is the Median Population Age in Weld County?
Median Population Age in Weld County is 35.0 Years.
What is the Average Family Size in Weld County
Average Family Size in Weld County is 3.3 People.
What is the Average Household Size in Weld County
Average Household Size in Weld County is 2.8 People.
What is Per Capita Income in Weld County?
Per Capita income in Weld County is $39,480.
What is the Median Family Income in Weld County?
Median Family Income in Weld County is $102,620.
What is the Median Household income in Weld County?
Median Household Income in Weld County is $89,182.
What is Income or Wage Gap in Weld County?
Income or Wage Gap in Weld County is 35.3%.
Women in Weld County earn 64.7 cents for every dollar earned by a man.
What is Family Income Deficit in Weld County?
Family Income Deficit in Weld County is $11,505.
Families that are below poverty line in Weld County earn $11,505 less on average than the poverty threshold level.
What is Inequality or Gini Index in Weld County?
Inequality or Gini Index in Weld County is 0.42.
How Large is the Labor Force in Weld County?
There are 177,690 People in the Labor Forcein in Weld County.
What is the Percentage of People in the Labor Force in Weld County?
69.6% of People are in the Labor Force in Weld County.
What is the Unemployment Rate in Weld County?
Unemployment Rate in Weld County is 4.9%.