Summit County, CO
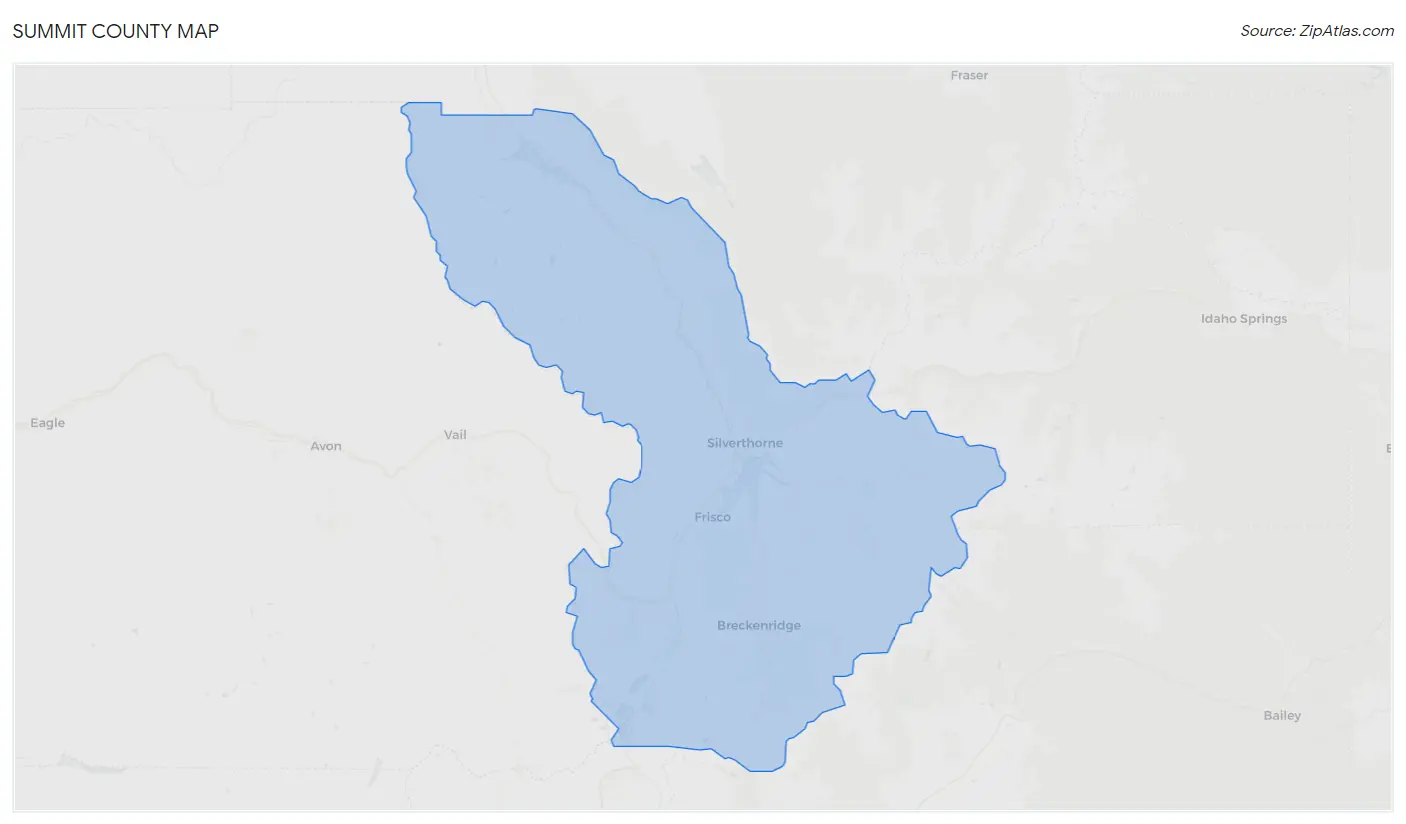
Summit County Map
Summit County Overview
30,955
TOTAL POPULATION
17,012
MALE POPULATION
13,943
FEMALE POPULATION
122.01
MALES / 100 FEMALES
81.96
FEMALES / 100 MALES
39.0
MEDIAN AGE
2.9
AVG FAMILY SIZE
2.6
AVG HOUSEHOLD SIZE
$54,935
PER CAPITA INCOME
$120,716
AVG FAMILY INCOME
$100,611
AVG HOUSEHOLD INCOME
13.4%
WAGE / INCOME GAP [ % ]
86.6¢/ $1
WAGE / INCOME GAP [ $ ]
0.43
INEQUALITY / GINI INDEX
20,164
LABOR FORCE [ PEOPLE ]
75.9%
PERCENT IN LABOR FORCE
3.7%
UNEMPLOYMENT RATE
Summit County Area Codes
Race in Summit County
The most populous races in Summit County are White / Caucasian (25,726 | 83.1%), Hispanic or Latino (4,566 | 14.7%), and Two or more Races (3,622 | 11.7%).
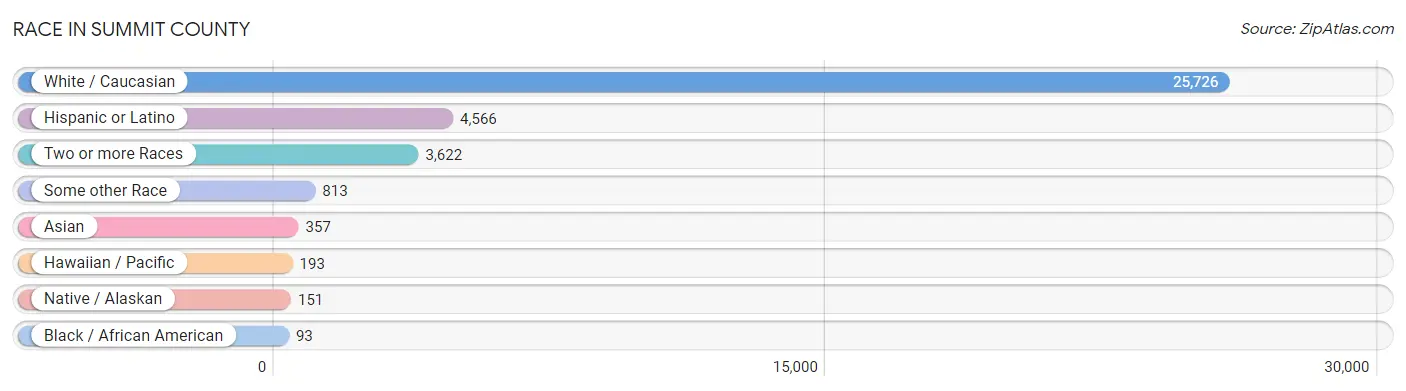
| Race | # Population | % Population |
| Asian | 357 | 1.1% |
| Black / African American | 93 | 0.3% |
| Hawaiian / Pacific | 193 | 0.6% |
| Hispanic or Latino | 4,566 | 14.7% |
| Native / Alaskan | 151 | 0.5% |
| White / Caucasian | 25,726 | 83.1% |
| Two or more Races | 3,622 | 11.7% |
| Some other Race | 813 | 2.6% |
| Total | 30,955 | 100.0% |
Ancestry in Summit County
The most populous ancestries reported in Summit County are German (4,308 | 13.9%), English (3,015 | 9.7%), Mexican (2,864 | 9.2%), Irish (2,279 | 7.4%), and Swedish (1,068 | 3.5%), together accounting for 43.7% of all Summit County residents.
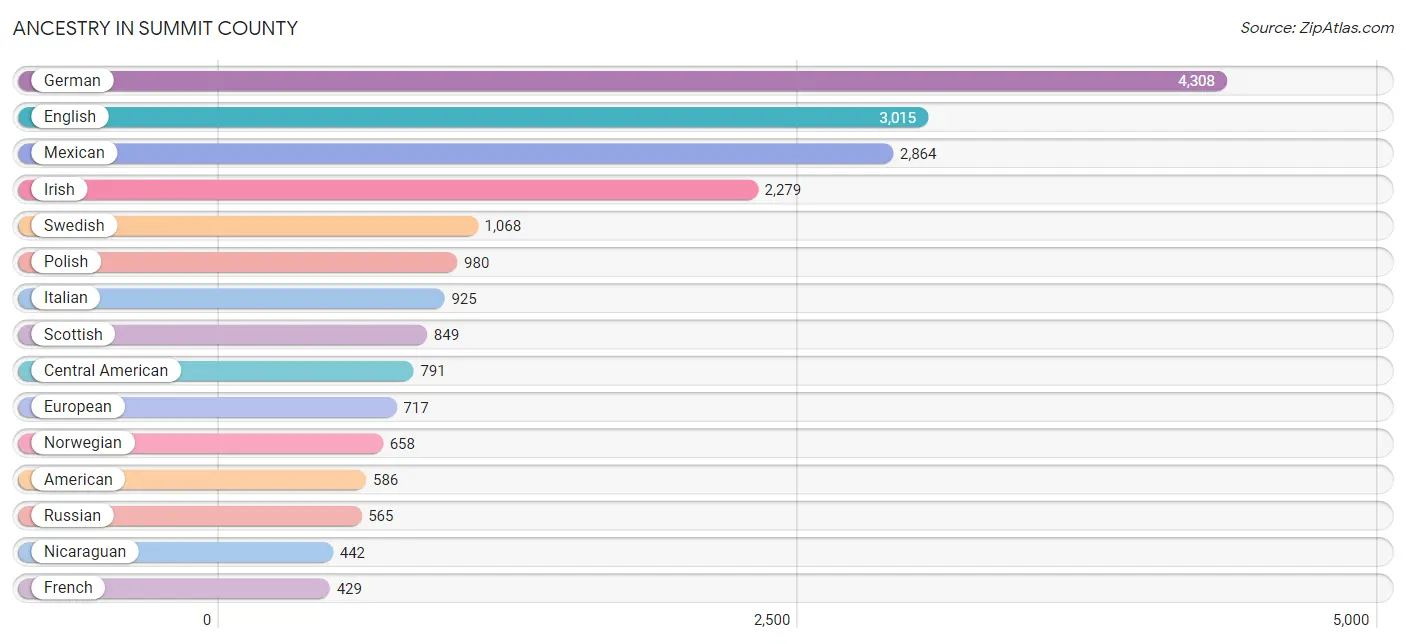
| Ancestry | # Population | % Population |
| African | 24 | 0.1% |
| American | 586 | 1.9% |
| Arab | 62 | 0.2% |
| Argentinean | 15 | 0.1% |
| Armenian | 287 | 0.9% |
| Austrian | 172 | 0.6% |
| Barbadian | 2 | 0.0% |
| Belgian | 60 | 0.2% |
| Bhutanese | 164 | 0.5% |
| British | 152 | 0.5% |
| Celtic | 1 | 0.0% |
| Central American | 791 | 2.6% |
| Central American Indian | 23 | 0.1% |
| Cherokee | 39 | 0.1% |
| Chilean | 31 | 0.1% |
| Colombian | 283 | 0.9% |
| Costa Rican | 18 | 0.1% |
| Czech | 238 | 0.8% |
| Czechoslovakian | 50 | 0.2% |
| Danish | 109 | 0.4% |
| Dutch | 145 | 0.5% |
| Eastern European | 71 | 0.2% |
| English | 3,015 | 9.7% |
| European | 717 | 2.3% |
| Finnish | 124 | 0.4% |
| French | 429 | 1.4% |
| French Canadian | 49 | 0.2% |
| German | 4,308 | 13.9% |
| Greek | 13 | 0.0% |
| Guamanian / Chamorro | 138 | 0.4% |
| Guatemalan | 114 | 0.4% |
| Honduran | 135 | 0.4% |
| Hungarian | 337 | 1.1% |
| Icelander | 72 | 0.2% |
| Indian (Asian) | 108 | 0.4% |
| Iranian | 7 | 0.0% |
| Irish | 2,279 | 7.4% |
| Israeli | 303 | 1.0% |
| Italian | 925 | 3.0% |
| Latvian | 7 | 0.0% |
| Lebanese | 37 | 0.1% |
| Lithuanian | 111 | 0.4% |
| Macedonian | 26 | 0.1% |
| Mexican | 2,864 | 9.2% |
| Navajo | 30 | 0.1% |
| Nicaraguan | 442 | 1.4% |
| Northern European | 64 | 0.2% |
| Norwegian | 658 | 2.1% |
| Pakistani | 104 | 0.3% |
| Paraguayan | 6 | 0.0% |
| Peruvian | 19 | 0.1% |
| Polish | 980 | 3.2% |
| Portuguese | 128 | 0.4% |
| Pueblo | 15 | 0.1% |
| Puerto Rican | 143 | 0.5% |
| Romanian | 204 | 0.7% |
| Russian | 565 | 1.8% |
| Salvadoran | 82 | 0.3% |
| Scandinavian | 323 | 1.0% |
| Scotch-Irish | 279 | 0.9% |
| Scottish | 849 | 2.7% |
| Sioux | 4 | 0.0% |
| Slavic | 27 | 0.1% |
| Slovak | 14 | 0.1% |
| Slovene | 7 | 0.0% |
| Somali | 8 | 0.0% |
| South American | 354 | 1.1% |
| Spaniard | 81 | 0.3% |
| Spanish | 220 | 0.7% |
| Sri Lankan | 11 | 0.0% |
| Subsaharan African | 32 | 0.1% |
| Swedish | 1,068 | 3.5% |
| Swiss | 103 | 0.3% |
| Syrian | 25 | 0.1% |
| Thai | 75 | 0.2% |
| Turkish | 249 | 0.8% |
| Ukrainian | 60 | 0.2% |
| Welsh | 155 | 0.5% | View All 78 Rows |
Immigrants in Summit County
The most numerous immigrant groups reported in Summit County came from Latin America (1,692 | 5.5%), Central America (1,450 | 4.7%), Mexico (1,059 | 3.4%), Europe (560 | 1.8%), and Northern Europe (278 | 0.9%), together accounting for 16.3% of all Summit County residents.
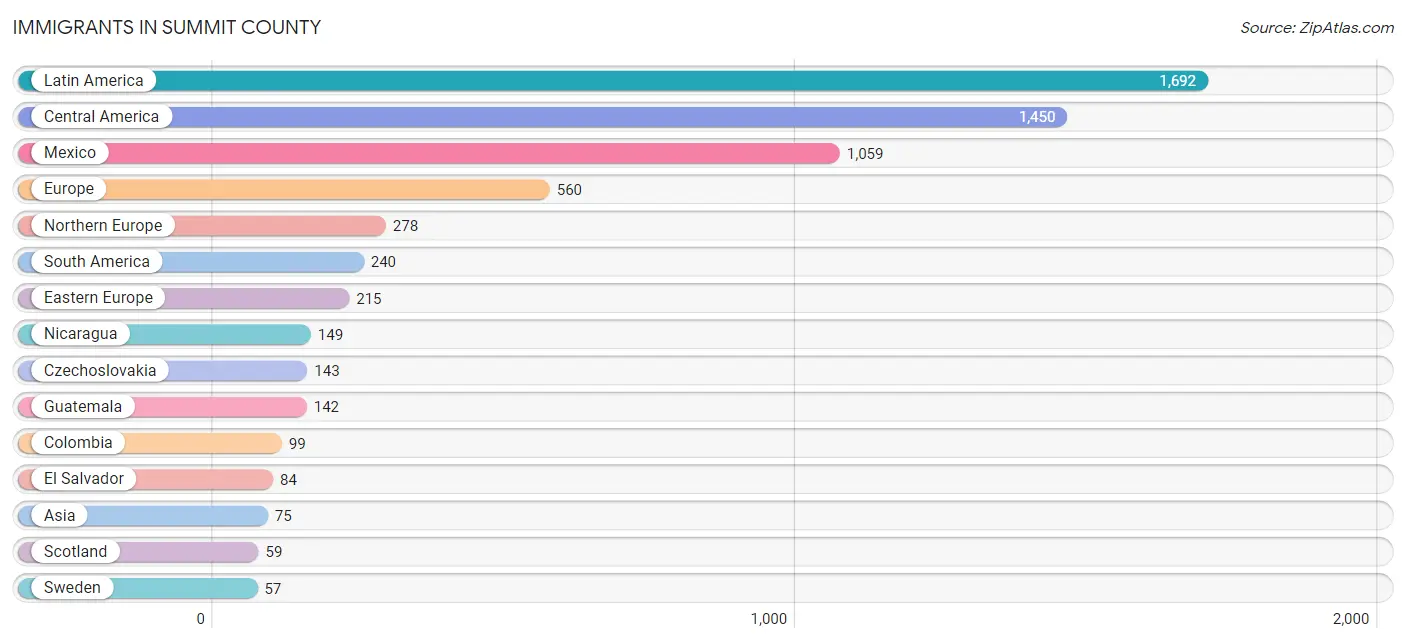
| Immigration Origin | # Population | % Population |
| Africa | 13 | 0.0% |
| Argentina | 23 | 0.1% |
| Asia | 75 | 0.2% |
| Austria | 26 | 0.1% |
| Barbados | 2 | 0.0% |
| Canada | 19 | 0.1% |
| Caribbean | 2 | 0.0% |
| Central America | 1,450 | 4.7% |
| Chile | 31 | 0.1% |
| Colombia | 99 | 0.3% |
| Costa Rica | 16 | 0.1% |
| Czechoslovakia | 143 | 0.5% |
| Eastern Europe | 215 | 0.7% |
| El Salvador | 84 | 0.3% |
| England | 55 | 0.2% |
| Europe | 560 | 1.8% |
| Germany | 10 | 0.0% |
| Guatemala | 142 | 0.5% |
| India | 30 | 0.1% |
| Iran | 7 | 0.0% |
| Latin America | 1,692 | 5.5% |
| Mexico | 1,059 | 3.4% |
| Nicaragua | 149 | 0.5% |
| North Macedonia | 26 | 0.1% |
| Northern Europe | 278 | 0.9% |
| Oceania | 29 | 0.1% |
| Peru | 41 | 0.1% |
| Scotland | 59 | 0.2% |
| South Africa | 13 | 0.0% |
| South America | 240 | 0.8% |
| South Central Asia | 37 | 0.1% |
| South Eastern Asia | 11 | 0.0% |
| Southern Europe | 17 | 0.1% |
| Spain | 17 | 0.1% |
| Sweden | 57 | 0.2% |
| Switzerland | 14 | 0.1% |
| Turkey | 27 | 0.1% |
| Ukraine | 46 | 0.2% |
| Vietnam | 11 | 0.0% |
| Western Asia | 27 | 0.1% |
| Western Europe | 50 | 0.2% | View All 41 Rows |
Sex and Age in Summit County
Sex and Age in Summit County
The most populous age groups in Summit County are 25 to 29 Years (1,887 | 11.1%) for men and 35 to 39 Years (1,419 | 10.2%) for women.
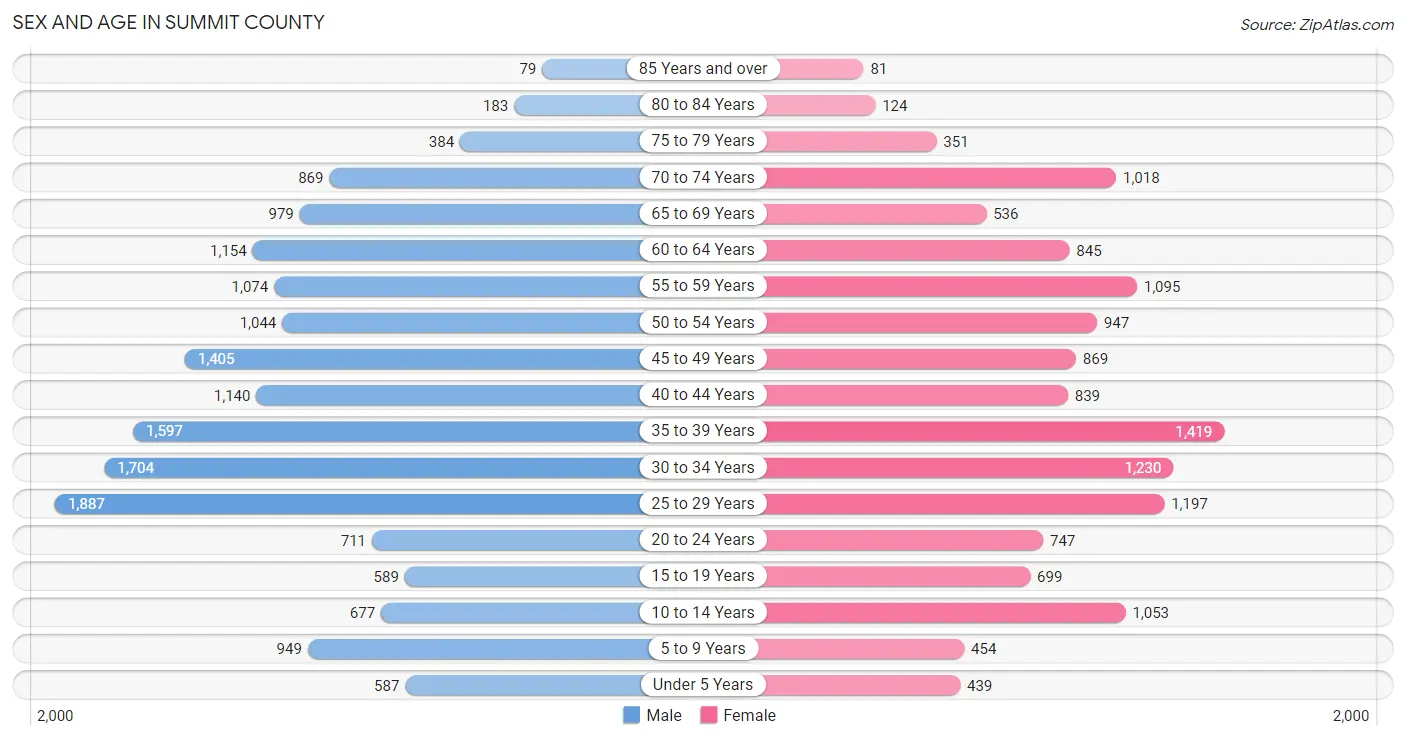
| Age Bracket | Male | Female |
| Under 5 Years | 587 (3.5%) | 439 (3.2%) |
| 5 to 9 Years | 949 (5.6%) | 454 (3.3%) |
| 10 to 14 Years | 677 (4.0%) | 1,053 (7.5%) |
| 15 to 19 Years | 589 (3.5%) | 699 (5.0%) |
| 20 to 24 Years | 711 (4.2%) | 747 (5.4%) |
| 25 to 29 Years | 1,887 (11.1%) | 1,197 (8.6%) |
| 30 to 34 Years | 1,704 (10.0%) | 1,230 (8.8%) |
| 35 to 39 Years | 1,597 (9.4%) | 1,419 (10.2%) |
| 40 to 44 Years | 1,140 (6.7%) | 839 (6.0%) |
| 45 to 49 Years | 1,405 (8.3%) | 869 (6.2%) |
| 50 to 54 Years | 1,044 (6.1%) | 947 (6.8%) |
| 55 to 59 Years | 1,074 (6.3%) | 1,095 (7.9%) |
| 60 to 64 Years | 1,154 (6.8%) | 845 (6.1%) |
| 65 to 69 Years | 979 (5.8%) | 536 (3.8%) |
| 70 to 74 Years | 869 (5.1%) | 1,018 (7.3%) |
| 75 to 79 Years | 384 (2.3%) | 351 (2.5%) |
| 80 to 84 Years | 183 (1.1%) | 124 (0.9%) |
| 85 Years and over | 79 (0.5%) | 81 (0.6%) |
| Total | 17,012 (100.0%) | 13,943 (100.0%) |
Families and Households in Summit County
Median Family Size in Summit County
The median family size in Summit County is 2.92 persons per family, with single male/father families (253 | 3.8%) accounting for the largest median family size of 4.08 persons per family. On the other hand, married-couple families (5,885 | 87.4%) represent the smallest median family size with 2.84 persons per family.
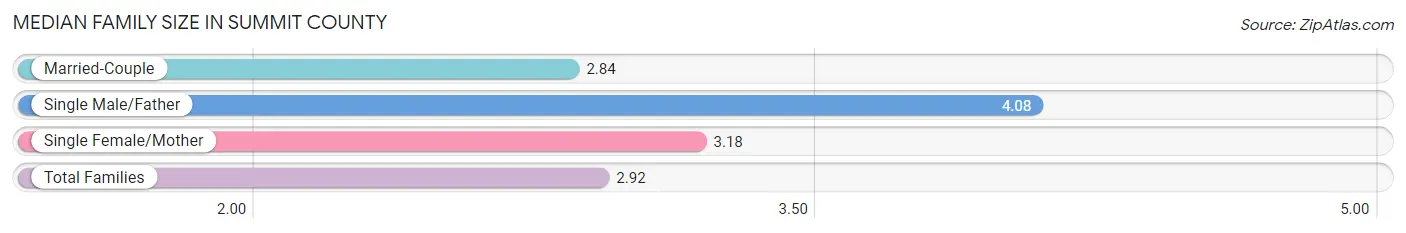
| Family Type | # Families | Family Size |
| Married-Couple | 5,885 (87.4%) | 2.84 |
| Single Male/Father | 253 (3.8%) | 4.08 |
| Single Female/Mother | 599 (8.9%) | 3.18 |
| Total Families | 6,737 (100.0%) | 2.92 |
Median Household Size in Summit County
The median household size in Summit County is 2.59 persons per household, with single male/father households (253 | 2.1%) accounting for the largest median household size of 4.85 persons per household. non-family households (5,013 | 42.7%) represent the smallest median household size with 1.96 persons per household.
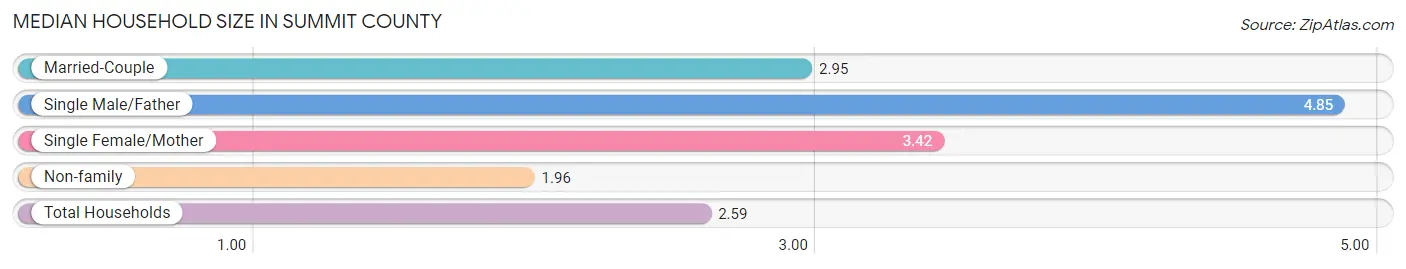
| Household Type | # Households | Household Size |
| Married-Couple | 5,885 (50.1%) | 2.95 |
| Single Male/Father | 253 (2.1%) | 4.85 |
| Single Female/Mother | 599 (5.1%) | 3.42 |
| Non-family | 5,013 (42.7%) | 1.96 |
| Total Households | 11,750 (100.0%) | 2.59 |
Household Size by Marriage Status in Summit County
Out of a total of 11,750 households in Summit County, 6,737 (57.3%) are family households, while 5,013 (42.7%) are nonfamily households. The most numerous type of family households are 2-person households, comprising 4,077, and the most common type of nonfamily households are 1-person households, comprising 3,346.
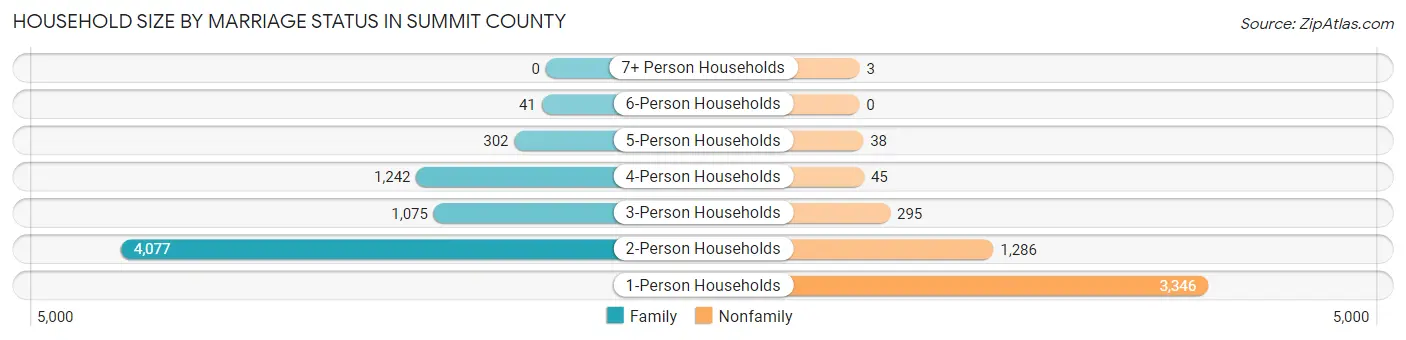
| Household Size | Family Households | Nonfamily Households |
| 1-Person Households | - | 3,346 (28.5%) |
| 2-Person Households | 4,077 (34.7%) | 1,286 (10.9%) |
| 3-Person Households | 1,075 (9.1%) | 295 (2.5%) |
| 4-Person Households | 1,242 (10.6%) | 45 (0.4%) |
| 5-Person Households | 302 (2.6%) | 38 (0.3%) |
| 6-Person Households | 41 (0.4%) | 0 (0.0%) |
| 7+ Person Households | 0 (0.0%) | 3 (0.0%) |
| Total | 6,737 (57.3%) | 5,013 (42.7%) |
Female Fertility in Summit County
Fertility by Age in Summit County
Average fertility rate in Summit County is 30.0 births per 1,000 women. Women in the age bracket of 20 to 34 years have the highest fertility rate with 56.0 births per 1,000 women. Women in the age bracket of 20 to 34 years acount for 81.9% of all women with births.
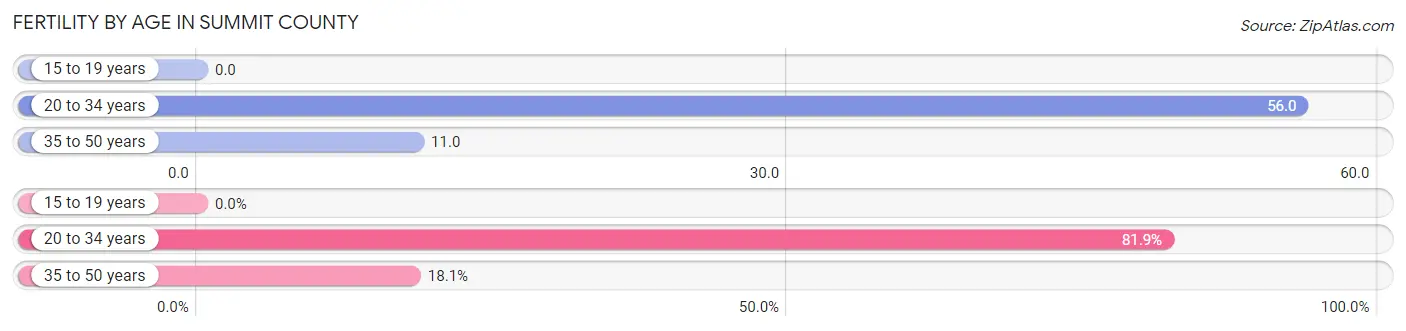
| Age Bracket | Women with Births | Births / 1,000 Women |
| 15 to 19 years | 0 (0.0%) | 0.0 |
| 20 to 34 years | 177 (81.9%) | 56.0 |
| 35 to 50 years | 39 (18.1%) | 11.0 |
| Total | 216 (100.0%) | 30.0 |
Fertility by Age by Marriage Status in Summit County
97.2% of women with births (216) in Summit County are married. The highest percentage of unmarried women with births falls into 20 to 34 years age bracket with 3.4% of them unmarried at the time of birth, while the lowest percentage of unmarried women with births belong to 35 to 50 years age bracket with 0.0% of them unmarried.
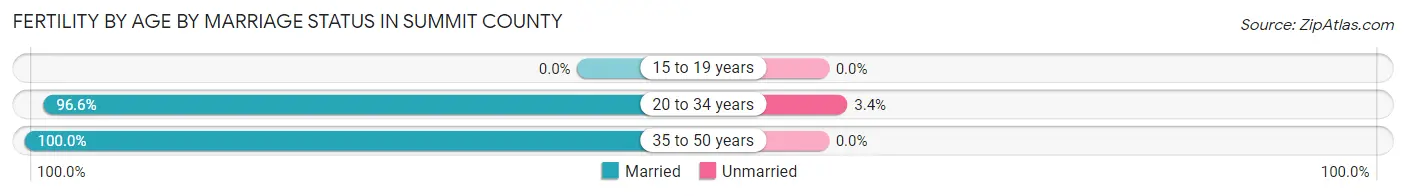
| Age Bracket | Married | Unmarried |
| 15 to 19 years | 0 (0.0%) | 0 (0.0%) |
| 20 to 34 years | 171 (96.6%) | 6 (3.4%) |
| 35 to 50 years | 39 (100.0%) | 0 (0.0%) |
| Total | 210 (97.2%) | 6 (2.8%) |
Fertility by Education in Summit County
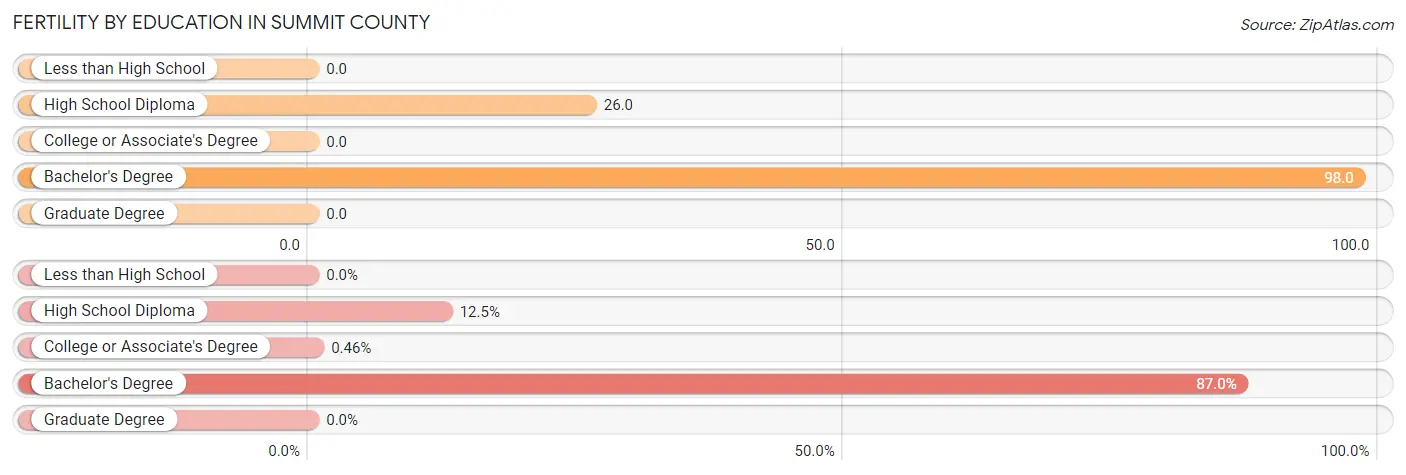
| Educational Attainment | Women with Births | Births / 1,000 Women |
| Less than High School | 0 (0.0%) | 0.0 |
| High School Diploma | 27 (12.5%) | 26.0 |
| College or Associate's Degree | 1 (0.5%) | 0.0 |
| Bachelor's Degree | 188 (87.0%) | 98.0 |
| Graduate Degree | 0 (0.0%) | 0.0 |
| Total | 216 (100.0%) | 30.0 |
Fertility by Education by Marriage Status in Summit County
2.8% of women with births in Summit County are unmarried. Women with the educational attainment of high school diploma are most likely to be married with 100.0% of them married at childbirth, while women with the educational attainment of bachelor's degree are least likely to be married with 3.2% of them unmarried at childbirth.
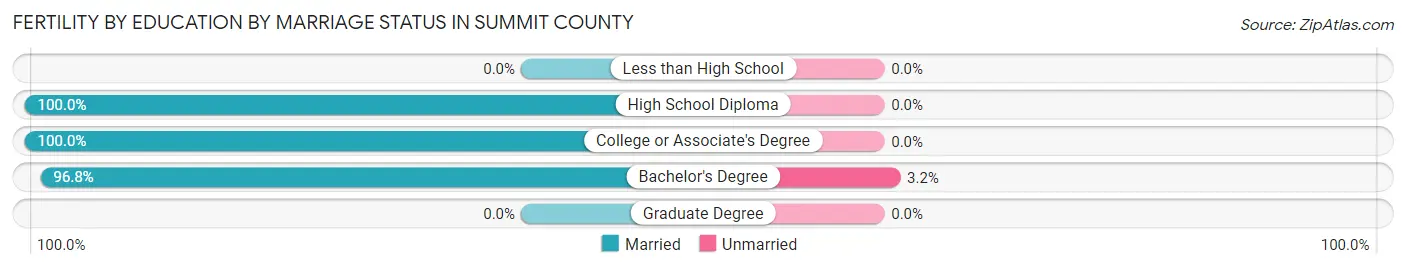
| Educational Attainment | Married | Unmarried |
| Less than High School | 0 (0.0%) | 0 (0.0%) |
| High School Diploma | 27 (100.0%) | 0 (0.0%) |
| College or Associate's Degree | 1 (100.0%) | 0 (0.0%) |
| Bachelor's Degree | 182 (96.8%) | 6 (3.2%) |
| Graduate Degree | 0 (0.0%) | 0 (0.0%) |
| Total | 210 (97.2%) | 6 (2.8%) |
Income in Summit County
Income Overview in Summit County
Per Capita Income in Summit County is $54,935, while median incomes of families and households are $120,716 and $100,611 respectively.
| Characteristic | Number | Measure |
| Per Capita Income | 30,955 | $54,935 |
| Median Family Income | 6,737 | $120,716 |
| Mean Family Income | 6,737 | $154,307 |
| Median Household Income | 11,750 | $100,611 |
| Mean Household Income | 11,750 | $133,518 |
| Income Deficit | 6,737 | $0 |
| Wage / Income Gap (%) | 30,955 | 13.43% |
| Wage / Income Gap ($) | 30,955 | 86.57¢ per $1 |
| Gini / Inequality Index | 30,955 | 0.43 |
Earnings by Sex in Summit County
Average Earnings in Summit County are $47,086, $49,855 for men and $43,161 for women, a difference of 13.4%.
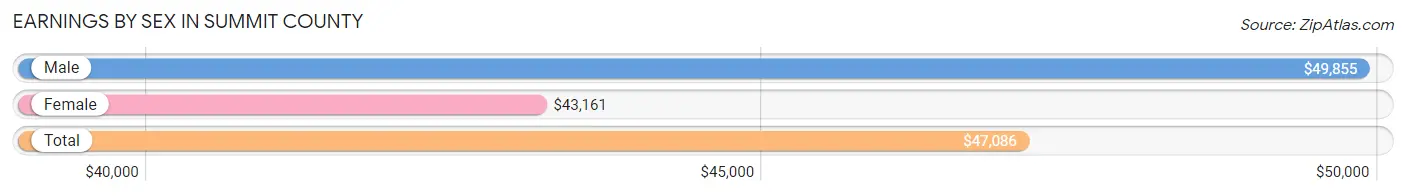
| Sex | Number | Average Earnings |
| Male | 12,202 (58.4%) | $49,855 |
| Female | 8,683 (41.6%) | $43,161 |
| Total | 20,885 (100.0%) | $47,086 |
Earnings by Sex by Income Bracket in Summit County
The most common earnings brackets in Summit County are $100,000+ for men (2,298 | 18.8%) and $55,000 to $64,999 for women (913 | 10.5%).
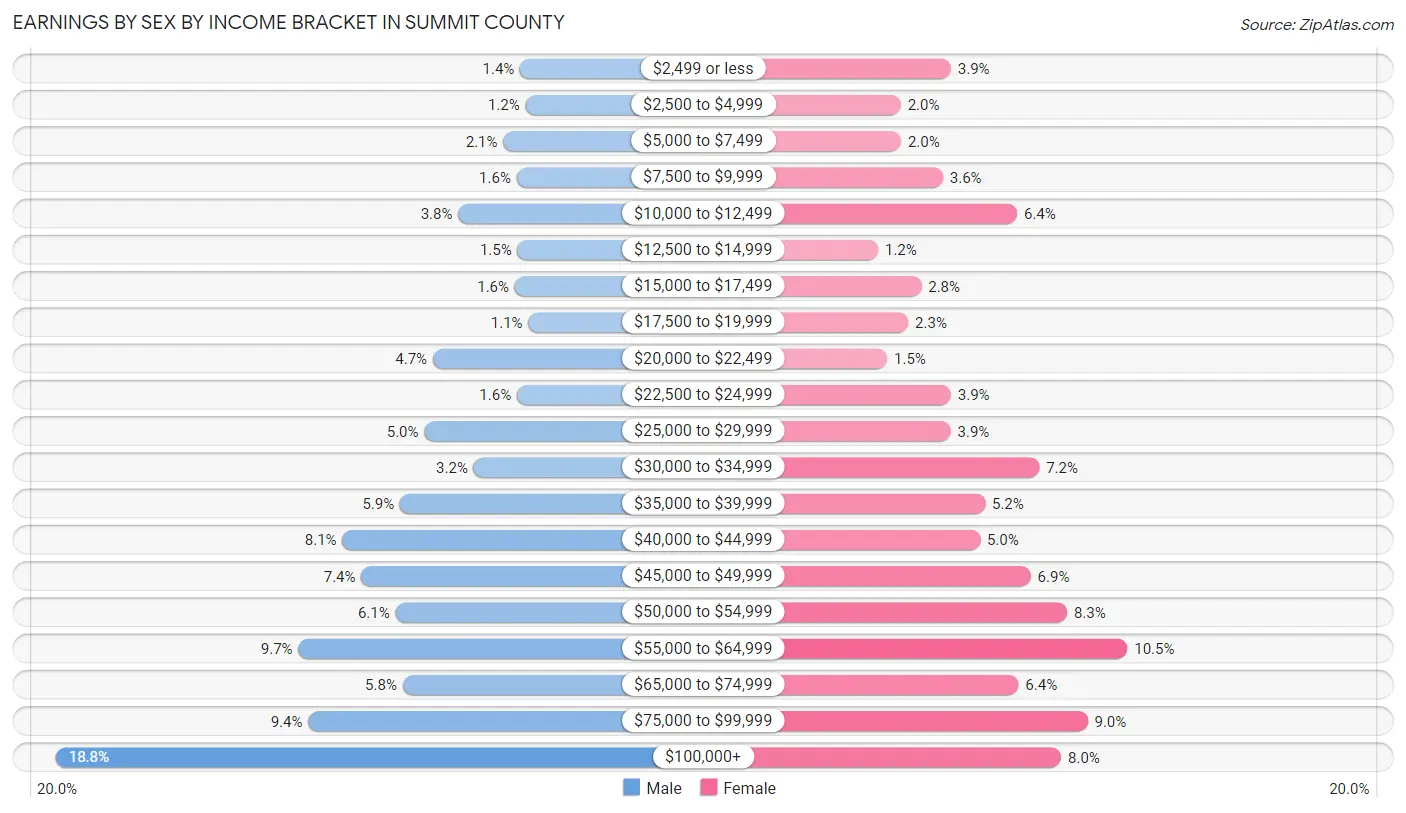
| Income | Male | Female |
| $2,499 or less | 174 (1.4%) | 339 (3.9%) |
| $2,500 to $4,999 | 150 (1.2%) | 175 (2.0%) |
| $5,000 to $7,499 | 251 (2.1%) | 176 (2.0%) |
| $7,500 to $9,999 | 190 (1.6%) | 313 (3.6%) |
| $10,000 to $12,499 | 457 (3.7%) | 554 (6.4%) |
| $12,500 to $14,999 | 187 (1.5%) | 102 (1.2%) |
| $15,000 to $17,499 | 199 (1.6%) | 242 (2.8%) |
| $17,500 to $19,999 | 137 (1.1%) | 200 (2.3%) |
| $20,000 to $22,499 | 573 (4.7%) | 131 (1.5%) |
| $22,500 to $24,999 | 189 (1.5%) | 339 (3.9%) |
| $25,000 to $29,999 | 612 (5.0%) | 338 (3.9%) |
| $30,000 to $34,999 | 387 (3.2%) | 626 (7.2%) |
| $35,000 to $39,999 | 723 (5.9%) | 450 (5.2%) |
| $40,000 to $44,999 | 987 (8.1%) | 433 (5.0%) |
| $45,000 to $49,999 | 901 (7.4%) | 598 (6.9%) |
| $50,000 to $54,999 | 744 (6.1%) | 716 (8.3%) |
| $55,000 to $64,999 | 1,189 (9.7%) | 913 (10.5%) |
| $65,000 to $74,999 | 711 (5.8%) | 558 (6.4%) |
| $75,000 to $99,999 | 1,143 (9.4%) | 783 (9.0%) |
| $100,000+ | 2,298 (18.8%) | 697 (8.0%) |
| Total | 12,202 (100.0%) | 8,683 (100.0%) |
Earnings by Sex by Educational Attainment in Summit County
Average earnings in Summit County are $51,904 for men and $48,361 for women, a difference of 6.8%. Men with an educational attainment of graduate degree enjoy the highest average annual earnings of $64,598, while those with less than high school education earn the least with $24,045. Women with an educational attainment of graduate degree earn the most with the average annual earnings of $68,276, while those with high school diploma education have the smallest earnings of $36,435.
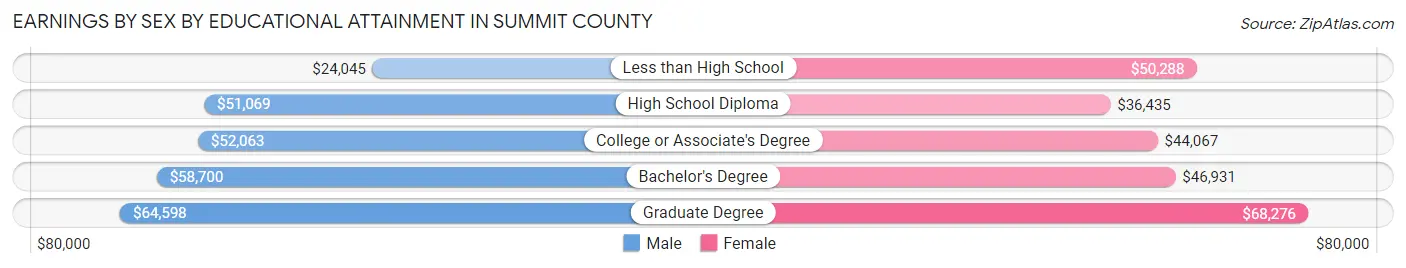
| Educational Attainment | Male Income | Female Income |
| Less than High School | $24,045 | $50,288 |
| High School Diploma | $51,069 | $36,435 |
| College or Associate's Degree | $52,063 | $44,067 |
| Bachelor's Degree | $58,700 | $46,931 |
| Graduate Degree | $64,598 | $68,276 |
| Total | $51,904 | $48,361 |
Family Income in Summit County
Family Income Brackets in Summit County
According to the Summit County family income data, there are 1,934 families falling into the $100,000 to $149,999 income range, which is the most common income bracket and makes up 28.7% of all families. Conversely, the less than $10,000 income bracket is the least frequent group with only 34 families (0.5%) belonging to this category.
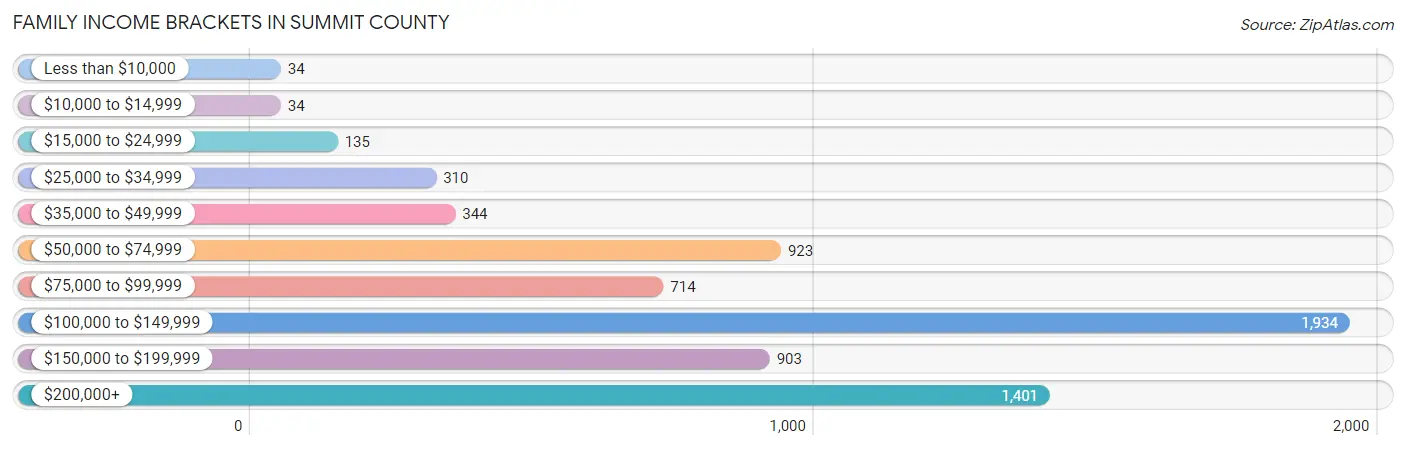
| Income Bracket | # Families | % Families |
| Less than $10,000 | 34 | 0.5% |
| $10,000 to $14,999 | 34 | 0.5% |
| $15,000 to $24,999 | 135 | 2.0% |
| $25,000 to $34,999 | 310 | 4.6% |
| $35,000 to $49,999 | 344 | 5.1% |
| $50,000 to $74,999 | 923 | 13.7% |
| $75,000 to $99,999 | 714 | 10.6% |
| $100,000 to $149,999 | 1,934 | 28.7% |
| $150,000 to $199,999 | 903 | 13.4% |
| $200,000+ | 1,401 | 20.8% |
Family Income by Famaliy Size in Summit County
4-person families (1,116 | 16.6%) account for the highest median family income in Summit County with $138,158 per family, while 2-person families (4,315 | 64.0%) have the highest median income of $57,764 per family member.
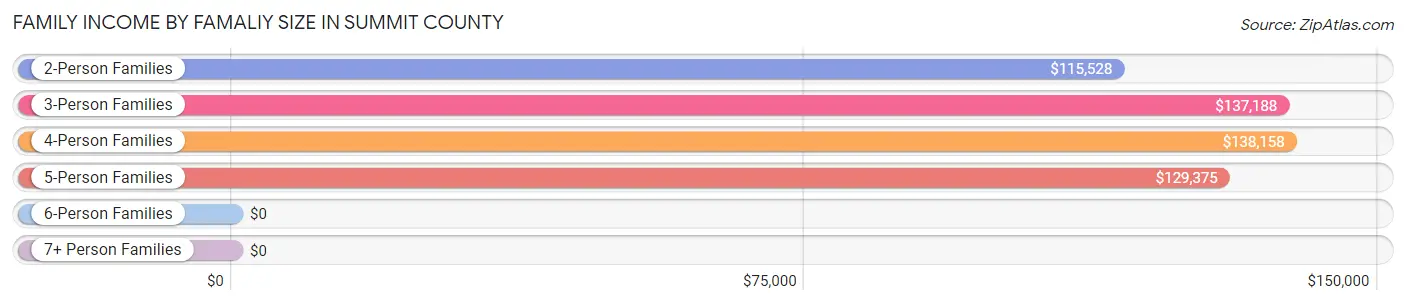
| Income Bracket | # Families | Median Income |
| 2-Person Families | 4,315 (64.0%) | $115,528 |
| 3-Person Families | 1,074 (15.9%) | $137,188 |
| 4-Person Families | 1,116 (16.6%) | $138,158 |
| 5-Person Families | 204 (3.0%) | $129,375 |
| 6-Person Families | 28 (0.4%) | $0 |
| 7+ Person Families | 0 (0.0%) | $0 |
| Total | 6,737 (100.0%) | $120,716 |
Family Income by Number of Earners in Summit County
The median family income in Summit County is $120,716, with families comprising 3+ earners (304) having the highest median family income of $162,857, while families with 1 earner (1,500) have the lowest median family income of $101,968, accounting for 4.5% and 22.3% of families, respectively.
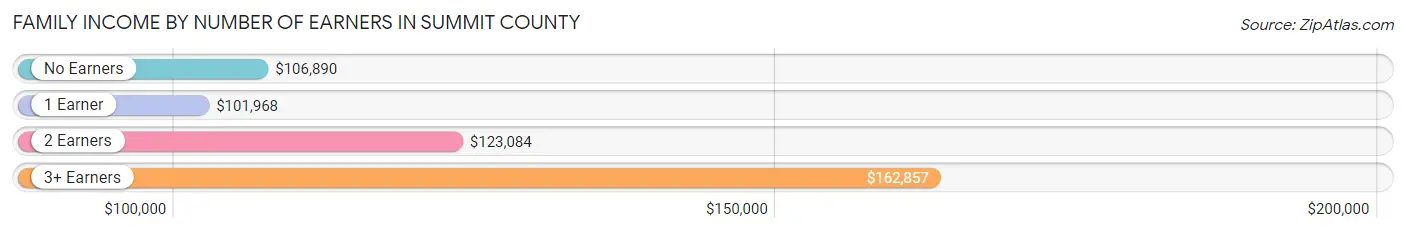
| Number of Earners | # Families | Median Income |
| No Earners | 1,004 (14.9%) | $106,890 |
| 1 Earner | 1,500 (22.3%) | $101,968 |
| 2 Earners | 3,929 (58.3%) | $123,084 |
| 3+ Earners | 304 (4.5%) | $162,857 |
| Total | 6,737 (100.0%) | $120,716 |
Household Income in Summit County
Household Income Brackets in Summit County
With 2,597 households falling in the category, the $100,000 to $149,999 income range is the most frequent in Summit County, accounting for 22.1% of all households. In contrast, only 94 households (0.8%) fall into the less than $10,000 income bracket, making it the least populous group.
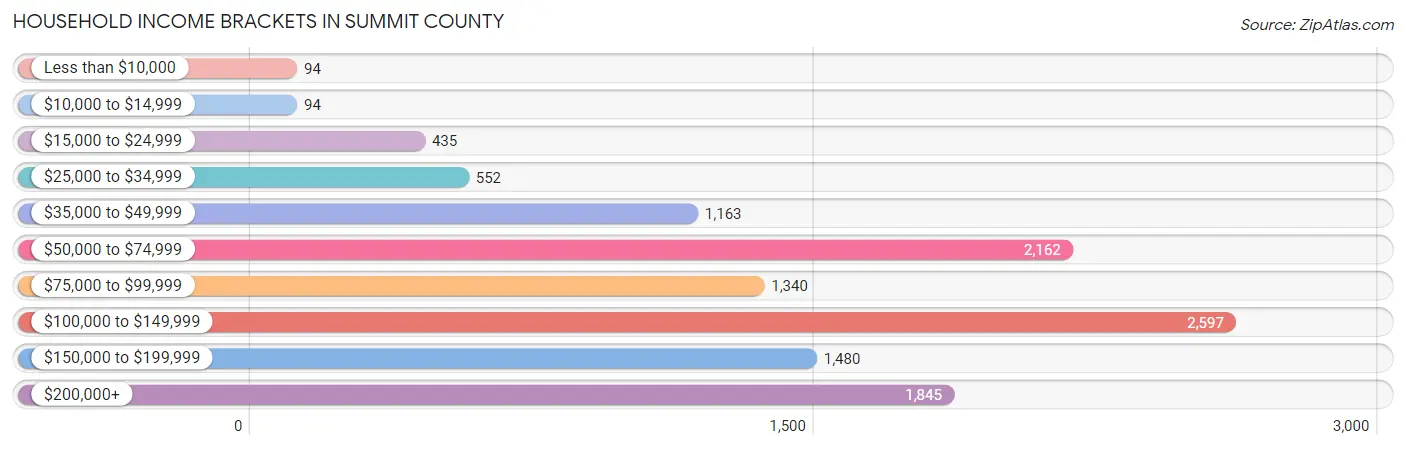
| Income Bracket | # Households | % Households |
| Less than $10,000 | 94 | 0.8% |
| $10,000 to $14,999 | 94 | 0.8% |
| $15,000 to $24,999 | 435 | 3.7% |
| $25,000 to $34,999 | 552 | 4.7% |
| $35,000 to $49,999 | 1,163 | 9.9% |
| $50,000 to $74,999 | 2,162 | 18.4% |
| $75,000 to $99,999 | 1,340 | 11.4% |
| $100,000 to $149,999 | 2,597 | 22.1% |
| $150,000 to $199,999 | 1,480 | 12.6% |
| $200,000+ | 1,845 | 15.7% |
Household Income by Householder Age in Summit County
The median household income in Summit County is $100,611, with the highest median household income of $105,091 found in the 65+ years age bracket for the primary householder. A total of 2,531 households (21.5%) fall into this category. Meanwhile, the 15 to 24 years age bracket for the primary householder has the lowest median household income of $48,642, with 465 households (4.0%) in this group.
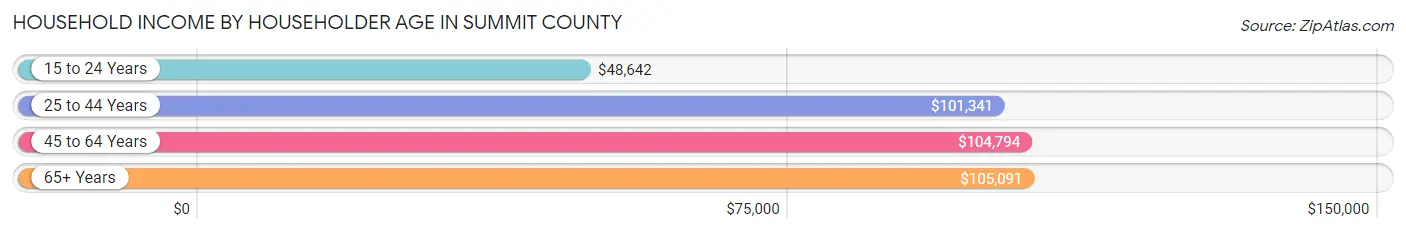
| Income Bracket | # Households | Median Income |
| 15 to 24 Years | 465 (4.0%) | $48,642 |
| 25 to 44 Years | 4,078 (34.7%) | $101,341 |
| 45 to 64 Years | 4,676 (39.8%) | $104,794 |
| 65+ Years | 2,531 (21.5%) | $105,091 |
| Total | 11,750 (100.0%) | $100,611 |
Poverty in Summit County
Income Below Poverty by Sex and Age in Summit County
With 6.6% poverty level for males and 8.3% for females among the residents of Summit County, 18 to 24 year old males and 18 to 24 year old females are the most vulnerable to poverty, with 170 males (17.0%) and 374 females (40.6%) in their respective age groups living below the poverty level.
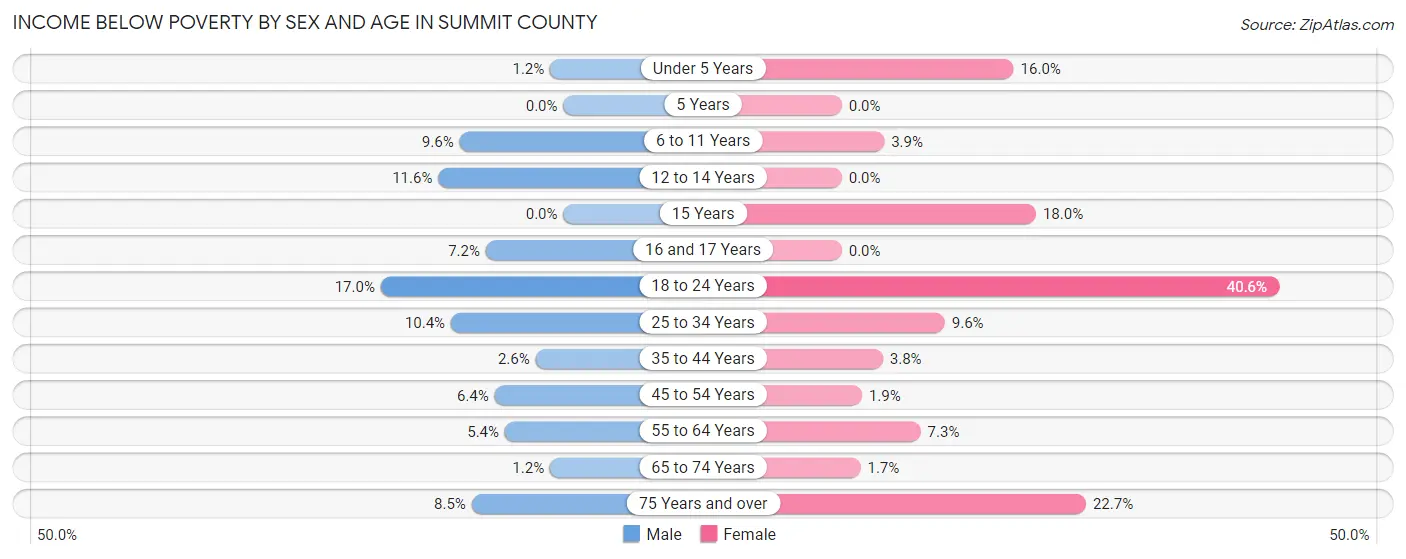
| Age Bracket | Male | Female |
| Under 5 Years | 7 (1.2%) | 70 (16.0%) |
| 5 Years | 0 (0.0%) | 0 (0.0%) |
| 6 to 11 Years | 88 (9.6%) | 30 (3.9%) |
| 12 to 14 Years | 44 (11.6%) | 0 (0.0%) |
| 15 Years | 0 (0.0%) | 31 (18.0%) |
| 16 and 17 Years | 17 (7.2%) | 0 (0.0%) |
| 18 to 24 Years | 170 (17.0%) | 374 (40.6%) |
| 25 to 34 Years | 372 (10.4%) | 232 (9.6%) |
| 35 to 44 Years | 70 (2.6%) | 86 (3.8%) |
| 45 to 54 Years | 156 (6.4%) | 34 (1.9%) |
| 55 to 64 Years | 121 (5.4%) | 142 (7.3%) |
| 65 to 74 Years | 23 (1.2%) | 27 (1.7%) |
| 75 Years and over | 55 (8.5%) | 126 (22.7%) |
| Total | 1,123 (6.6%) | 1,152 (8.3%) |
Income Above Poverty by Sex and Age in Summit County
According to the poverty statistics in Summit County, males aged 5 years and females aged 12 to 14 years are the age groups that are most secure financially, with 100.0% of males and 100.0% of females in these age groups living above the poverty line.
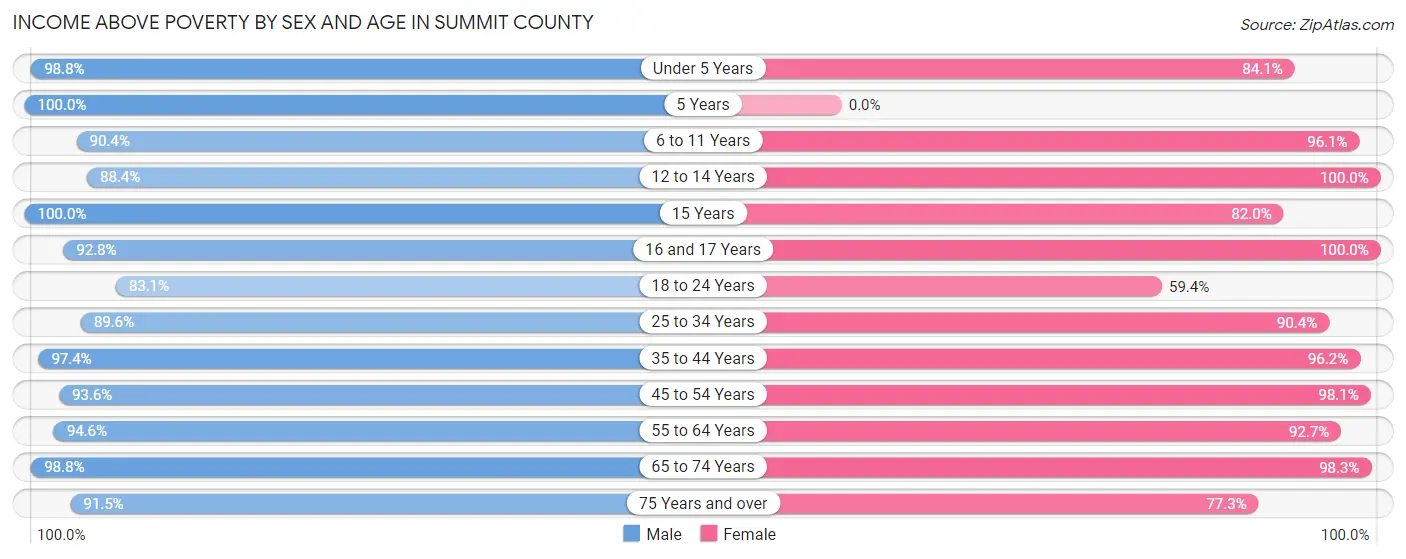
| Age Bracket | Male | Female |
| Under 5 Years | 562 (98.8%) | 369 (84.1%) |
| 5 Years | 315 (100.0%) | 0 (0.0%) |
| 6 to 11 Years | 825 (90.4%) | 731 (96.1%) |
| 12 to 14 Years | 335 (88.4%) | 656 (100.0%) |
| 15 Years | 57 (100.0%) | 141 (82.0%) |
| 16 and 17 Years | 219 (92.8%) | 352 (100.0%) |
| 18 to 24 Years | 833 (83.1%) | 548 (59.4%) |
| 25 to 34 Years | 3,194 (89.6%) | 2,195 (90.4%) |
| 35 to 44 Years | 2,647 (97.4%) | 2,172 (96.2%) |
| 45 to 54 Years | 2,288 (93.6%) | 1,782 (98.1%) |
| 55 to 64 Years | 2,107 (94.6%) | 1,798 (92.7%) |
| 65 to 74 Years | 1,825 (98.8%) | 1,527 (98.3%) |
| 75 Years and over | 591 (91.5%) | 430 (77.3%) |
| Total | 15,798 (93.4%) | 12,701 (91.7%) |
Income Below Poverty Among Married-Couple Families in Summit County
The poverty statistics for married-couple families in Summit County show that 1.9% or 112 of the total 5,885 families live below the poverty line. Families with 1 or 2 children have the highest poverty rate of 2.4%, comprising of 41 families. On the other hand, families with 3 or 4 children have the lowest poverty rate of 0.0%, which includes 0 families.
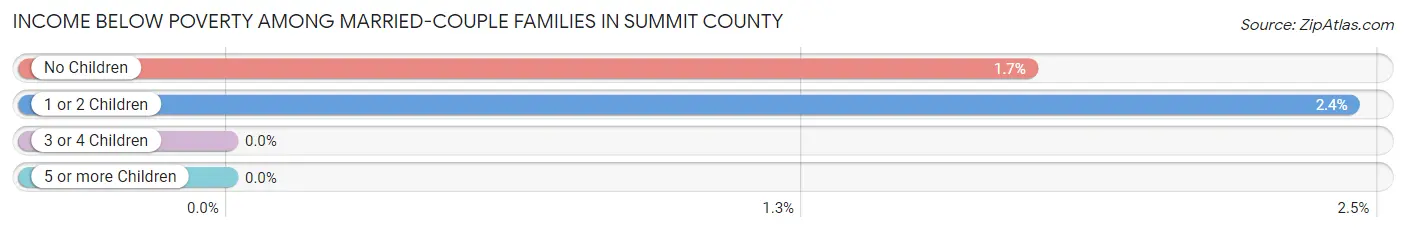
| Children | Above Poverty | Below Poverty |
| No Children | 4,008 (98.3%) | 71 (1.7%) |
| 1 or 2 Children | 1,640 (97.6%) | 41 (2.4%) |
| 3 or 4 Children | 125 (100.0%) | 0 (0.0%) |
| 5 or more Children | 0 (0.0%) | 0 (0.0%) |
| Total | 5,773 (98.1%) | 112 (1.9%) |
Income Below Poverty Among Single-Parent Households in Summit County
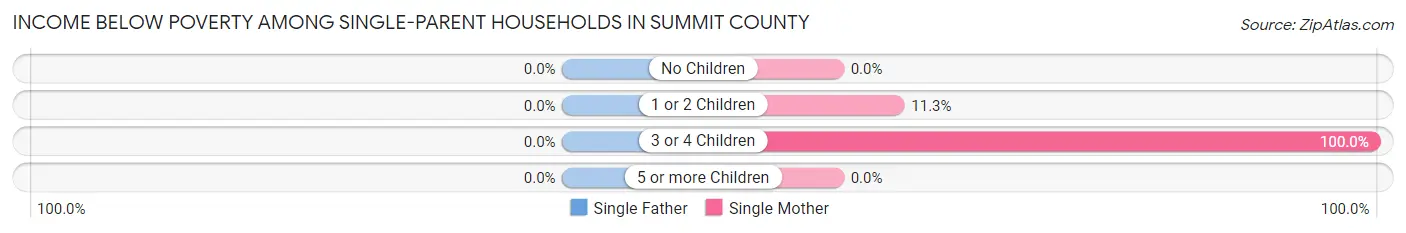
| Children | Single Father | Single Mother |
| No Children | 0 (0.0%) | 0 (0.0%) |
| 1 or 2 Children | 0 (0.0%) | 34 (11.3%) |
| 3 or 4 Children | 0 (0.0%) | 11 (100.0%) |
| 5 or more Children | 0 (0.0%) | 0 (0.0%) |
| Total | 0 (0.0%) | 45 (7.5%) |
Income Below Poverty Among Married-Couple vs Single-Parent Households in Summit County
The poverty data for Summit County shows that 112 of the married-couple family households (1.9%) and 45 of the single-parent households (5.3%) are living below the poverty level. Within the married-couple family households, those with 1 or 2 children have the highest poverty rate, with 41 households (2.4%) falling below the poverty line. Among the single-parent households, those with 3 or 4 children have the highest poverty rate, with 11 household (11.0%) living below poverty.
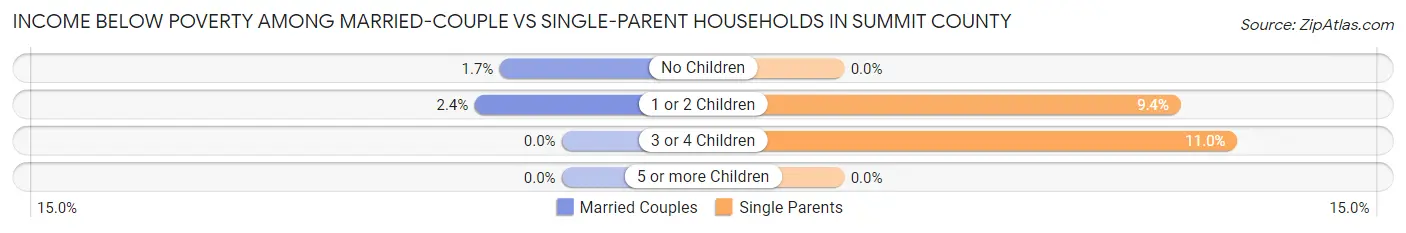
| Children | Married-Couple Families | Single-Parent Households |
| No Children | 71 (1.7%) | 0 (0.0%) |
| 1 or 2 Children | 41 (2.4%) | 34 (9.4%) |
| 3 or 4 Children | 0 (0.0%) | 11 (11.0%) |
| 5 or more Children | 0 (0.0%) | 0 (0.0%) |
| Total | 112 (1.9%) | 45 (5.3%) |
Employment Characteristics in Summit County
Employment by Class of Employer in Summit County
Among the 18,644 employed individuals in Summit County, private company employees (13,417 | 72.0%), self-employed (incorporated) (1,512 | 8.1%), and local government employees (1,296 | 7.0%) make up the most common classes of employment.
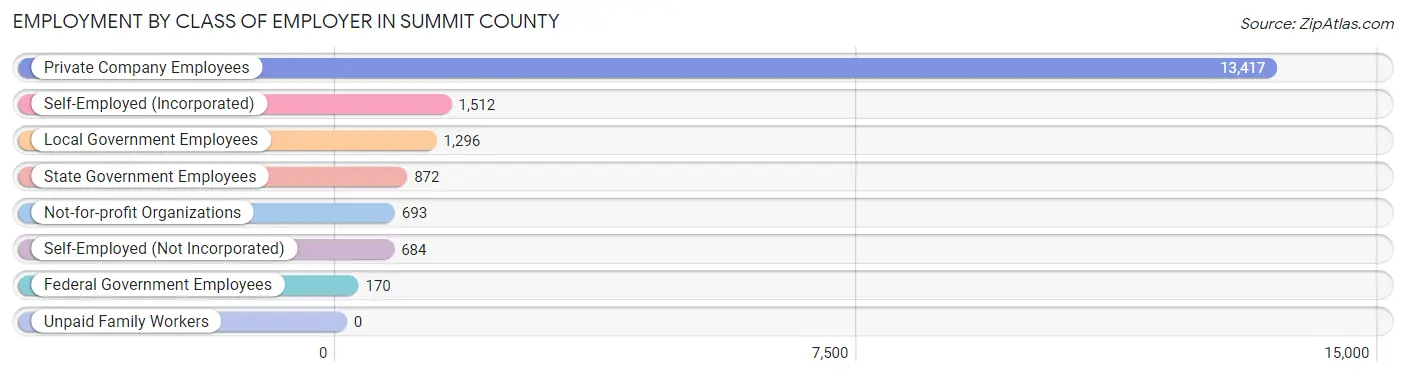
| Employer Class | # Employees | % Employees |
| Private Company Employees | 13,417 | 72.0% |
| Self-Employed (Incorporated) | 1,512 | 8.1% |
| Self-Employed (Not Incorporated) | 684 | 3.7% |
| Not-for-profit Organizations | 693 | 3.7% |
| Local Government Employees | 1,296 | 7.0% |
| State Government Employees | 872 | 4.7% |
| Federal Government Employees | 170 | 0.9% |
| Unpaid Family Workers | 0 | 0.0% |
| Total | 18,644 | 100.0% |
Employment Status by Age in Summit County
According to the labor force statistics for Summit County, out of the total population over 16 years of age (26,567), 75.9% or 20,164 individuals are in the labor force, with 3.7% or 746 of them unemployed. The age group with the highest labor force participation rate is 45 to 54 years, with 96.6% or 4,120 individuals in the labor force. Within the labor force, the 16 to 19 years age range has the highest percentage of unemployed individuals, with 20.3% or 82 of them being unemployed.
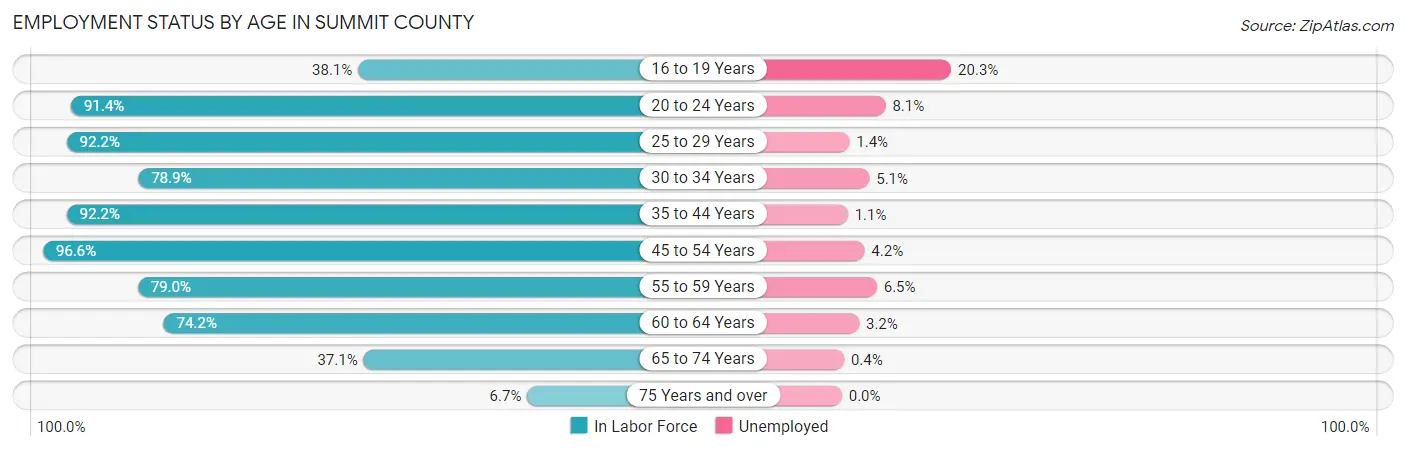
| Age Bracket | In Labor Force | Unemployed |
| 16 to 19 Years | 403 (38.1%) | 82 (20.3%) |
| 20 to 24 Years | 1,333 (91.4%) | 108 (8.1%) |
| 25 to 29 Years | 2,843 (92.2%) | 40 (1.4%) |
| 30 to 34 Years | 2,315 (78.9%) | 118 (5.1%) |
| 35 to 44 Years | 4,605 (92.2%) | 51 (1.1%) |
| 45 to 54 Years | 4,120 (96.6%) | 173 (4.2%) |
| 55 to 59 Years | 1,714 (79.0%) | 111 (6.5%) |
| 60 to 64 Years | 1,483 (74.2%) | 47 (3.2%) |
| 65 to 74 Years | 1,262 (37.1%) | 5 (0.4%) |
| 75 Years and over | 81 (6.7%) | 0 (0.0%) |
| Total | 20,164 (75.9%) | 746 (3.7%) |
Employment Status by Educational Attainment in Summit County
According to labor force statistics for Summit County, 87.8% of individuals (17,074) out of the total population between 25 and 64 years of age (19,446) are in the labor force, with 3.2% or 546 of them being unemployed. The group with the highest labor force participation rate are those with the educational attainment of high school diploma, with 89.2% or 3,302 individuals in the labor force. Within the labor force, individuals with less than high school education have the highest percentage of unemployment, with 24.4% or 259 of them being unemployed.
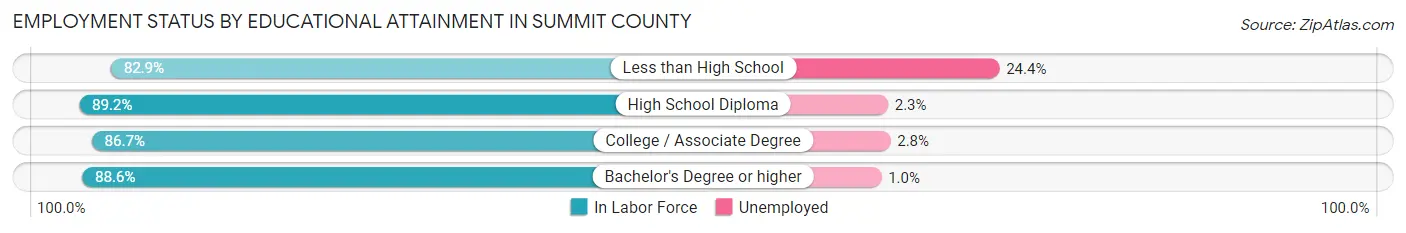
| Educational Attainment | In Labor Force | Unemployed |
| Less than High School | 1,061 (82.9%) | 312 (24.4%) |
| High School Diploma | 3,302 (89.2%) | 85 (2.3%) |
| College / Associate Degree | 4,600 (86.7%) | 149 (2.8%) |
| Bachelor's Degree or higher | 8,114 (88.6%) | 92 (1.0%) |
| Total | 17,074 (87.8%) | 622 (3.2%) |
Employment Occupations by Sex in Summit County
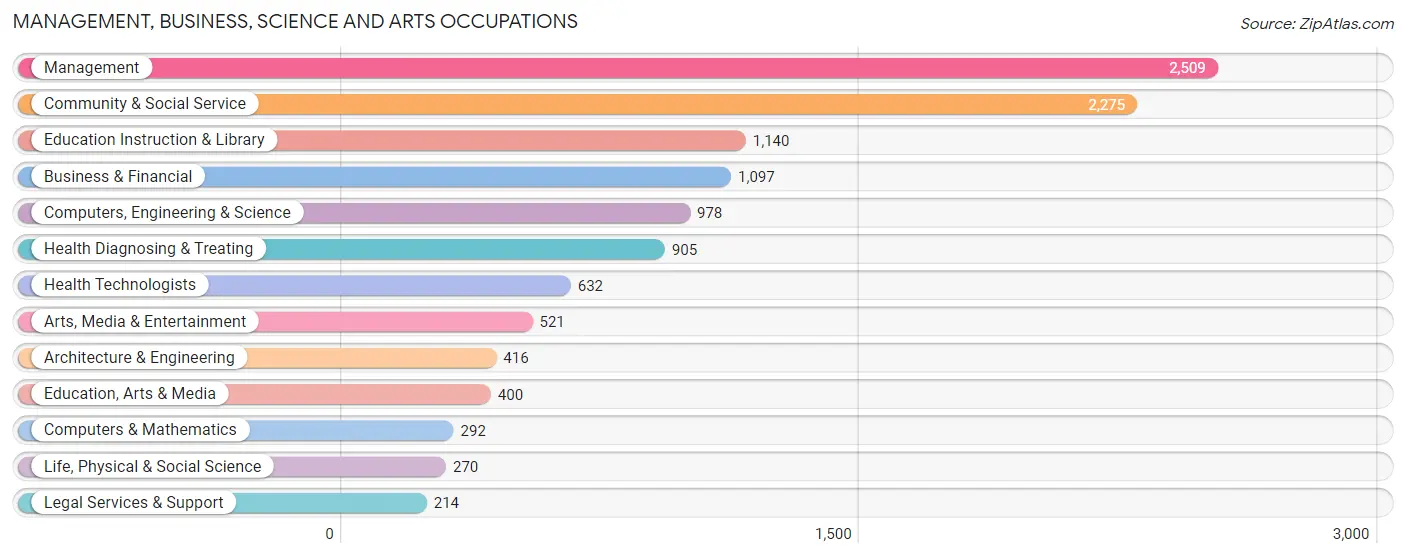
Management, Business, Science and Arts Occupations
The most common Management, Business, Science and Arts occupations in Summit County are Management (2,509 | 12.9%), Community & Social Service (2,275 | 11.7%), Education Instruction & Library (1,140 | 5.9%), Business & Financial (1,097 | 5.7%), and Computers, Engineering & Science (978 | 5.0%).
Management, Business, Science and Arts Occupations by Sex
Within the Management, Business, Science and Arts occupations in Summit County, the most male-oriented occupations are Education, Arts & Media (91.5%), Legal Services & Support (86.5%), and Computers & Mathematics (84.3%), while the most female-oriented occupations are Health Technologists (77.5%), Business & Financial (75.8%), and Health Diagnosing & Treating (73.4%).
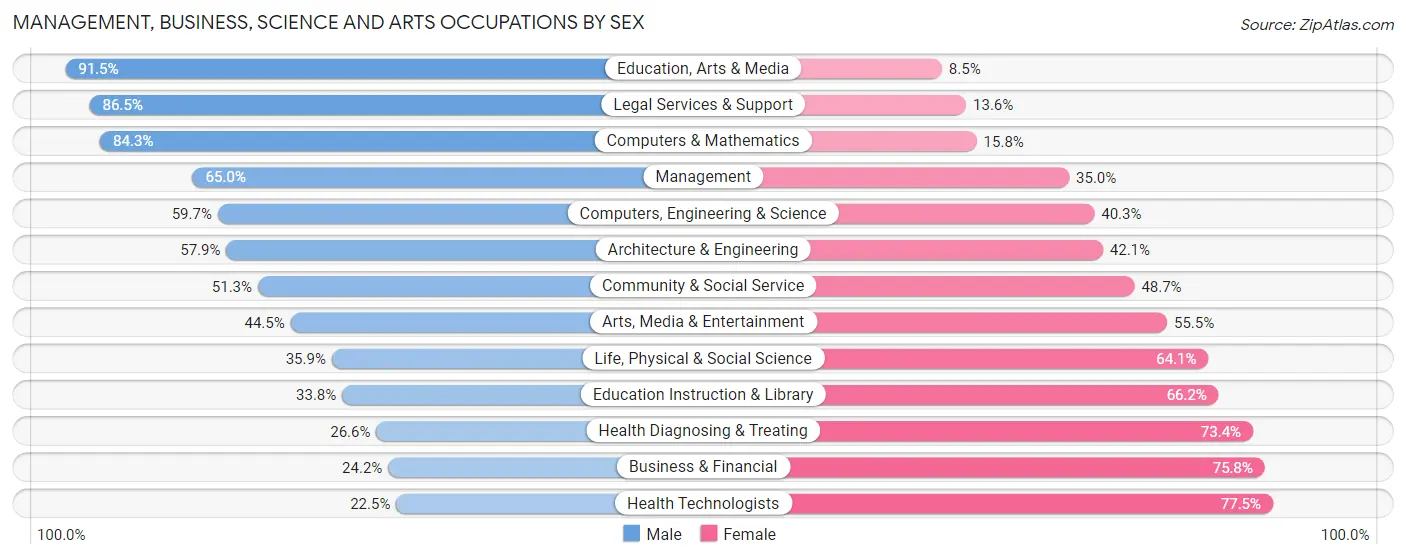
| Occupation | Male | Female |
| Management | 1,630 (65.0%) | 879 (35.0%) |
| Business & Financial | 265 (24.2%) | 832 (75.8%) |
| Computers, Engineering & Science | 584 (59.7%) | 394 (40.3%) |
| Computers & Mathematics | 246 (84.3%) | 46 (15.8%) |
| Architecture & Engineering | 241 (57.9%) | 175 (42.1%) |
| Life, Physical & Social Science | 97 (35.9%) | 173 (64.1%) |
| Community & Social Service | 1,168 (51.3%) | 1,107 (48.7%) |
| Education, Arts & Media | 366 (91.5%) | 34 (8.5%) |
| Legal Services & Support | 185 (86.5%) | 29 (13.6%) |
| Education Instruction & Library | 385 (33.8%) | 755 (66.2%) |
| Arts, Media & Entertainment | 232 (44.5%) | 289 (55.5%) |
| Health Diagnosing & Treating | 241 (26.6%) | 664 (73.4%) |
| Health Technologists | 142 (22.5%) | 490 (77.5%) |
| Total (Category) | 3,888 (50.1%) | 3,876 (49.9%) |
| Total (Overall) | 11,187 (57.6%) | 8,232 (42.4%) |
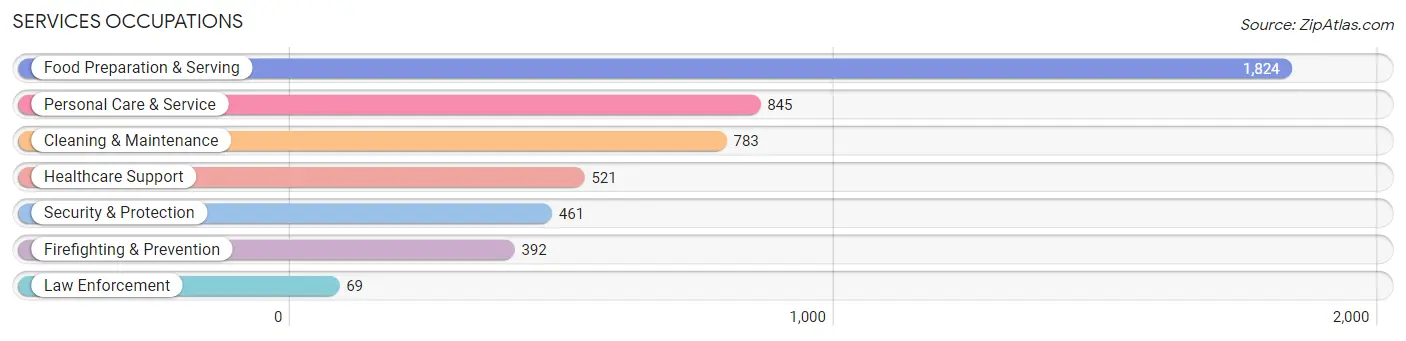
Services Occupations
The most common Services occupations in Summit County are Food Preparation & Serving (1,824 | 9.4%), Personal Care & Service (845 | 4.3%), Cleaning & Maintenance (783 | 4.0%), Healthcare Support (521 | 2.7%), and Security & Protection (461 | 2.4%).
Services Occupations by Sex
Within the Services occupations in Summit County, the most male-oriented occupations are Law Enforcement (100.0%), Security & Protection (85.5%), and Firefighting & Prevention (82.9%), while the most female-oriented occupations are Personal Care & Service (77.5%), Healthcare Support (56.6%), and Food Preparation & Serving (41.9%).
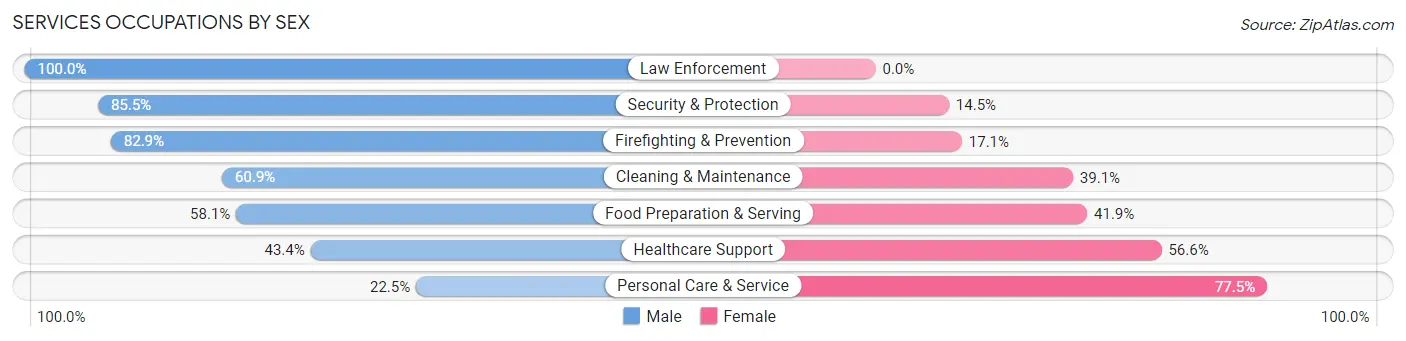
| Occupation | Male | Female |
| Healthcare Support | 226 (43.4%) | 295 (56.6%) |
| Security & Protection | 394 (85.5%) | 67 (14.5%) |
| Firefighting & Prevention | 325 (82.9%) | 67 (17.1%) |
| Law Enforcement | 69 (100.0%) | 0 (0.0%) |
| Food Preparation & Serving | 1,060 (58.1%) | 764 (41.9%) |
| Cleaning & Maintenance | 477 (60.9%) | 306 (39.1%) |
| Personal Care & Service | 190 (22.5%) | 655 (77.5%) |
| Total (Category) | 2,347 (52.9%) | 2,087 (47.1%) |
| Total (Overall) | 11,187 (57.6%) | 8,232 (42.4%) |
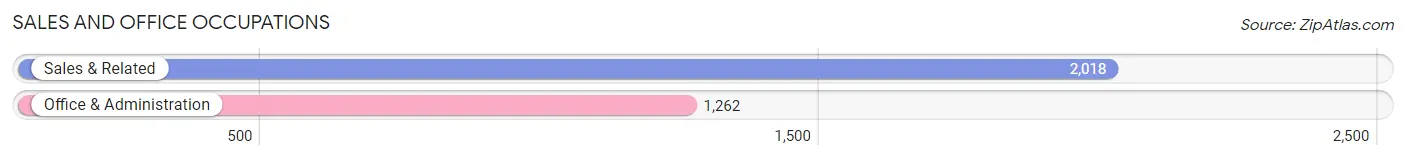
Sales and Office Occupations
The most common Sales and Office occupations in Summit County are Sales & Related (2,018 | 10.4%), and Office & Administration (1,262 | 6.5%).
Sales and Office Occupations by Sex
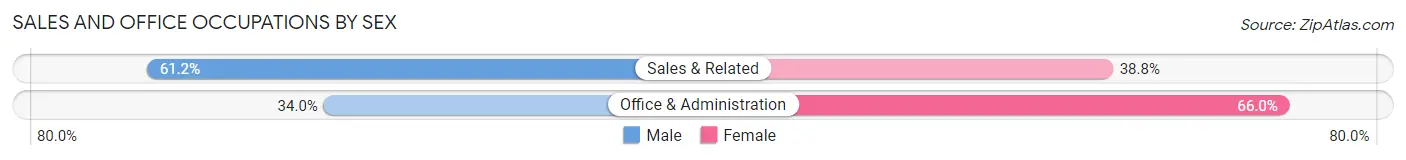
| Occupation | Male | Female |
| Sales & Related | 1,235 (61.2%) | 783 (38.8%) |
| Office & Administration | 429 (34.0%) | 833 (66.0%) |
| Total (Category) | 1,664 (50.7%) | 1,616 (49.3%) |
| Total (Overall) | 11,187 (57.6%) | 8,232 (42.4%) |
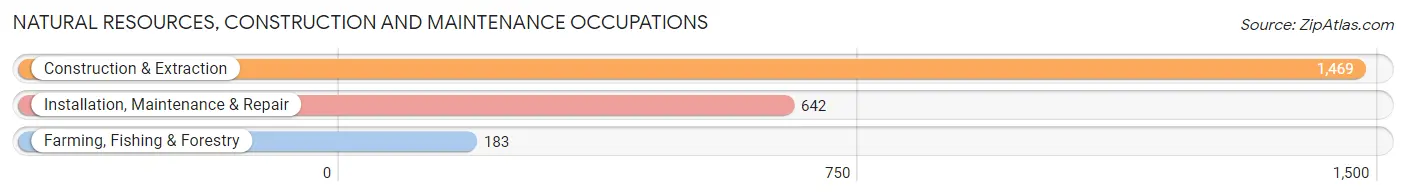
Natural Resources, Construction and Maintenance Occupations
The most common Natural Resources, Construction and Maintenance occupations in Summit County are Construction & Extraction (1,469 | 7.6%), Installation, Maintenance & Repair (642 | 3.3%), and Farming, Fishing & Forestry (183 | 0.9%).
Natural Resources, Construction and Maintenance Occupations by Sex
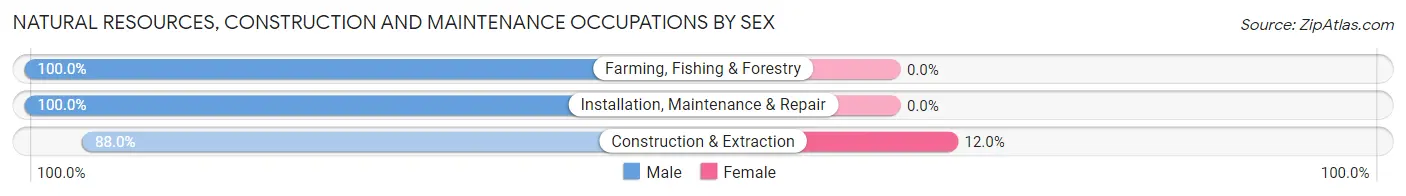
| Occupation | Male | Female |
| Farming, Fishing & Forestry | 183 (100.0%) | 0 (0.0%) |
| Construction & Extraction | 1,293 (88.0%) | 176 (12.0%) |
| Installation, Maintenance & Repair | 642 (100.0%) | 0 (0.0%) |
| Total (Category) | 2,118 (92.3%) | 176 (7.7%) |
| Total (Overall) | 11,187 (57.6%) | 8,232 (42.4%) |
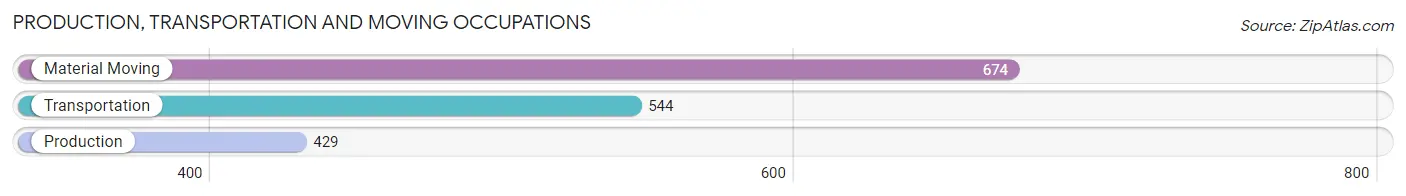
Production, Transportation and Moving Occupations
The most common Production, Transportation and Moving occupations in Summit County are Material Moving (674 | 3.5%), Transportation (544 | 2.8%), and Production (429 | 2.2%).
Production, Transportation and Moving Occupations by Sex
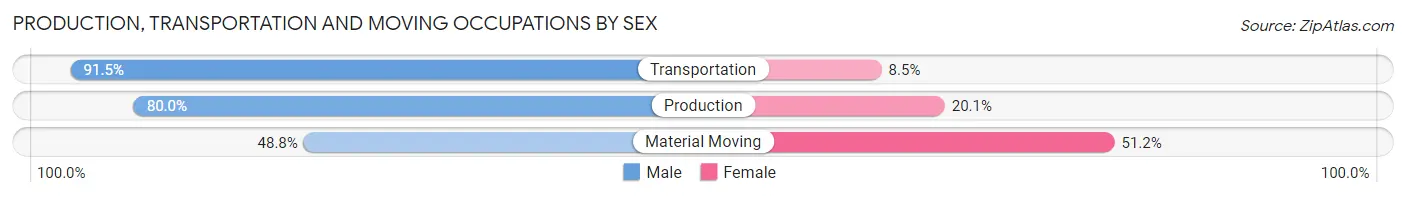
| Occupation | Male | Female |
| Production | 343 (79.9%) | 86 (20.1%) |
| Transportation | 498 (91.5%) | 46 (8.5%) |
| Material Moving | 329 (48.8%) | 345 (51.2%) |
| Total (Category) | 1,170 (71.0%) | 477 (29.0%) |
| Total (Overall) | 11,187 (57.6%) | 8,232 (42.4%) |
Employment Industries by Sex in Summit County
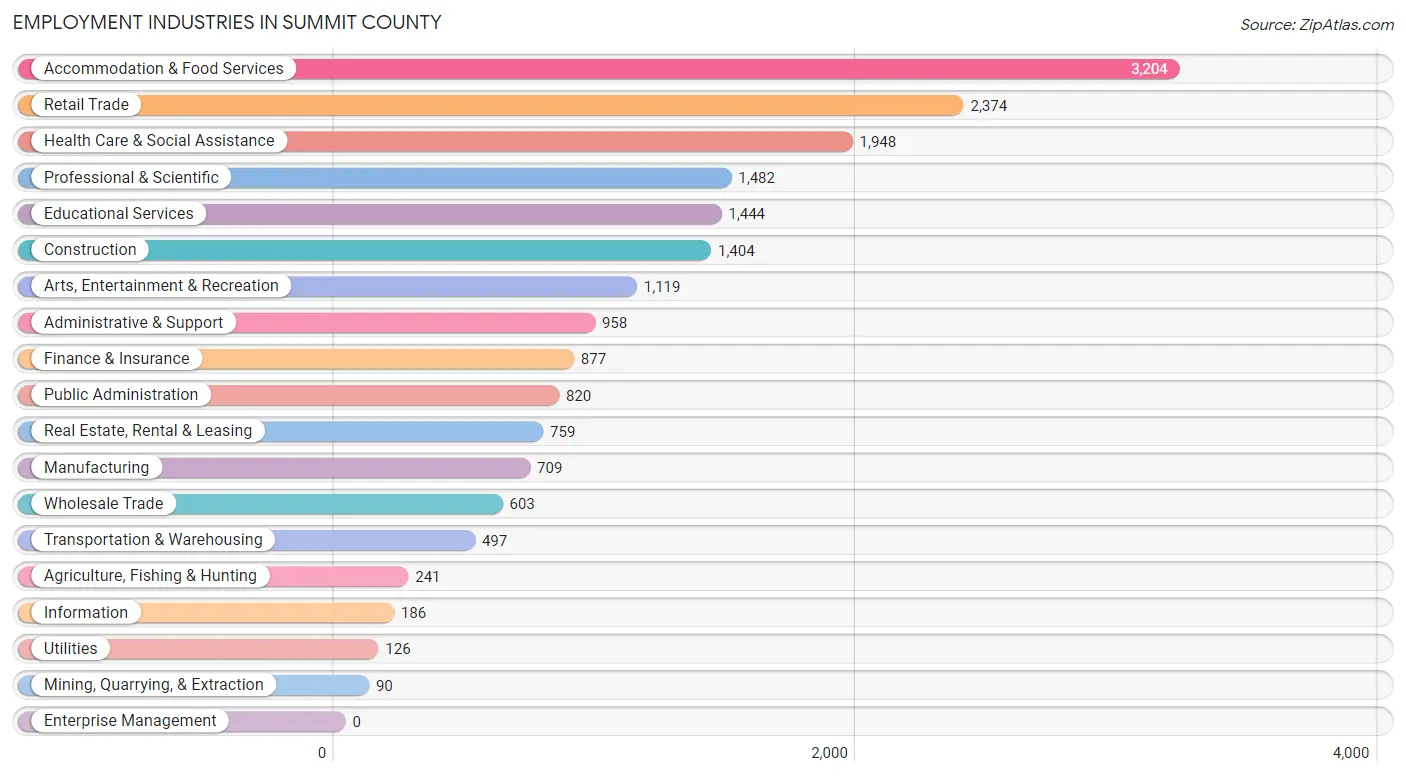
Employment Industries in Summit County
The major employment industries in Summit County include Accommodation & Food Services (3,204 | 16.5%), Retail Trade (2,374 | 12.2%), Health Care & Social Assistance (1,948 | 10.0%), Professional & Scientific (1,482 | 7.6%), and Educational Services (1,444 | 7.4%).
Employment Industries by Sex in Summit County
The Summit County industries that see more men than women are Mining, Quarrying, & Extraction (100.0%), Agriculture, Fishing & Hunting (92.9%), and Construction (92.7%), whereas the industries that tend to have a higher number of women are Public Administration (64.6%), Finance & Insurance (62.7%), and Educational Services (60.5%).
| Industry | Male | Female |
| Agriculture, Fishing & Hunting | 224 (92.9%) | 17 (7.0%) |
| Mining, Quarrying, & Extraction | 90 (100.0%) | 0 (0.0%) |
| Construction | 1,301 (92.7%) | 103 (7.3%) |
| Manufacturing | 525 (74.1%) | 184 (26.0%) |
| Wholesale Trade | 477 (79.1%) | 126 (20.9%) |
| Retail Trade | 1,306 (55.0%) | 1,068 (45.0%) |
| Transportation & Warehousing | 374 (75.2%) | 123 (24.7%) |
| Utilities | 102 (80.9%) | 24 (19.1%) |
| Information | 104 (55.9%) | 82 (44.1%) |
| Finance & Insurance | 327 (37.3%) | 550 (62.7%) |
| Real Estate, Rental & Leasing | 514 (67.7%) | 245 (32.3%) |
| Professional & Scientific | 864 (58.3%) | 618 (41.7%) |
| Enterprise Management | 0 (0.0%) | 0 (0.0%) |
| Administrative & Support | 553 (57.7%) | 405 (42.3%) |
| Educational Services | 570 (39.5%) | 874 (60.5%) |
| Health Care & Social Assistance | 840 (43.1%) | 1,108 (56.9%) |
| Arts, Entertainment & Recreation | 681 (60.9%) | 438 (39.1%) |
| Accommodation & Food Services | 1,806 (56.4%) | 1,398 (43.6%) |
| Public Administration | 290 (35.4%) | 530 (64.6%) |
| Total | 11,187 (57.6%) | 8,232 (42.4%) |
Education in Summit County
School Enrollment in Summit County
The most common levels of schooling among the 5,779 students in Summit County are middle school (1,430 | 24.7%), high school (1,206 | 20.9%), and college / undergraduate (1,191 | 20.6%).
| School Level | # Students | % Students |
| Nursery / Preschool | 331 | 5.7% |
| Kindergarten | 162 | 2.8% |
| Elementary School | 965 | 16.7% |
| Middle School | 1,430 | 24.7% |
| High School | 1,206 | 20.9% |
| College / Undergraduate | 1,191 | 20.6% |
| Graduate / Professional | 494 | 8.6% |
| Total | 5,779 | 100.0% |
School Enrollment by Age by Funding Source in Summit County
Out of a total of 5,779 students who are enrolled in schools in Summit County, 503 (8.7%) attend a private institution, while the remaining 5,276 (91.3%) are enrolled in public schools. The age group of 3 to 4 year olds has the highest likelihood of being enrolled in private schools, with 92 (62.2% in the age bracket) enrolled. Conversely, the age group of 25 to 34 year olds has the lowest likelihood of being enrolled in a private school, with 474 (100.0% in the age bracket) attending a public institution.
| Age Bracket | Public School | Private School |
| 3 to 4 Year Olds | 56 (37.8%) | 92 (62.2%) |
| 5 to 9 Year Old | 1,218 (93.9%) | 79 (6.1%) |
| 10 to 14 Year Olds | 1,480 (93.1%) | 110 (6.9%) |
| 15 to 17 Year Olds | 756 (92.5%) | 61 (7.5%) |
| 18 to 19 Year Olds | 311 (73.9%) | 110 (26.1%) |
| 20 to 24 Year Olds | 515 (99.8%) | 1 (0.2%) |
| 25 to 34 Year Olds | 474 (100.0%) | 0 (0.0%) |
| 35 Years and over | 464 (89.9%) | 52 (10.1%) |
| Total | 5,276 (91.3%) | 503 (8.7%) |
Educational Attainment by Field of Study in Summit County
Business (2,452 | 18.4%), bio, nature & agricultural (1,536 | 11.5%), social sciences (1,372 | 10.3%), engineering (1,227 | 9.2%), and education (1,218 | 9.1%) are the most common fields of study among 13,323 individuals in Summit County who have obtained a bachelor's degree or higher.
| Field of Study | # Graduates | % Graduates |
| Computers & Mathematics | 534 | 4.0% |
| Bio, Nature & Agricultural | 1,536 | 11.5% |
| Physical & Health Sciences | 540 | 4.1% |
| Psychology | 699 | 5.2% |
| Social Sciences | 1,372 | 10.3% |
| Engineering | 1,227 | 9.2% |
| Multidisciplinary Studies | 154 | 1.2% |
| Science & Technology | 906 | 6.8% |
| Business | 2,452 | 18.4% |
| Education | 1,218 | 9.1% |
| Literature & Languages | 535 | 4.0% |
| Liberal Arts & History | 458 | 3.4% |
| Visual & Performing Arts | 428 | 3.2% |
| Communications | 587 | 4.4% |
| Arts & Humanities | 677 | 5.1% |
| Total | 13,323 | 100.0% |
Transportation & Commute in Summit County
Vehicle Availability by Sex in Summit County
The most prevalent vehicle ownership categories in Summit County are males with 2 vehicles (4,931, accounting for 47.0%) and females with 2 vehicles (3,816, making up 62.5%).
| Vehicles Available | Male | Female |
| No Vehicle | 186 (1.8%) | 246 (3.1%) |
| 1 Vehicle | 1,608 (15.3%) | 1,222 (15.5%) |
| 2 Vehicles | 4,931 (47.0%) | 3,816 (48.3%) |
| 3 Vehicles | 2,332 (22.2%) | 1,943 (24.6%) |
| 4 Vehicles | 673 (6.4%) | 436 (5.5%) |
| 5 or more Vehicles | 755 (7.2%) | 231 (2.9%) |
| Total | 10,485 (100.0%) | 7,894 (100.0%) |
Commute Time in Summit County
The most frequently occuring commute durations in Summit County are 15 to 19 minutes (3,420 commuters, 22.7%), 10 to 14 minutes (2,657 commuters, 17.7%), and 20 to 24 minutes (2,341 commuters, 15.6%).
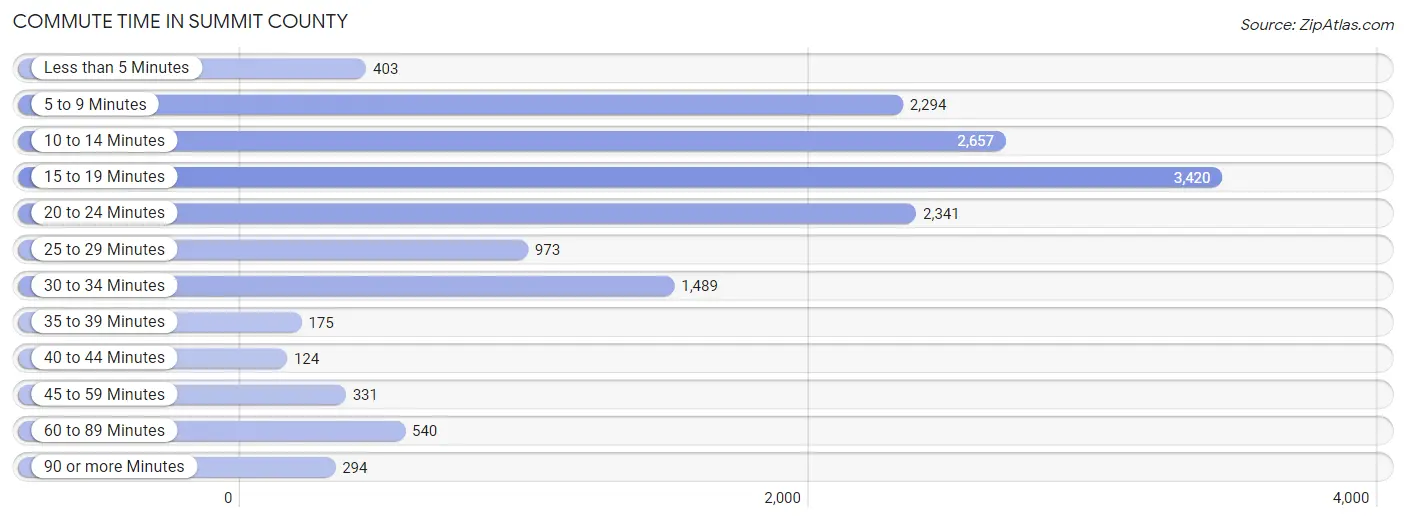
| Commute Time | # Commuters | % Commuters |
| Less than 5 Minutes | 403 | 2.7% |
| 5 to 9 Minutes | 2,294 | 15.2% |
| 10 to 14 Minutes | 2,657 | 17.7% |
| 15 to 19 Minutes | 3,420 | 22.7% |
| 20 to 24 Minutes | 2,341 | 15.6% |
| 25 to 29 Minutes | 973 | 6.5% |
| 30 to 34 Minutes | 1,489 | 9.9% |
| 35 to 39 Minutes | 175 | 1.2% |
| 40 to 44 Minutes | 124 | 0.8% |
| 45 to 59 Minutes | 331 | 2.2% |
| 60 to 89 Minutes | 540 | 3.6% |
| 90 or more Minutes | 294 | 1.9% |
Commute Time by Sex in Summit County
The most common commute times in Summit County are 5 to 9 minutes (1,710 commuters, 19.8%) for males and 15 to 19 minutes (1,716 commuters, 26.8%) for females.
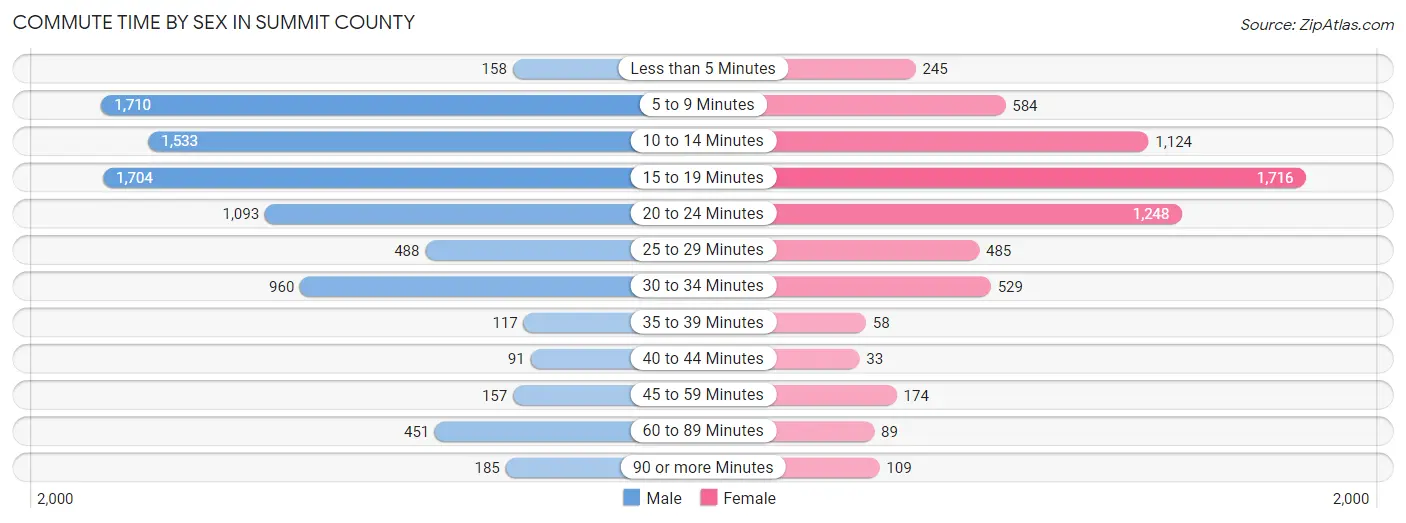
| Commute Time | Male | Female |
| Less than 5 Minutes | 158 (1.8%) | 245 (3.8%) |
| 5 to 9 Minutes | 1,710 (19.8%) | 584 (9.1%) |
| 10 to 14 Minutes | 1,533 (17.7%) | 1,124 (17.6%) |
| 15 to 19 Minutes | 1,704 (19.7%) | 1,716 (26.8%) |
| 20 to 24 Minutes | 1,093 (12.6%) | 1,248 (19.5%) |
| 25 to 29 Minutes | 488 (5.6%) | 485 (7.6%) |
| 30 to 34 Minutes | 960 (11.1%) | 529 (8.3%) |
| 35 to 39 Minutes | 117 (1.3%) | 58 (0.9%) |
| 40 to 44 Minutes | 91 (1.1%) | 33 (0.5%) |
| 45 to 59 Minutes | 157 (1.8%) | 174 (2.7%) |
| 60 to 89 Minutes | 451 (5.2%) | 89 (1.4%) |
| 90 or more Minutes | 185 (2.1%) | 109 (1.7%) |
Time of Departure to Work by Sex in Summit County
The most frequent times of departure to work in Summit County are 7:00 AM to 7:29 AM (1,423, 16.5%) for males and 7:30 AM to 7:59 AM (1,377, 21.5%) for females.
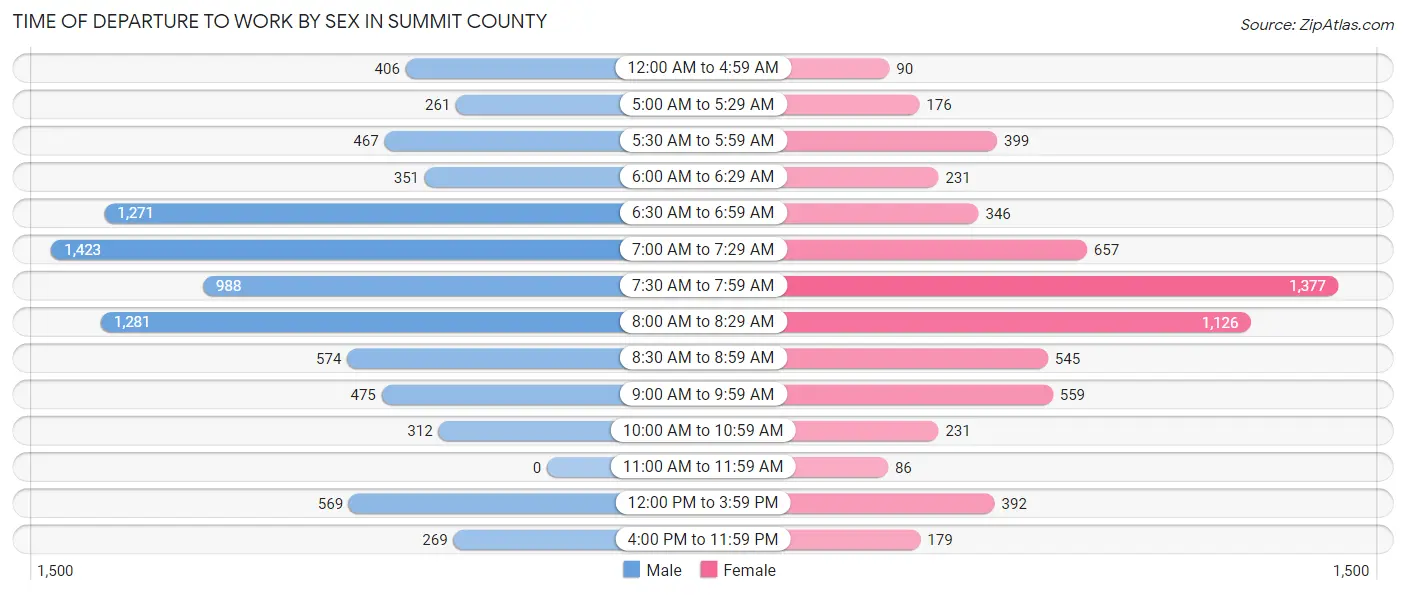
| Time of Departure | Male | Female |
| 12:00 AM to 4:59 AM | 406 (4.7%) | 90 (1.4%) |
| 5:00 AM to 5:29 AM | 261 (3.0%) | 176 (2.8%) |
| 5:30 AM to 5:59 AM | 467 (5.4%) | 399 (6.2%) |
| 6:00 AM to 6:29 AM | 351 (4.1%) | 231 (3.6%) |
| 6:30 AM to 6:59 AM | 1,271 (14.7%) | 346 (5.4%) |
| 7:00 AM to 7:29 AM | 1,423 (16.5%) | 657 (10.3%) |
| 7:30 AM to 7:59 AM | 988 (11.4%) | 1,377 (21.5%) |
| 8:00 AM to 8:29 AM | 1,281 (14.8%) | 1,126 (17.6%) |
| 8:30 AM to 8:59 AM | 574 (6.6%) | 545 (8.5%) |
| 9:00 AM to 9:59 AM | 475 (5.5%) | 559 (8.7%) |
| 10:00 AM to 10:59 AM | 312 (3.6%) | 231 (3.6%) |
| 11:00 AM to 11:59 AM | 0 (0.0%) | 86 (1.3%) |
| 12:00 PM to 3:59 PM | 569 (6.6%) | 392 (6.1%) |
| 4:00 PM to 11:59 PM | 269 (3.1%) | 179 (2.8%) |
| Total | 8,647 (100.0%) | 6,394 (100.0%) |
Housing Occupancy in Summit County
Occupancy by Ownership in Summit County
Of the total 11,750 dwellings in Summit County, owner-occupied units account for 8,200 (69.8%), while renter-occupied units make up 3,550 (30.2%).
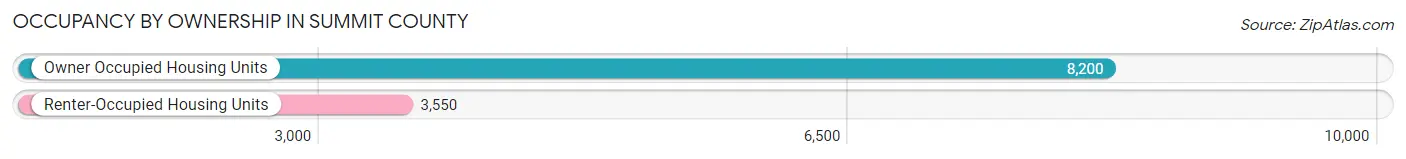
| Occupancy | # Housing Units | % Housing Units |
| Owner Occupied Housing Units | 8,200 | 69.8% |
| Renter-Occupied Housing Units | 3,550 | 30.2% |
| Total Occupied Housing Units | 11,750 | 100.0% |
Occupancy by Household Size in Summit County
| Household Size | # Housing Units | % Housing Units |
| 1-Person Household | 3,346 | 28.5% |
| 2-Person Household | 5,363 | 45.6% |
| 3-Person Household | 1,370 | 11.7% |
| 4+ Person Household | 1,671 | 14.2% |
| Total Housing Units | 11,750 | 100.0% |
Occupancy by Ownership by Household Size in Summit County
| Household Size | Owner-occupied | Renter-occupied |
| 1-Person Household | 2,060 (61.6%) | 1,286 (38.4%) |
| 2-Person Household | 4,095 (76.4%) | 1,268 (23.6%) |
| 3-Person Household | 1,002 (73.1%) | 368 (26.9%) |
| 4+ Person Household | 1,043 (62.4%) | 628 (37.6%) |
| Total Housing Units | 8,200 (69.8%) | 3,550 (30.2%) |
Occupancy by Educational Attainment in Summit County
| Household Size | Owner-occupied | Renter-occupied |
| Less than High School | 179 (44.5%) | 223 (55.5%) |
| High School Diploma | 670 (43.2%) | 879 (56.8%) |
| College/Associate Degree | 1,889 (63.6%) | 1,079 (36.3%) |
| Bachelor's Degree or higher | 5,462 (80.0%) | 1,369 (20.0%) |
Occupancy by Age of Householder in Summit County
| Age Bracket | # Households | % Households |
| Under 35 Years | 2,265 | 19.3% |
| 35 to 44 Years | 2,278 | 19.4% |
| 45 to 54 Years | 2,246 | 19.1% |
| 55 to 64 Years | 2,430 | 20.7% |
| 65 to 74 Years | 1,807 | 15.4% |
| 75 to 84 Years | 633 | 5.4% |
| 85 Years and Over | 91 | 0.8% |
| Total | 11,750 | 100.0% |
Housing Finances in Summit County
Median Income by Occupancy in Summit County
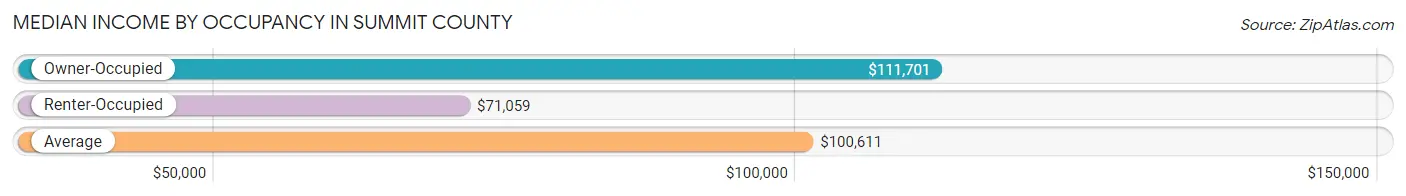
| Occupancy Type | # Households | Median Income |
| Owner-Occupied | 8,200 (69.8%) | $111,701 |
| Renter-Occupied | 3,550 (30.2%) | $71,059 |
| Average | 11,750 (100.0%) | $100,611 |
Occupancy by Householder Income Bracket in Summit County
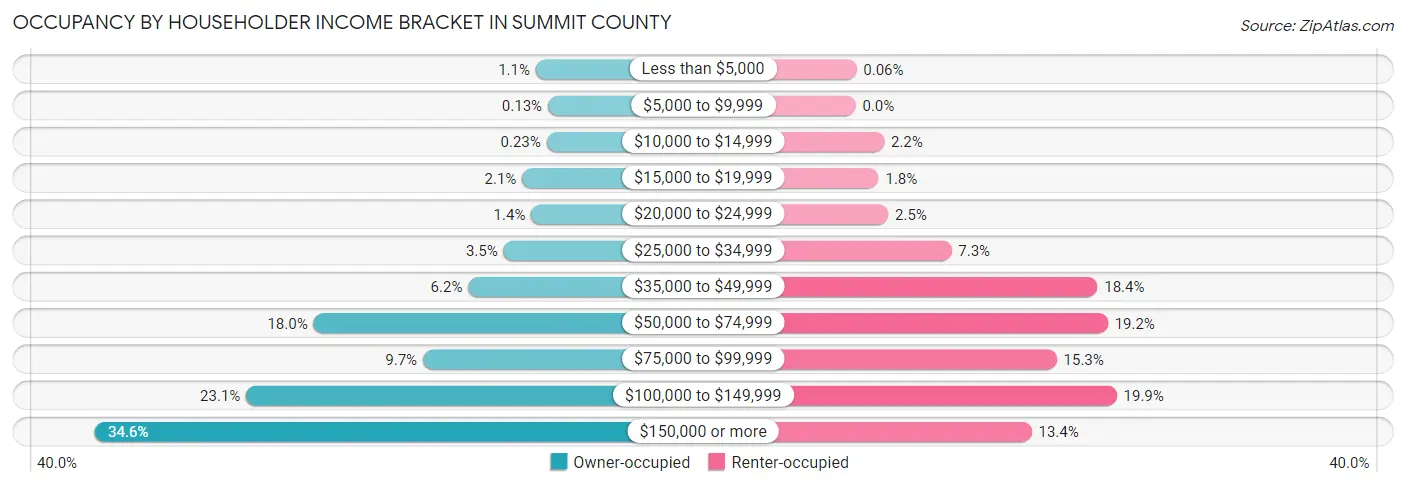
| Income Bracket | Owner-occupied | Renter-occupied |
| Less than $5,000 | 86 (1.1%) | 2 (0.1%) |
| $5,000 to $9,999 | 11 (0.1%) | 0 (0.0%) |
| $10,000 to $14,999 | 19 (0.2%) | 77 (2.2%) |
| $15,000 to $19,999 | 171 (2.1%) | 62 (1.8%) |
| $20,000 to $24,999 | 115 (1.4%) | 88 (2.5%) |
| $25,000 to $34,999 | 288 (3.5%) | 259 (7.3%) |
| $35,000 to $49,999 | 508 (6.2%) | 654 (18.4%) |
| $50,000 to $74,999 | 1,475 (18.0%) | 682 (19.2%) |
| $75,000 to $99,999 | 791 (9.7%) | 544 (15.3%) |
| $100,000 to $149,999 | 1,896 (23.1%) | 706 (19.9%) |
| $150,000 or more | 2,840 (34.6%) | 476 (13.4%) |
| Total | 8,200 (100.0%) | 3,550 (100.0%) |
Monthly Housing Cost Tiers in Summit County
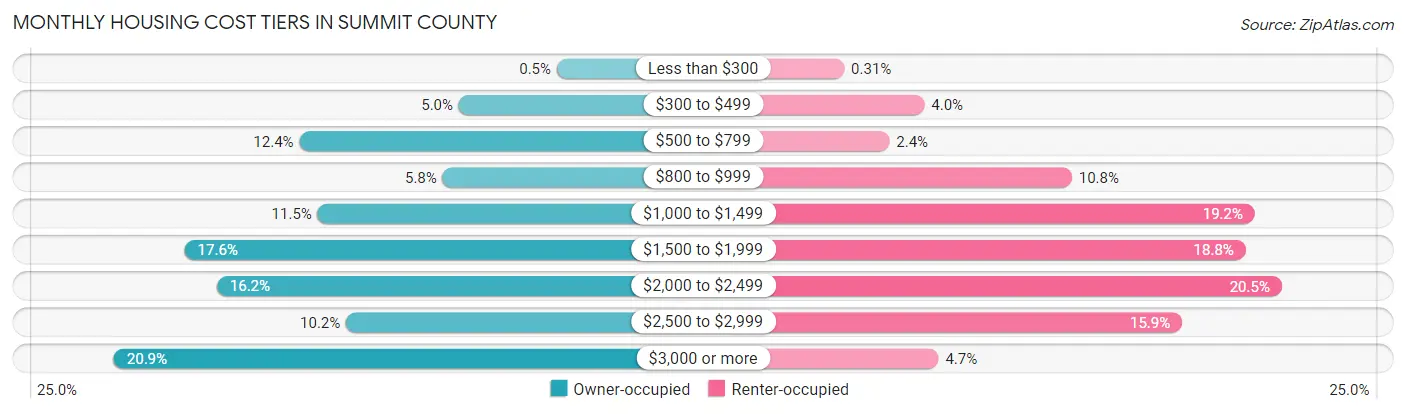
| Monthly Cost | Owner-occupied | Renter-occupied |
| Less than $300 | 41 (0.5%) | 11 (0.3%) |
| $300 to $499 | 411 (5.0%) | 142 (4.0%) |
| $500 to $799 | 1,013 (12.3%) | 85 (2.4%) |
| $800 to $999 | 472 (5.8%) | 383 (10.8%) |
| $1,000 to $1,499 | 944 (11.5%) | 682 (19.2%) |
| $1,500 to $1,999 | 1,446 (17.6%) | 667 (18.8%) |
| $2,000 to $2,499 | 1,324 (16.2%) | 726 (20.4%) |
| $2,500 to $2,999 | 836 (10.2%) | 563 (15.9%) |
| $3,000 or more | 1,713 (20.9%) | 165 (4.6%) |
| Total | 8,200 (100.0%) | 3,550 (100.0%) |
Physical Housing Characteristics in Summit County
Housing Structures in Summit County
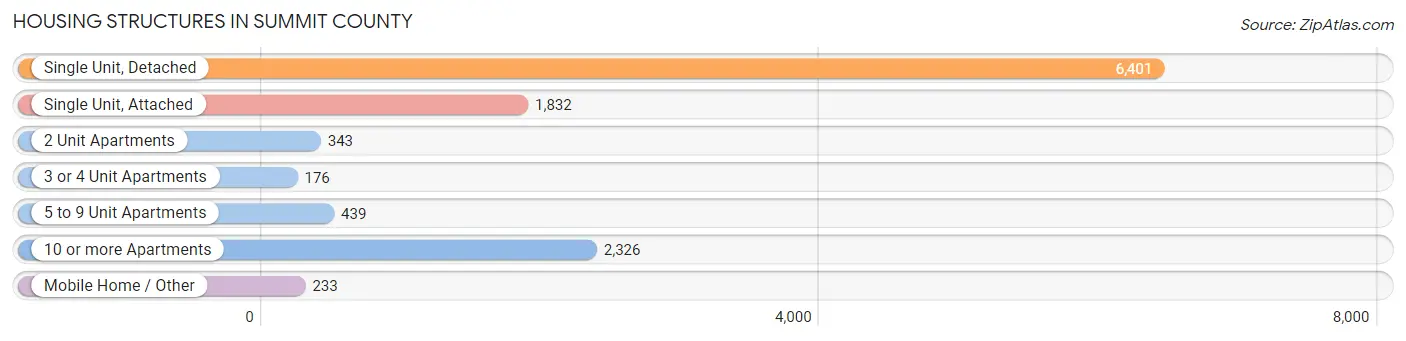
| Structure Type | # Housing Units | % Housing Units |
| Single Unit, Detached | 6,401 | 54.5% |
| Single Unit, Attached | 1,832 | 15.6% |
| 2 Unit Apartments | 343 | 2.9% |
| 3 or 4 Unit Apartments | 176 | 1.5% |
| 5 to 9 Unit Apartments | 439 | 3.7% |
| 10 or more Apartments | 2,326 | 19.8% |
| Mobile Home / Other | 233 | 2.0% |
| Total | 11,750 | 100.0% |
Housing Structures by Occupancy in Summit County
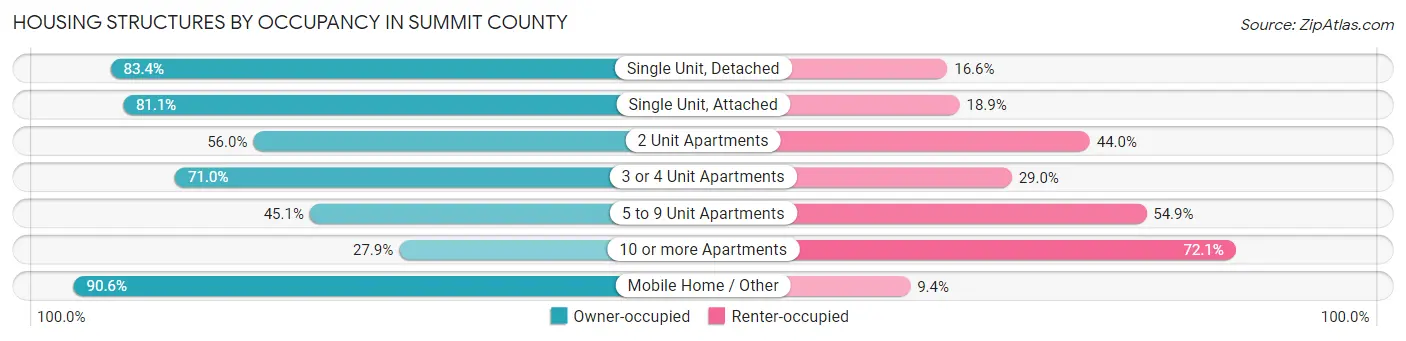
| Structure Type | Owner-occupied | Renter-occupied |
| Single Unit, Detached | 5,340 (83.4%) | 1,061 (16.6%) |
| Single Unit, Attached | 1,485 (81.1%) | 347 (18.9%) |
| 2 Unit Apartments | 192 (56.0%) | 151 (44.0%) |
| 3 or 4 Unit Apartments | 125 (71.0%) | 51 (29.0%) |
| 5 to 9 Unit Apartments | 198 (45.1%) | 241 (54.9%) |
| 10 or more Apartments | 649 (27.9%) | 1,677 (72.1%) |
| Mobile Home / Other | 211 (90.6%) | 22 (9.4%) |
| Total | 8,200 (69.8%) | 3,550 (30.2%) |
Housing Structures by Number of Rooms in Summit County
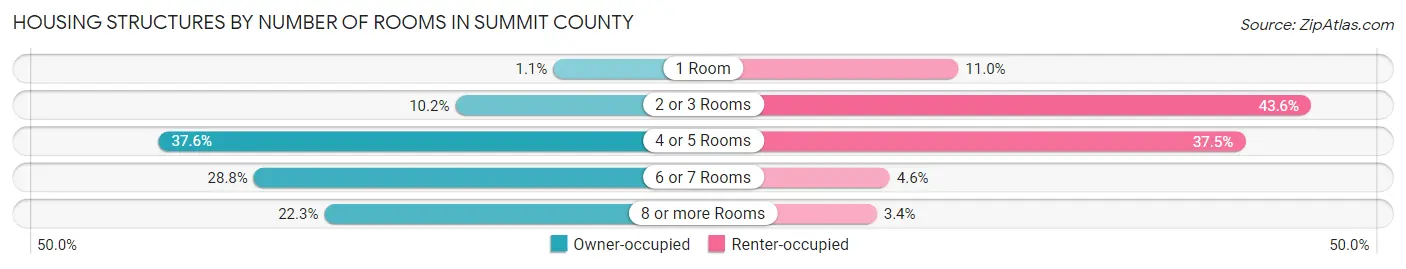
| Number of Rooms | Owner-occupied | Renter-occupied |
| 1 Room | 92 (1.1%) | 389 (11.0%) |
| 2 or 3 Rooms | 834 (10.2%) | 1,546 (43.5%) |
| 4 or 5 Rooms | 3,083 (37.6%) | 1,330 (37.5%) |
| 6 or 7 Rooms | 2,363 (28.8%) | 164 (4.6%) |
| 8 or more Rooms | 1,828 (22.3%) | 121 (3.4%) |
| Total | 8,200 (100.0%) | 3,550 (100.0%) |
Housing Structure by Heating Type in Summit County
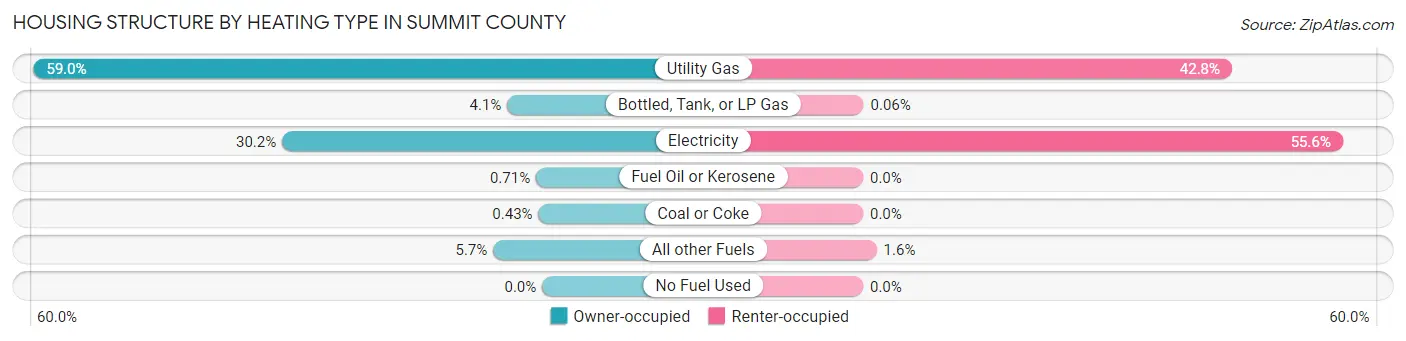
| Heating Type | Owner-occupied | Renter-occupied |
| Utility Gas | 4,837 (59.0%) | 1,518 (42.8%) |
| Bottled, Tank, or LP Gas | 332 (4.1%) | 2 (0.1%) |
| Electricity | 2,472 (30.1%) | 1,974 (55.6%) |
| Fuel Oil or Kerosene | 58 (0.7%) | 0 (0.0%) |
| Coal or Coke | 35 (0.4%) | 0 (0.0%) |
| All other Fuels | 466 (5.7%) | 56 (1.6%) |
| No Fuel Used | 0 (0.0%) | 0 (0.0%) |
| Total | 8,200 (100.0%) | 3,550 (100.0%) |
Household Vehicle Usage in Summit County
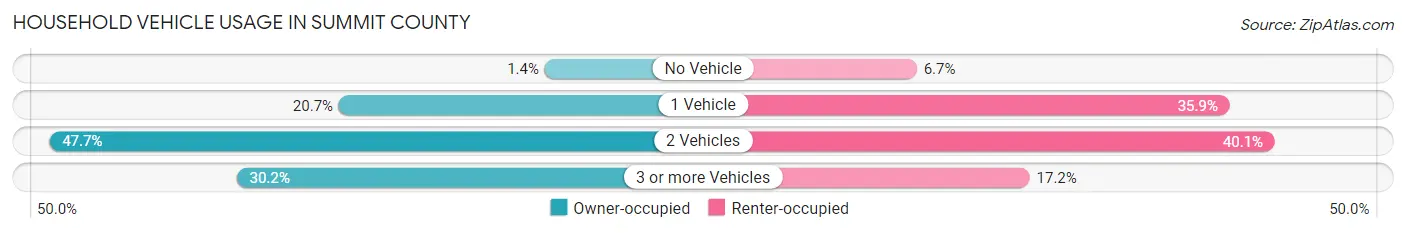
| Vehicles per Household | Owner-occupied | Renter-occupied |
| No Vehicle | 118 (1.4%) | 238 (6.7%) |
| 1 Vehicle | 1,694 (20.7%) | 1,275 (35.9%) |
| 2 Vehicles | 3,911 (47.7%) | 1,425 (40.1%) |
| 3 or more Vehicles | 2,477 (30.2%) | 612 (17.2%) |
| Total | 8,200 (100.0%) | 3,550 (100.0%) |
Real Estate & Mortgages in Summit County
Real Estate and Mortgage Overview in Summit County
| Characteristic | Without Mortgage | With Mortgage |
| Housing Units | 2,297 | 5,903 |
| Median Property Value | $850,100 | $736,100 |
| Median Household Income | $90,936 | $2,307 |
| Monthly Housing Costs | $701 | $1,554 |
| Real Estate Taxes | $2,559 | $115 |
Property Value by Mortgage Status in Summit County
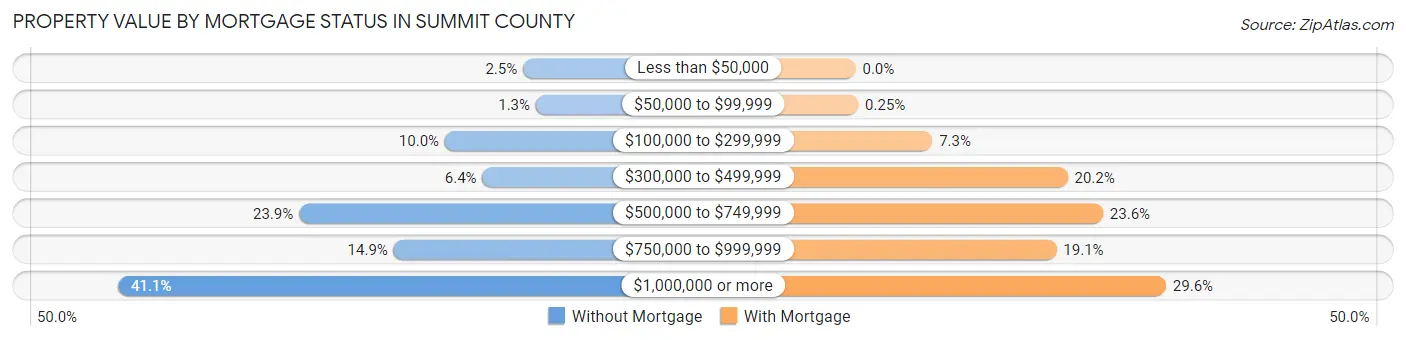
| Property Value | Without Mortgage | With Mortgage |
| Less than $50,000 | 58 (2.5%) | 0 (0.0%) |
| $50,000 to $99,999 | 30 (1.3%) | 15 (0.3%) |
| $100,000 to $299,999 | 229 (10.0%) | 431 (7.3%) |
| $300,000 to $499,999 | 147 (6.4%) | 1,192 (20.2%) |
| $500,000 to $749,999 | 548 (23.9%) | 1,391 (23.6%) |
| $750,000 to $999,999 | 341 (14.8%) | 1,129 (19.1%) |
| $1,000,000 or more | 944 (41.1%) | 1,745 (29.6%) |
| Total | 2,297 (100.0%) | 5,903 (100.0%) |
Household Income by Mortgage Status in Summit County
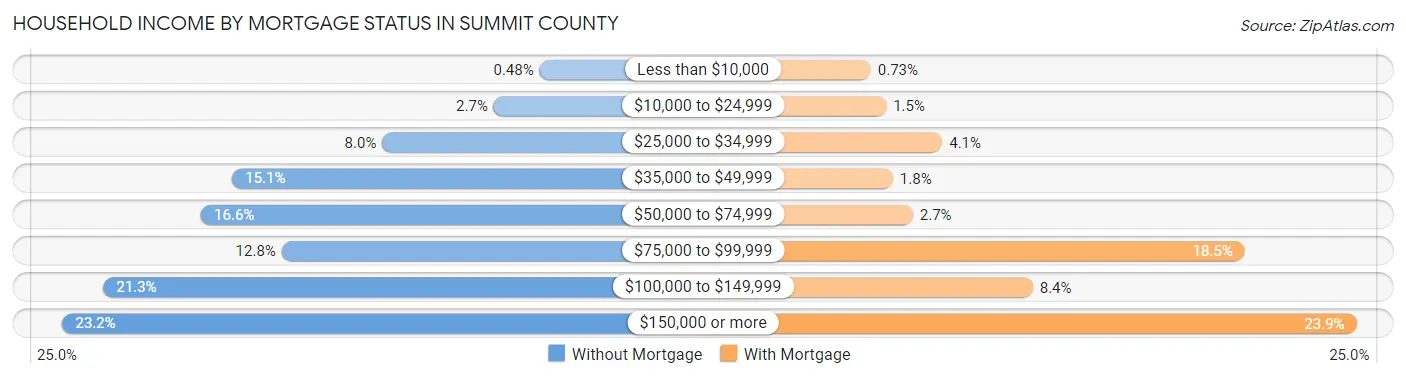
| Household Income | Without Mortgage | With Mortgage |
| Less than $10,000 | 11 (0.5%) | 43 (0.7%) |
| $10,000 to $24,999 | 61 (2.7%) | 86 (1.5%) |
| $25,000 to $34,999 | 183 (8.0%) | 244 (4.1%) |
| $35,000 to $49,999 | 347 (15.1%) | 105 (1.8%) |
| $50,000 to $74,999 | 381 (16.6%) | 161 (2.7%) |
| $75,000 to $99,999 | 293 (12.8%) | 1,094 (18.5%) |
| $100,000 to $149,999 | 488 (21.2%) | 498 (8.4%) |
| $150,000 or more | 533 (23.2%) | 1,408 (23.8%) |
| Total | 2,297 (100.0%) | 5,903 (100.0%) |
Property Value to Household Income Ratio in Summit County
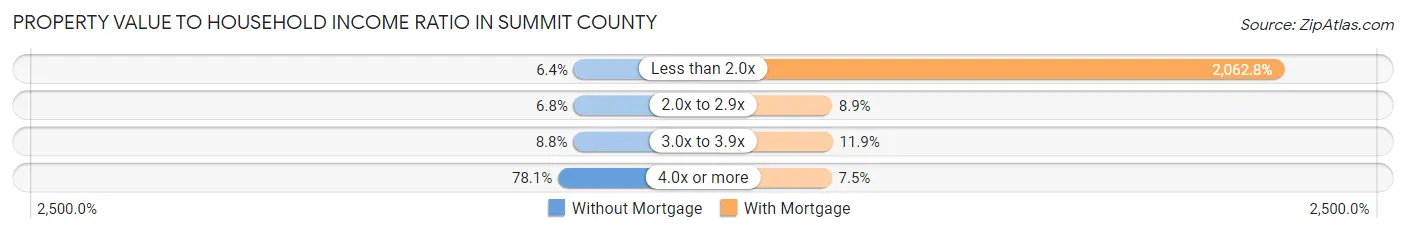
| Value-to-Income Ratio | Without Mortgage | With Mortgage |
| Less than 2.0x | 146 (6.4%) | 121,766 (2,062.8%) |
| 2.0x to 2.9x | 156 (6.8%) | 526 (8.9%) |
| 3.0x to 3.9x | 201 (8.7%) | 705 (11.9%) |
| 4.0x or more | 1,794 (78.1%) | 445 (7.5%) |
| Total | 2,297 (100.0%) | 5,903 (100.0%) |
Real Estate Taxes by Mortgage Status in Summit County
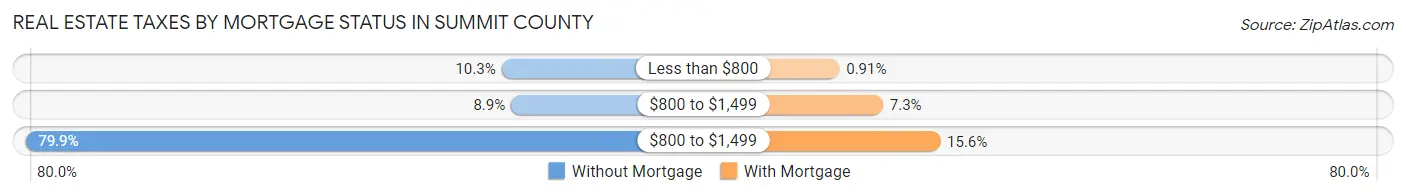
| Property Taxes | Without Mortgage | With Mortgage |
| Less than $800 | 237 (10.3%) | 54 (0.9%) |
| $800 to $1,499 | 205 (8.9%) | 430 (7.3%) |
| $800 to $1,499 | 1,835 (79.9%) | 923 (15.6%) |
| Total | 2,297 (100.0%) | 5,903 (100.0%) |
Health & Disability in Summit County
Health Insurance Coverage by Age in Summit County
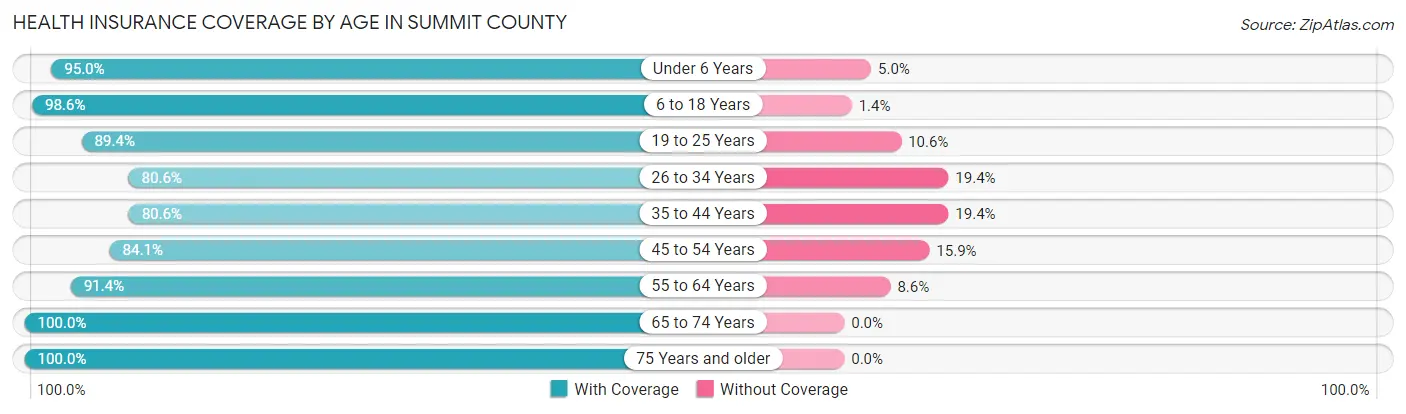
| Age Bracket | With Coverage | Without Coverage |
| Under 6 Years | 1,274 (95.0%) | 67 (5.0%) |
| 6 to 18 Years | 3,817 (98.6%) | 54 (1.4%) |
| 19 to 25 Years | 2,073 (89.4%) | 246 (10.6%) |
| 26 to 34 Years | 4,325 (80.6%) | 1,042 (19.4%) |
| 35 to 44 Years | 4,009 (80.6%) | 966 (19.4%) |
| 45 to 54 Years | 3,584 (84.1%) | 676 (15.9%) |
| 55 to 64 Years | 3,809 (91.4%) | 359 (8.6%) |
| 65 to 74 Years | 3,402 (100.0%) | 0 (0.0%) |
| 75 Years and older | 1,202 (100.0%) | 0 (0.0%) |
| Total | 27,495 (89.0%) | 3,410 (11.0%) |
Health Insurance Coverage by Citizenship Status in Summit County
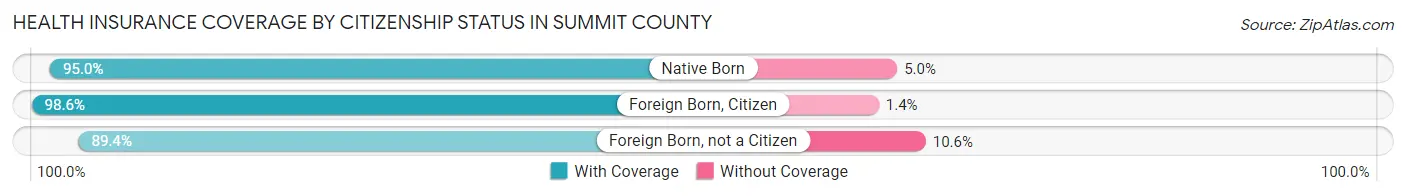
| Citizenship Status | With Coverage | Without Coverage |
| Native Born | 1,274 (95.0%) | 67 (5.0%) |
| Foreign Born, Citizen | 3,817 (98.6%) | 54 (1.4%) |
| Foreign Born, not a Citizen | 2,073 (89.4%) | 246 (10.6%) |
Health Insurance Coverage by Household Income in Summit County
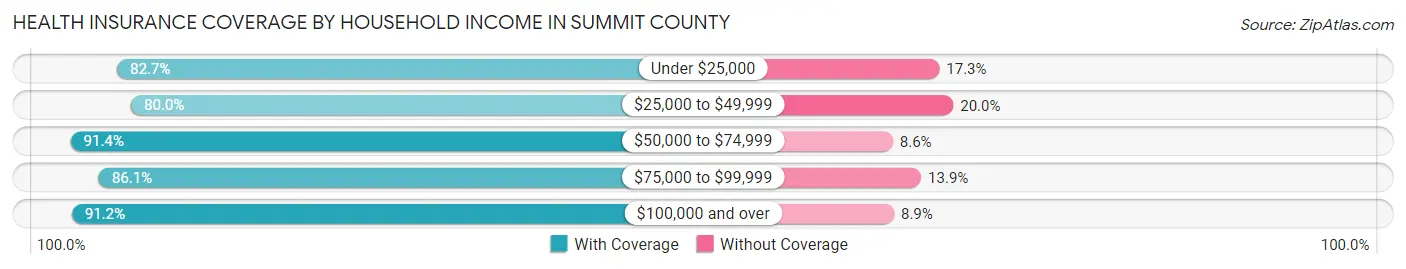
| Household Income | With Coverage | Without Coverage |
| Under $25,000 | 882 (82.7%) | 185 (17.3%) |
| $25,000 to $49,999 | 2,682 (80.0%) | 669 (20.0%) |
| $50,000 to $74,999 | 4,174 (91.4%) | 394 (8.6%) |
| $75,000 to $99,999 | 3,034 (86.1%) | 491 (13.9%) |
| $100,000 and over | 16,350 (91.1%) | 1,587 (8.8%) |
Public vs Private Health Insurance Coverage by Age in Summit County
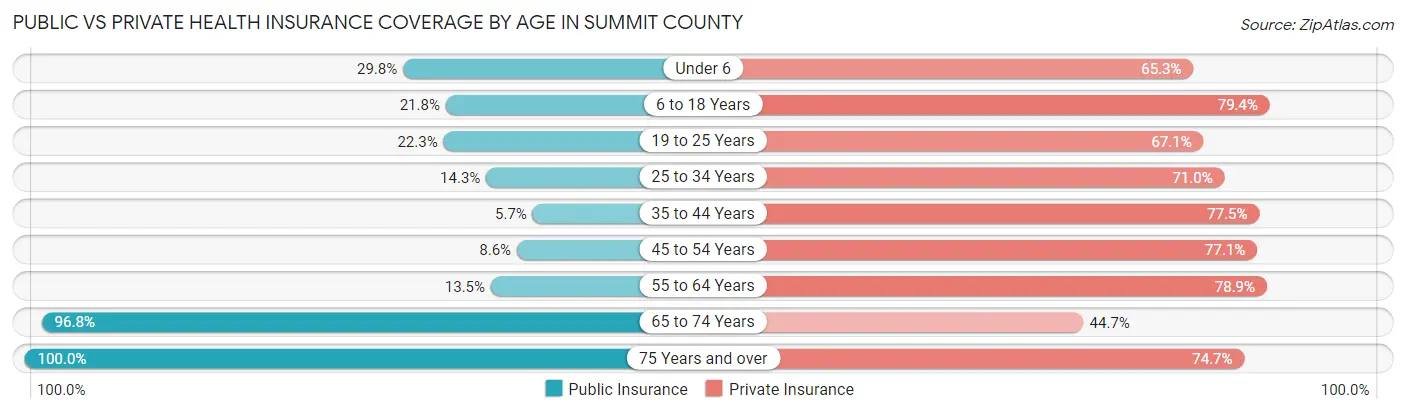
| Age Bracket | Public Insurance | Private Insurance |
| Under 6 | 399 (29.7%) | 875 (65.2%) |
| 6 to 18 Years | 845 (21.8%) | 3,075 (79.4%) |
| 19 to 25 Years | 516 (22.3%) | 1,557 (67.1%) |
| 25 to 34 Years | 769 (14.3%) | 3,812 (71.0%) |
| 35 to 44 Years | 283 (5.7%) | 3,855 (77.5%) |
| 45 to 54 Years | 367 (8.6%) | 3,284 (77.1%) |
| 55 to 64 Years | 561 (13.5%) | 3,288 (78.9%) |
| 65 to 74 Years | 3,294 (96.8%) | 1,521 (44.7%) |
| 75 Years and over | 1,202 (100.0%) | 898 (74.7%) |
| Total | 8,236 (26.7%) | 22,165 (71.7%) |
Disability Status by Sex by Age in Summit County
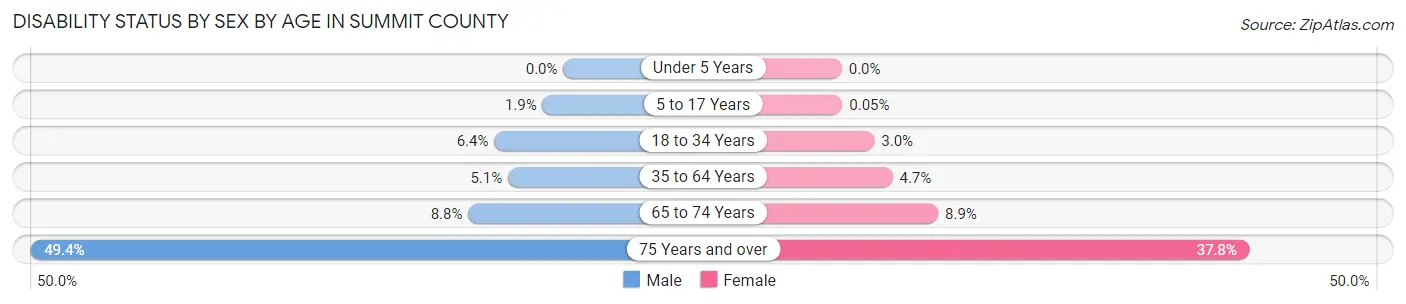
| Age Bracket | Male | Female |
| Under 5 Years | 0 (0.0%) | 0 (0.0%) |
| 5 to 17 Years | 37 (1.9%) | 1 (0.1%) |
| 18 to 34 Years | 293 (6.4%) | 101 (3.0%) |
| 35 to 64 Years | 379 (5.1%) | 283 (4.7%) |
| 65 to 74 Years | 163 (8.8%) | 139 (8.9%) |
| 75 Years and over | 319 (49.4%) | 210 (37.8%) |
Disability Class by Sex by Age in Summit County
Disability Class: Hearing Difficulty
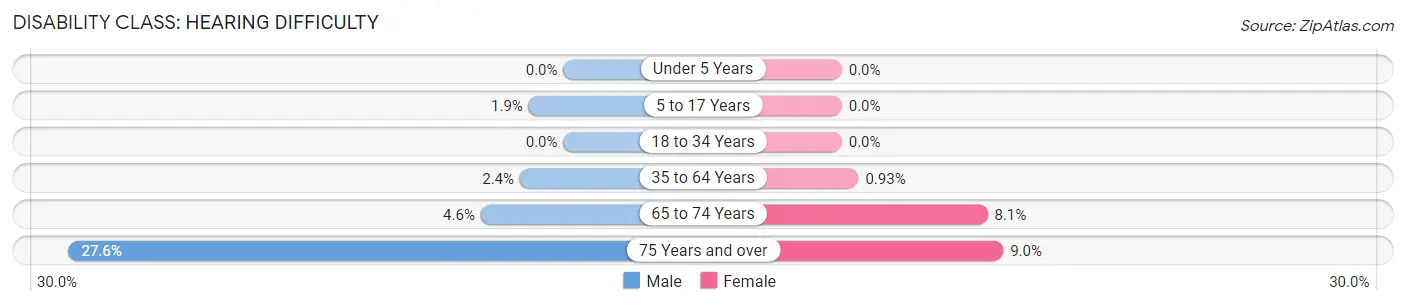
| Age Bracket | Male | Female |
| Under 5 Years | 0 (0.0%) | 0 (0.0%) |
| 5 to 17 Years | 37 (1.9%) | 0 (0.0%) |
| 18 to 34 Years | 0 (0.0%) | 0 (0.0%) |
| 35 to 64 Years | 179 (2.4%) | 56 (0.9%) |
| 65 to 74 Years | 85 (4.6%) | 126 (8.1%) |
| 75 Years and over | 178 (27.6%) | 50 (9.0%) |
Disability Class: Vision Difficulty
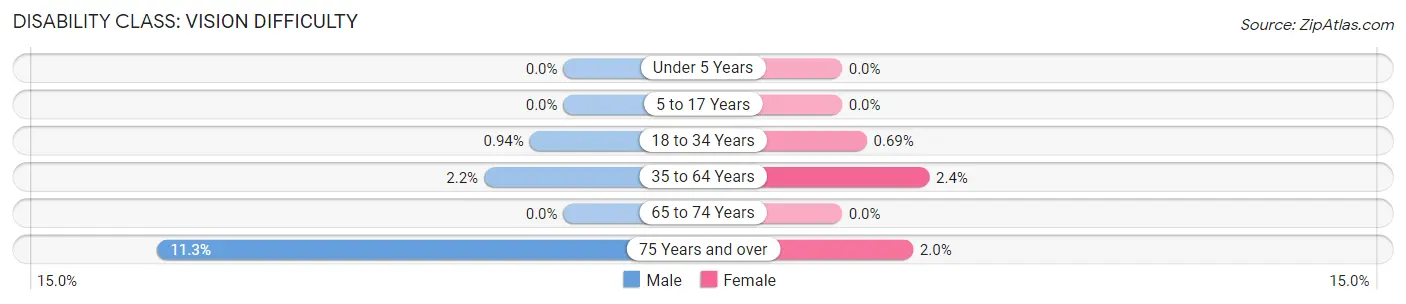
| Age Bracket | Male | Female |
| Under 5 Years | 0 (0.0%) | 0 (0.0%) |
| 5 to 17 Years | 0 (0.0%) | 0 (0.0%) |
| 18 to 34 Years | 43 (0.9%) | 23 (0.7%) |
| 35 to 64 Years | 163 (2.2%) | 146 (2.4%) |
| 65 to 74 Years | 0 (0.0%) | 0 (0.0%) |
| 75 Years and over | 73 (11.3%) | 11 (2.0%) |
Disability Class: Cognitive Difficulty
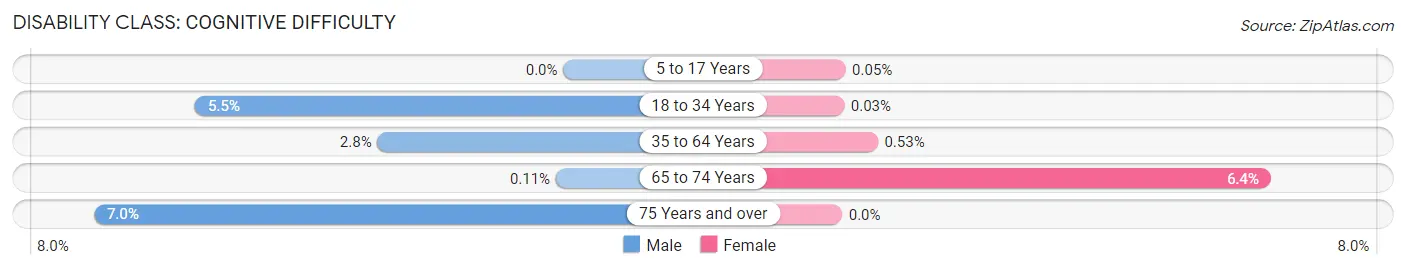
| Age Bracket | Male | Female |
| 5 to 17 Years | 0 (0.0%) | 1 (0.1%) |
| 18 to 34 Years | 250 (5.5%) | 1 (0.0%) |
| 35 to 64 Years | 204 (2.8%) | 32 (0.5%) |
| 65 to 74 Years | 2 (0.1%) | 99 (6.4%) |
| 75 Years and over | 45 (7.0%) | 0 (0.0%) |
Disability Class: Ambulatory Difficulty
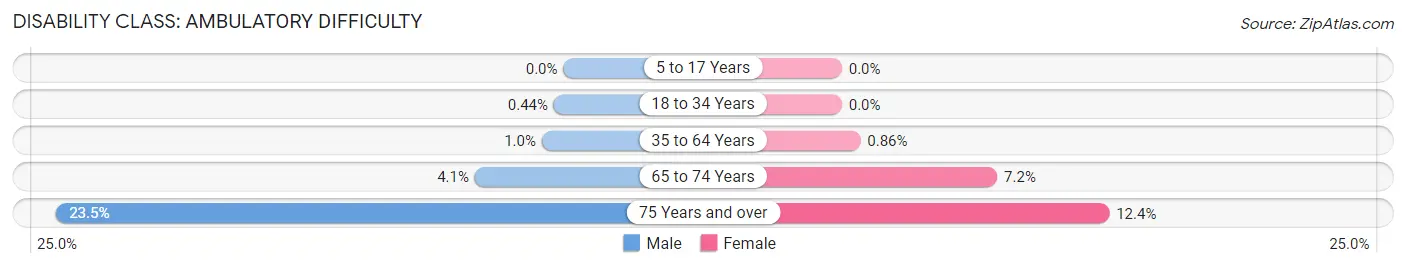
| Age Bracket | Male | Female |
| 5 to 17 Years | 0 (0.0%) | 0 (0.0%) |
| 18 to 34 Years | 20 (0.4%) | 0 (0.0%) |
| 35 to 64 Years | 74 (1.0%) | 52 (0.9%) |
| 65 to 74 Years | 76 (4.1%) | 112 (7.2%) |
| 75 Years and over | 152 (23.5%) | 69 (12.4%) |
Disability Class: Self-Care Difficulty
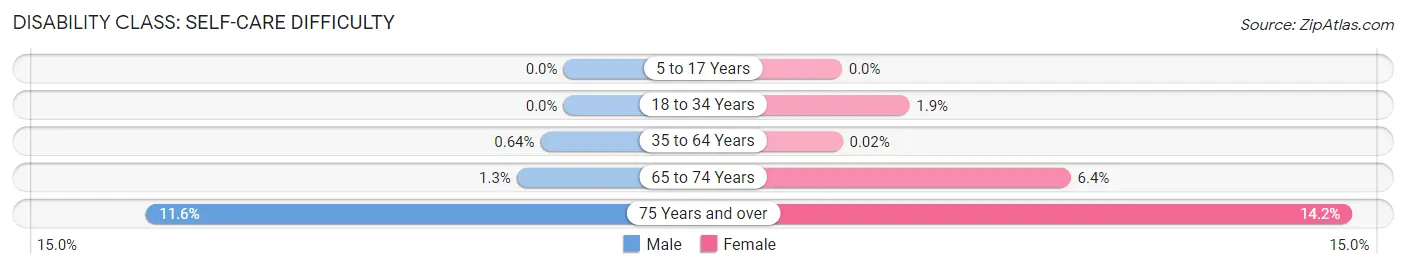
| Age Bracket | Male | Female |
| 5 to 17 Years | 0 (0.0%) | 0 (0.0%) |
| 18 to 34 Years | 0 (0.0%) | 63 (1.9%) |
| 35 to 64 Years | 47 (0.6%) | 1 (0.0%) |
| 65 to 74 Years | 24 (1.3%) | 99 (6.4%) |
| 75 Years and over | 75 (11.6%) | 79 (14.2%) |
Technology Access in Summit County
Computing Device Access in Summit County
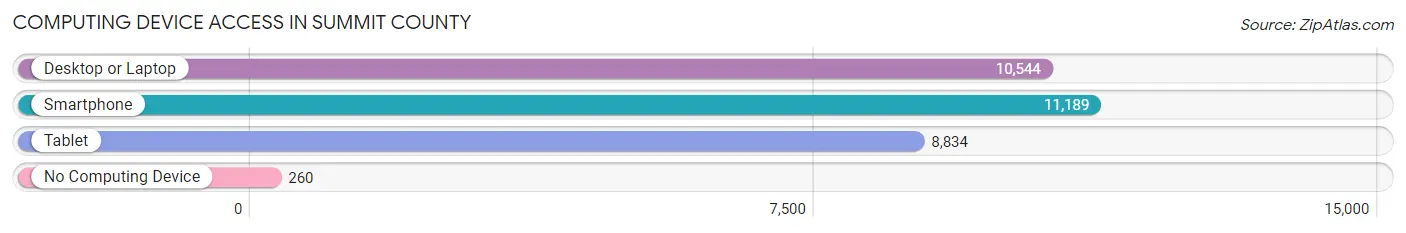
| Device Type | # Households | % Households |
| Desktop or Laptop | 10,544 | 89.7% |
| Smartphone | 11,189 | 95.2% |
| Tablet | 8,834 | 75.2% |
| No Computing Device | 260 | 2.2% |
| Total | 11,750 | 100.0% |
Internet Access in Summit County
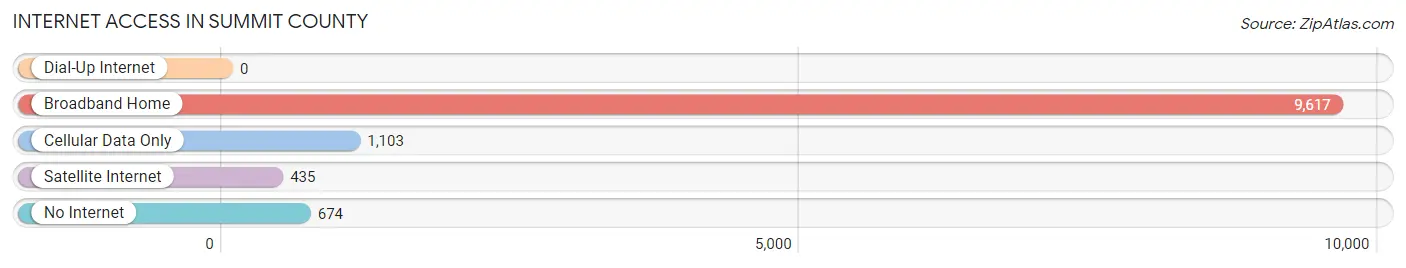
| Internet Type | # Households | % Households |
| Dial-Up Internet | 0 | 0.0% |
| Broadband Home | 9,617 | 81.9% |
| Cellular Data Only | 1,103 | 9.4% |
| Satellite Internet | 435 | 3.7% |
| No Internet | 674 | 5.7% |
| Total | 11,750 | 100.0% |
Summit County Summary
Summit County, Colorado is located in the central Rocky Mountains of the United States. It is part of the Front Range Urban Corridor and is the fifth most populous county in the state. The county seat is Breckenridge, and the county is home to four major ski resorts, including Breckenridge, Copper Mountain, Keystone, and Arapahoe Basin.
Geography
Summit County is located in the central Rocky Mountains of Colorado, and is bordered by Clear Creek County to the west, Grand County to the north, Park County to the east, and Lake County to the south. The county covers an area of 1,841 square miles, and is the fifth most populous county in the state. The county is divided into two distinct regions: the northern part of the county is dominated by the Gore Range, while the southern part is dominated by the Tenmile Range. The highest point in the county is Grays Peak, which stands at 14,278 feet.
The county is home to four major ski resorts, including Breckenridge, Copper Mountain, Keystone, and Arapahoe Basin. The county is also home to several other ski areas, including Loveland Ski Area, Ski Cooper, and Echo Mountain.
History
The area that is now Summit County was first inhabited by the Ute people, who lived in the area for thousands of years before the arrival of European settlers. The first Europeans to settle in the area were miners, who arrived in the late 19th century in search of gold and silver. The area was officially established as Summit County in 1861, and the county seat was established in Breckenridge.
The county experienced a population boom in the late 19th and early 20th centuries, as miners flocked to the area in search of gold and silver. The population of the county peaked in the 1930s, when it reached nearly 10,000 people.
The county experienced a decline in population in the mid-20th century, as the mining industry declined and people moved away from the area. However, the county experienced a resurgence in the late 20th century, as the ski industry began to take off. The population of the county has grown steadily since the 1980s, and as of 2019, the population was estimated to be 41,000.
Economy
The economy of Summit County is largely based on tourism, as the county is home to four major ski resorts. The ski industry is the largest employer in the county, and the resorts employ thousands of people each year. The county is also home to several other ski areas, including Loveland Ski Area, Ski Cooper, and Echo Mountain.
In addition to the ski industry, the county is also home to several other industries, including retail, construction, and manufacturing. The county is also home to several breweries, distilleries, and wineries, as well as several restaurants and bars.
Demographics
As of 2019, the population of Summit County was estimated to be 41,000. The population is largely white (90.3%), with smaller percentages of Hispanic (4.2%), African American (2.2%), and Asian (1.3%) residents. The median household income in the county is $77,000, and the median home value is $521,000.
The county is home to several colleges and universities, including Colorado Mountain College, Colorado State University, and the University of Colorado. The county is also home to several public and private schools, including Summit High School, Summit Middle School, and Breckenridge Elementary School.
Common Questions
What is the Total Population of Summit County?
Total Population of Summit County is 30,955.
What is the Total Male Population of Summit County?
Total Male Population of Summit County is 17,012.
What is the Total Female Population of Summit County?
Total Female Population of Summit County is 13,943.
What is the Ratio of Males per 100 Females in Summit County?
There are 122.01 Males per 100 Females in Summit County.
What is the Ratio of Females per 100 Males in Summit County?
There are 81.96 Females per 100 Males in Summit County.
What is the Median Population Age in Summit County?
Median Population Age in Summit County is 39.0 Years.
What is the Average Family Size in Summit County
Average Family Size in Summit County is 2.9 People.
What is the Average Household Size in Summit County
Average Household Size in Summit County is 2.6 People.
What is Per Capita Income in Summit County?
Per Capita income in Summit County is $54,935.
What is the Median Family Income in Summit County?
Median Family Income in Summit County is $120,716.
What is the Median Household income in Summit County?
Median Household Income in Summit County is $100,611.
What is Income or Wage Gap in Summit County?
Income or Wage Gap in Summit County is 13.4%.
Women in Summit County earn 86.6 cents for every dollar earned by a man.
What is Inequality or Gini Index in Summit County?
Inequality or Gini Index in Summit County is 0.43.
How Large is the Labor Force in Summit County?
There are 20,164 People in the Labor Forcein in Summit County.
What is the Percentage of People in the Labor Force in Summit County?
75.9% of People are in the Labor Force in Summit County.
What is the Unemployment Rate in Summit County?
Unemployment Rate in Summit County is 3.7%.