Routt County, CO
Routt County Map
Routt County Overview
24,944
TOTAL POPULATION
13,144
MALE POPULATION
11,800
FEMALE POPULATION
111.39
MALES / 100 FEMALES
89.77
FEMALES / 100 MALES
41.9
MEDIAN AGE
2.8
AVG FAMILY SIZE
2.4
AVG HOUSEHOLD SIZE
$58,304
PER CAPITA INCOME
$116,203
AVG FAMILY INCOME
$95,144
AVG HOUSEHOLD INCOME
29.1%
WAGE / INCOME GAP [ % ]
70.9¢/ $1
WAGE / INCOME GAP [ $ ]
0.47
INEQUALITY / GINI INDEX
14,265
LABOR FORCE [ PEOPLE ]
67.7%
PERCENT IN LABOR FORCE
2.9%
UNEMPLOYMENT RATE
Routt County Area Codes
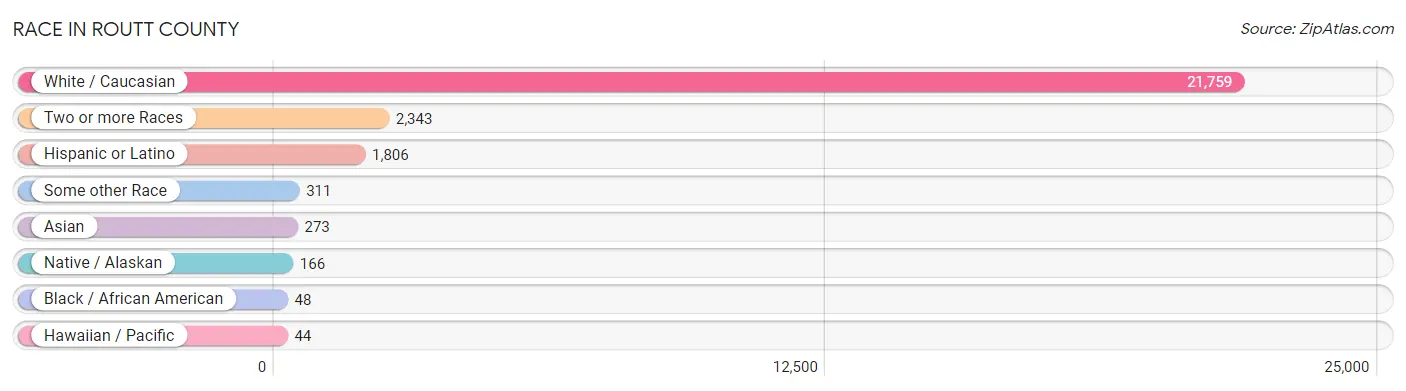
Race in Routt County
The most populous races in Routt County are White / Caucasian (21,759 | 87.2%), Two or more Races (2,343 | 9.4%), and Hispanic or Latino (1,806 | 7.2%).
| Race | # Population | % Population |
| Asian | 273 | 1.1% |
| Black / African American | 48 | 0.2% |
| Hawaiian / Pacific | 44 | 0.2% |
| Hispanic or Latino | 1,806 | 7.2% |
| Native / Alaskan | 166 | 0.7% |
| White / Caucasian | 21,759 | 87.2% |
| Two or more Races | 2,343 | 9.4% |
| Some other Race | 311 | 1.3% |
| Total | 24,944 | 100.0% |
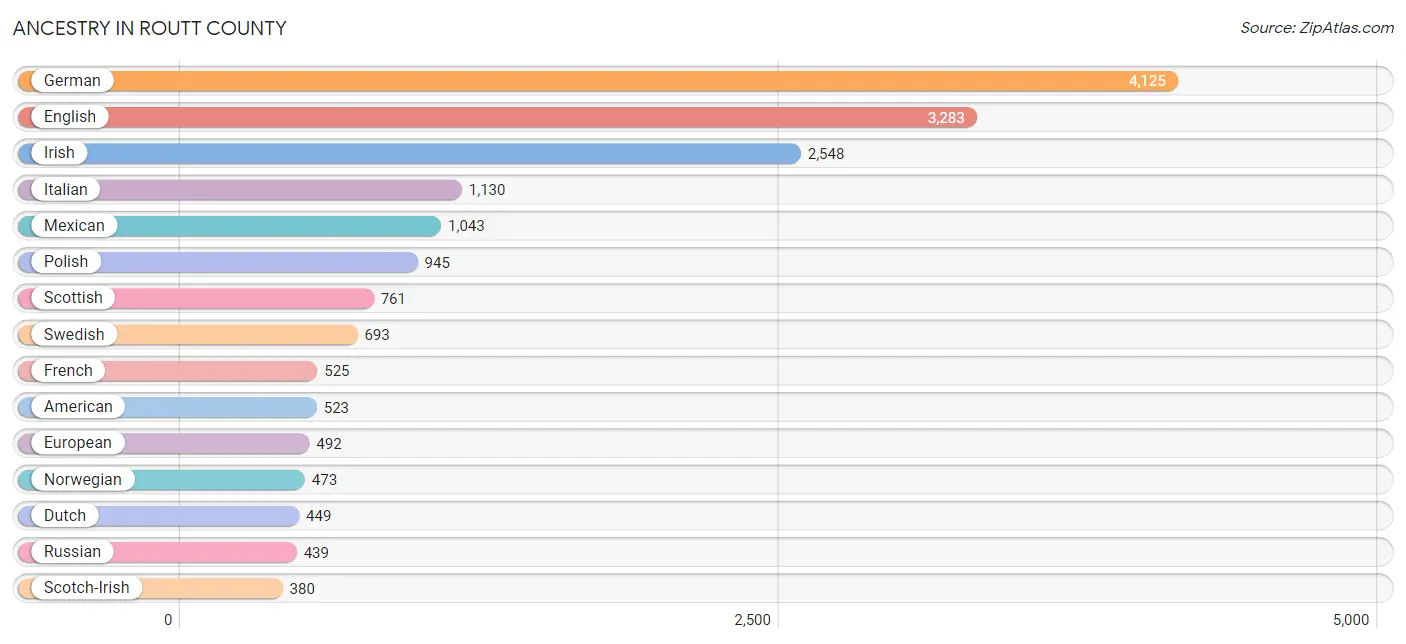
Ancestry in Routt County
The most populous ancestries reported in Routt County are German (4,125 | 16.5%), English (3,283 | 13.2%), Irish (2,548 | 10.2%), Italian (1,130 | 4.5%), and Mexican (1,043 | 4.2%), together accounting for 48.6% of all Routt County residents.
| Ancestry | # Population | % Population |
| African | 17 | 0.1% |
| Albanian | 13 | 0.1% |
| American | 523 | 2.1% |
| Apache | 60 | 0.2% |
| Arab | 43 | 0.2% |
| Argentinean | 16 | 0.1% |
| Armenian | 27 | 0.1% |
| Australian | 4 | 0.0% |
| Austrian | 85 | 0.3% |
| Belgian | 4 | 0.0% |
| Bhutanese | 31 | 0.1% |
| Blackfeet | 14 | 0.1% |
| Bolivian | 23 | 0.1% |
| British | 124 | 0.5% |
| Burmese | 29 | 0.1% |
| Cajun | 20 | 0.1% |
| Canadian | 63 | 0.3% |
| Central American | 113 | 0.4% |
| Cherokee | 64 | 0.3% |
| Chippewa | 5 | 0.0% |
| Choctaw | 49 | 0.2% |
| Croatian | 64 | 0.3% |
| Cuban | 61 | 0.2% |
| Czech | 101 | 0.4% |
| Czechoslovakian | 15 | 0.1% |
| Danish | 274 | 1.1% |
| Dominican | 8 | 0.0% |
| Dutch | 449 | 1.8% |
| Eastern European | 90 | 0.4% |
| Egyptian | 3 | 0.0% |
| English | 3,283 | 13.2% |
| Estonian | 8 | 0.0% |
| Ethiopian | 19 | 0.1% |
| European | 492 | 2.0% |
| Finnish | 70 | 0.3% |
| French | 525 | 2.1% |
| French Canadian | 40 | 0.2% |
| German | 4,125 | 16.5% |
| Greek | 80 | 0.3% |
| Guamanian / Chamorro | 1 | 0.0% |
| Honduran | 101 | 0.4% |
| Hungarian | 191 | 0.8% |
| Indian (Asian) | 116 | 0.5% |
| Indonesian | 6 | 0.0% |
| Iranian | 4 | 0.0% |
| Irish | 2,548 | 10.2% |
| Israeli | 18 | 0.1% |
| Italian | 1,130 | 4.5% |
| Korean | 115 | 0.5% |
| Laotian | 7 | 0.0% |
| Latvian | 22 | 0.1% |
| Lebanese | 25 | 0.1% |
| Lithuanian | 16 | 0.1% |
| Luxembourger | 12 | 0.1% |
| Mexican | 1,043 | 4.2% |
| Mexican American Indian | 43 | 0.2% |
| Native Hawaiian | 126 | 0.5% |
| New Zealander | 13 | 0.1% |
| Nigerian | 1 | 0.0% |
| Northern European | 41 | 0.2% |
| Norwegian | 473 | 1.9% |
| Pakistani | 5 | 0.0% |
| Peruvian | 9 | 0.0% |
| Polish | 945 | 3.8% |
| Portuguese | 91 | 0.4% |
| Potawatomi | 104 | 0.4% |
| Pueblo | 22 | 0.1% |
| Puerto Rican | 298 | 1.2% |
| Romanian | 11 | 0.0% |
| Russian | 439 | 1.8% |
| Salvadoran | 12 | 0.1% |
| Scandinavian | 169 | 0.7% |
| Scotch-Irish | 380 | 1.5% |
| Scottish | 761 | 3.0% |
| Serbian | 10 | 0.0% |
| Sioux | 35 | 0.1% |
| Slavic | 15 | 0.1% |
| Slovak | 41 | 0.2% |
| Slovene | 35 | 0.1% |
| South American | 60 | 0.2% |
| Spaniard | 133 | 0.5% |
| Spanish | 56 | 0.2% |
| Sri Lankan | 62 | 0.3% |
| Subsaharan African | 37 | 0.2% |
| Swedish | 693 | 2.8% |
| Swiss | 43 | 0.2% |
| Syrian | 23 | 0.1% |
| Thai | 17 | 0.1% |
| Ukrainian | 58 | 0.2% |
| Ute | 20 | 0.1% |
| Venezuelan | 12 | 0.1% |
| Welsh | 218 | 0.9% |
| Yugoslavian | 16 | 0.1% | View All 93 Rows |
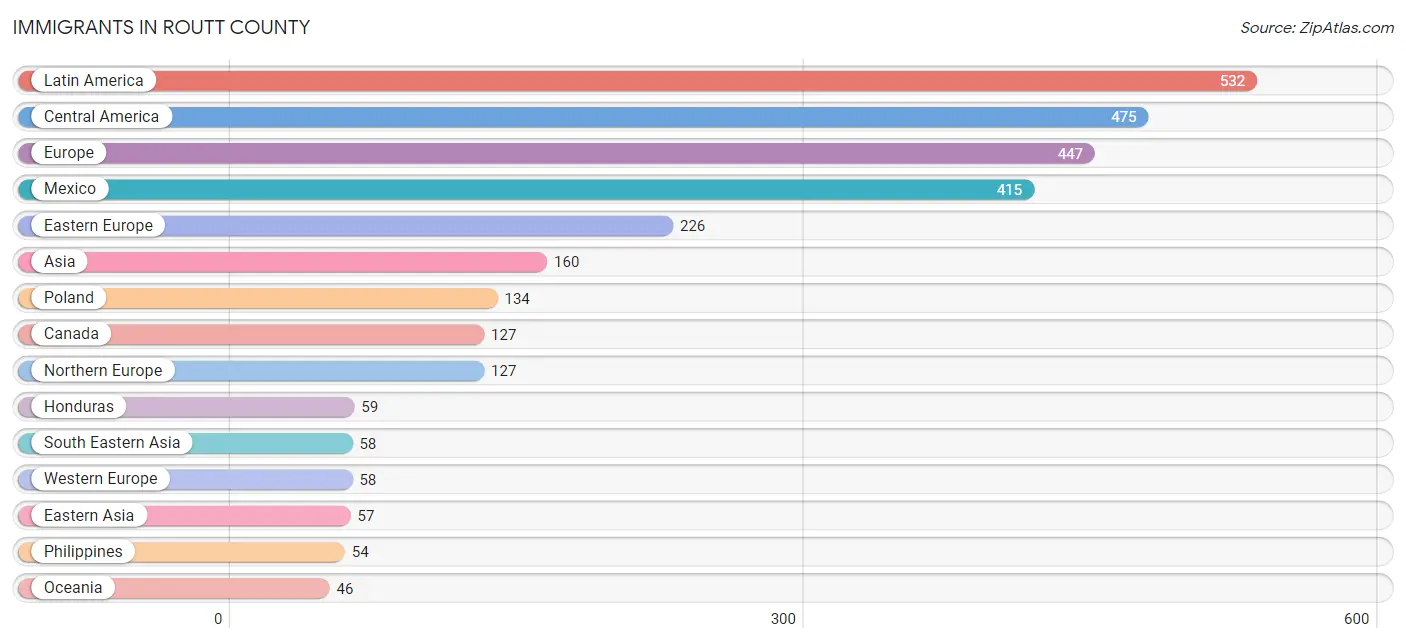
Immigrants in Routt County
The most numerous immigrant groups reported in Routt County came from Latin America (532 | 2.1%), Central America (475 | 1.9%), Europe (447 | 1.8%), Mexico (415 | 1.7%), and Eastern Europe (226 | 0.9%), together accounting for 8.4% of all Routt County residents.
| Immigration Origin | # Population | % Population |
| Africa | 20 | 0.1% |
| Asia | 160 | 0.6% |
| Australia | 23 | 0.1% |
| Austria | 16 | 0.1% |
| Brazil | 13 | 0.1% |
| Bulgaria | 17 | 0.1% |
| Canada | 127 | 0.5% |
| Caribbean | 15 | 0.1% |
| Central America | 475 | 1.9% |
| China | 31 | 0.1% |
| Cuba | 15 | 0.1% |
| Czechoslovakia | 5 | 0.0% |
| Denmark | 24 | 0.1% |
| Eastern Africa | 19 | 0.1% |
| Eastern Asia | 57 | 0.2% |
| Eastern Europe | 226 | 0.9% |
| England | 43 | 0.2% |
| Ethiopia | 19 | 0.1% |
| Europe | 447 | 1.8% |
| Germany | 31 | 0.1% |
| Honduras | 59 | 0.2% |
| Hungary | 12 | 0.1% |
| India | 3 | 0.0% |
| Iran | 42 | 0.2% |
| Ireland | 14 | 0.1% |
| Japan | 10 | 0.0% |
| Korea | 16 | 0.1% |
| Latin America | 532 | 2.1% |
| Latvia | 9 | 0.0% |
| Mexico | 415 | 1.7% |
| Moldova | 6 | 0.0% |
| Netherlands | 11 | 0.0% |
| Nigeria | 1 | 0.0% |
| Northern Europe | 127 | 0.5% |
| Oceania | 46 | 0.2% |
| Peru | 9 | 0.0% |
| Philippines | 54 | 0.2% |
| Poland | 134 | 0.5% |
| Portugal | 13 | 0.1% |
| Scotland | 20 | 0.1% |
| South America | 42 | 0.2% |
| South Central Asia | 45 | 0.2% |
| South Eastern Asia | 58 | 0.2% |
| Southern Europe | 36 | 0.1% |
| Spain | 23 | 0.1% |
| Ukraine | 43 | 0.2% |
| Venezuela | 20 | 0.1% |
| Vietnam | 4 | 0.0% |
| Western Africa | 1 | 0.0% |
| Western Europe | 58 | 0.2% | View All 50 Rows |
Sex and Age in Routt County
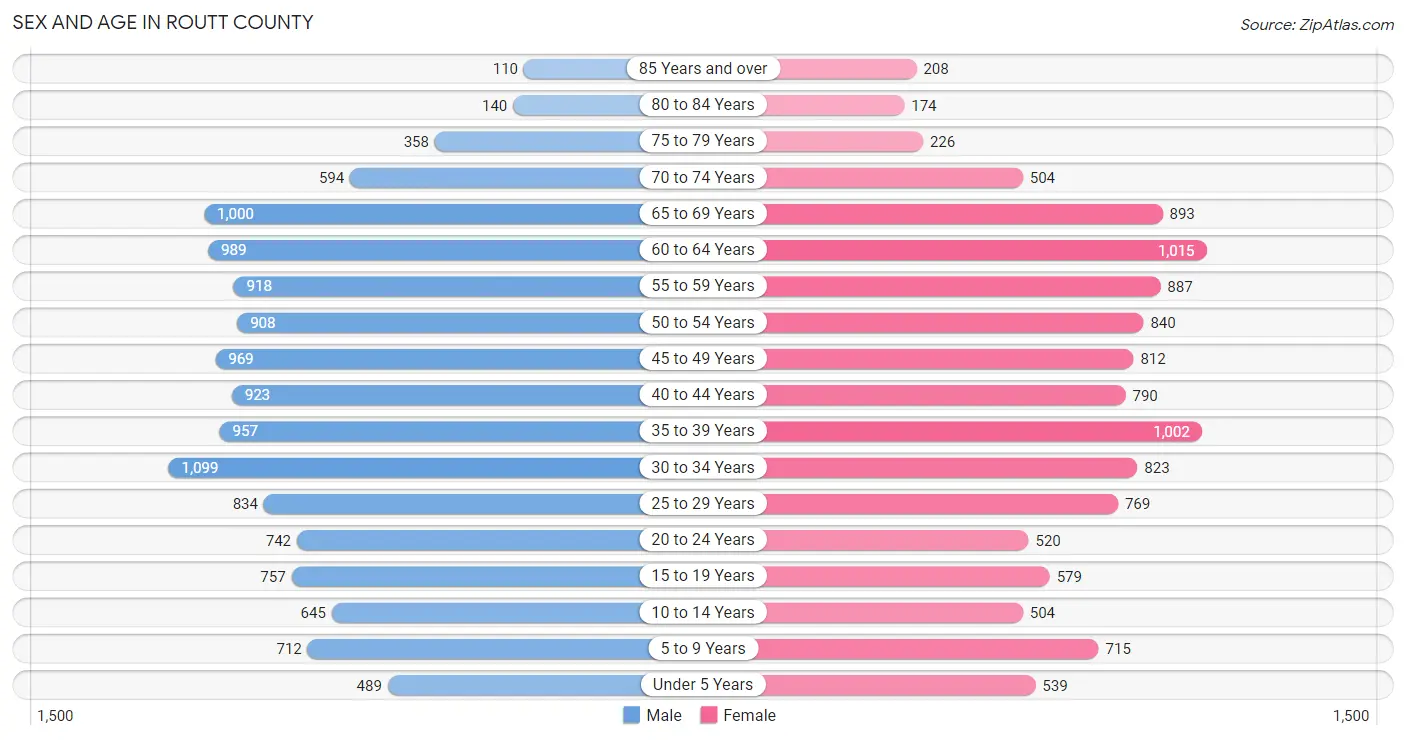
Sex and Age in Routt County
The most populous age groups in Routt County are 30 to 34 Years (1,099 | 8.4%) for men and 60 to 64 Years (1,015 | 8.6%) for women.
| Age Bracket | Male | Female |
| Under 5 Years | 489 (3.7%) | 539 (4.6%) |
| 5 to 9 Years | 712 (5.4%) | 715 (6.1%) |
| 10 to 14 Years | 645 (4.9%) | 504 (4.3%) |
| 15 to 19 Years | 757 (5.8%) | 579 (4.9%) |
| 20 to 24 Years | 742 (5.7%) | 520 (4.4%) |
| 25 to 29 Years | 834 (6.4%) | 769 (6.5%) |
| 30 to 34 Years | 1,099 (8.4%) | 823 (7.0%) |
| 35 to 39 Years | 957 (7.3%) | 1,002 (8.5%) |
| 40 to 44 Years | 923 (7.0%) | 790 (6.7%) |
| 45 to 49 Years | 969 (7.4%) | 812 (6.9%) |
| 50 to 54 Years | 908 (6.9%) | 840 (7.1%) |
| 55 to 59 Years | 918 (7.0%) | 887 (7.5%) |
| 60 to 64 Years | 989 (7.5%) | 1,015 (8.6%) |
| 65 to 69 Years | 1,000 (7.6%) | 893 (7.6%) |
| 70 to 74 Years | 594 (4.5%) | 504 (4.3%) |
| 75 to 79 Years | 358 (2.7%) | 226 (1.9%) |
| 80 to 84 Years | 140 (1.1%) | 174 (1.5%) |
| 85 Years and over | 110 (0.8%) | 208 (1.8%) |
| Total | 13,144 (100.0%) | 11,800 (100.0%) |
Families and Households in Routt County
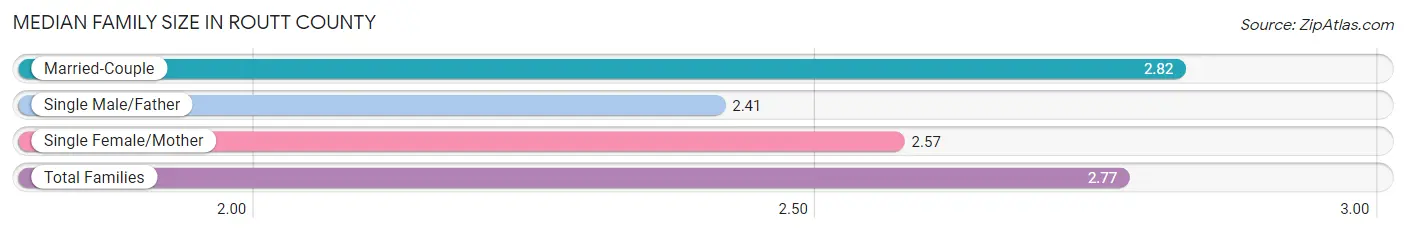
Median Family Size in Routt County
The median family size in Routt County is 2.77 persons per family, with married-couple families (5,622 | 84.0%) accounting for the largest median family size of 2.82 persons per family. On the other hand, single male/father families (353 | 5.3%) represent the smallest median family size with 2.41 persons per family.
| Family Type | # Families | Family Size |
| Married-Couple | 5,622 (84.0%) | 2.82 |
| Single Male/Father | 353 (5.3%) | 2.41 |
| Single Female/Mother | 715 (10.7%) | 2.57 |
| Total Families | 6,690 (100.0%) | 2.77 |
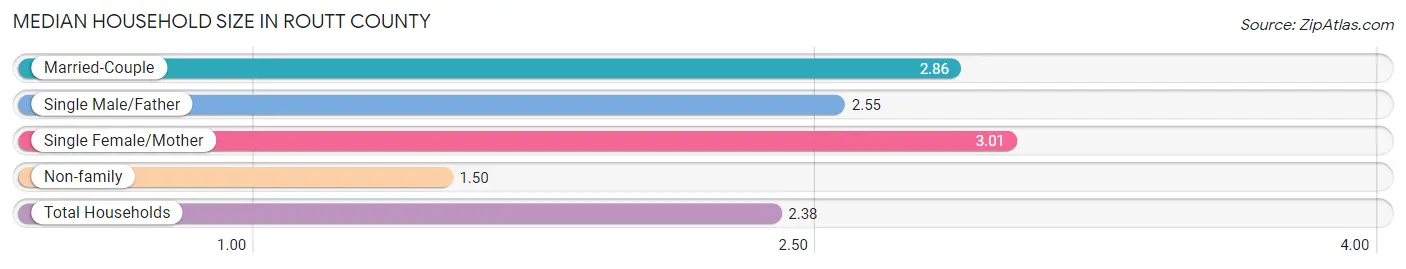
Median Household Size in Routt County
The median household size in Routt County is 2.38 persons per household, with single female/mother households (715 | 7.0%) accounting for the largest median household size of 3.01 persons per household. non-family households (3,589 | 34.9%) represent the smallest median household size with 1.50 persons per household.
| Household Type | # Households | Household Size |
| Married-Couple | 5,622 (54.7%) | 2.86 |
| Single Male/Father | 353 (3.4%) | 2.55 |
| Single Female/Mother | 715 (7.0%) | 3.01 |
| Non-family | 3,589 (34.9%) | 1.50 |
| Total Households | 10,279 (100.0%) | 2.38 |
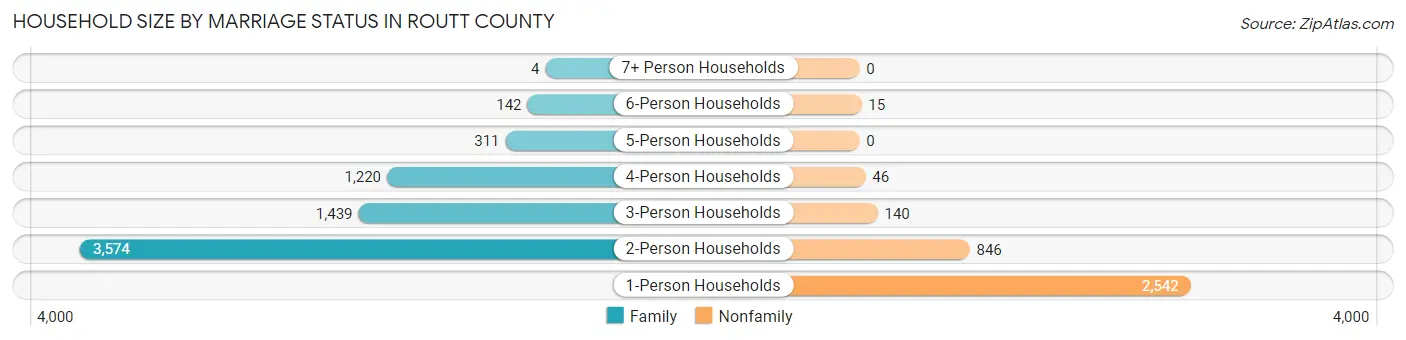
Household Size by Marriage Status in Routt County
Out of a total of 10,279 households in Routt County, 6,690 (65.1%) are family households, while 3,589 (34.9%) are nonfamily households. The most numerous type of family households are 2-person households, comprising 3,574, and the most common type of nonfamily households are 1-person households, comprising 2,542.
| Household Size | Family Households | Nonfamily Households |
| 1-Person Households | - | 2,542 (24.7%) |
| 2-Person Households | 3,574 (34.8%) | 846 (8.2%) |
| 3-Person Households | 1,439 (14.0%) | 140 (1.4%) |
| 4-Person Households | 1,220 (11.9%) | 46 (0.4%) |
| 5-Person Households | 311 (3.0%) | 0 (0.0%) |
| 6-Person Households | 142 (1.4%) | 15 (0.2%) |
| 7+ Person Households | 4 (0.0%) | 0 (0.0%) |
| Total | 6,690 (65.1%) | 3,589 (34.9%) |
Female Fertility in Routt County
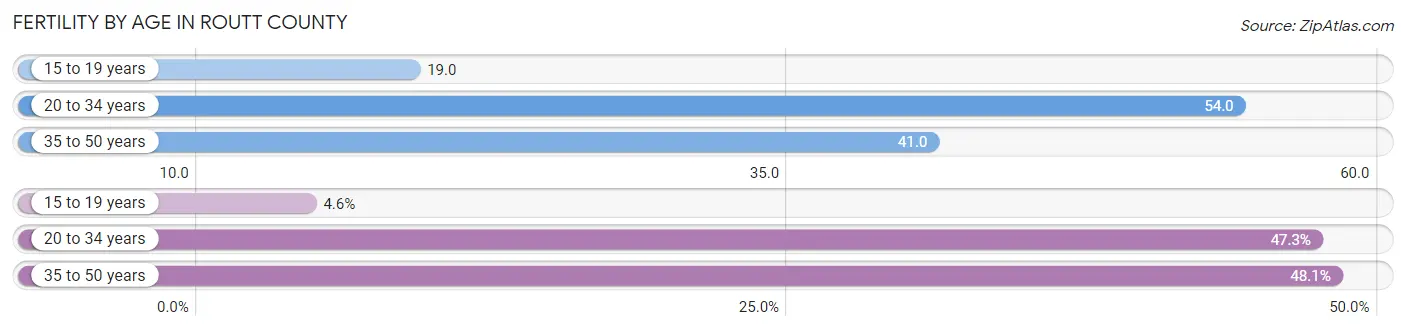
Fertility by Age in Routt County
Average fertility rate in Routt County is 44.0 births per 1,000 women. Women in the age bracket of 20 to 34 years have the highest fertility rate with 54.0 births per 1,000 women. Women in the age bracket of 35 to 50 years acount for 48.1% of all women with births.
| Age Bracket | Women with Births | Births / 1,000 Women |
| 15 to 19 years | 11 (4.6%) | 19.0 |
| 20 to 34 years | 113 (47.3%) | 54.0 |
| 35 to 50 years | 115 (48.1%) | 41.0 |
| Total | 239 (100.0%) | 44.0 |
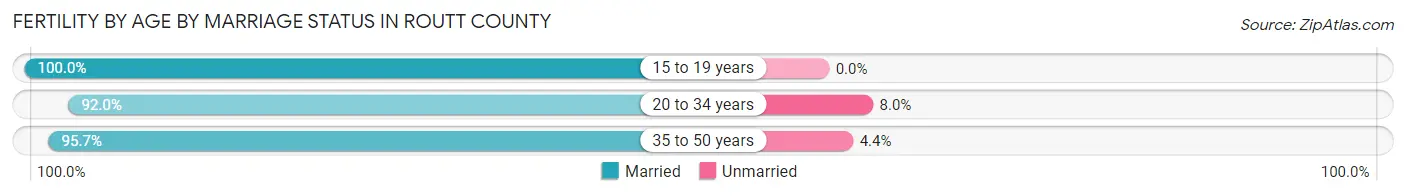
Fertility by Age by Marriage Status in Routt County
94.1% of women with births (239) in Routt County are married. The highest percentage of unmarried women with births falls into 20 to 34 years age bracket with 8.0% of them unmarried at the time of birth, while the lowest percentage of unmarried women with births belong to 15 to 19 years age bracket with 0.0% of them unmarried.
| Age Bracket | Married | Unmarried |
| 15 to 19 years | 11 (100.0%) | 0 (0.0%) |
| 20 to 34 years | 104 (92.0%) | 9 (8.0%) |
| 35 to 50 years | 110 (95.7%) | 5 (4.3%) |
| Total | 225 (94.1%) | 14 (5.9%) |
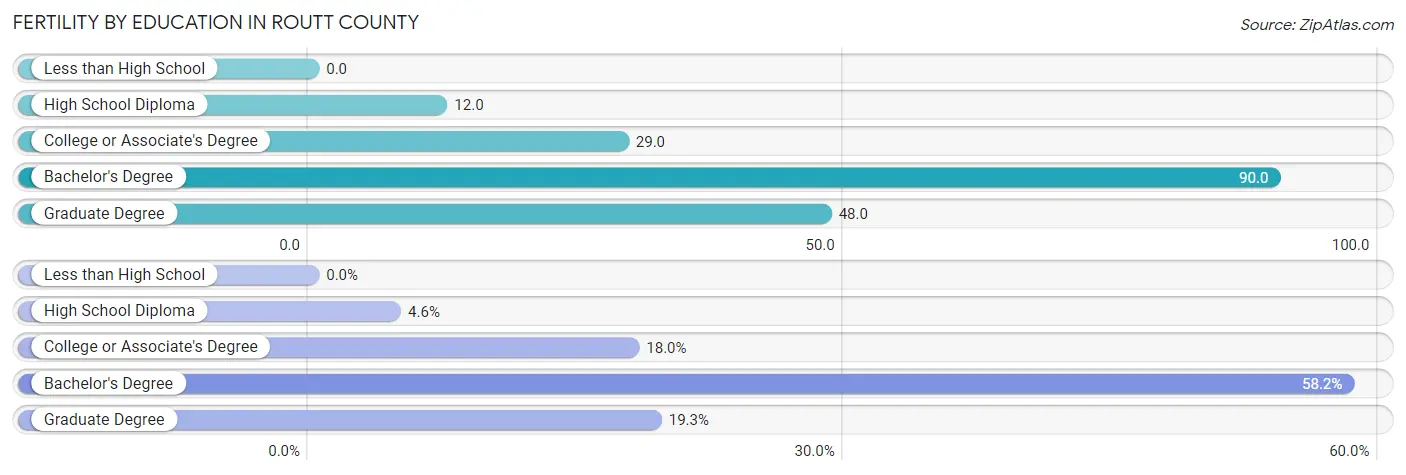
Fertility by Education in Routt County
| Educational Attainment | Women with Births | Births / 1,000 Women |
| Less than High School | 0 (0.0%) | 0.0 |
| High School Diploma | 11 (4.6%) | 12.0 |
| College or Associate's Degree | 43 (18.0%) | 29.0 |
| Bachelor's Degree | 139 (58.2%) | 90.0 |
| Graduate Degree | 46 (19.3%) | 48.0 |
| Total | 239 (100.0%) | 44.0 |
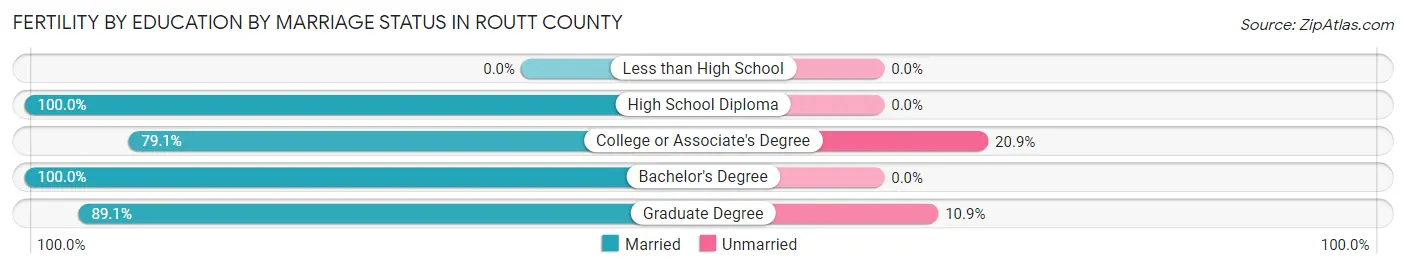
Fertility by Education by Marriage Status in Routt County
5.9% of women with births in Routt County are unmarried. Women with the educational attainment of high school diploma are most likely to be married with 100.0% of them married at childbirth, while women with the educational attainment of college or associate's degree are least likely to be married with 20.9% of them unmarried at childbirth.
| Educational Attainment | Married | Unmarried |
| Less than High School | 0 (0.0%) | 0 (0.0%) |
| High School Diploma | 11 (100.0%) | 0 (0.0%) |
| College or Associate's Degree | 34 (79.1%) | 9 (20.9%) |
| Bachelor's Degree | 139 (100.0%) | 0 (0.0%) |
| Graduate Degree | 41 (89.1%) | 5 (10.9%) |
| Total | 225 (94.1%) | 14 (5.9%) |
Income in Routt County
Income Overview in Routt County
Per Capita Income in Routt County is $58,304, while median incomes of families and households are $116,203 and $95,144 respectively.
| Characteristic | Number | Measure |
| Per Capita Income | 24,944 | $58,304 |
| Median Family Income | 6,690 | $116,203 |
| Mean Family Income | 6,690 | $161,183 |
| Median Household Income | 10,279 | $95,144 |
| Mean Household Income | 10,279 | $134,020 |
| Income Deficit | 6,690 | $0 |
| Wage / Income Gap (%) | 24,944 | 29.12% |
| Wage / Income Gap ($) | 24,944 | 70.88¢ per $1 |
| Gini / Inequality Index | 24,944 | 0.47 |
Earnings by Sex in Routt County
Average Earnings in Routt County are $48,837, $55,846 for men and $39,586 for women, a difference of 29.1%.
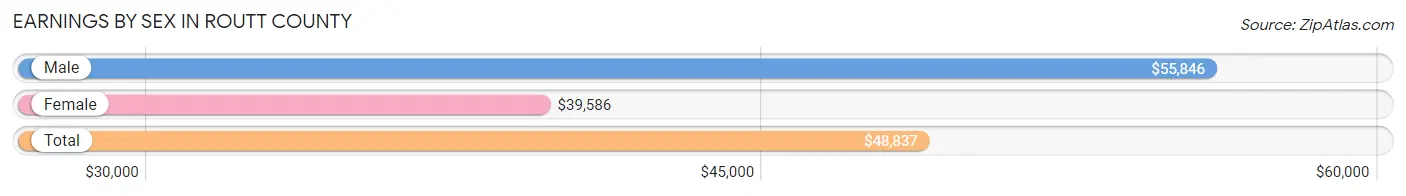
| Sex | Number | Average Earnings |
| Male | 8,655 (56.2%) | $55,846 |
| Female | 6,748 (43.8%) | $39,586 |
| Total | 15,403 (100.0%) | $48,837 |
Earnings by Sex by Income Bracket in Routt County
The most common earnings brackets in Routt County are $100,000+ for men (2,089 | 24.1%) and $100,000+ for women (916 | 13.6%).
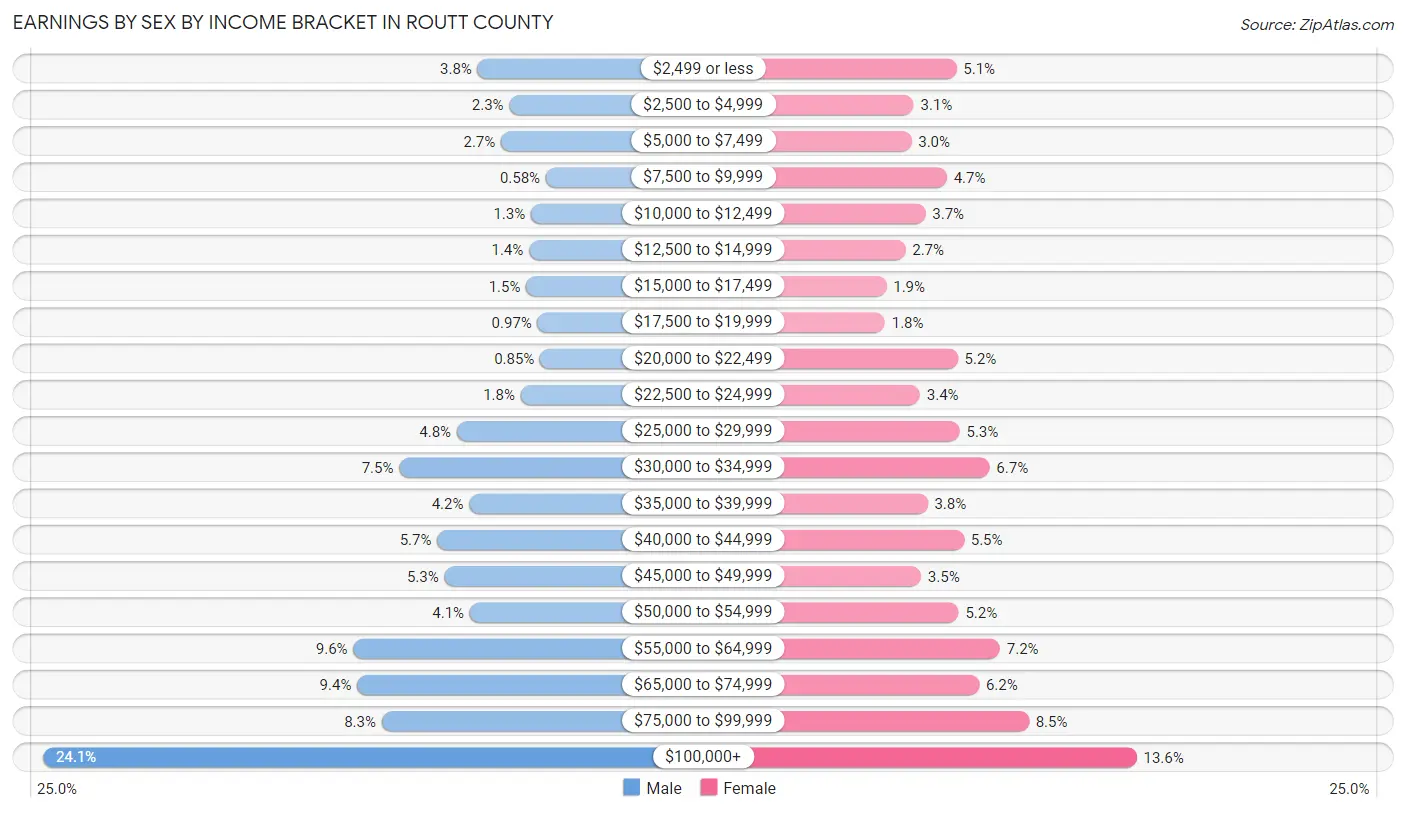
| Income | Male | Female |
| $2,499 or less | 327 (3.8%) | 346 (5.1%) |
| $2,500 to $4,999 | 198 (2.3%) | 211 (3.1%) |
| $5,000 to $7,499 | 232 (2.7%) | 204 (3.0%) |
| $7,500 to $9,999 | 50 (0.6%) | 316 (4.7%) |
| $10,000 to $12,499 | 111 (1.3%) | 248 (3.7%) |
| $12,500 to $14,999 | 119 (1.4%) | 185 (2.7%) |
| $15,000 to $17,499 | 130 (1.5%) | 125 (1.8%) |
| $17,500 to $19,999 | 84 (1.0%) | 120 (1.8%) |
| $20,000 to $22,499 | 74 (0.9%) | 350 (5.2%) |
| $22,500 to $24,999 | 152 (1.8%) | 231 (3.4%) |
| $25,000 to $29,999 | 411 (4.8%) | 356 (5.3%) |
| $30,000 to $34,999 | 645 (7.4%) | 451 (6.7%) |
| $35,000 to $39,999 | 361 (4.2%) | 255 (3.8%) |
| $40,000 to $44,999 | 491 (5.7%) | 370 (5.5%) |
| $45,000 to $49,999 | 461 (5.3%) | 234 (3.5%) |
| $50,000 to $54,999 | 358 (4.1%) | 353 (5.2%) |
| $55,000 to $64,999 | 831 (9.6%) | 484 (7.2%) |
| $65,000 to $74,999 | 815 (9.4%) | 418 (6.2%) |
| $75,000 to $99,999 | 716 (8.3%) | 575 (8.5%) |
| $100,000+ | 2,089 (24.1%) | 916 (13.6%) |
| Total | 8,655 (100.0%) | 6,748 (100.0%) |
Earnings by Sex by Educational Attainment in Routt County
Average earnings in Routt County are $60,880 for men and $42,458 for women, a difference of 30.3%. Men with an educational attainment of graduate degree enjoy the highest average annual earnings of $71,000, while those with high school diploma education earn the least with $55,000. Women with an educational attainment of graduate degree earn the most with the average annual earnings of $50,720, while those with high school diploma education have the smallest earnings of $29,730.
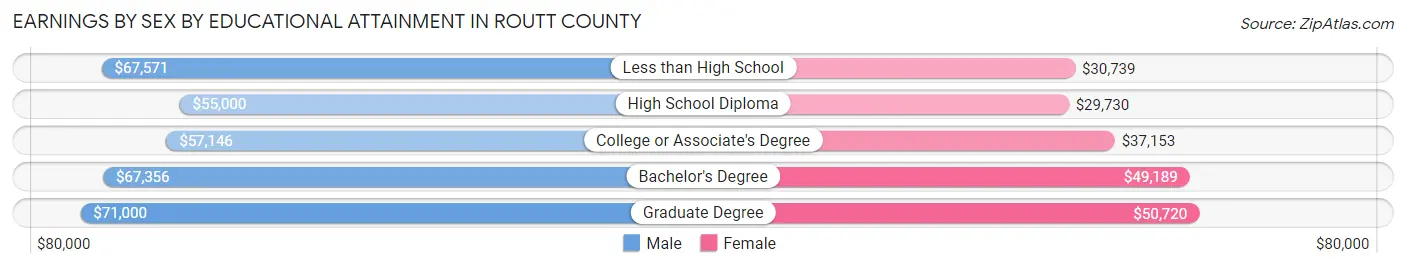
| Educational Attainment | Male Income | Female Income |
| Less than High School | $67,571 | $30,739 |
| High School Diploma | $55,000 | $29,730 |
| College or Associate's Degree | $57,146 | $37,153 |
| Bachelor's Degree | $67,356 | $49,189 |
| Graduate Degree | $71,000 | $50,720 |
| Total | $60,880 | $42,458 |
Family Income in Routt County
Family Income Brackets in Routt County
According to the Routt County family income data, there are 1,492 families falling into the $100,000 to $149,999 income range, which is the most common income bracket and makes up 22.3% of all families. Conversely, the $10,000 to $14,999 income bracket is the least frequent group with only 40 families (0.6%) belonging to this category.
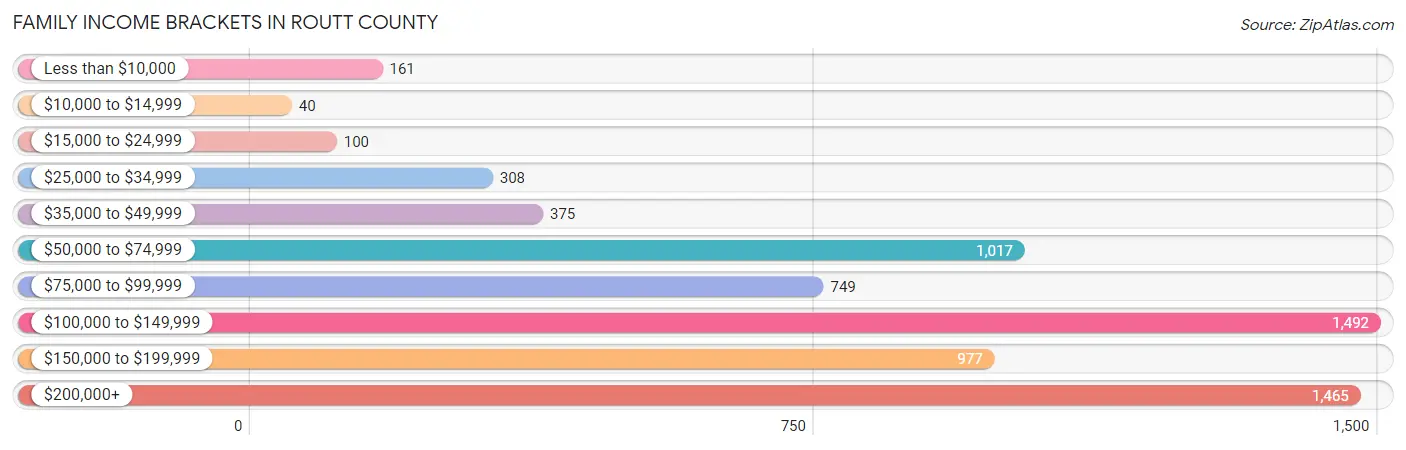
| Income Bracket | # Families | % Families |
| Less than $10,000 | 161 | 2.4% |
| $10,000 to $14,999 | 40 | 0.6% |
| $15,000 to $24,999 | 100 | 1.5% |
| $25,000 to $34,999 | 308 | 4.6% |
| $35,000 to $49,999 | 375 | 5.6% |
| $50,000 to $74,999 | 1,017 | 15.2% |
| $75,000 to $99,999 | 749 | 11.2% |
| $100,000 to $149,999 | 1,492 | 22.3% |
| $150,000 to $199,999 | 977 | 14.6% |
| $200,000+ | 1,465 | 21.9% |
Family Income by Famaliy Size in Routt County
5-person families (307 | 4.6%) account for the highest median family income in Routt County with $158,250 per family, while 2-person families (3,901 | 58.3%) have the highest median income of $53,996 per family member.
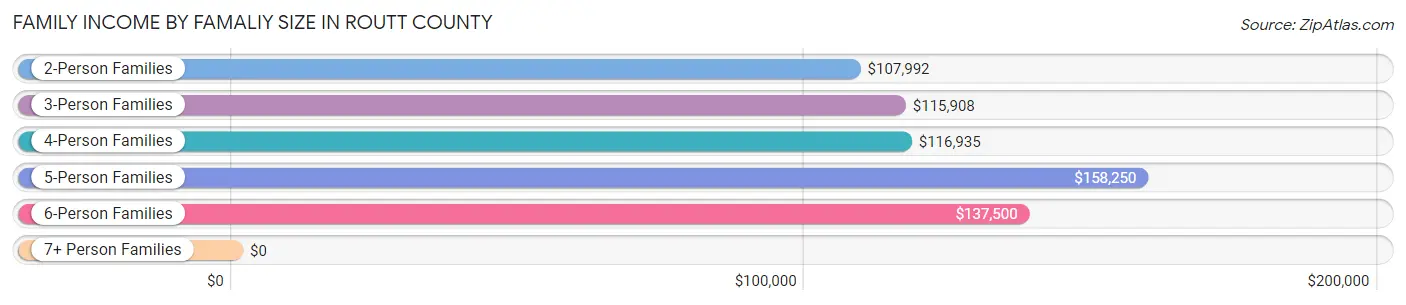
| Income Bracket | # Families | Median Income |
| 2-Person Families | 3,901 (58.3%) | $107,992 |
| 3-Person Families | 1,145 (17.1%) | $115,908 |
| 4-Person Families | 1,207 (18.0%) | $116,935 |
| 5-Person Families | 307 (4.6%) | $158,250 |
| 6-Person Families | 130 (1.9%) | $137,500 |
| 7+ Person Families | 0 (0.0%) | $0 |
| Total | 6,690 (100.0%) | $116,203 |
Family Income by Number of Earners in Routt County
The median family income in Routt County is $116,203, with families comprising 2 earners (3,491) having the highest median family income of $140,853, while families with no earners (916) have the lowest median family income of $63,056, accounting for 52.2% and 13.7% of families, respectively.
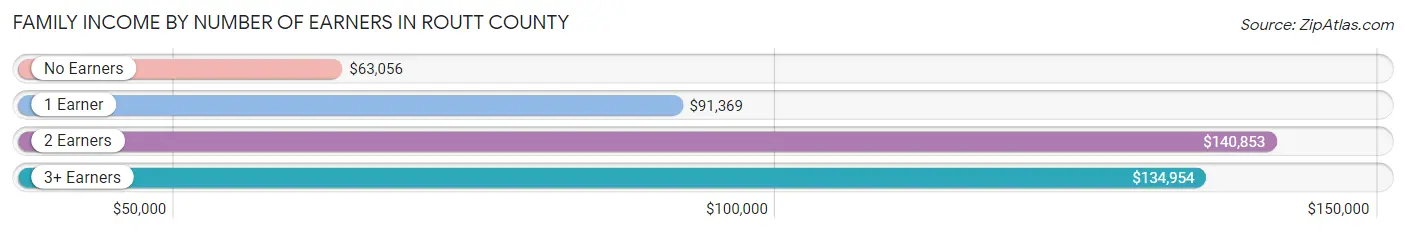
| Number of Earners | # Families | Median Income |
| No Earners | 916 (13.7%) | $63,056 |
| 1 Earner | 1,808 (27.0%) | $91,369 |
| 2 Earners | 3,491 (52.2%) | $140,853 |
| 3+ Earners | 475 (7.1%) | $134,954 |
| Total | 6,690 (100.0%) | $116,203 |
Household Income in Routt County
Household Income Brackets in Routt County
With 1,963 households falling in the category, the $100,000 to $149,999 income range is the most frequent in Routt County, accounting for 19.1% of all households. In contrast, only 319 households (3.1%) fall into the $15,000 to $24,999 income bracket, making it the least populous group.
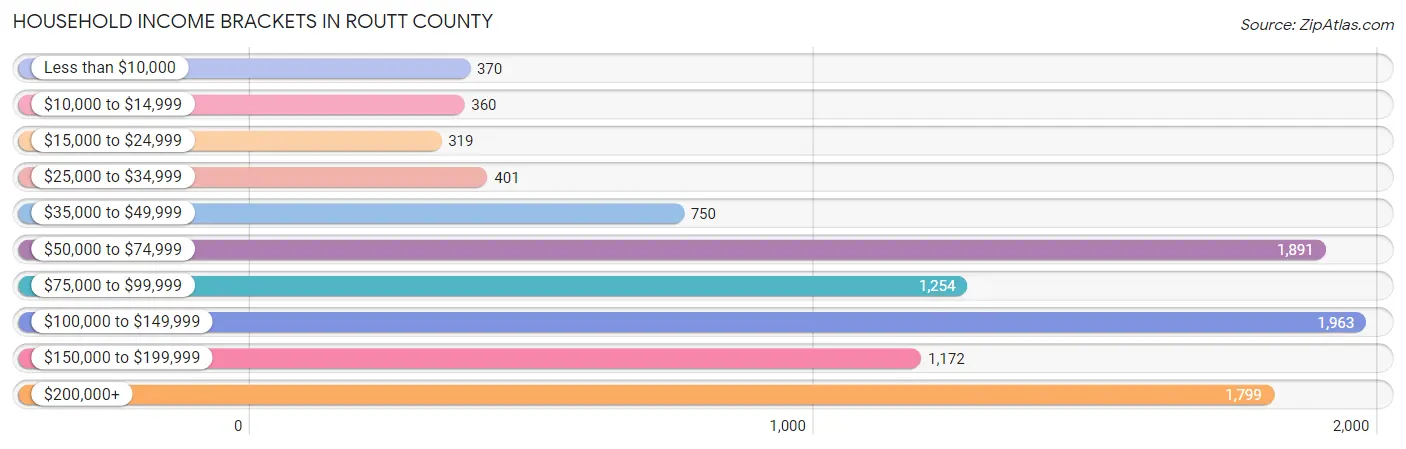
| Income Bracket | # Households | % Households |
| Less than $10,000 | 370 | 3.6% |
| $10,000 to $14,999 | 360 | 3.5% |
| $15,000 to $24,999 | 319 | 3.1% |
| $25,000 to $34,999 | 401 | 3.9% |
| $35,000 to $49,999 | 750 | 7.3% |
| $50,000 to $74,999 | 1,891 | 18.4% |
| $75,000 to $99,999 | 1,254 | 12.2% |
| $100,000 to $149,999 | 1,963 | 19.1% |
| $150,000 to $199,999 | 1,172 | 11.4% |
| $200,000+ | 1,799 | 17.5% |
Household Income by Householder Age in Routt County
The median household income in Routt County is $95,144, with the highest median household income of $106,786 found in the 25 to 44 years age bracket for the primary householder. A total of 3,354 households (32.6%) fall into this category. Meanwhile, the 15 to 24 years age bracket for the primary householder has the lowest median household income of $42,000, with 192 households (1.9%) in this group.
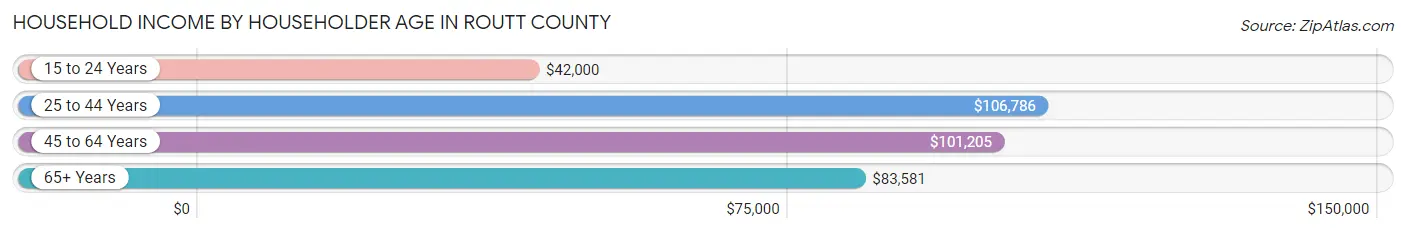
| Income Bracket | # Households | Median Income |
| 15 to 24 Years | 192 (1.9%) | $42,000 |
| 25 to 44 Years | 3,354 (32.6%) | $106,786 |
| 45 to 64 Years | 4,151 (40.4%) | $101,205 |
| 65+ Years | 2,582 (25.1%) | $83,581 |
| Total | 10,279 (100.0%) | $95,144 |
Poverty in Routt County
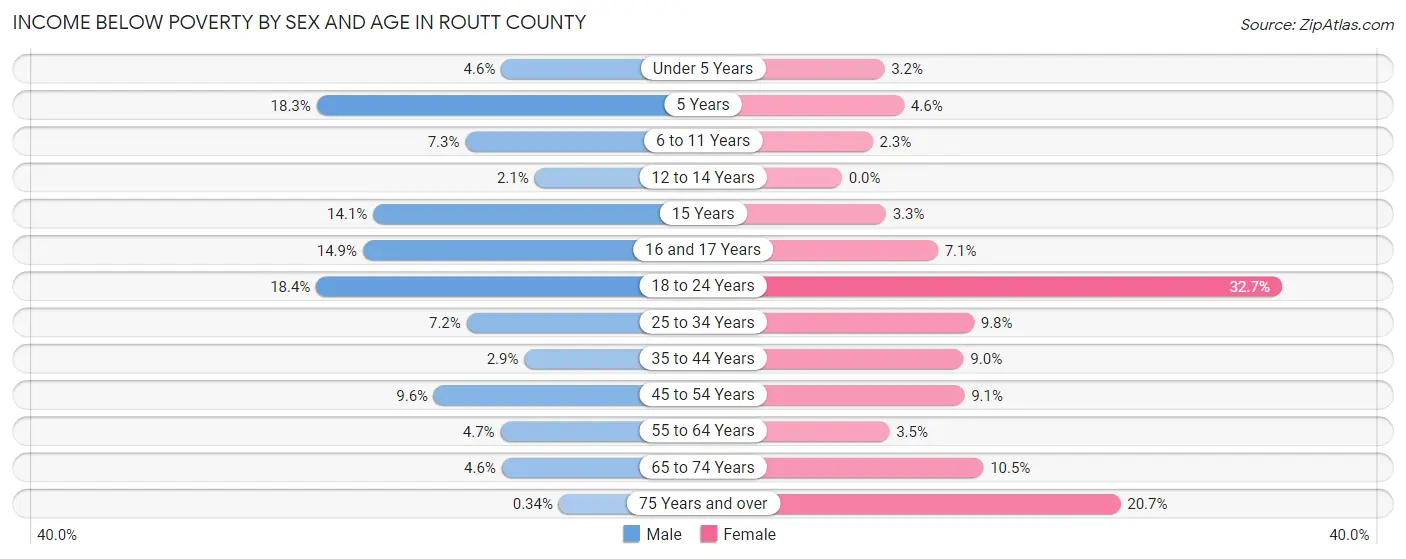
Income Below Poverty by Sex and Age in Routt County
With 6.9% poverty level for males and 9.2% for females among the residents of Routt County, 18 to 24 year old males and 18 to 24 year old females are the most vulnerable to poverty, with 185 males (18.3%) and 209 females (32.7%) in their respective age groups living below the poverty level.
| Age Bracket | Male | Female |
| Under 5 Years | 22 (4.6%) | 17 (3.2%) |
| 5 Years | 24 (18.3%) | 7 (4.6%) |
| 6 to 11 Years | 55 (7.3%) | 18 (2.3%) |
| 12 to 14 Years | 10 (2.1%) | 0 (0.0%) |
| 15 Years | 25 (14.1%) | 3 (3.3%) |
| 16 and 17 Years | 35 (14.9%) | 19 (7.1%) |
| 18 to 24 Years | 185 (18.3%) | 209 (32.7%) |
| 25 to 34 Years | 138 (7.2%) | 156 (9.8%) |
| 35 to 44 Years | 54 (2.9%) | 160 (9.0%) |
| 45 to 54 Years | 180 (9.6%) | 150 (9.1%) |
| 55 to 64 Years | 89 (4.7%) | 67 (3.5%) |
| 65 to 74 Years | 73 (4.6%) | 145 (10.5%) |
| 75 Years and over | 2 (0.3%) | 122 (20.7%) |
| Total | 892 (6.9%) | 1,073 (9.2%) |
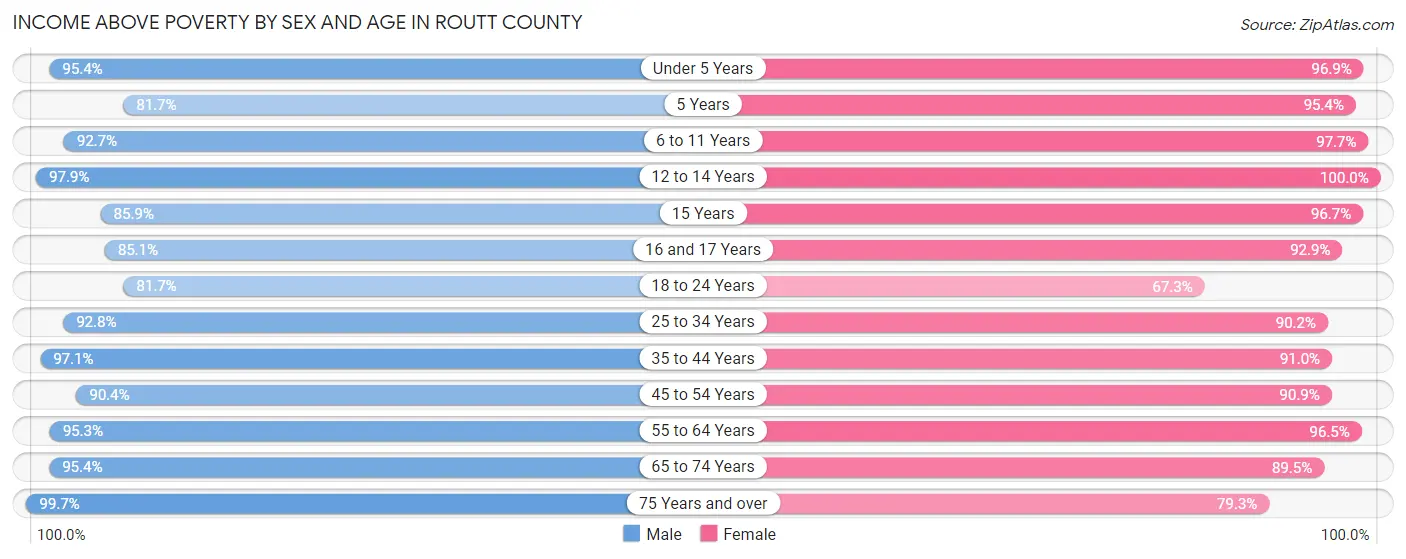
Income Above Poverty by Sex and Age in Routt County
According to the poverty statistics in Routt County, males aged 75 years and over and females aged 12 to 14 years are the age groups that are most secure financially, with 99.7% of males and 100.0% of females in these age groups living above the poverty line.
| Age Bracket | Male | Female |
| Under 5 Years | 455 (95.4%) | 522 (96.9%) |
| 5 Years | 107 (81.7%) | 145 (95.4%) |
| 6 to 11 Years | 701 (92.7%) | 771 (97.7%) |
| 12 to 14 Years | 457 (97.9%) | 276 (100.0%) |
| 15 Years | 152 (85.9%) | 89 (96.7%) |
| 16 and 17 Years | 200 (85.1%) | 248 (92.9%) |
| 18 to 24 Years | 823 (81.7%) | 431 (67.3%) |
| 25 to 34 Years | 1,785 (92.8%) | 1,436 (90.2%) |
| 35 to 44 Years | 1,805 (97.1%) | 1,611 (91.0%) |
| 45 to 54 Years | 1,694 (90.4%) | 1,500 (90.9%) |
| 55 to 64 Years | 1,816 (95.3%) | 1,835 (96.5%) |
| 65 to 74 Years | 1,521 (95.4%) | 1,236 (89.5%) |
| 75 Years and over | 590 (99.7%) | 468 (79.3%) |
| Total | 12,106 (93.1%) | 10,568 (90.8%) |
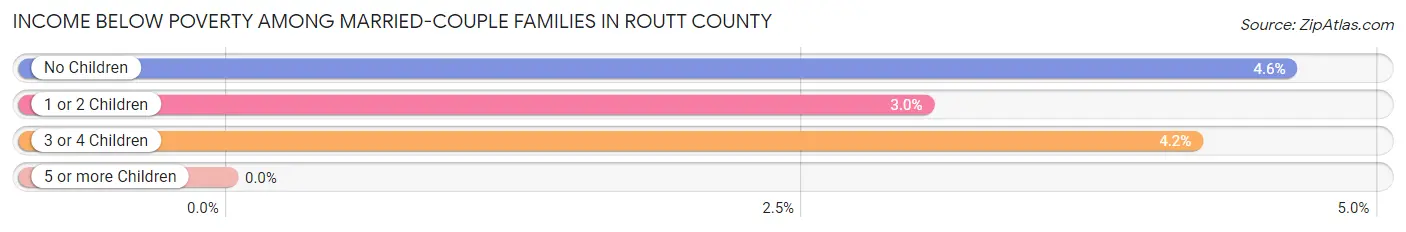
Income Below Poverty Among Married-Couple Families in Routt County
The poverty statistics for married-couple families in Routt County show that 4.1% or 229 of the total 5,622 families live below the poverty line. Families with no children have the highest poverty rate of 4.6%, comprising of 163 families. On the other hand, families with 1 or 2 children have the lowest poverty rate of 3.0%, which includes 56 families.
| Children | Above Poverty | Below Poverty |
| No Children | 3,373 (95.4%) | 163 (4.6%) |
| 1 or 2 Children | 1,792 (97.0%) | 56 (3.0%) |
| 3 or 4 Children | 228 (95.8%) | 10 (4.2%) |
| 5 or more Children | 0 (0.0%) | 0 (0.0%) |
| Total | 5,393 (95.9%) | 229 (4.1%) |
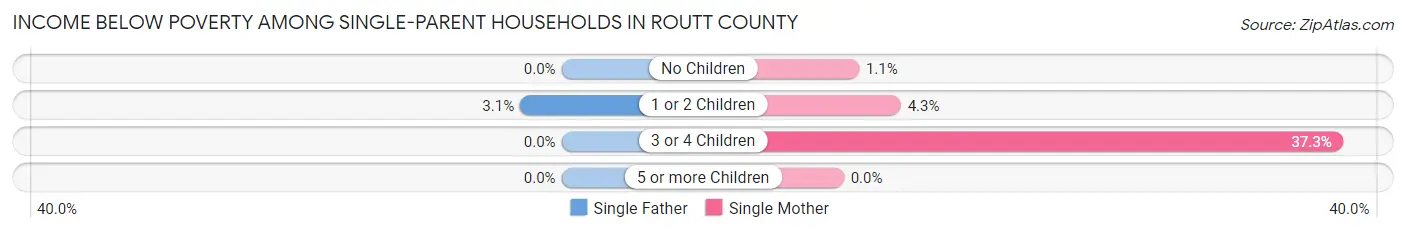
Income Below Poverty Among Single-Parent Households in Routt County
According to the poverty data in Routt County, 1.7% or 6 single-father households and 5.4% or 39 single-mother households are living below the poverty line. Among single-father households, those with 1 or 2 children have the highest poverty rate, with 6 households (3.1%) experiencing poverty. Likewise, among single-mother households, those with 3 or 4 children have the highest poverty rate, with 19 households (37.2%) falling below the poverty line.
| Children | Single Father | Single Mother |
| No Children | 0 (0.0%) | 3 (1.1%) |
| 1 or 2 Children | 6 (3.1%) | 17 (4.3%) |
| 3 or 4 Children | 0 (0.0%) | 19 (37.2%) |
| 5 or more Children | 0 (0.0%) | 0 (0.0%) |
| Total | 6 (1.7%) | 39 (5.4%) |
Income Below Poverty Among Married-Couple vs Single-Parent Households in Routt County
The poverty data for Routt County shows that 229 of the married-couple family households (4.1%) and 45 of the single-parent households (4.2%) are living below the poverty level. Within the married-couple family households, those with no children have the highest poverty rate, with 163 households (4.6%) falling below the poverty line. Among the single-parent households, those with 3 or 4 children have the highest poverty rate, with 19 household (37.2%) living below poverty.
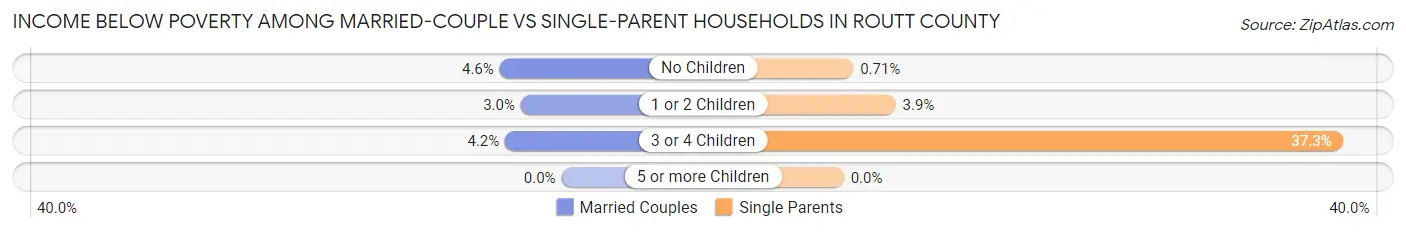
| Children | Married-Couple Families | Single-Parent Households |
| No Children | 163 (4.6%) | 3 (0.7%) |
| 1 or 2 Children | 56 (3.0%) | 23 (3.9%) |
| 3 or 4 Children | 10 (4.2%) | 19 (37.2%) |
| 5 or more Children | 0 (0.0%) | 0 (0.0%) |
| Total | 229 (4.1%) | 45 (4.2%) |
Employment Characteristics in Routt County
Employment by Class of Employer in Routt County
Among the 13,686 employed individuals in Routt County, private company employees (8,989 | 65.7%), self-employed (incorporated) (1,056 | 7.7%), and not-for-profit organizations (1,047 | 7.6%) make up the most common classes of employment.
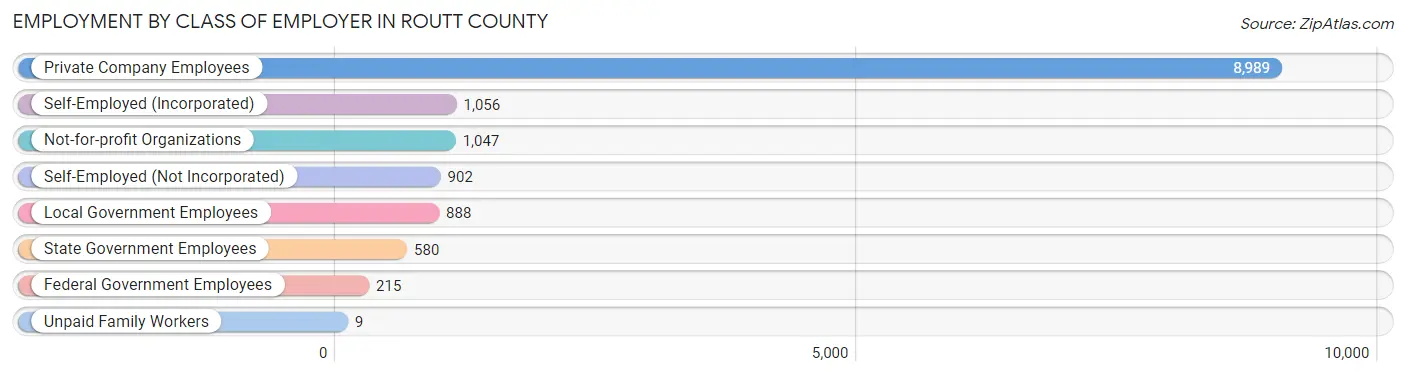
| Employer Class | # Employees | % Employees |
| Private Company Employees | 8,989 | 65.7% |
| Self-Employed (Incorporated) | 1,056 | 7.7% |
| Self-Employed (Not Incorporated) | 902 | 6.6% |
| Not-for-profit Organizations | 1,047 | 7.6% |
| Local Government Employees | 888 | 6.5% |
| State Government Employees | 580 | 4.2% |
| Federal Government Employees | 215 | 1.6% |
| Unpaid Family Workers | 9 | 0.1% |
| Total | 13,686 | 100.0% |
Employment Status by Age in Routt County
According to the labor force statistics for Routt County, out of the total population over 16 years of age (21,071), 67.7% or 14,265 individuals are in the labor force, with 2.9% or 414 of them unemployed. The age group with the highest labor force participation rate is 30 to 34 years, with 88.9% or 1,709 individuals in the labor force. Within the labor force, the 16 to 19 years age range has the highest percentage of unemployed individuals, with 16.3% or 69 of them being unemployed.
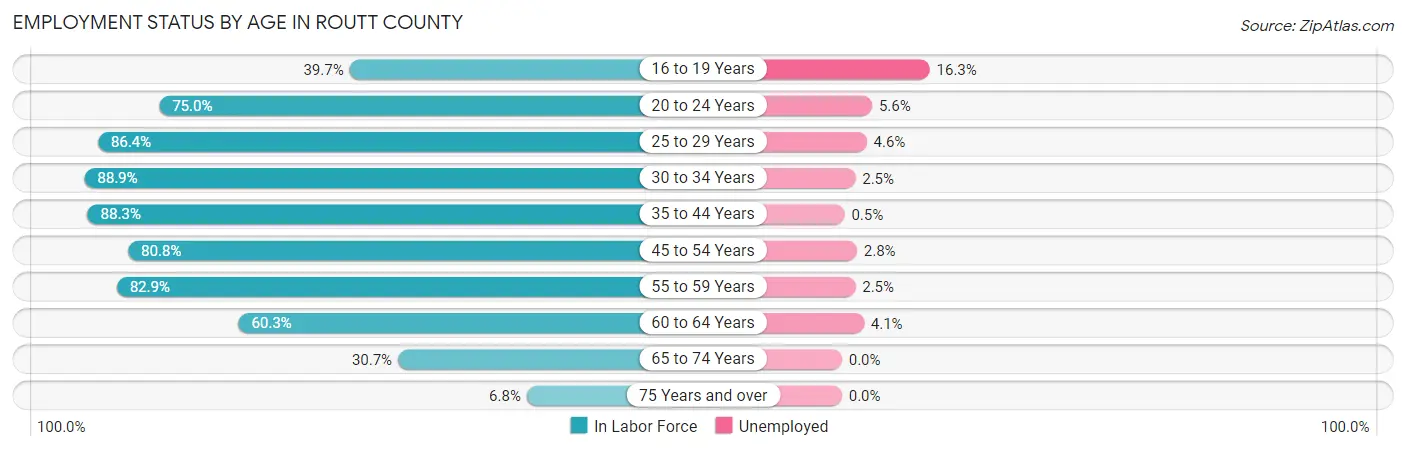
| Age Bracket | In Labor Force | Unemployed |
| 16 to 19 Years | 424 (39.7%) | 69 (16.3%) |
| 20 to 24 Years | 946 (75.0%) | 53 (5.6%) |
| 25 to 29 Years | 1,385 (86.4%) | 64 (4.6%) |
| 30 to 34 Years | 1,709 (88.9%) | 43 (2.5%) |
| 35 to 44 Years | 3,242 (88.3%) | 16 (0.5%) |
| 45 to 54 Years | 2,851 (80.8%) | 80 (2.8%) |
| 55 to 59 Years | 1,496 (82.9%) | 37 (2.5%) |
| 60 to 64 Years | 1,208 (60.3%) | 50 (4.1%) |
| 65 to 74 Years | 918 (30.7%) | 0 (0.0%) |
| 75 Years and over | 83 (6.8%) | 0 (0.0%) |
| Total | 14,265 (67.7%) | 414 (2.9%) |
Employment Status by Educational Attainment in Routt County
According to labor force statistics for Routt County, 81.8% of individuals (11,890) out of the total population between 25 and 64 years of age (14,535) are in the labor force, with 2.4% or 285 of them being unemployed. The group with the highest labor force participation rate are those with the educational attainment of bachelor's degree or higher, with 86.8% or 6,150 individuals in the labor force. Within the labor force, individuals with high school diploma education have the highest percentage of unemployment, with 7.0% or 152 of them being unemployed.
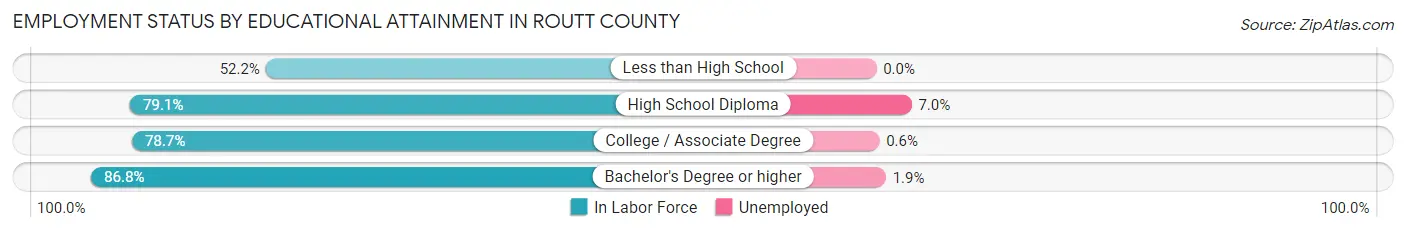
| Educational Attainment | In Labor Force | Unemployed |
| Less than High School | 264 (52.2%) | 0 (0.0%) |
| High School Diploma | 2,172 (79.1%) | 192 (7.0%) |
| College / Associate Degree | 3,304 (78.7%) | 25 (0.6%) |
| Bachelor's Degree or higher | 6,150 (86.8%) | 135 (1.9%) |
| Total | 11,890 (81.8%) | 349 (2.4%) |
Employment Occupations by Sex in Routt County
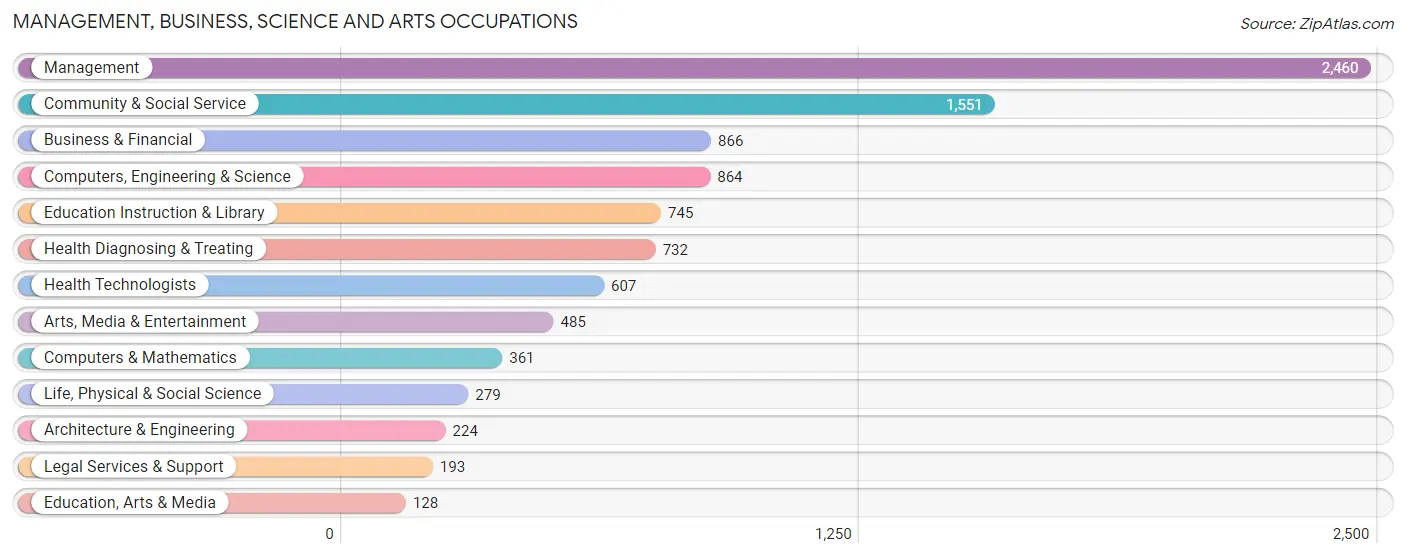
Management, Business, Science and Arts Occupations
The most common Management, Business, Science and Arts occupations in Routt County are Management (2,460 | 17.8%), Community & Social Service (1,551 | 11.2%), Business & Financial (866 | 6.3%), Computers, Engineering & Science (864 | 6.2%), and Education Instruction & Library (745 | 5.4%).
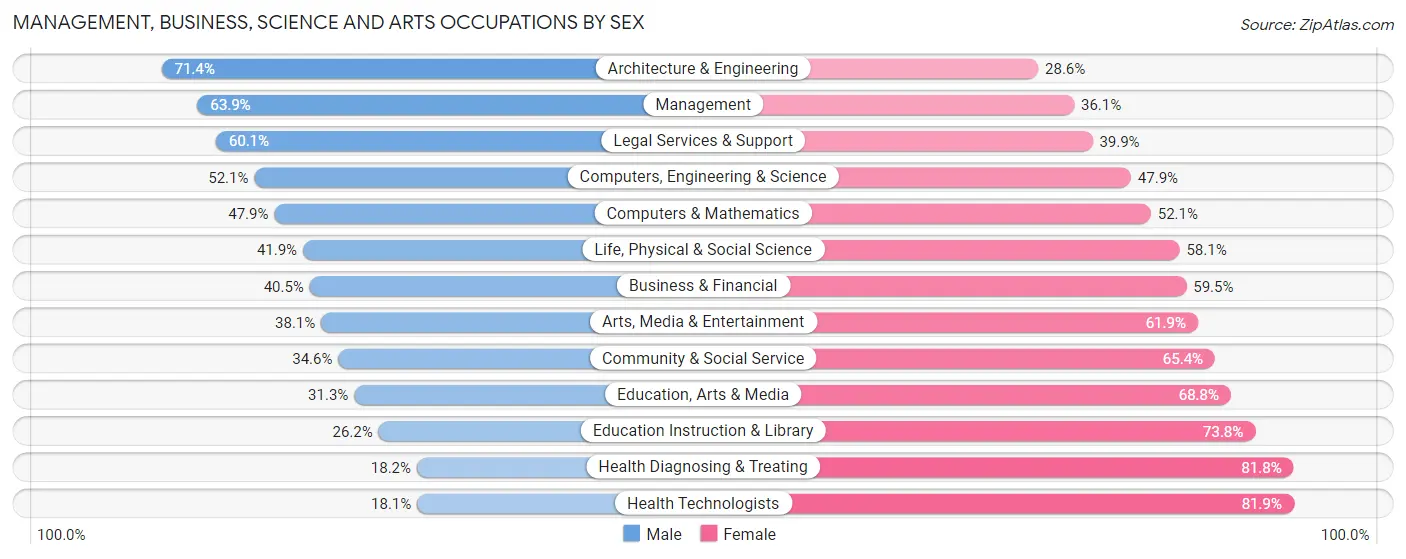
Management, Business, Science and Arts Occupations by Sex
Within the Management, Business, Science and Arts occupations in Routt County, the most male-oriented occupations are Architecture & Engineering (71.4%), Management (63.9%), and Legal Services & Support (60.1%), while the most female-oriented occupations are Health Technologists (81.9%), Health Diagnosing & Treating (81.8%), and Education Instruction & Library (73.8%).
| Occupation | Male | Female |
| Management | 1,573 (63.9%) | 887 (36.1%) |
| Business & Financial | 351 (40.5%) | 515 (59.5%) |
| Computers, Engineering & Science | 450 (52.1%) | 414 (47.9%) |
| Computers & Mathematics | 173 (47.9%) | 188 (52.1%) |
| Architecture & Engineering | 160 (71.4%) | 64 (28.6%) |
| Life, Physical & Social Science | 117 (41.9%) | 162 (58.1%) |
| Community & Social Service | 536 (34.6%) | 1,015 (65.4%) |
| Education, Arts & Media | 40 (31.2%) | 88 (68.8%) |
| Legal Services & Support | 116 (60.1%) | 77 (39.9%) |
| Education Instruction & Library | 195 (26.2%) | 550 (73.8%) |
| Arts, Media & Entertainment | 185 (38.1%) | 300 (61.9%) |
| Health Diagnosing & Treating | 133 (18.2%) | 599 (81.8%) |
| Health Technologists | 110 (18.1%) | 497 (81.9%) |
| Total (Category) | 3,043 (47.0%) | 3,430 (53.0%) |
| Total (Overall) | 7,576 (54.8%) | 6,243 (45.2%) |
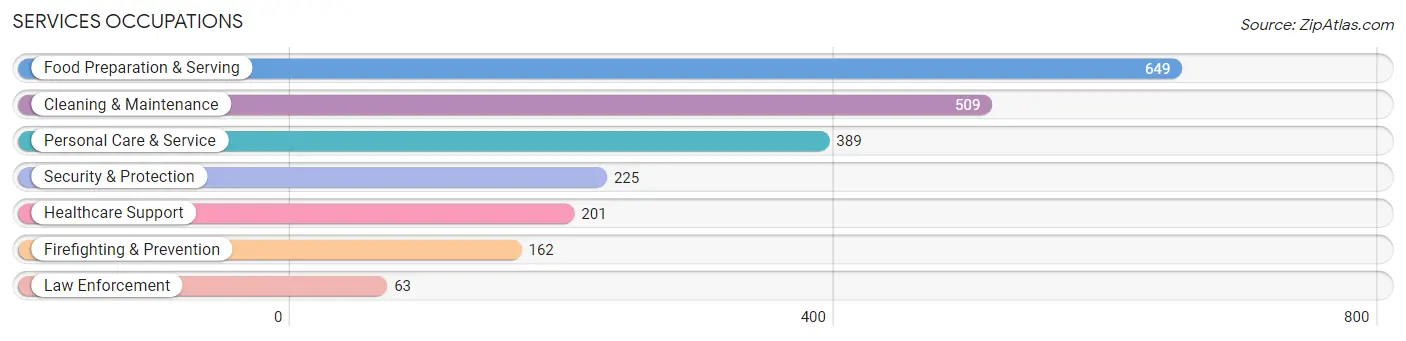
Services Occupations
The most common Services occupations in Routt County are Food Preparation & Serving (649 | 4.7%), Cleaning & Maintenance (509 | 3.7%), Personal Care & Service (389 | 2.8%), Security & Protection (225 | 1.6%), and Healthcare Support (201 | 1.5%).
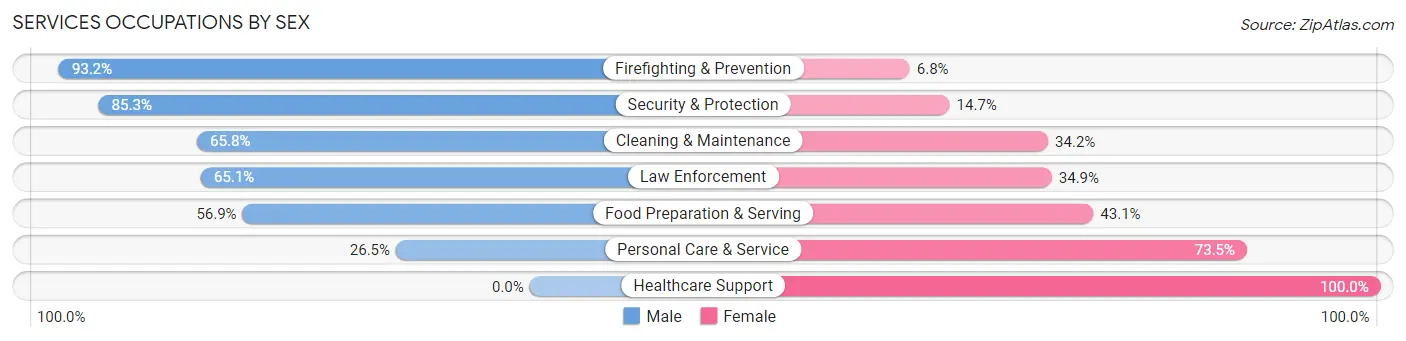
Services Occupations by Sex
Within the Services occupations in Routt County, the most male-oriented occupations are Firefighting & Prevention (93.2%), Security & Protection (85.3%), and Cleaning & Maintenance (65.8%), while the most female-oriented occupations are Healthcare Support (100.0%), Personal Care & Service (73.5%), and Food Preparation & Serving (43.1%).
| Occupation | Male | Female |
| Healthcare Support | 0 (0.0%) | 201 (100.0%) |
| Security & Protection | 192 (85.3%) | 33 (14.7%) |
| Firefighting & Prevention | 151 (93.2%) | 11 (6.8%) |
| Law Enforcement | 41 (65.1%) | 22 (34.9%) |
| Food Preparation & Serving | 369 (56.9%) | 280 (43.1%) |
| Cleaning & Maintenance | 335 (65.8%) | 174 (34.2%) |
| Personal Care & Service | 103 (26.5%) | 286 (73.5%) |
| Total (Category) | 999 (50.6%) | 974 (49.4%) |
| Total (Overall) | 7,576 (54.8%) | 6,243 (45.2%) |
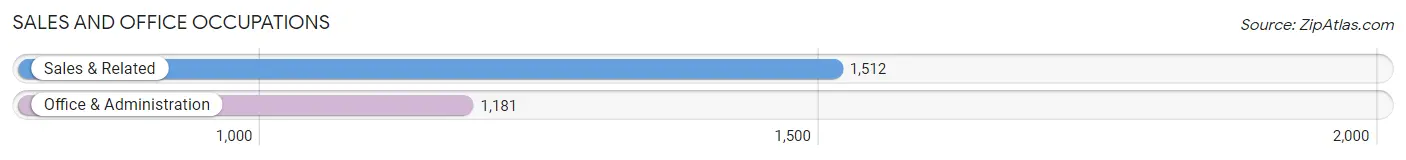
Sales and Office Occupations
The most common Sales and Office occupations in Routt County are Sales & Related (1,512 | 10.9%), and Office & Administration (1,181 | 8.6%).
Sales and Office Occupations by Sex
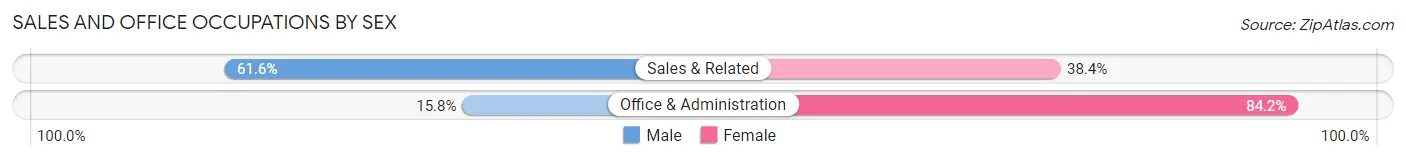
| Occupation | Male | Female |
| Sales & Related | 932 (61.6%) | 580 (38.4%) |
| Office & Administration | 187 (15.8%) | 994 (84.2%) |
| Total (Category) | 1,119 (41.5%) | 1,574 (58.5%) |
| Total (Overall) | 7,576 (54.8%) | 6,243 (45.2%) |
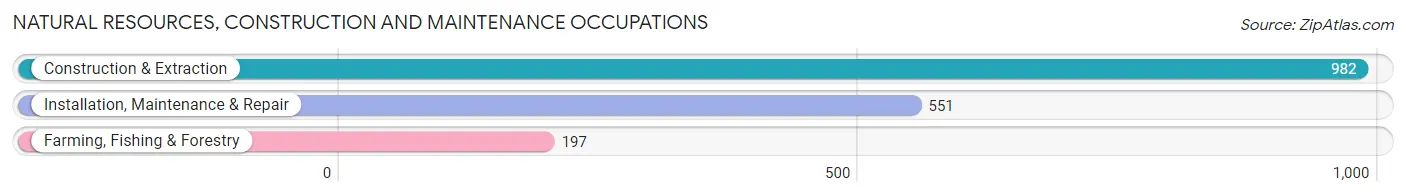
Natural Resources, Construction and Maintenance Occupations
The most common Natural Resources, Construction and Maintenance occupations in Routt County are Construction & Extraction (982 | 7.1%), Installation, Maintenance & Repair (551 | 4.0%), and Farming, Fishing & Forestry (197 | 1.4%).
Natural Resources, Construction and Maintenance Occupations by Sex
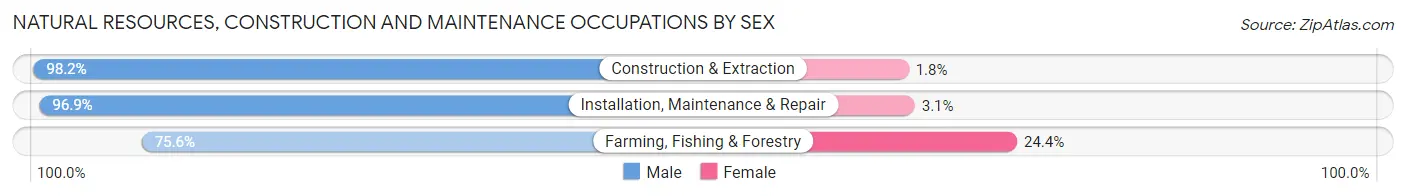
| Occupation | Male | Female |
| Farming, Fishing & Forestry | 149 (75.6%) | 48 (24.4%) |
| Construction & Extraction | 964 (98.2%) | 18 (1.8%) |
| Installation, Maintenance & Repair | 534 (96.9%) | 17 (3.1%) |
| Total (Category) | 1,647 (95.2%) | 83 (4.8%) |
| Total (Overall) | 7,576 (54.8%) | 6,243 (45.2%) |
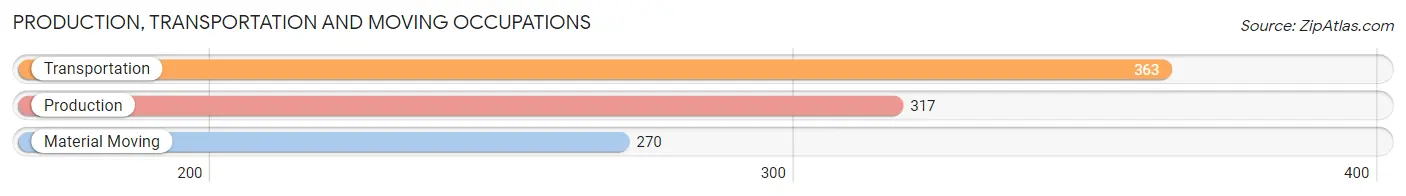
Production, Transportation and Moving Occupations
The most common Production, Transportation and Moving occupations in Routt County are Transportation (363 | 2.6%), Production (317 | 2.3%), and Material Moving (270 | 1.9%).
Production, Transportation and Moving Occupations by Sex
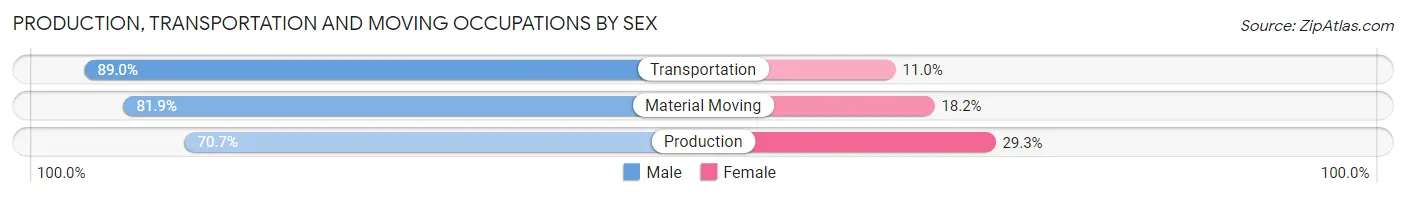
| Occupation | Male | Female |
| Production | 224 (70.7%) | 93 (29.3%) |
| Transportation | 323 (89.0%) | 40 (11.0%) |
| Material Moving | 221 (81.9%) | 49 (18.1%) |
| Total (Category) | 768 (80.8%) | 182 (19.2%) |
| Total (Overall) | 7,576 (54.8%) | 6,243 (45.2%) |
Employment Industries by Sex in Routt County
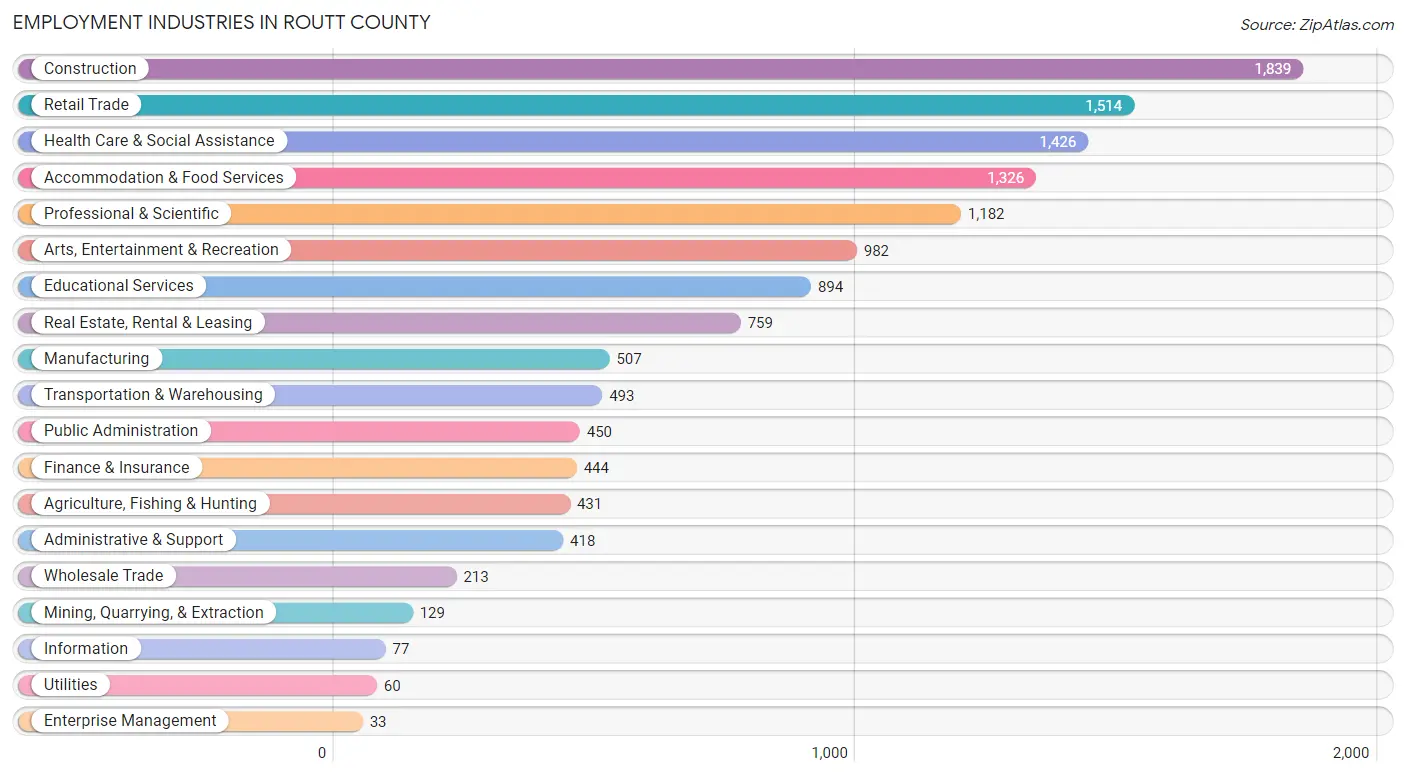
Employment Industries in Routt County
The major employment industries in Routt County include Construction (1,839 | 13.3%), Retail Trade (1,514 | 11.0%), Health Care & Social Assistance (1,426 | 10.3%), Accommodation & Food Services (1,326 | 9.6%), and Professional & Scientific (1,182 | 8.6%).
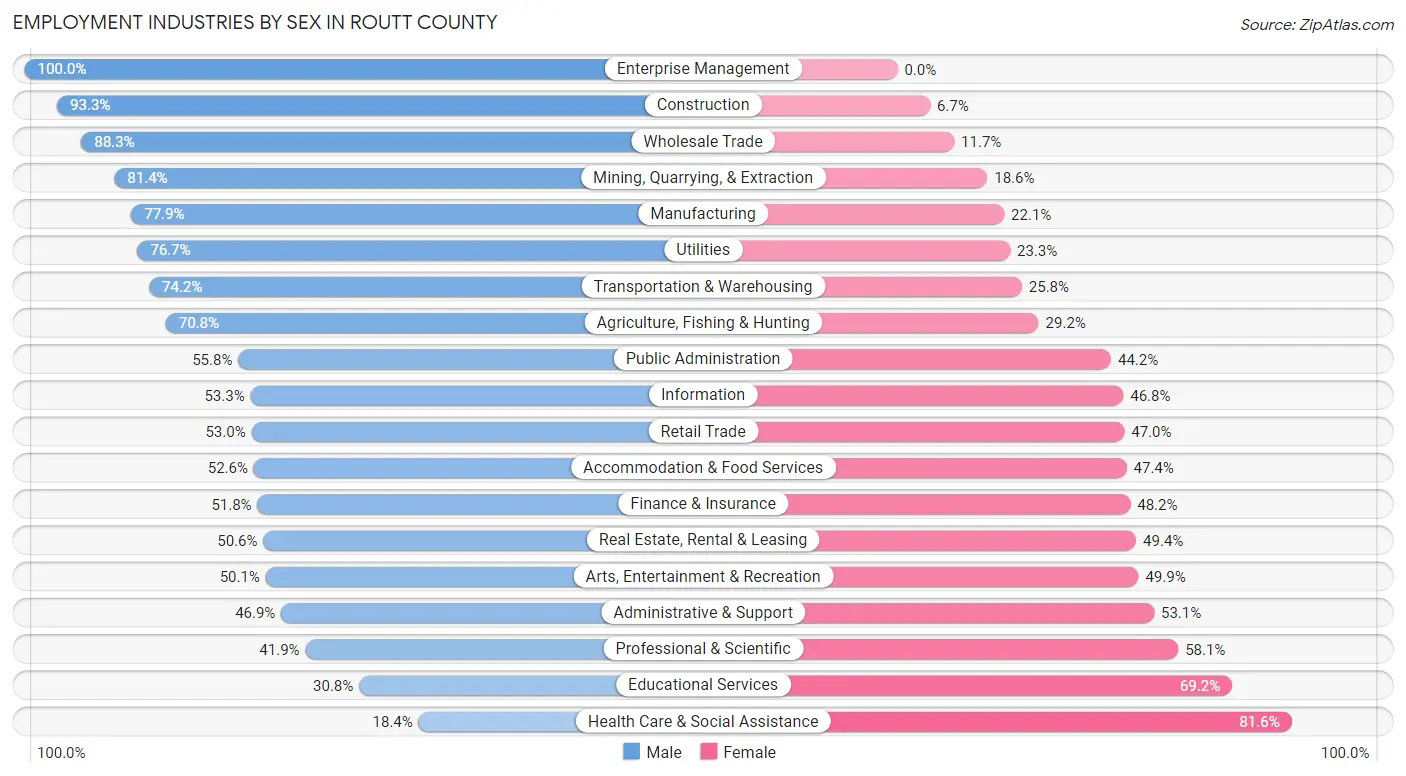
Employment Industries by Sex in Routt County
The Routt County industries that see more men than women are Enterprise Management (100.0%), Construction (93.3%), and Wholesale Trade (88.3%), whereas the industries that tend to have a higher number of women are Health Care & Social Assistance (81.6%), Educational Services (69.2%), and Professional & Scientific (58.1%).
| Industry | Male | Female |
| Agriculture, Fishing & Hunting | 305 (70.8%) | 126 (29.2%) |
| Mining, Quarrying, & Extraction | 105 (81.4%) | 24 (18.6%) |
| Construction | 1,715 (93.3%) | 124 (6.7%) |
| Manufacturing | 395 (77.9%) | 112 (22.1%) |
| Wholesale Trade | 188 (88.3%) | 25 (11.7%) |
| Retail Trade | 803 (53.0%) | 711 (47.0%) |
| Transportation & Warehousing | 366 (74.2%) | 127 (25.8%) |
| Utilities | 46 (76.7%) | 14 (23.3%) |
| Information | 41 (53.2%) | 36 (46.8%) |
| Finance & Insurance | 230 (51.8%) | 214 (48.2%) |
| Real Estate, Rental & Leasing | 384 (50.6%) | 375 (49.4%) |
| Professional & Scientific | 495 (41.9%) | 687 (58.1%) |
| Enterprise Management | 33 (100.0%) | 0 (0.0%) |
| Administrative & Support | 196 (46.9%) | 222 (53.1%) |
| Educational Services | 275 (30.8%) | 619 (69.2%) |
| Health Care & Social Assistance | 263 (18.4%) | 1,163 (81.6%) |
| Arts, Entertainment & Recreation | 492 (50.1%) | 490 (49.9%) |
| Accommodation & Food Services | 697 (52.6%) | 629 (47.4%) |
| Public Administration | 251 (55.8%) | 199 (44.2%) |
| Total | 7,576 (54.8%) | 6,243 (45.2%) |
Education in Routt County
School Enrollment in Routt County
The most common levels of schooling among the 4,840 students in Routt County are elementary school (1,206 | 24.9%), high school (1,112 | 23.0%), and middle school (870 | 18.0%).
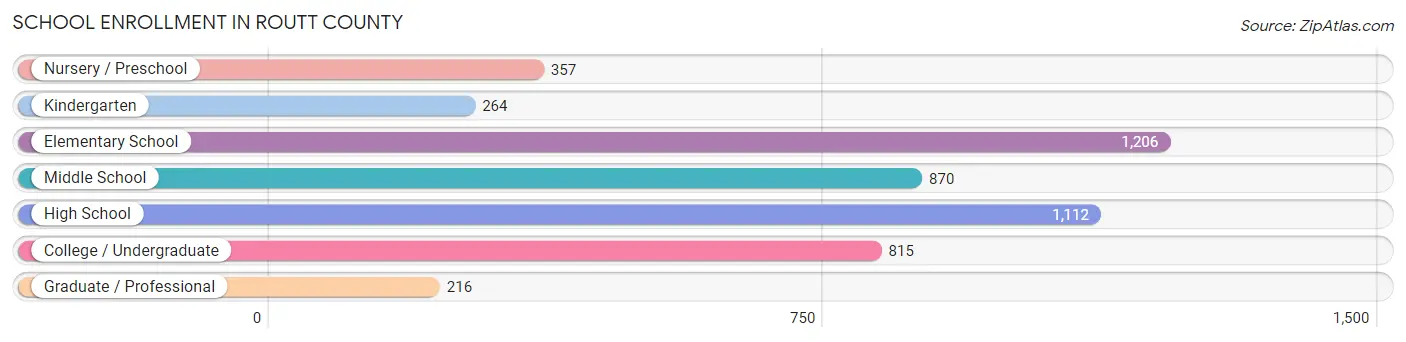
| School Level | # Students | % Students |
| Nursery / Preschool | 357 | 7.4% |
| Kindergarten | 264 | 5.4% |
| Elementary School | 1,206 | 24.9% |
| Middle School | 870 | 18.0% |
| High School | 1,112 | 23.0% |
| College / Undergraduate | 815 | 16.8% |
| Graduate / Professional | 216 | 4.5% |
| Total | 4,840 | 100.0% |
School Enrollment by Age by Funding Source in Routt County
Out of a total of 4,840 students who are enrolled in schools in Routt County, 479 (9.9%) attend a private institution, while the remaining 4,361 (90.1%) are enrolled in public schools. The age group of 3 to 4 year olds has the highest likelihood of being enrolled in private schools, with 119 (43.6% in the age bracket) enrolled. Conversely, the age group of 20 to 24 year olds has the lowest likelihood of being enrolled in a private school, with 353 (97.5% in the age bracket) attending a public institution.
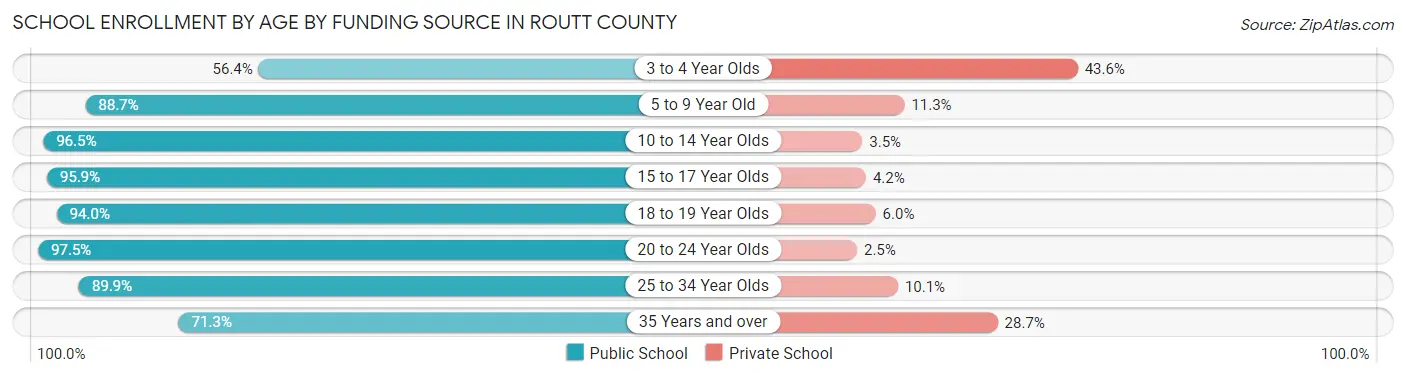
| Age Bracket | Public School | Private School |
| 3 to 4 Year Olds | 154 (56.4%) | 119 (43.6%) |
| 5 to 9 Year Old | 1,253 (88.7%) | 160 (11.3%) |
| 10 to 14 Year Olds | 1,109 (96.5%) | 40 (3.5%) |
| 15 to 17 Year Olds | 716 (95.9%) | 31 (4.2%) |
| 18 to 19 Year Olds | 426 (94.0%) | 27 (6.0%) |
| 20 to 24 Year Olds | 353 (97.5%) | 9 (2.5%) |
| 25 to 34 Year Olds | 160 (89.9%) | 18 (10.1%) |
| 35 Years and over | 189 (71.3%) | 76 (28.7%) |
| Total | 4,361 (90.1%) | 479 (9.9%) |
Educational Attainment by Field of Study in Routt County
Business (1,880 | 18.1%), science & technology (1,264 | 12.2%), bio, nature & agricultural (1,199 | 11.5%), social sciences (932 | 9.0%), and education (793 | 7.6%) are the most common fields of study among 10,392 individuals in Routt County who have obtained a bachelor's degree or higher.
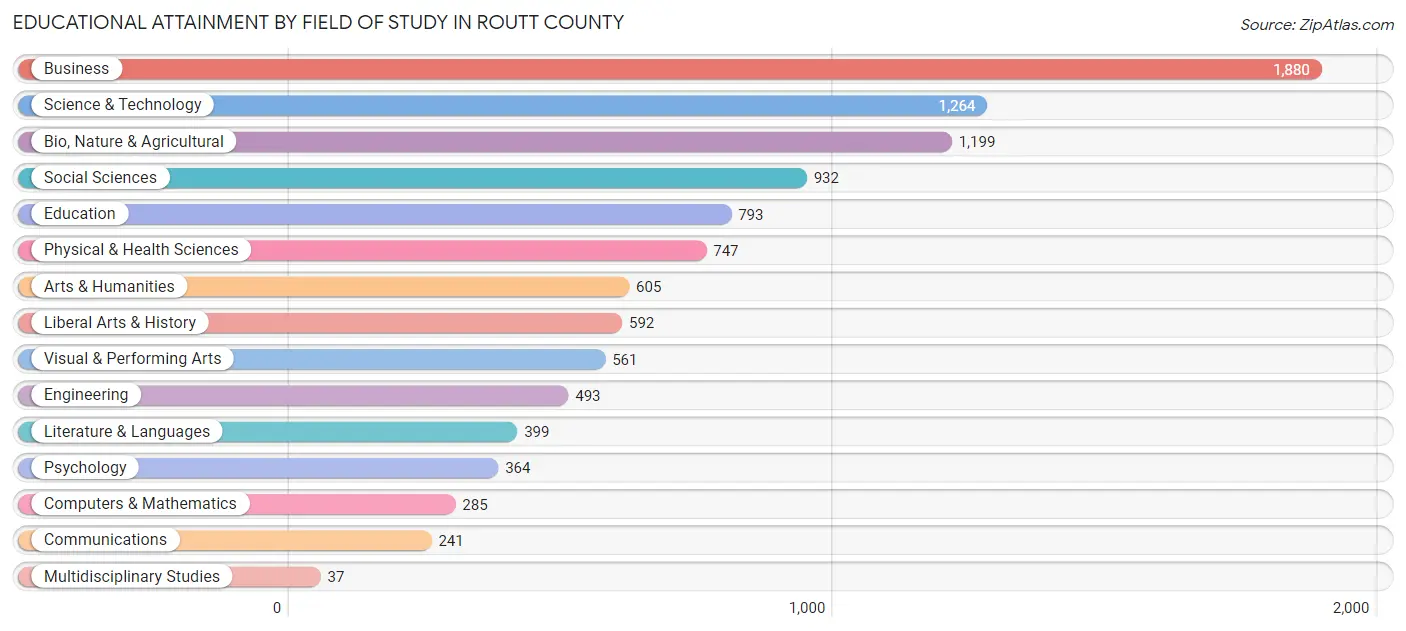
| Field of Study | # Graduates | % Graduates |
| Computers & Mathematics | 285 | 2.7% |
| Bio, Nature & Agricultural | 1,199 | 11.5% |
| Physical & Health Sciences | 747 | 7.2% |
| Psychology | 364 | 3.5% |
| Social Sciences | 932 | 9.0% |
| Engineering | 493 | 4.7% |
| Multidisciplinary Studies | 37 | 0.4% |
| Science & Technology | 1,264 | 12.2% |
| Business | 1,880 | 18.1% |
| Education | 793 | 7.6% |
| Literature & Languages | 399 | 3.8% |
| Liberal Arts & History | 592 | 5.7% |
| Visual & Performing Arts | 561 | 5.4% |
| Communications | 241 | 2.3% |
| Arts & Humanities | 605 | 5.8% |
| Total | 10,392 | 100.0% |
Transportation & Commute in Routt County
Vehicle Availability by Sex in Routt County
The most prevalent vehicle ownership categories in Routt County are males with 2 vehicles (3,072, accounting for 41.4%) and females with 2 vehicles (2,487, making up 50.1%).
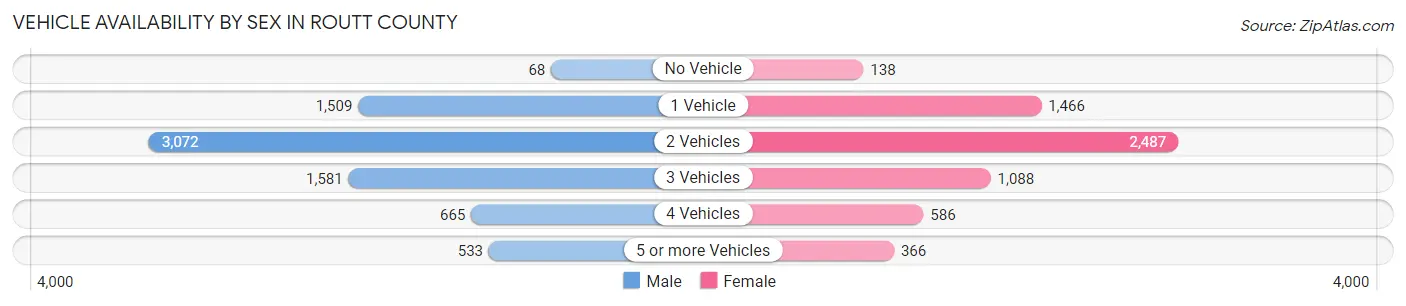
| Vehicles Available | Male | Female |
| No Vehicle | 68 (0.9%) | 138 (2.2%) |
| 1 Vehicle | 1,509 (20.3%) | 1,466 (23.9%) |
| 2 Vehicles | 3,072 (41.4%) | 2,487 (40.6%) |
| 3 Vehicles | 1,581 (21.3%) | 1,088 (17.7%) |
| 4 Vehicles | 665 (8.9%) | 586 (9.6%) |
| 5 or more Vehicles | 533 (7.2%) | 366 (6.0%) |
| Total | 7,428 (100.0%) | 6,131 (100.0%) |
Commute Time in Routt County
The most frequently occuring commute durations in Routt County are 5 to 9 minutes (2,793 commuters, 24.3%), 10 to 14 minutes (2,104 commuters, 18.3%), and 30 to 34 minutes (1,454 commuters, 12.7%).
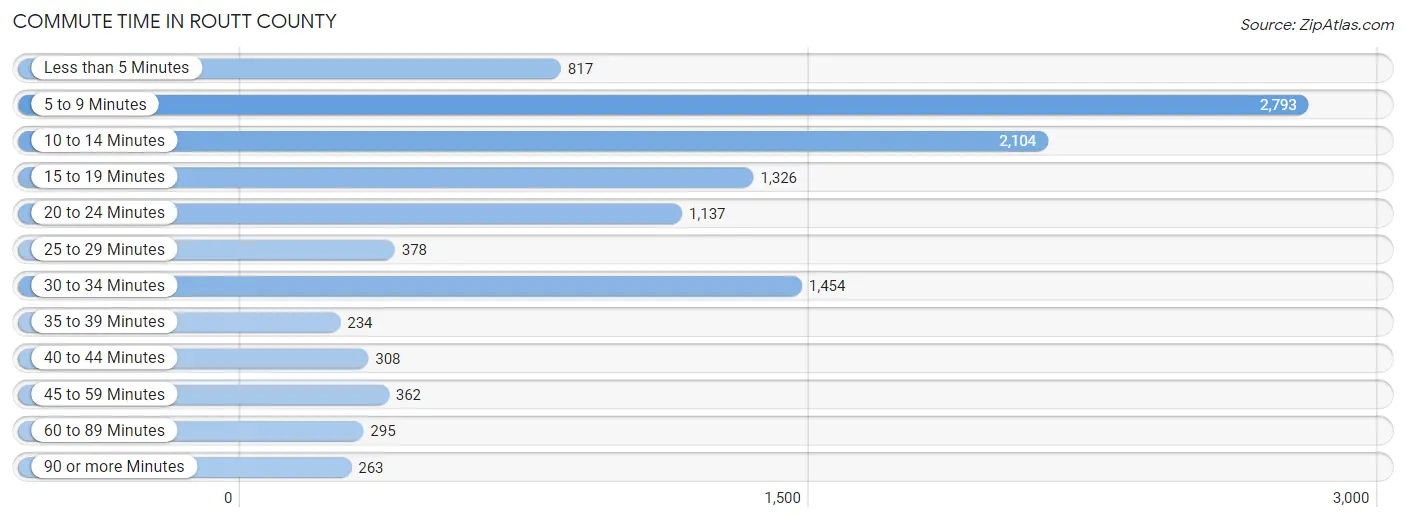
| Commute Time | # Commuters | % Commuters |
| Less than 5 Minutes | 817 | 7.1% |
| 5 to 9 Minutes | 2,793 | 24.3% |
| 10 to 14 Minutes | 2,104 | 18.3% |
| 15 to 19 Minutes | 1,326 | 11.6% |
| 20 to 24 Minutes | 1,137 | 9.9% |
| 25 to 29 Minutes | 378 | 3.3% |
| 30 to 34 Minutes | 1,454 | 12.7% |
| 35 to 39 Minutes | 234 | 2.0% |
| 40 to 44 Minutes | 308 | 2.7% |
| 45 to 59 Minutes | 362 | 3.2% |
| 60 to 89 Minutes | 295 | 2.6% |
| 90 or more Minutes | 263 | 2.3% |
Commute Time by Sex in Routt County
The most common commute times in Routt County are 5 to 9 minutes (1,648 commuters, 26.7%) for males and 5 to 9 minutes (1,145 commuters, 21.6%) for females.
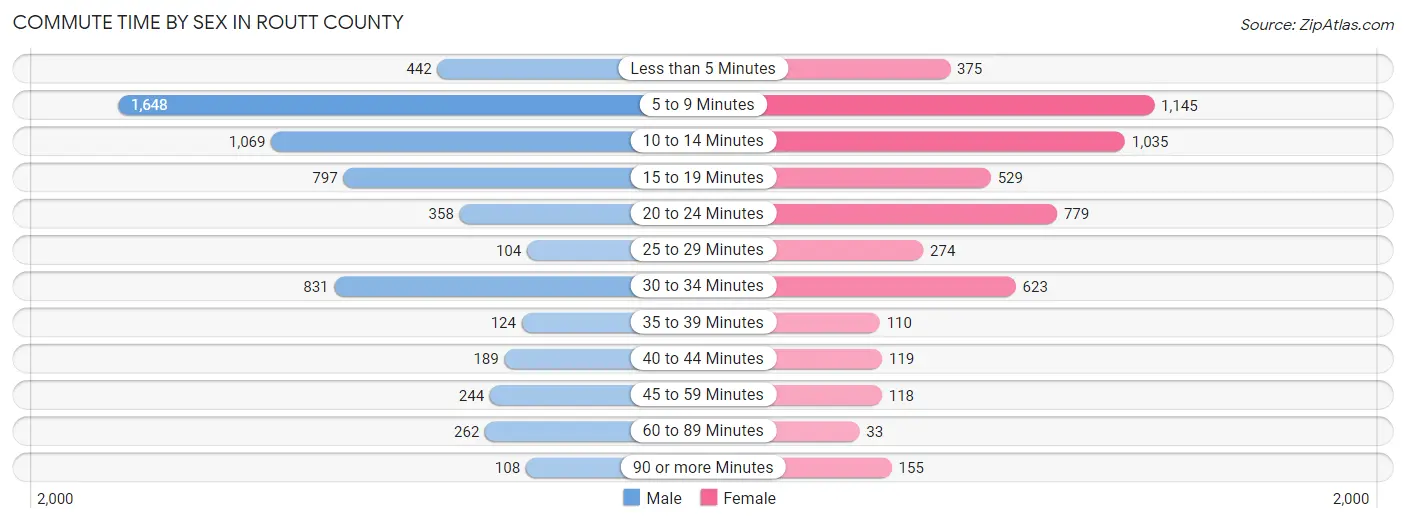
| Commute Time | Male | Female |
| Less than 5 Minutes | 442 (7.2%) | 375 (7.1%) |
| 5 to 9 Minutes | 1,648 (26.7%) | 1,145 (21.6%) |
| 10 to 14 Minutes | 1,069 (17.3%) | 1,035 (19.6%) |
| 15 to 19 Minutes | 797 (12.9%) | 529 (10.0%) |
| 20 to 24 Minutes | 358 (5.8%) | 779 (14.7%) |
| 25 to 29 Minutes | 104 (1.7%) | 274 (5.2%) |
| 30 to 34 Minutes | 831 (13.5%) | 623 (11.8%) |
| 35 to 39 Minutes | 124 (2.0%) | 110 (2.1%) |
| 40 to 44 Minutes | 189 (3.1%) | 119 (2.2%) |
| 45 to 59 Minutes | 244 (4.0%) | 118 (2.2%) |
| 60 to 89 Minutes | 262 (4.2%) | 33 (0.6%) |
| 90 or more Minutes | 108 (1.8%) | 155 (2.9%) |
Time of Departure to Work by Sex in Routt County
The most frequent times of departure to work in Routt County are 7:30 AM to 7:59 AM (1,301, 21.1%) for males and 7:30 AM to 7:59 AM (1,120, 21.1%) for females.
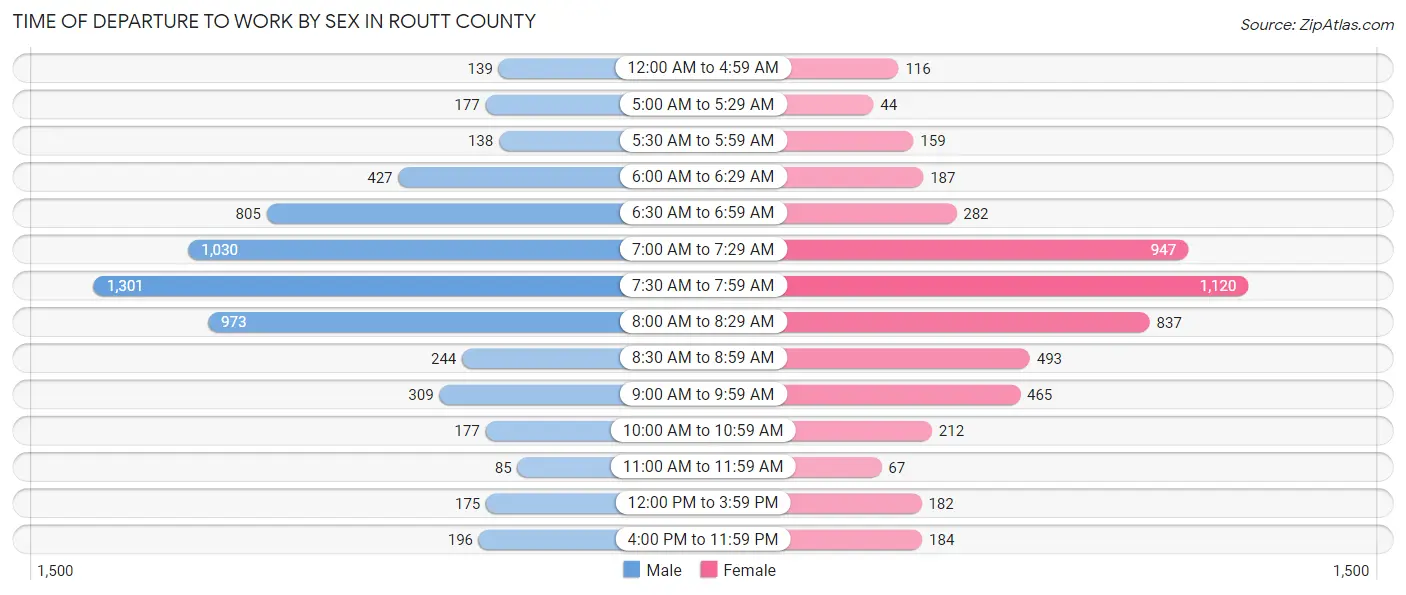
| Time of Departure | Male | Female |
| 12:00 AM to 4:59 AM | 139 (2.2%) | 116 (2.2%) |
| 5:00 AM to 5:29 AM | 177 (2.9%) | 44 (0.8%) |
| 5:30 AM to 5:59 AM | 138 (2.2%) | 159 (3.0%) |
| 6:00 AM to 6:29 AM | 427 (6.9%) | 187 (3.5%) |
| 6:30 AM to 6:59 AM | 805 (13.0%) | 282 (5.3%) |
| 7:00 AM to 7:29 AM | 1,030 (16.7%) | 947 (17.9%) |
| 7:30 AM to 7:59 AM | 1,301 (21.1%) | 1,120 (21.1%) |
| 8:00 AM to 8:29 AM | 973 (15.8%) | 837 (15.8%) |
| 8:30 AM to 8:59 AM | 244 (4.0%) | 493 (9.3%) |
| 9:00 AM to 9:59 AM | 309 (5.0%) | 465 (8.8%) |
| 10:00 AM to 10:59 AM | 177 (2.9%) | 212 (4.0%) |
| 11:00 AM to 11:59 AM | 85 (1.4%) | 67 (1.3%) |
| 12:00 PM to 3:59 PM | 175 (2.8%) | 182 (3.4%) |
| 4:00 PM to 11:59 PM | 196 (3.2%) | 184 (3.5%) |
| Total | 6,176 (100.0%) | 5,295 (100.0%) |
Housing Occupancy in Routt County
Occupancy by Ownership in Routt County
Of the total 10,279 dwellings in Routt County, owner-occupied units account for 7,863 (76.5%), while renter-occupied units make up 2,416 (23.5%).
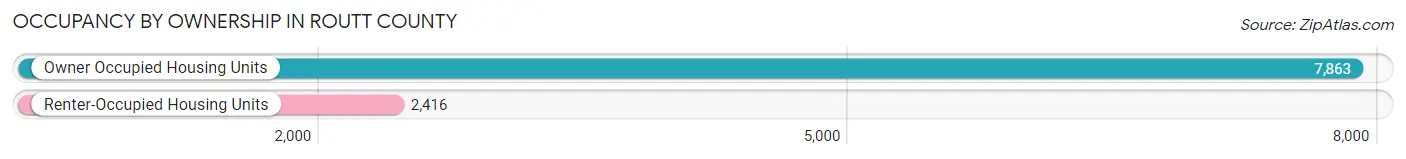
| Occupancy | # Housing Units | % Housing Units |
| Owner Occupied Housing Units | 7,863 | 76.5% |
| Renter-Occupied Housing Units | 2,416 | 23.5% |
| Total Occupied Housing Units | 10,279 | 100.0% |
Occupancy by Household Size in Routt County
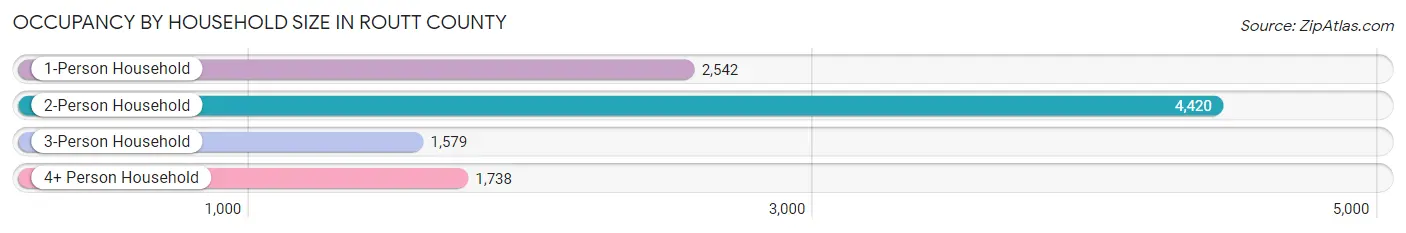
| Household Size | # Housing Units | % Housing Units |
| 1-Person Household | 2,542 | 24.7% |
| 2-Person Household | 4,420 | 43.0% |
| 3-Person Household | 1,579 | 15.4% |
| 4+ Person Household | 1,738 | 16.9% |
| Total Housing Units | 10,279 | 100.0% |
Occupancy by Ownership by Household Size in Routt County
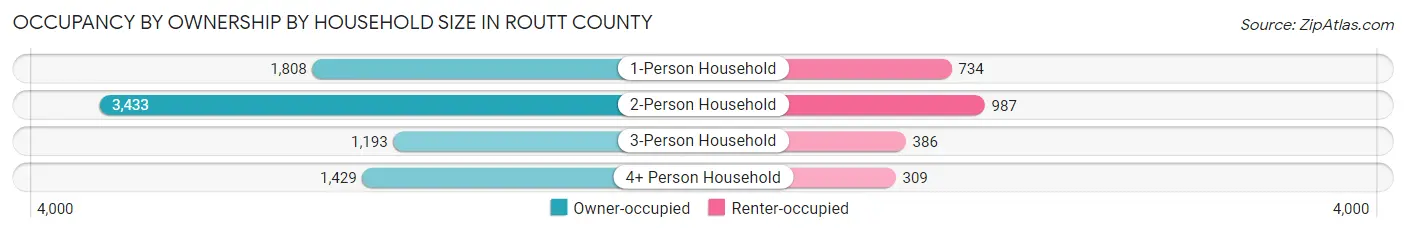
| Household Size | Owner-occupied | Renter-occupied |
| 1-Person Household | 1,808 (71.1%) | 734 (28.9%) |
| 2-Person Household | 3,433 (77.7%) | 987 (22.3%) |
| 3-Person Household | 1,193 (75.5%) | 386 (24.4%) |
| 4+ Person Household | 1,429 (82.2%) | 309 (17.8%) |
| Total Housing Units | 7,863 (76.5%) | 2,416 (23.5%) |
Occupancy by Educational Attainment in Routt County
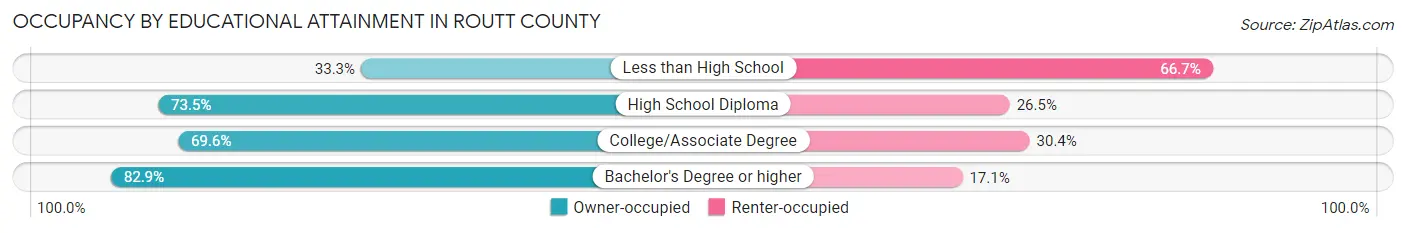
| Household Size | Owner-occupied | Renter-occupied |
| Less than High School | 76 (33.3%) | 152 (66.7%) |
| High School Diploma | 1,119 (73.5%) | 403 (26.5%) |
| College/Associate Degree | 2,100 (69.6%) | 918 (30.4%) |
| Bachelor's Degree or higher | 4,568 (82.9%) | 943 (17.1%) |
Occupancy by Age of Householder in Routt County
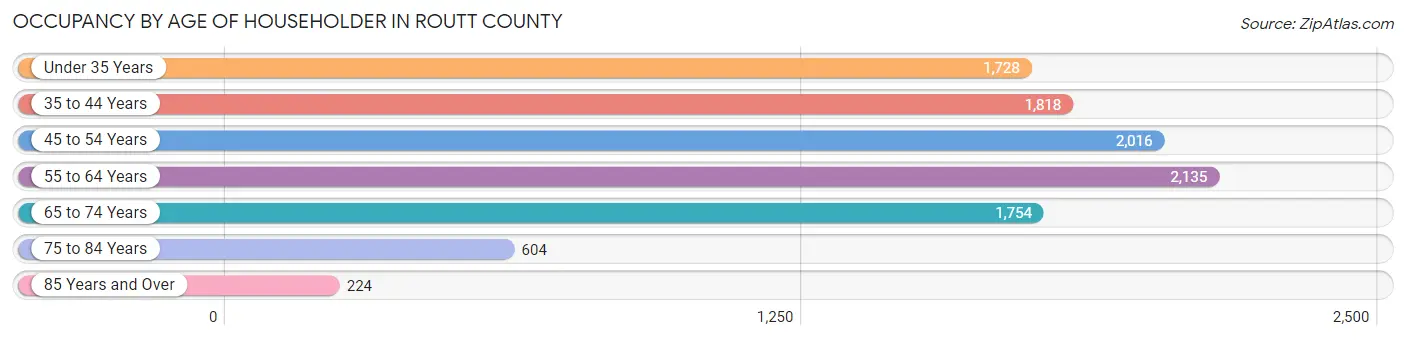
| Age Bracket | # Households | % Households |
| Under 35 Years | 1,728 | 16.8% |
| 35 to 44 Years | 1,818 | 17.7% |
| 45 to 54 Years | 2,016 | 19.6% |
| 55 to 64 Years | 2,135 | 20.8% |
| 65 to 74 Years | 1,754 | 17.1% |
| 75 to 84 Years | 604 | 5.9% |
| 85 Years and Over | 224 | 2.2% |
| Total | 10,279 | 100.0% |
Housing Finances in Routt County
Median Income by Occupancy in Routt County
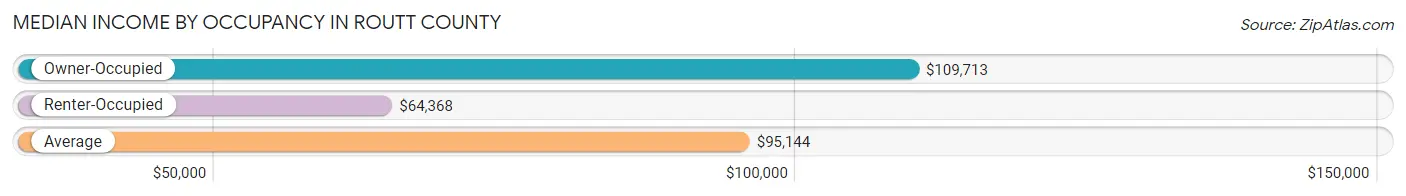
| Occupancy Type | # Households | Median Income |
| Owner-Occupied | 7,863 (76.5%) | $109,713 |
| Renter-Occupied | 2,416 (23.5%) | $64,368 |
| Average | 10,279 (100.0%) | $95,144 |
Occupancy by Householder Income Bracket in Routt County
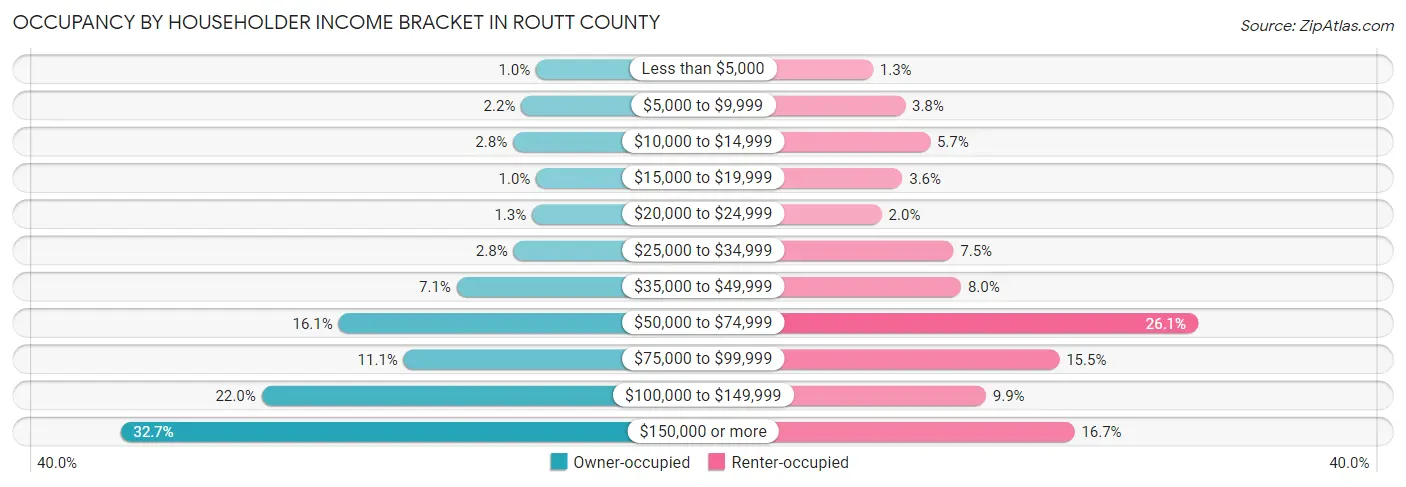
| Income Bracket | Owner-occupied | Renter-occupied |
| Less than $5,000 | 81 (1.0%) | 32 (1.3%) |
| $5,000 to $9,999 | 170 (2.2%) | 91 (3.8%) |
| $10,000 to $14,999 | 219 (2.8%) | 137 (5.7%) |
| $15,000 to $19,999 | 80 (1.0%) | 86 (3.6%) |
| $20,000 to $24,999 | 105 (1.3%) | 48 (2.0%) |
| $25,000 to $34,999 | 216 (2.8%) | 180 (7.4%) |
| $35,000 to $49,999 | 557 (7.1%) | 194 (8.0%) |
| $50,000 to $74,999 | 1,264 (16.1%) | 630 (26.1%) |
| $75,000 to $99,999 | 874 (11.1%) | 375 (15.5%) |
| $100,000 to $149,999 | 1,726 (22.0%) | 240 (9.9%) |
| $150,000 or more | 2,571 (32.7%) | 403 (16.7%) |
| Total | 7,863 (100.0%) | 2,416 (100.0%) |
Monthly Housing Cost Tiers in Routt County
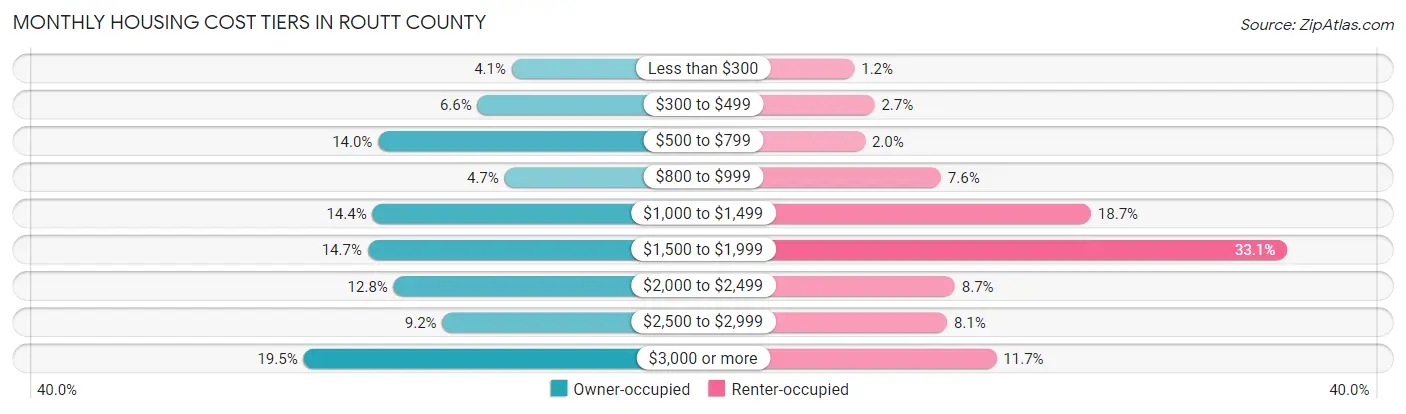
| Monthly Cost | Owner-occupied | Renter-occupied |
| Less than $300 | 324 (4.1%) | 30 (1.2%) |
| $300 to $499 | 522 (6.6%) | 66 (2.7%) |
| $500 to $799 | 1,098 (14.0%) | 49 (2.0%) |
| $800 to $999 | 366 (4.6%) | 184 (7.6%) |
| $1,000 to $1,499 | 1,131 (14.4%) | 451 (18.7%) |
| $1,500 to $1,999 | 1,158 (14.7%) | 800 (33.1%) |
| $2,000 to $2,499 | 1,008 (12.8%) | 209 (8.6%) |
| $2,500 to $2,999 | 726 (9.2%) | 195 (8.1%) |
| $3,000 or more | 1,530 (19.5%) | 283 (11.7%) |
| Total | 7,863 (100.0%) | 2,416 (100.0%) |
Physical Housing Characteristics in Routt County
Housing Structures in Routt County
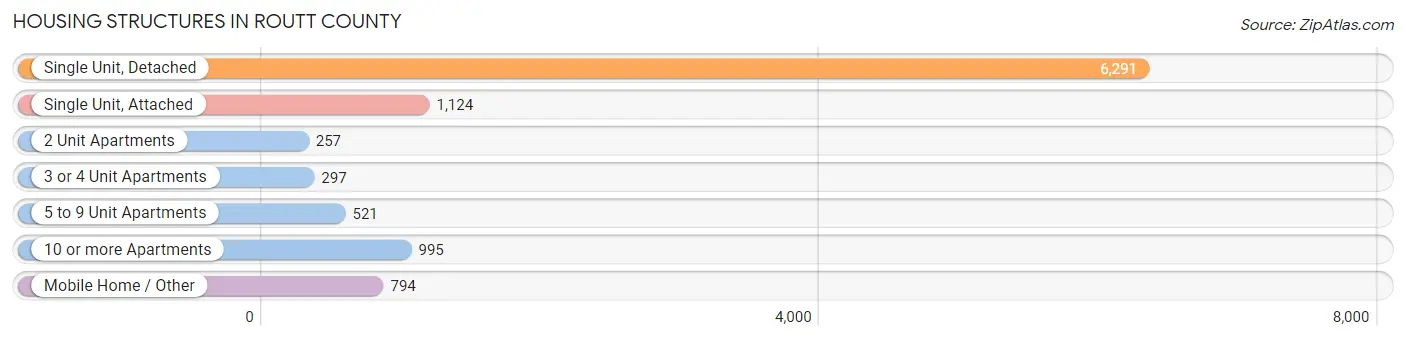
| Structure Type | # Housing Units | % Housing Units |
| Single Unit, Detached | 6,291 | 61.2% |
| Single Unit, Attached | 1,124 | 10.9% |
| 2 Unit Apartments | 257 | 2.5% |
| 3 or 4 Unit Apartments | 297 | 2.9% |
| 5 to 9 Unit Apartments | 521 | 5.1% |
| 10 or more Apartments | 995 | 9.7% |
| Mobile Home / Other | 794 | 7.7% |
| Total | 10,279 | 100.0% |
Housing Structures by Occupancy in Routt County
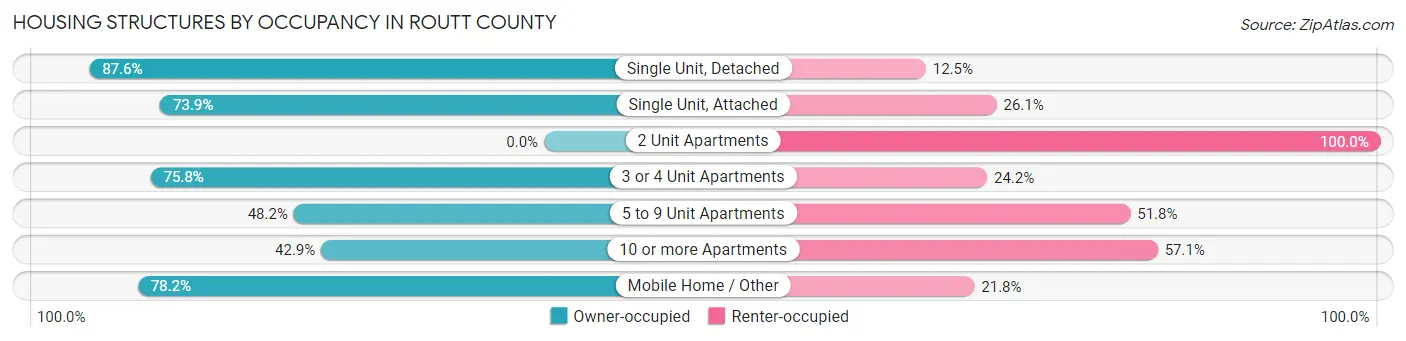
| Structure Type | Owner-occupied | Renter-occupied |
| Single Unit, Detached | 5,508 (87.5%) | 783 (12.4%) |
| Single Unit, Attached | 831 (73.9%) | 293 (26.1%) |
| 2 Unit Apartments | 0 (0.0%) | 257 (100.0%) |
| 3 or 4 Unit Apartments | 225 (75.8%) | 72 (24.2%) |
| 5 to 9 Unit Apartments | 251 (48.2%) | 270 (51.8%) |
| 10 or more Apartments | 427 (42.9%) | 568 (57.1%) |
| Mobile Home / Other | 621 (78.2%) | 173 (21.8%) |
| Total | 7,863 (76.5%) | 2,416 (23.5%) |
Housing Structures by Number of Rooms in Routt County
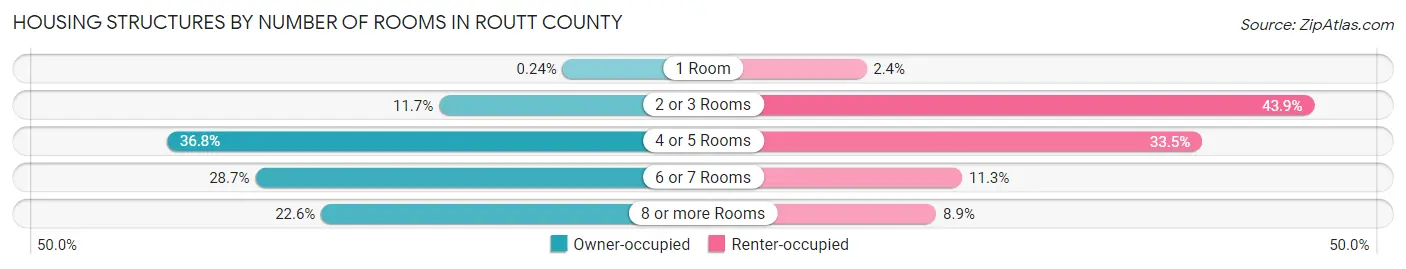
| Number of Rooms | Owner-occupied | Renter-occupied |
| 1 Room | 19 (0.2%) | 59 (2.4%) |
| 2 or 3 Rooms | 918 (11.7%) | 1,060 (43.9%) |
| 4 or 5 Rooms | 2,897 (36.8%) | 809 (33.5%) |
| 6 or 7 Rooms | 2,254 (28.7%) | 273 (11.3%) |
| 8 or more Rooms | 1,775 (22.6%) | 215 (8.9%) |
| Total | 7,863 (100.0%) | 2,416 (100.0%) |
Housing Structure by Heating Type in Routt County
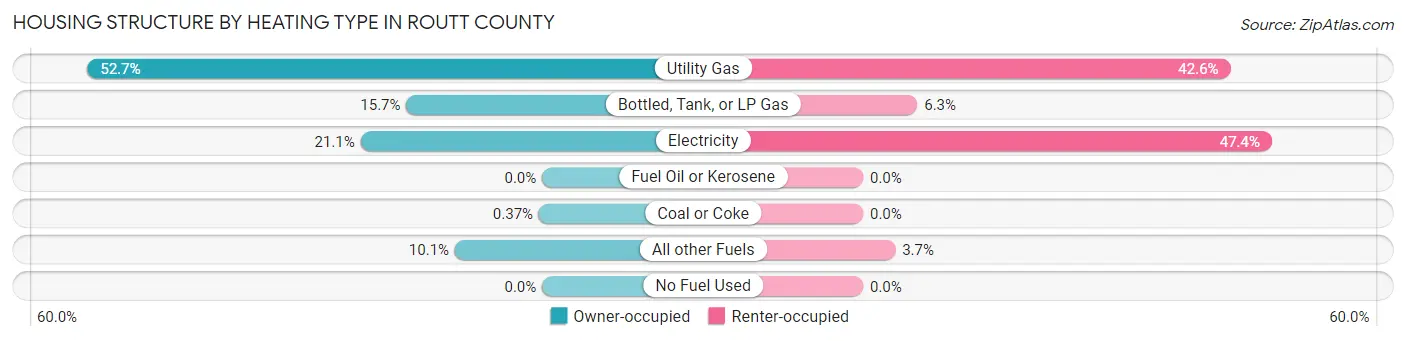
| Heating Type | Owner-occupied | Renter-occupied |
| Utility Gas | 4,146 (52.7%) | 1,029 (42.6%) |
| Bottled, Tank, or LP Gas | 1,238 (15.7%) | 152 (6.3%) |
| Electricity | 1,655 (21.0%) | 1,145 (47.4%) |
| Fuel Oil or Kerosene | 0 (0.0%) | 0 (0.0%) |
| Coal or Coke | 29 (0.4%) | 0 (0.0%) |
| All other Fuels | 795 (10.1%) | 90 (3.7%) |
| No Fuel Used | 0 (0.0%) | 0 (0.0%) |
| Total | 7,863 (100.0%) | 2,416 (100.0%) |
Household Vehicle Usage in Routt County
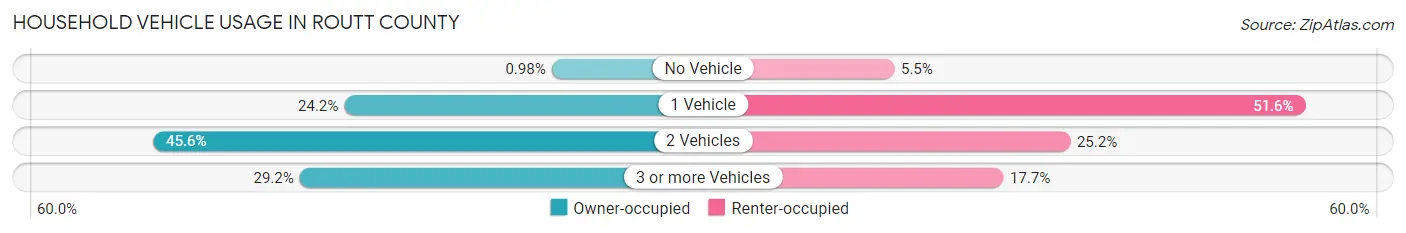
| Vehicles per Household | Owner-occupied | Renter-occupied |
| No Vehicle | 77 (1.0%) | 133 (5.5%) |
| 1 Vehicle | 1,904 (24.2%) | 1,246 (51.6%) |
| 2 Vehicles | 3,586 (45.6%) | 609 (25.2%) |
| 3 or more Vehicles | 2,296 (29.2%) | 428 (17.7%) |
| Total | 7,863 (100.0%) | 2,416 (100.0%) |
Real Estate & Mortgages in Routt County
Real Estate and Mortgage Overview in Routt County
| Characteristic | Without Mortgage | With Mortgage |
| Housing Units | 2,693 | 5,170 |
| Median Property Value | $658,800 | $704,100 |
| Median Household Income | $77,083 | $1,985 |
| Monthly Housing Costs | $680 | $1,512 |
| Real Estate Taxes | $2,271 | $50 |
Property Value by Mortgage Status in Routt County
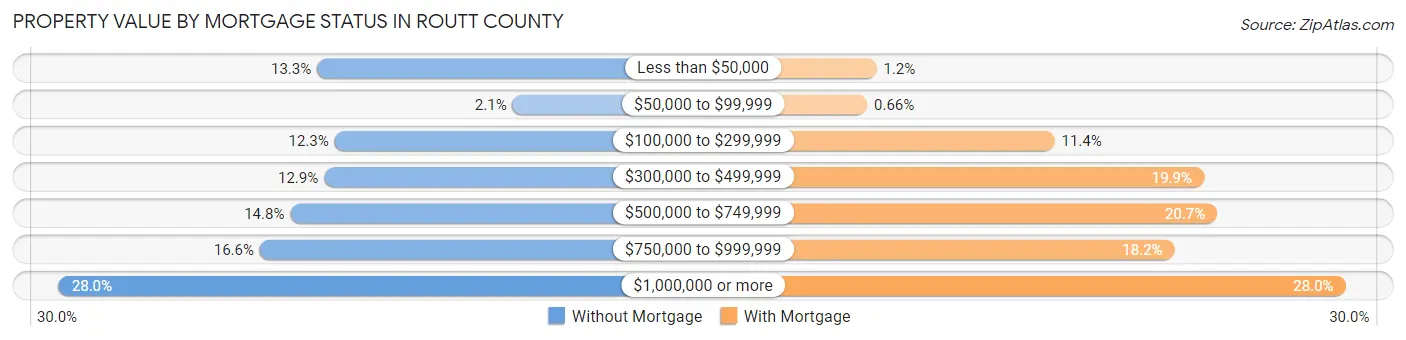
| Property Value | Without Mortgage | With Mortgage |
| Less than $50,000 | 358 (13.3%) | 62 (1.2%) |
| $50,000 to $99,999 | 57 (2.1%) | 34 (0.7%) |
| $100,000 to $299,999 | 331 (12.3%) | 588 (11.4%) |
| $300,000 to $499,999 | 347 (12.9%) | 1,029 (19.9%) |
| $500,000 to $749,999 | 399 (14.8%) | 1,068 (20.7%) |
| $750,000 to $999,999 | 446 (16.6%) | 942 (18.2%) |
| $1,000,000 or more | 755 (28.0%) | 1,447 (28.0%) |
| Total | 2,693 (100.0%) | 5,170 (100.0%) |
Household Income by Mortgage Status in Routt County
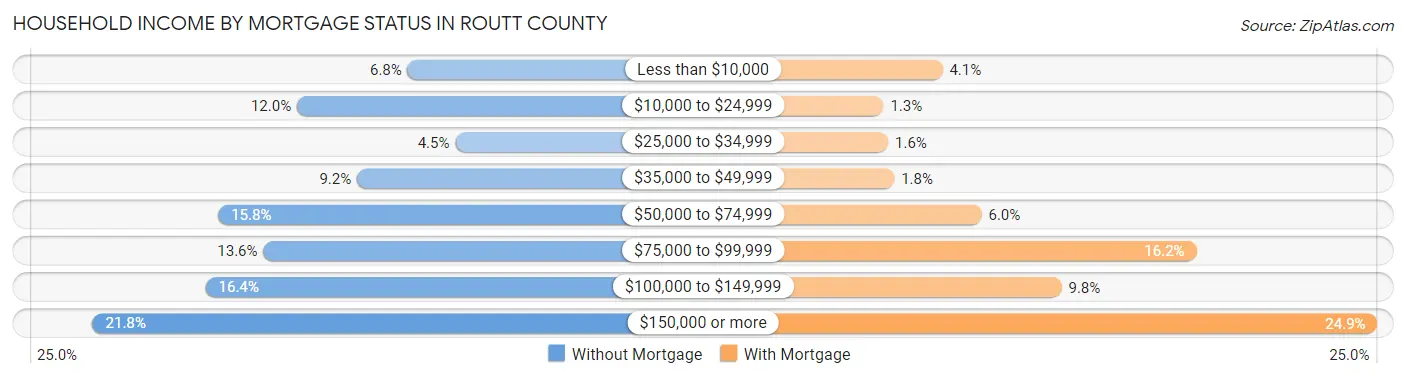
| Household Income | Without Mortgage | With Mortgage |
| Less than $10,000 | 182 (6.8%) | 214 (4.1%) |
| $10,000 to $24,999 | 324 (12.0%) | 69 (1.3%) |
| $25,000 to $34,999 | 121 (4.5%) | 80 (1.5%) |
| $35,000 to $49,999 | 247 (9.2%) | 95 (1.8%) |
| $50,000 to $74,999 | 425 (15.8%) | 310 (6.0%) |
| $75,000 to $99,999 | 367 (13.6%) | 839 (16.2%) |
| $100,000 to $149,999 | 441 (16.4%) | 507 (9.8%) |
| $150,000 or more | 586 (21.8%) | 1,285 (24.8%) |
| Total | 2,693 (100.0%) | 5,170 (100.0%) |
Property Value to Household Income Ratio in Routt County
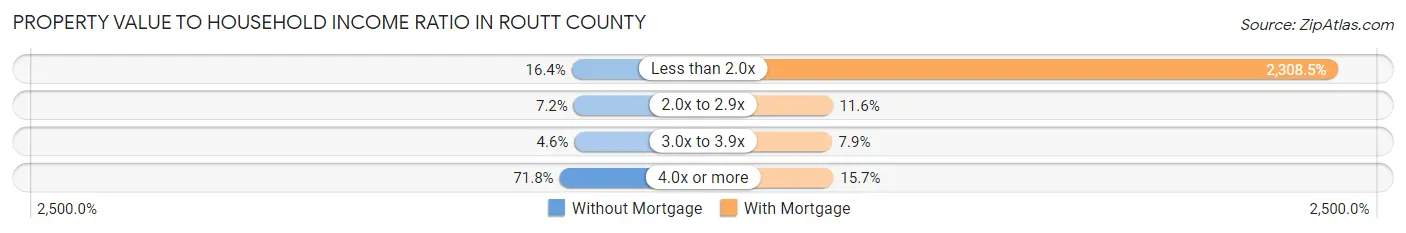
| Value-to-Income Ratio | Without Mortgage | With Mortgage |
| Less than 2.0x | 441 (16.4%) | 119,349 (2,308.5%) |
| 2.0x to 2.9x | 195 (7.2%) | 598 (11.6%) |
| 3.0x to 3.9x | 124 (4.6%) | 407 (7.9%) |
| 4.0x or more | 1,933 (71.8%) | 811 (15.7%) |
| Total | 2,693 (100.0%) | 5,170 (100.0%) |
Real Estate Taxes by Mortgage Status in Routt County
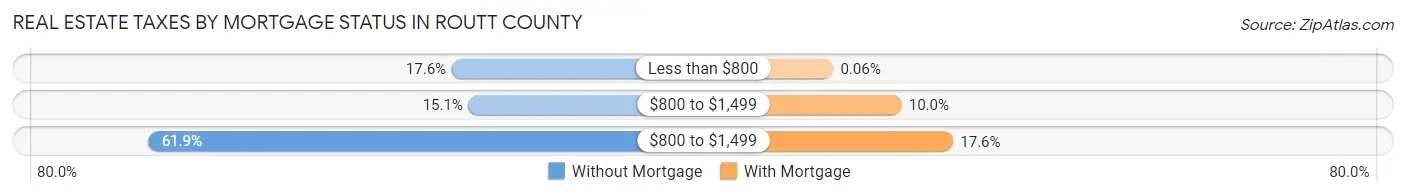
| Property Taxes | Without Mortgage | With Mortgage |
| Less than $800 | 473 (17.6%) | 3 (0.1%) |
| $800 to $1,499 | 407 (15.1%) | 519 (10.0%) |
| $800 to $1,499 | 1,666 (61.9%) | 909 (17.6%) |
| Total | 2,693 (100.0%) | 5,170 (100.0%) |
Health & Disability in Routt County
Health Insurance Coverage by Age in Routt County
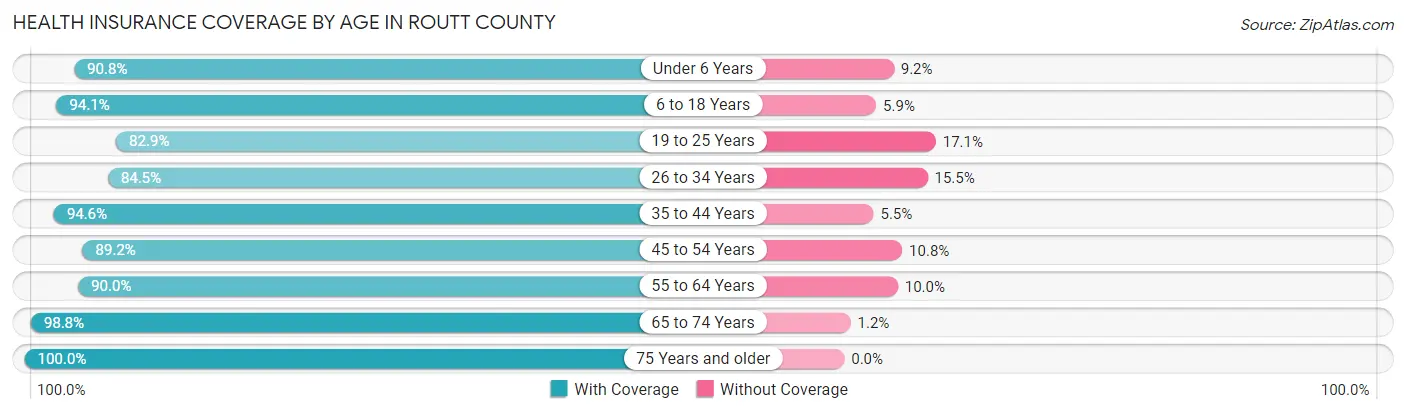
| Age Bracket | With Coverage | Without Coverage |
| Under 6 Years | 1,190 (90.8%) | 121 (9.2%) |
| 6 to 18 Years | 3,231 (94.1%) | 204 (5.9%) |
| 19 to 25 Years | 1,628 (82.9%) | 335 (17.1%) |
| 26 to 34 Years | 2,523 (84.5%) | 464 (15.5%) |
| 35 to 44 Years | 3,417 (94.6%) | 197 (5.4%) |
| 45 to 54 Years | 3,126 (89.2%) | 378 (10.8%) |
| 55 to 64 Years | 3,427 (90.0%) | 380 (10.0%) |
| 65 to 74 Years | 2,940 (98.8%) | 35 (1.2%) |
| 75 Years and older | 1,182 (100.0%) | 0 (0.0%) |
| Total | 22,664 (91.5%) | 2,114 (8.5%) |
Health Insurance Coverage by Citizenship Status in Routt County
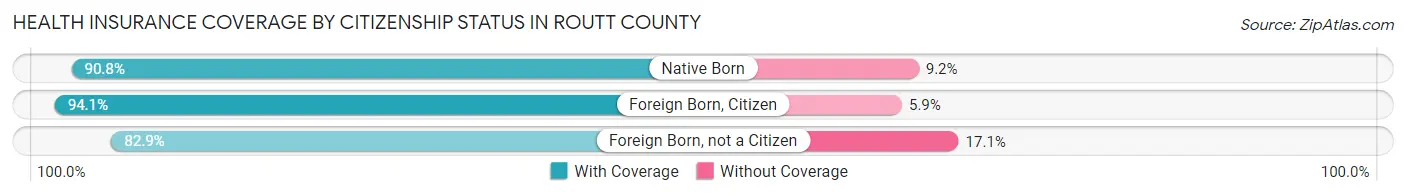
| Citizenship Status | With Coverage | Without Coverage |
| Native Born | 1,190 (90.8%) | 121 (9.2%) |
| Foreign Born, Citizen | 3,231 (94.1%) | 204 (5.9%) |
| Foreign Born, not a Citizen | 1,628 (82.9%) | 335 (17.1%) |
Health Insurance Coverage by Household Income in Routt County
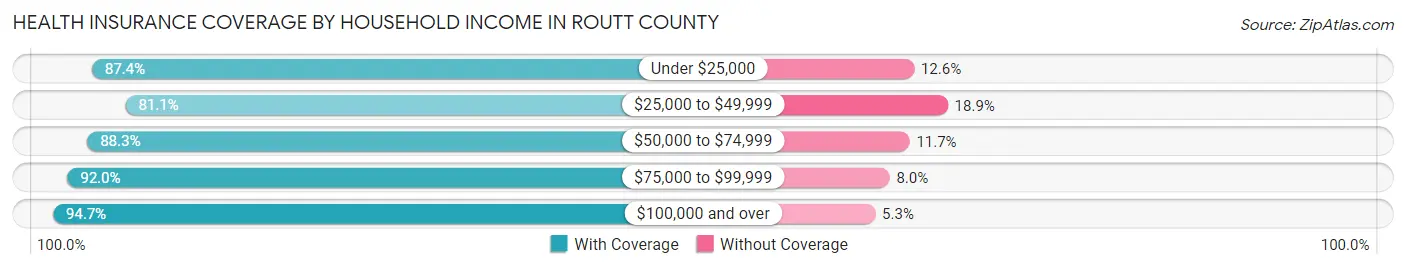
| Household Income | With Coverage | Without Coverage |
| Under $25,000 | 1,513 (87.4%) | 218 (12.6%) |
| $25,000 to $49,999 | 1,850 (81.1%) | 431 (18.9%) |
| $50,000 to $74,999 | 3,489 (88.3%) | 464 (11.7%) |
| $75,000 to $99,999 | 2,816 (92.0%) | 245 (8.0%) |
| $100,000 and over | 12,737 (94.7%) | 714 (5.3%) |
Public vs Private Health Insurance Coverage by Age in Routt County
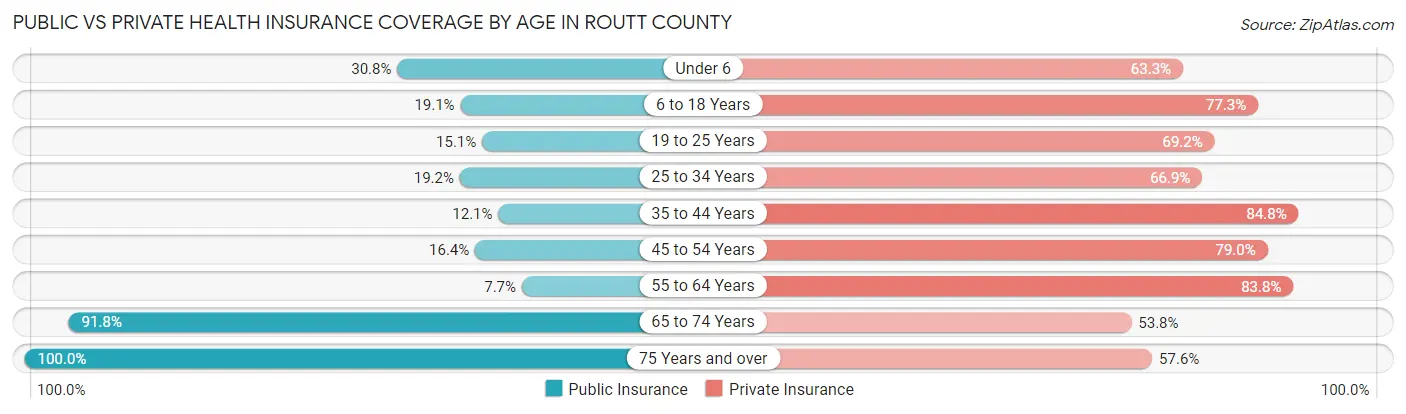
| Age Bracket | Public Insurance | Private Insurance |
| Under 6 | 404 (30.8%) | 830 (63.3%) |
| 6 to 18 Years | 656 (19.1%) | 2,654 (77.3%) |
| 19 to 25 Years | 296 (15.1%) | 1,358 (69.2%) |
| 25 to 34 Years | 574 (19.2%) | 1,998 (66.9%) |
| 35 to 44 Years | 436 (12.1%) | 3,064 (84.8%) |
| 45 to 54 Years | 574 (16.4%) | 2,769 (79.0%) |
| 55 to 64 Years | 293 (7.7%) | 3,190 (83.8%) |
| 65 to 74 Years | 2,732 (91.8%) | 1,599 (53.7%) |
| 75 Years and over | 1,182 (100.0%) | 681 (57.6%) |
| Total | 7,147 (28.8%) | 18,143 (73.2%) |
Disability Status by Sex by Age in Routt County
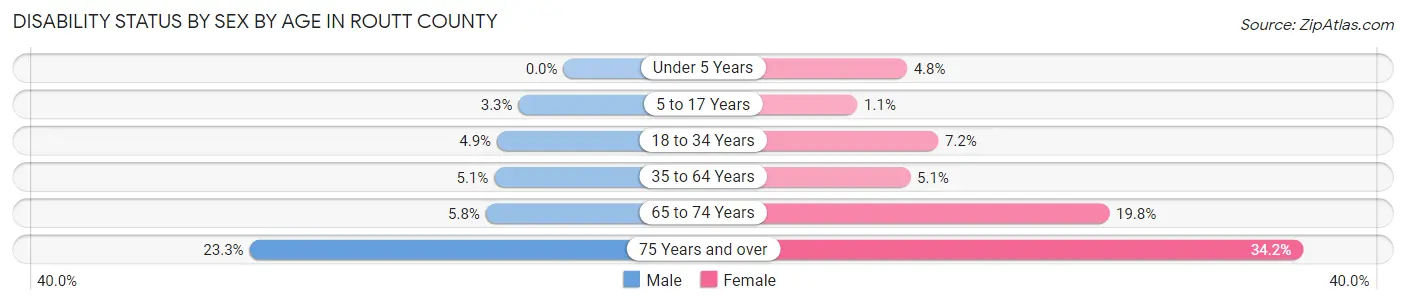
| Age Bracket | Male | Female |
| Under 5 Years | 0 (0.0%) | 26 (4.8%) |
| 5 to 17 Years | 59 (3.3%) | 18 (1.1%) |
| 18 to 34 Years | 148 (4.9%) | 166 (7.1%) |
| 35 to 64 Years | 288 (5.1%) | 270 (5.1%) |
| 65 to 74 Years | 92 (5.8%) | 274 (19.8%) |
| 75 Years and over | 138 (23.3%) | 202 (34.2%) |
Disability Class by Sex by Age in Routt County
Disability Class: Hearing Difficulty
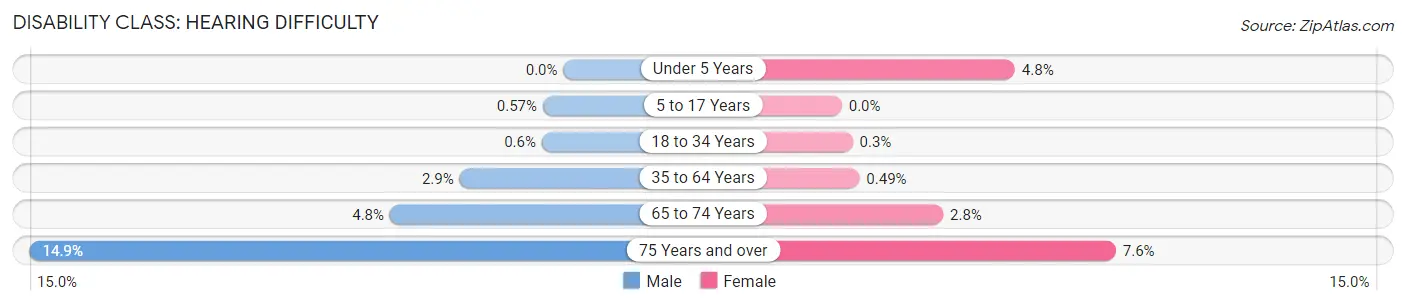
| Age Bracket | Male | Female |
| Under 5 Years | 0 (0.0%) | 26 (4.8%) |
| 5 to 17 Years | 10 (0.6%) | 0 (0.0%) |
| 18 to 34 Years | 18 (0.6%) | 7 (0.3%) |
| 35 to 64 Years | 162 (2.9%) | 26 (0.5%) |
| 65 to 74 Years | 77 (4.8%) | 39 (2.8%) |
| 75 Years and over | 88 (14.9%) | 45 (7.6%) |
Disability Class: Vision Difficulty
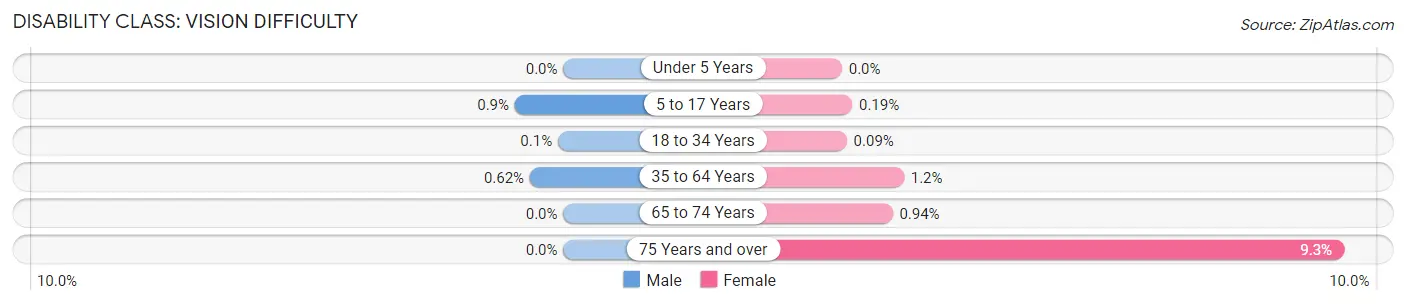
| Age Bracket | Male | Female |
| Under 5 Years | 0 (0.0%) | 0 (0.0%) |
| 5 to 17 Years | 16 (0.9%) | 3 (0.2%) |
| 18 to 34 Years | 3 (0.1%) | 2 (0.1%) |
| 35 to 64 Years | 35 (0.6%) | 61 (1.1%) |
| 65 to 74 Years | 0 (0.0%) | 13 (0.9%) |
| 75 Years and over | 0 (0.0%) | 55 (9.3%) |
Disability Class: Cognitive Difficulty
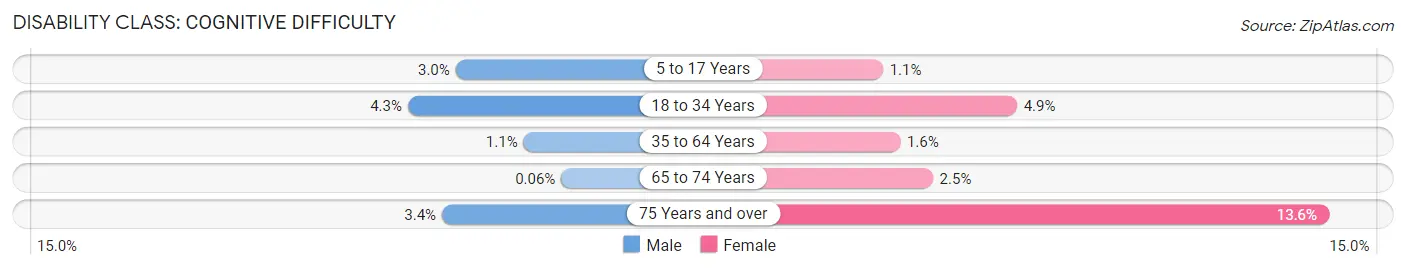
| Age Bracket | Male | Female |
| 5 to 17 Years | 53 (3.0%) | 18 (1.1%) |
| 18 to 34 Years | 130 (4.3%) | 113 (4.9%) |
| 35 to 64 Years | 62 (1.1%) | 86 (1.6%) |
| 65 to 74 Years | 1 (0.1%) | 35 (2.5%) |
| 75 Years and over | 20 (3.4%) | 80 (13.6%) |
Disability Class: Ambulatory Difficulty
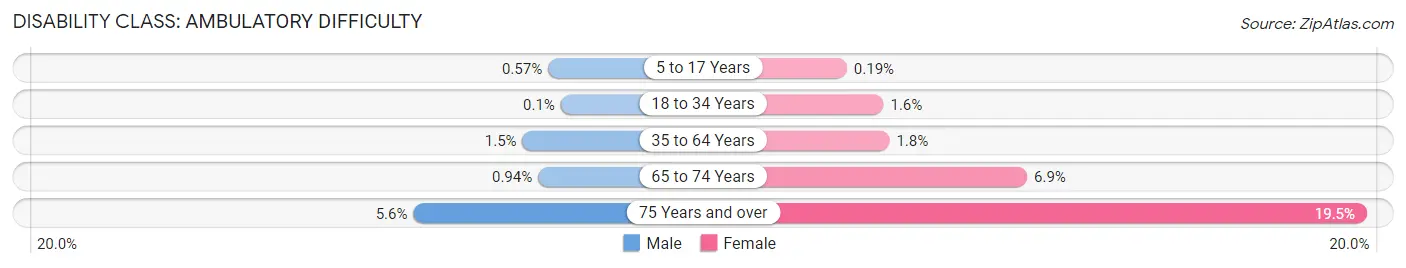
| Age Bracket | Male | Female |
| 5 to 17 Years | 10 (0.6%) | 3 (0.2%) |
| 18 to 34 Years | 3 (0.1%) | 36 (1.5%) |
| 35 to 64 Years | 85 (1.5%) | 94 (1.8%) |
| 65 to 74 Years | 15 (0.9%) | 95 (6.9%) |
| 75 Years and over | 33 (5.6%) | 115 (19.5%) |
Disability Class: Self-Care Difficulty
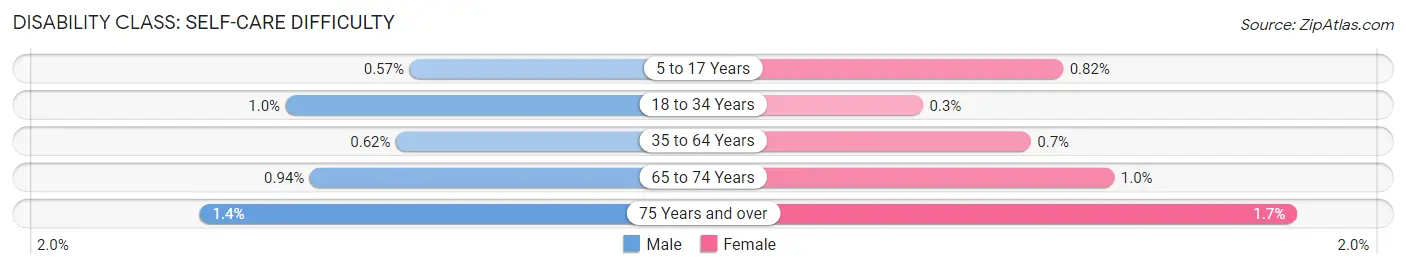
| Age Bracket | Male | Female |
| 5 to 17 Years | 10 (0.6%) | 13 (0.8%) |
| 18 to 34 Years | 31 (1.0%) | 7 (0.3%) |
| 35 to 64 Years | 35 (0.6%) | 37 (0.7%) |
| 65 to 74 Years | 15 (0.9%) | 14 (1.0%) |
| 75 Years and over | 8 (1.3%) | 10 (1.7%) |
Technology Access in Routt County
Computing Device Access in Routt County
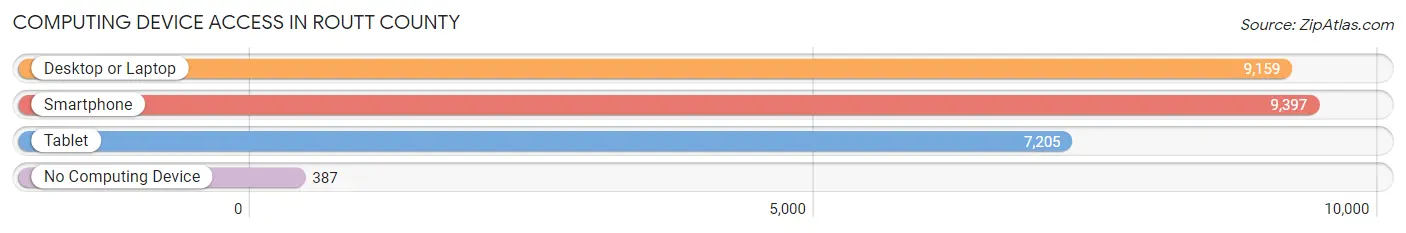
| Device Type | # Households | % Households |
| Desktop or Laptop | 9,159 | 89.1% |
| Smartphone | 9,397 | 91.4% |
| Tablet | 7,205 | 70.1% |
| No Computing Device | 387 | 3.8% |
| Total | 10,279 | 100.0% |
Internet Access in Routt County
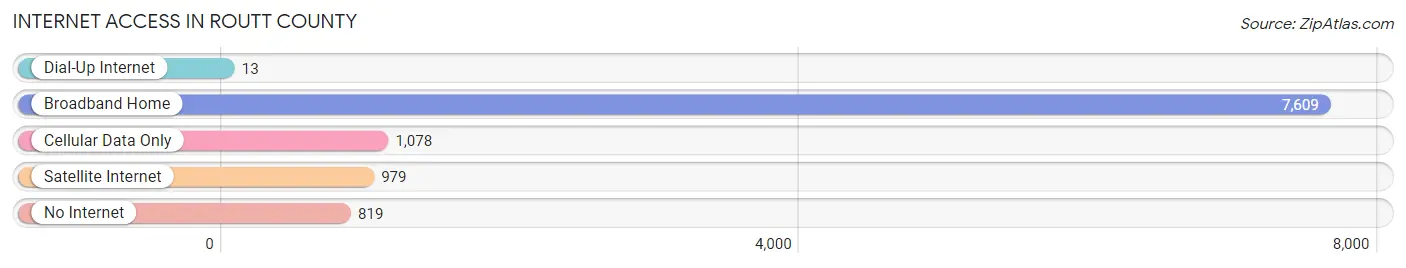
| Internet Type | # Households | % Households |
| Dial-Up Internet | 13 | 0.1% |
| Broadband Home | 7,609 | 74.0% |
| Cellular Data Only | 1,078 | 10.5% |
| Satellite Internet | 979 | 9.5% |
| No Internet | 819 | 8.0% |
| Total | 10,279 | 100.0% |
Routt County Summary
Routt County is a county located in the northwestern part of the state of Colorado in the United States. It is the seventh-most populous of the 64 counties in the state. As of the 2010 census, the population was 23,509. The county seat is Steamboat Springs. The county was named after John Long Routt, the first Governor of Colorado.
Geography
Routt County is located in the northwestern part of Colorado, bordered by Jackson County to the north, Grand County to the east, Moffat County to the south, and Rio Blanco County to the west. The county covers an area of 2,368 square miles, making it the fourth-largest county in the state. The county is located in the Rocky Mountains and is home to several mountain ranges, including the Park Range, the Flat Tops, and the Zirkel Mountains. The Yampa River runs through the county, and the county is home to several reservoirs, including Stagecoach Reservoir, Pearl Lake, and Steamboat Lake.
Demographics
As of the 2010 census, there were 23,509 people, 9,945 households, and 6,717 families residing in the county. The population density was 10 people per square mile. There were 11,845 housing units at an average density of 5 per square mile. The racial makeup of the county was 94.2% White, 0.3% Black or African American, 0.7% Native American, 0.7% Asian, 0.1% Pacific Islander, 2.3% from other races, and 1.9% from two or more races. 6.7% of the population were Hispanic or Latino of any race.
Economy
Routt County is a rural county with a diverse economy. The county is home to several industries, including agriculture, tourism, and energy production. Agriculture is the largest industry in the county, with cattle, hay, and wheat being the primary crops. Tourism is also a major industry in the county, with Steamboat Springs being a popular destination for skiing and other outdoor activities. The county is also home to several energy production facilities, including coal mines, natural gas wells, and wind farms.
History
Routt County was established in 1861 as part of the Colorado Territory. The county was named after John Long Routt, the first Governor of Colorado. The county was originally populated by Native American tribes, including the Ute, Arapaho, and Shoshone. The first settlers arrived in the area in the late 1800s, and the county was officially organized in 1889. The county experienced rapid growth in the early 1900s, with the establishment of several towns, including Steamboat Springs, Hayden, and Oak Creek. The county continued to grow throughout the 20th century, and today it is home to several ski resorts, including Steamboat Ski Resort and Howelsen Hill Ski Area.
Common Questions
What is the Total Population of Routt County?
Total Population of Routt County is 24,944.
What is the Total Male Population of Routt County?
Total Male Population of Routt County is 13,144.
What is the Total Female Population of Routt County?
Total Female Population of Routt County is 11,800.
What is the Ratio of Males per 100 Females in Routt County?
There are 111.39 Males per 100 Females in Routt County.
What is the Ratio of Females per 100 Males in Routt County?
There are 89.77 Females per 100 Males in Routt County.
What is the Median Population Age in Routt County?
Median Population Age in Routt County is 41.9 Years.
What is the Average Family Size in Routt County
Average Family Size in Routt County is 2.8 People.
What is the Average Household Size in Routt County
Average Household Size in Routt County is 2.4 People.
What is Per Capita Income in Routt County?
Per Capita income in Routt County is $58,304.
What is the Median Family Income in Routt County?
Median Family Income in Routt County is $116,203.
What is the Median Household income in Routt County?
Median Household Income in Routt County is $95,144.
What is Income or Wage Gap in Routt County?
Income or Wage Gap in Routt County is 29.1%.
Women in Routt County earn 70.9 cents for every dollar earned by a man.
What is Inequality or Gini Index in Routt County?
Inequality or Gini Index in Routt County is 0.47.
How Large is the Labor Force in Routt County?
There are 14,265 People in the Labor Forcein in Routt County.
What is the Percentage of People in the Labor Force in Routt County?
67.7% of People are in the Labor Force in Routt County.
What is the Unemployment Rate in Routt County?
Unemployment Rate in Routt County is 2.9%.