Pueblo County, CO
Pueblo County Map
Pueblo County Overview
168,135
TOTAL POPULATION
83,410
MALE POPULATION
84,725
FEMALE POPULATION
98.45
MALES / 100 FEMALES
101.58
FEMALES / 100 MALES
39.8
MEDIAN AGE
3.1
AVG FAMILY SIZE
2.4
AVG HOUSEHOLD SIZE
$31,513
PER CAPITA INCOME
$73,803
AVG FAMILY INCOME
$59,436
AVG HOUSEHOLD INCOME
24.8%
WAGE / INCOME GAP [ % ]
75.2¢/ $1
WAGE / INCOME GAP [ $ ]
$10,306
FAMILY INCOME DEFICIT
0.45
INEQUALITY / GINI INDEX
75,372
LABOR FORCE [ PEOPLE ]
55.8%
PERCENT IN LABOR FORCE
5.9%
UNEMPLOYMENT RATE
Pueblo County Area Codes
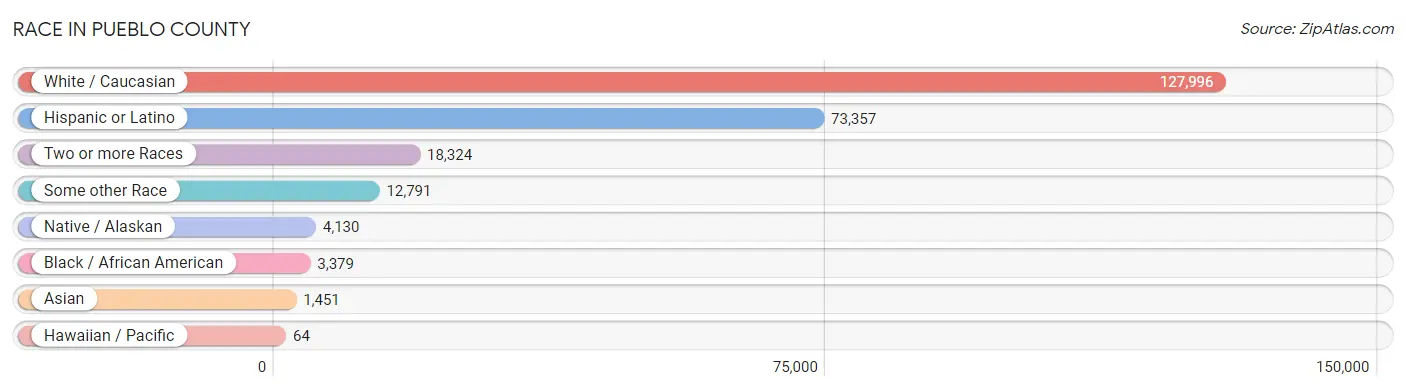
Race in Pueblo County
The most populous races in Pueblo County are White / Caucasian (127,996 | 76.1%), Hispanic or Latino (73,357 | 43.6%), and Two or more Races (18,324 | 10.9%).
| Race | # Population | % Population |
| Asian | 1,451 | 0.9% |
| Black / African American | 3,379 | 2.0% |
| Hawaiian / Pacific | 64 | 0.0% |
| Hispanic or Latino | 73,357 | 43.6% |
| Native / Alaskan | 4,130 | 2.5% |
| White / Caucasian | 127,996 | 76.1% |
| Two or more Races | 18,324 | 10.9% |
| Some other Race | 12,791 | 7.6% |
| Total | 168,135 | 100.0% |
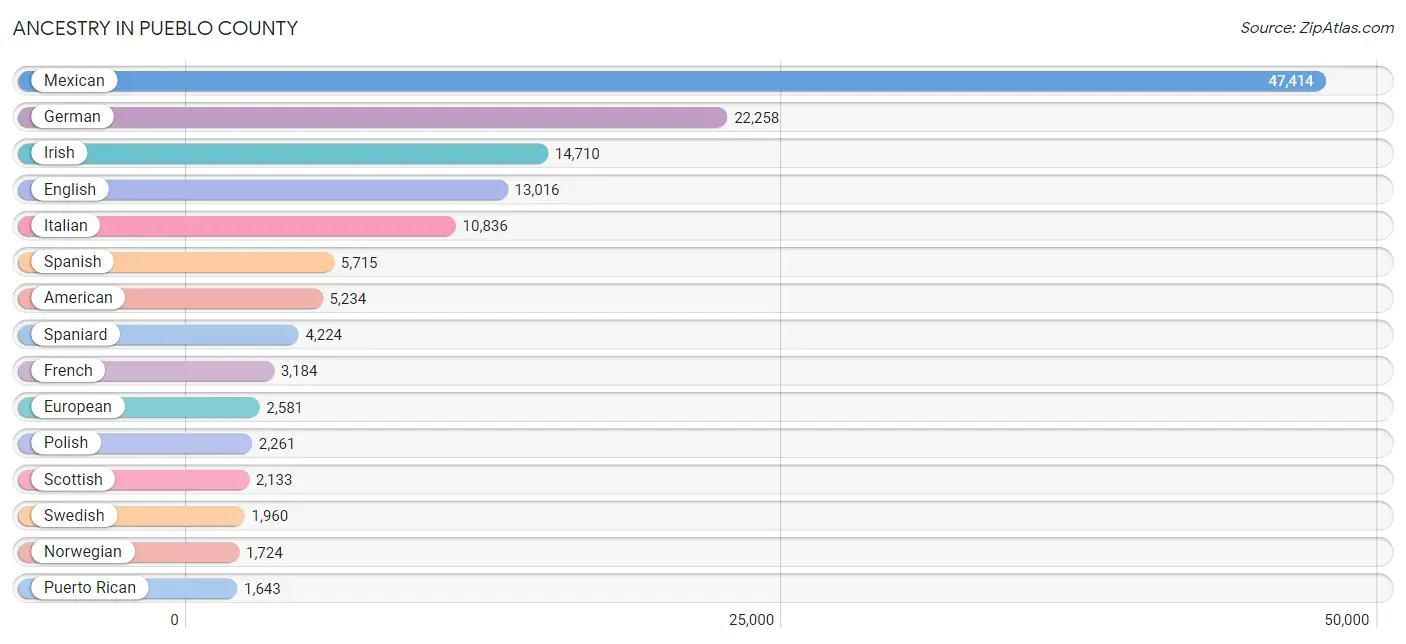
Ancestry in Pueblo County
The most populous ancestries reported in Pueblo County are Mexican (47,414 | 28.2%), German (22,258 | 13.2%), Irish (14,710 | 8.7%), English (13,016 | 7.7%), and Italian (10,836 | 6.4%), together accounting for 64.4% of all Pueblo County residents.
| Ancestry | # Population | % Population |
| African | 88 | 0.1% |
| Albanian | 5 | 0.0% |
| Aleut | 37 | 0.0% |
| American | 5,234 | 3.1% |
| Apache | 1,186 | 0.7% |
| Arab | 365 | 0.2% |
| Arapaho | 6 | 0.0% |
| Argentinean | 214 | 0.1% |
| Armenian | 12 | 0.0% |
| Austrian | 361 | 0.2% |
| Basque | 45 | 0.0% |
| Belgian | 55 | 0.0% |
| Bhutanese | 518 | 0.3% |
| Blackfeet | 122 | 0.1% |
| Bolivian | 23 | 0.0% |
| Brazilian | 188 | 0.1% |
| British | 588 | 0.4% |
| Burmese | 606 | 0.4% |
| Cajun | 7 | 0.0% |
| Canadian | 95 | 0.1% |
| Celtic | 38 | 0.0% |
| Central American | 736 | 0.4% |
| Central American Indian | 68 | 0.0% |
| Cherokee | 1,119 | 0.7% |
| Cheyenne | 89 | 0.1% |
| Chickasaw | 189 | 0.1% |
| Chilean | 49 | 0.0% |
| Chippewa | 124 | 0.1% |
| Choctaw | 133 | 0.1% |
| Colombian | 74 | 0.0% |
| Comanche | 200 | 0.1% |
| Costa Rican | 128 | 0.1% |
| Creek | 17 | 0.0% |
| Croatian | 166 | 0.1% |
| Crow | 3 | 0.0% |
| Cuban | 373 | 0.2% |
| Czech | 586 | 0.4% |
| Czechoslovakian | 72 | 0.0% |
| Danish | 723 | 0.4% |
| Delaware | 19 | 0.0% |
| Dominican | 47 | 0.0% |
| Dutch | 1,560 | 0.9% |
| Eastern European | 283 | 0.2% |
| Egyptian | 14 | 0.0% |
| English | 13,016 | 7.7% |
| European | 2,581 | 1.5% |
| Finnish | 172 | 0.1% |
| French | 3,184 | 1.9% |
| French Canadian | 355 | 0.2% |
| German | 22,258 | 13.2% |
| Greek | 336 | 0.2% |
| Guamanian / Chamorro | 80 | 0.1% |
| Guatemalan | 106 | 0.1% |
| Honduran | 128 | 0.1% |
| Hopi | 10 | 0.0% |
| Hungarian | 434 | 0.3% |
| Icelander | 85 | 0.1% |
| Indian (Asian) | 277 | 0.2% |
| Iranian | 4 | 0.0% |
| Iraqi | 42 | 0.0% |
| Irish | 14,710 | 8.7% |
| Iroquois | 47 | 0.0% |
| Israeli | 8 | 0.0% |
| Italian | 10,836 | 6.4% |
| Jamaican | 126 | 0.1% |
| Kiowa | 13 | 0.0% |
| Korean | 896 | 0.5% |
| Laotian | 82 | 0.1% |
| Lebanese | 262 | 0.2% |
| Lithuanian | 70 | 0.0% |
| Luxembourger | 41 | 0.0% |
| Mexican | 47,414 | 28.2% |
| Mexican American Indian | 563 | 0.3% |
| Native Hawaiian | 218 | 0.1% |
| Navajo | 1,218 | 0.7% |
| Nigerian | 27 | 0.0% |
| Northern European | 182 | 0.1% |
| Norwegian | 1,724 | 1.0% |
| Okinawan | 39 | 0.0% |
| Paiute | 185 | 0.1% |
| Pakistani | 107 | 0.1% |
| Panamanian | 103 | 0.1% |
| Pennsylvania German | 42 | 0.0% |
| Peruvian | 101 | 0.1% |
| Polish | 2,261 | 1.3% |
| Portuguese | 300 | 0.2% |
| Potawatomi | 82 | 0.1% |
| Pueblo | 192 | 0.1% |
| Puerto Rican | 1,643 | 1.0% |
| Romanian | 167 | 0.1% |
| Russian | 560 | 0.3% |
| Salvadoran | 271 | 0.2% |
| Samoan | 121 | 0.1% |
| Scandinavian | 446 | 0.3% |
| Scotch-Irish | 1,413 | 0.8% |
| Scottish | 2,133 | 1.3% |
| Seminole | 55 | 0.0% |
| Serbian | 154 | 0.1% |
| Shoshone | 3 | 0.0% |
| Sioux | 181 | 0.1% |
| Slavic | 278 | 0.2% |
| Slovak | 493 | 0.3% |
| Slovene | 1,477 | 0.9% |
| Somali | 15 | 0.0% |
| South American | 483 | 0.3% |
| Spaniard | 4,224 | 2.5% |
| Spanish | 5,715 | 3.4% |
| Spanish American | 639 | 0.4% |
| Spanish American Indian | 49 | 0.0% |
| Sri Lankan | 118 | 0.1% |
| Subsaharan African | 142 | 0.1% |
| Swedish | 1,960 | 1.2% |
| Swiss | 551 | 0.3% |
| Syrian | 23 | 0.0% |
| Thai | 238 | 0.1% |
| Tohono O'Odham | 63 | 0.0% |
| Ukrainian | 29 | 0.0% |
| Ute | 140 | 0.1% |
| Venezuelan | 16 | 0.0% |
| Vietnamese | 11 | 0.0% |
| Welsh | 555 | 0.3% |
| West Indian | 8 | 0.0% |
| Yaqui | 20 | 0.0% |
| Yugoslavian | 296 | 0.2% | View All 124 Rows |
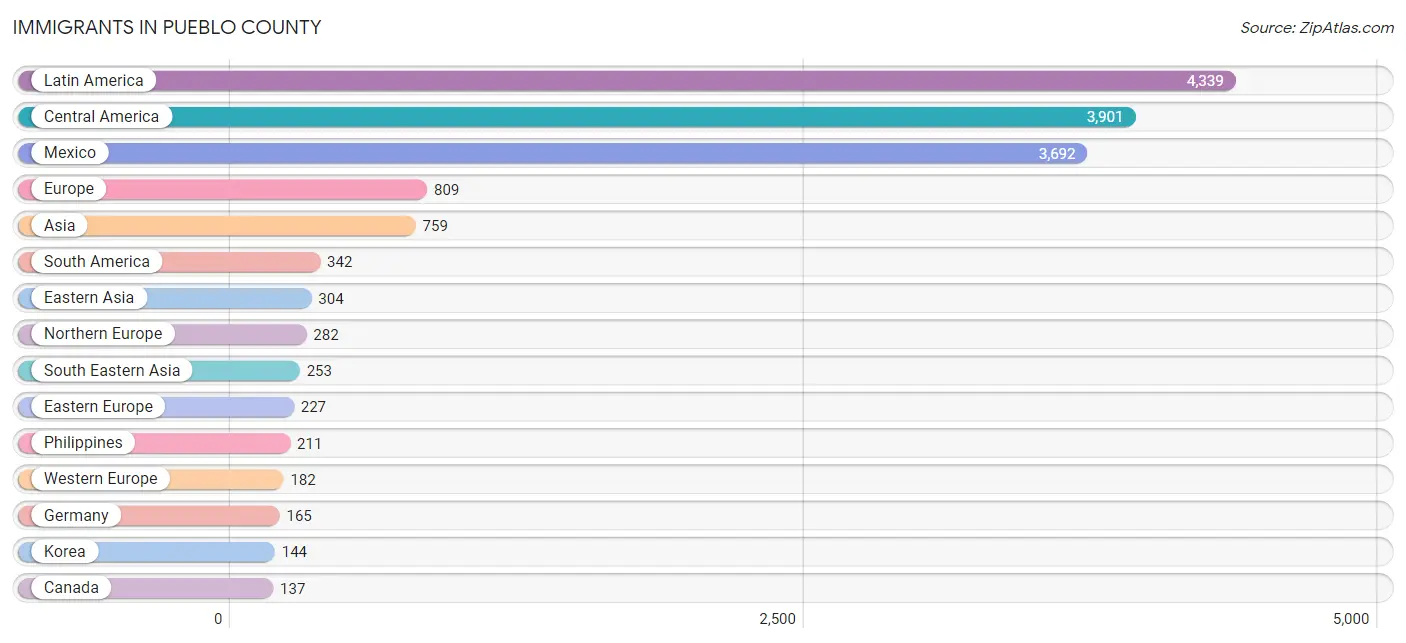
Immigrants in Pueblo County
The most numerous immigrant groups reported in Pueblo County came from Latin America (4,339 | 2.6%), Central America (3,901 | 2.3%), Mexico (3,692 | 2.2%), Europe (809 | 0.5%), and Asia (759 | 0.4%), together accounting for 8.0% of all Pueblo County residents.
| Immigration Origin | # Population | % Population |
| Africa | 121 | 0.1% |
| Albania | 5 | 0.0% |
| Argentina | 102 | 0.1% |
| Asia | 759 | 0.4% |
| Belgium | 17 | 0.0% |
| Bolivia | 23 | 0.0% |
| Brazil | 33 | 0.0% |
| Canada | 137 | 0.1% |
| Caribbean | 96 | 0.1% |
| Central America | 3,901 | 2.3% |
| Chile | 49 | 0.0% |
| China | 100 | 0.1% |
| Colombia | 54 | 0.0% |
| Congo | 7 | 0.0% |
| Costa Rica | 22 | 0.0% |
| Cuba | 76 | 0.1% |
| Czechoslovakia | 131 | 0.1% |
| Denmark | 4 | 0.0% |
| Dominican Republic | 16 | 0.0% |
| Eastern Africa | 33 | 0.0% |
| Eastern Asia | 304 | 0.2% |
| Eastern Europe | 227 | 0.1% |
| El Salvador | 104 | 0.1% |
| England | 136 | 0.1% |
| Europe | 809 | 0.5% |
| Germany | 165 | 0.1% |
| Guyana | 21 | 0.0% |
| Honduras | 9 | 0.0% |
| Hungary | 8 | 0.0% |
| India | 82 | 0.1% |
| Indonesia | 1 | 0.0% |
| Iraq | 42 | 0.0% |
| Israel | 8 | 0.0% |
| Italy | 68 | 0.0% |
| Japan | 60 | 0.0% |
| Kazakhstan | 10 | 0.0% |
| Korea | 144 | 0.1% |
| Latin America | 4,339 | 2.6% |
| Lebanon | 7 | 0.0% |
| Mexico | 3,692 | 2.2% |
| Middle Africa | 44 | 0.0% |
| Nepal | 7 | 0.0% |
| Nigeria | 17 | 0.0% |
| Northern Africa | 10 | 0.0% |
| Northern Europe | 282 | 0.2% |
| Oceania | 15 | 0.0% |
| Pakistan | 29 | 0.0% |
| Panama | 74 | 0.0% |
| Peru | 44 | 0.0% |
| Philippines | 211 | 0.1% |
| Poland | 19 | 0.0% |
| Portugal | 33 | 0.0% |
| Romania | 8 | 0.0% |
| Russia | 24 | 0.0% |
| Scotland | 85 | 0.1% |
| Serbia | 26 | 0.0% |
| South Africa | 9 | 0.0% |
| South America | 342 | 0.2% |
| South Central Asia | 133 | 0.1% |
| South Eastern Asia | 253 | 0.2% |
| Southern Europe | 118 | 0.1% |
| Spain | 17 | 0.0% |
| Sweden | 28 | 0.0% |
| Taiwan | 40 | 0.0% |
| Thailand | 13 | 0.0% |
| Trinidad and Tobago | 4 | 0.0% |
| Turkey | 8 | 0.0% |
| Ukraine | 6 | 0.0% |
| Venezuela | 16 | 0.0% |
| Vietnam | 28 | 0.0% |
| Western Africa | 17 | 0.0% |
| Western Asia | 69 | 0.0% |
| Western Europe | 182 | 0.1% |
| Zaire | 37 | 0.0% | View All 74 Rows |
Sex and Age in Pueblo County
Sex and Age in Pueblo County
The most populous age groups in Pueblo County are 10 to 14 Years (5,744 | 6.9%) for men and 60 to 64 Years (6,022 | 7.1%) for women.
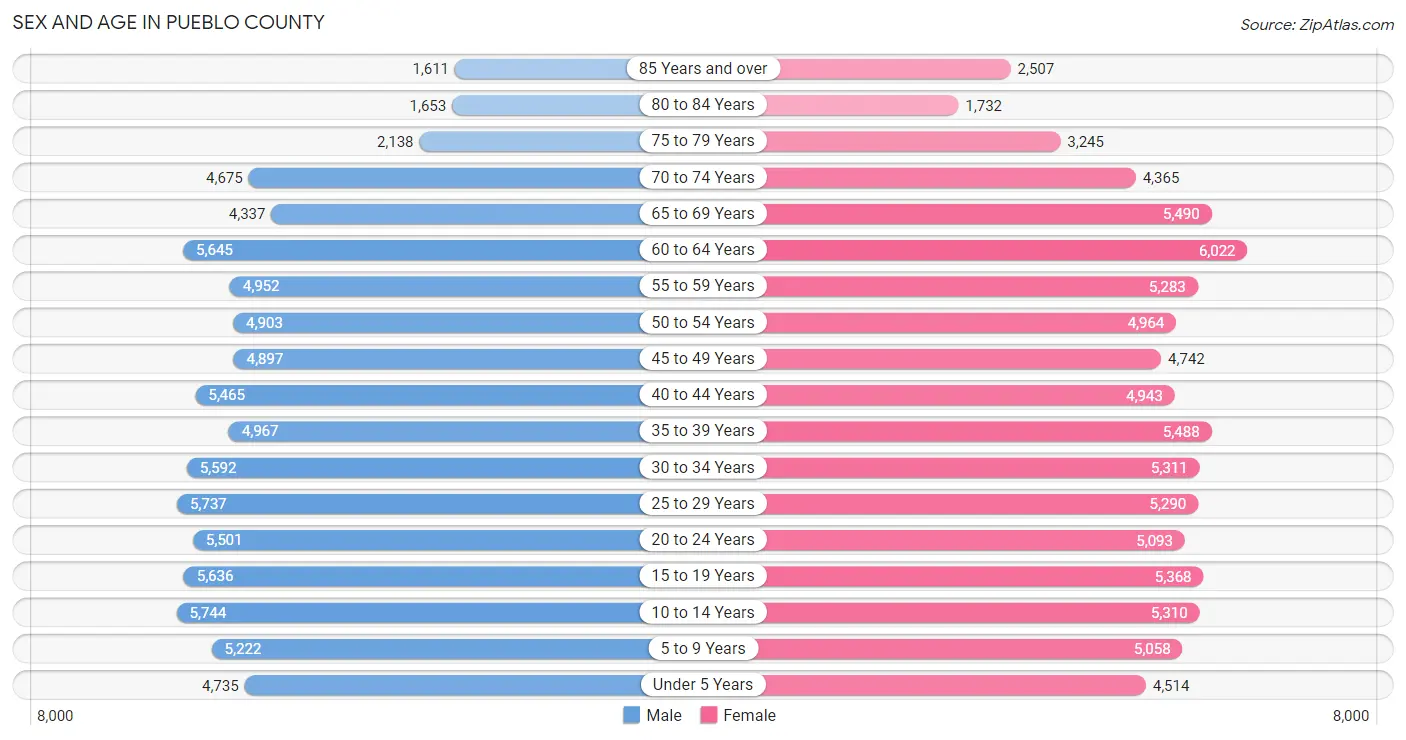
| Age Bracket | Male | Female |
| Under 5 Years | 4,735 (5.7%) | 4,514 (5.3%) |
| 5 to 9 Years | 5,222 (6.3%) | 5,058 (6.0%) |
| 10 to 14 Years | 5,744 (6.9%) | 5,310 (6.3%) |
| 15 to 19 Years | 5,636 (6.8%) | 5,368 (6.3%) |
| 20 to 24 Years | 5,501 (6.6%) | 5,093 (6.0%) |
| 25 to 29 Years | 5,737 (6.9%) | 5,290 (6.2%) |
| 30 to 34 Years | 5,592 (6.7%) | 5,311 (6.3%) |
| 35 to 39 Years | 4,967 (5.9%) | 5,488 (6.5%) |
| 40 to 44 Years | 5,465 (6.6%) | 4,943 (5.8%) |
| 45 to 49 Years | 4,897 (5.9%) | 4,742 (5.6%) |
| 50 to 54 Years | 4,903 (5.9%) | 4,964 (5.9%) |
| 55 to 59 Years | 4,952 (5.9%) | 5,283 (6.2%) |
| 60 to 64 Years | 5,645 (6.8%) | 6,022 (7.1%) |
| 65 to 69 Years | 4,337 (5.2%) | 5,490 (6.5%) |
| 70 to 74 Years | 4,675 (5.6%) | 4,365 (5.1%) |
| 75 to 79 Years | 2,138 (2.6%) | 3,245 (3.8%) |
| 80 to 84 Years | 1,653 (2.0%) | 1,732 (2.0%) |
| 85 Years and over | 1,611 (1.9%) | 2,507 (3.0%) |
| Total | 83,410 (100.0%) | 84,725 (100.0%) |
Families and Households in Pueblo County
Median Family Size in Pueblo County
The median family size in Pueblo County is 3.08 persons per family, with single female/mother families (8,940 | 21.5%) accounting for the largest median family size of 3.17 persons per family. On the other hand, single male/father families (4,254 | 10.3%) represent the smallest median family size with 2.74 persons per family.
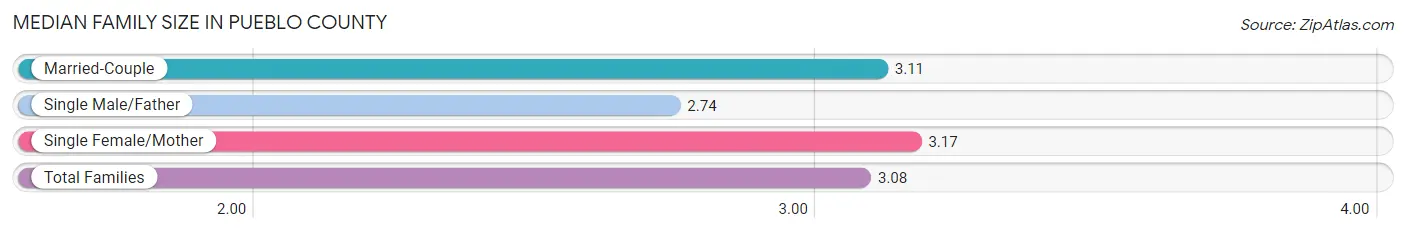
| Family Type | # Families | Family Size |
| Married-Couple | 28,285 (68.2%) | 3.11 |
| Single Male/Father | 4,254 (10.3%) | 2.74 |
| Single Female/Mother | 8,940 (21.5%) | 3.17 |
| Total Families | 41,479 (100.0%) | 3.08 |
Median Household Size in Pueblo County
The median household size in Pueblo County is 2.43 persons per household, with single female/mother households (8,940 | 13.3%) accounting for the largest median household size of 3.43 persons per household. non-family households (25,611 | 38.2%) represent the smallest median household size with 1.20 persons per household.
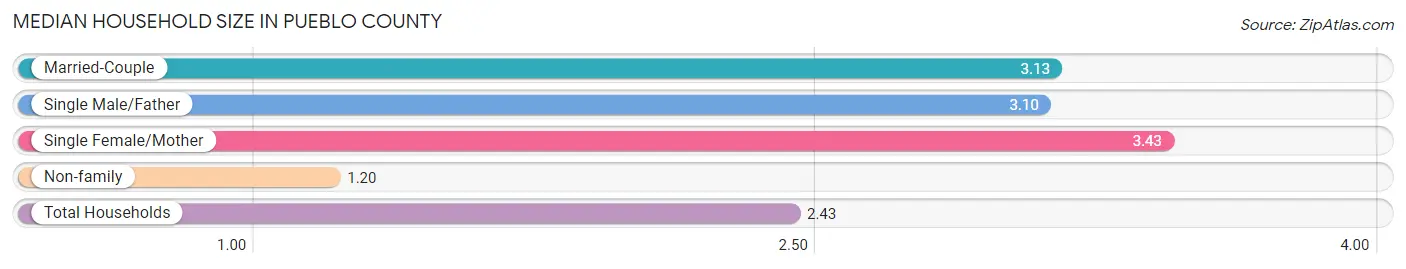
| Household Type | # Households | Household Size |
| Married-Couple | 28,285 (42.2%) | 3.13 |
| Single Male/Father | 4,254 (6.3%) | 3.10 |
| Single Female/Mother | 8,940 (13.3%) | 3.43 |
| Non-family | 25,611 (38.2%) | 1.20 |
| Total Households | 67,090 (100.0%) | 2.43 |
Household Size by Marriage Status in Pueblo County
Out of a total of 67,090 households in Pueblo County, 41,479 (61.8%) are family households, while 25,611 (38.2%) are nonfamily households. The most numerous type of family households are 2-person households, comprising 18,430, and the most common type of nonfamily households are 1-person households, comprising 21,642.
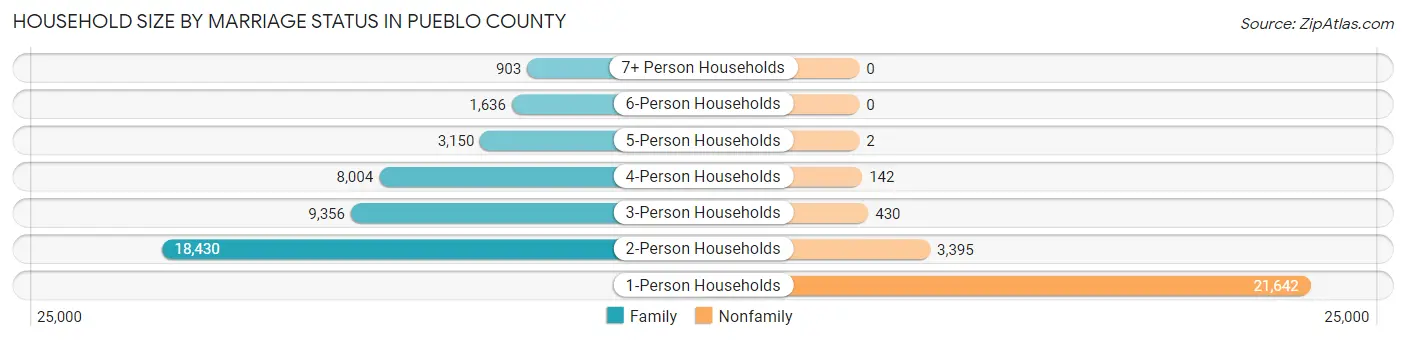
| Household Size | Family Households | Nonfamily Households |
| 1-Person Households | - | 21,642 (32.3%) |
| 2-Person Households | 18,430 (27.5%) | 3,395 (5.1%) |
| 3-Person Households | 9,356 (14.0%) | 430 (0.6%) |
| 4-Person Households | 8,004 (11.9%) | 142 (0.2%) |
| 5-Person Households | 3,150 (4.7%) | 2 (0.0%) |
| 6-Person Households | 1,636 (2.4%) | 0 (0.0%) |
| 7+ Person Households | 903 (1.3%) | 0 (0.0%) |
| Total | 41,479 (61.8%) | 25,611 (38.2%) |
Female Fertility in Pueblo County
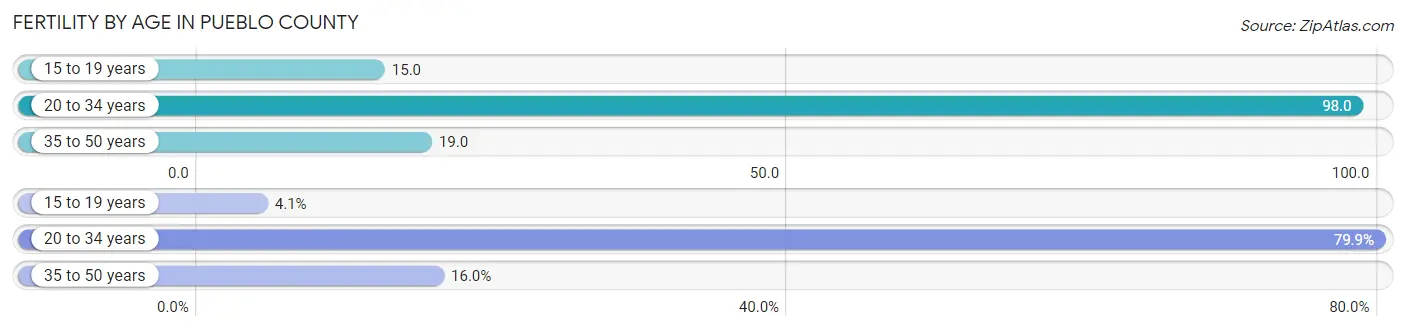
Fertility by Age in Pueblo County
Average fertility rate in Pueblo County is 51.0 births per 1,000 women. Women in the age bracket of 20 to 34 years have the highest fertility rate with 98.0 births per 1,000 women. Women in the age bracket of 20 to 34 years acount for 79.9% of all women with births.
| Age Bracket | Women with Births | Births / 1,000 Women |
| 15 to 19 years | 78 (4.1%) | 15.0 |
| 20 to 34 years | 1,537 (79.9%) | 98.0 |
| 35 to 50 years | 308 (16.0%) | 19.0 |
| Total | 1,923 (100.0%) | 51.0 |
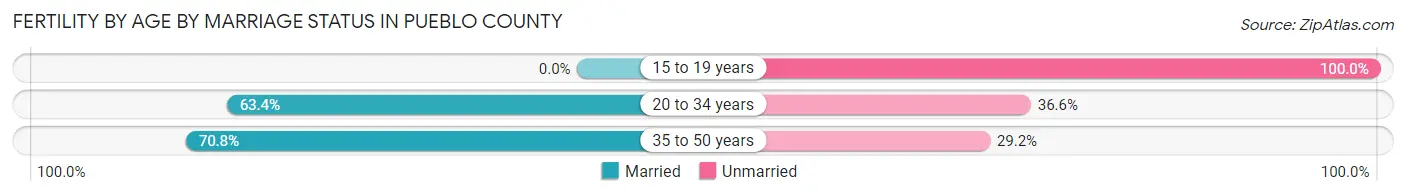
Fertility by Age by Marriage Status in Pueblo County
62.0% of women with births (1,923) in Pueblo County are married. The highest percentage of unmarried women with births falls into 15 to 19 years age bracket with 100.0% of them unmarried at the time of birth, while the lowest percentage of unmarried women with births belong to 35 to 50 years age bracket with 29.2% of them unmarried.
| Age Bracket | Married | Unmarried |
| 15 to 19 years | 0 (0.0%) | 78 (100.0%) |
| 20 to 34 years | 974 (63.4%) | 563 (36.6%) |
| 35 to 50 years | 218 (70.8%) | 90 (29.2%) |
| Total | 1,192 (62.0%) | 731 (38.0%) |
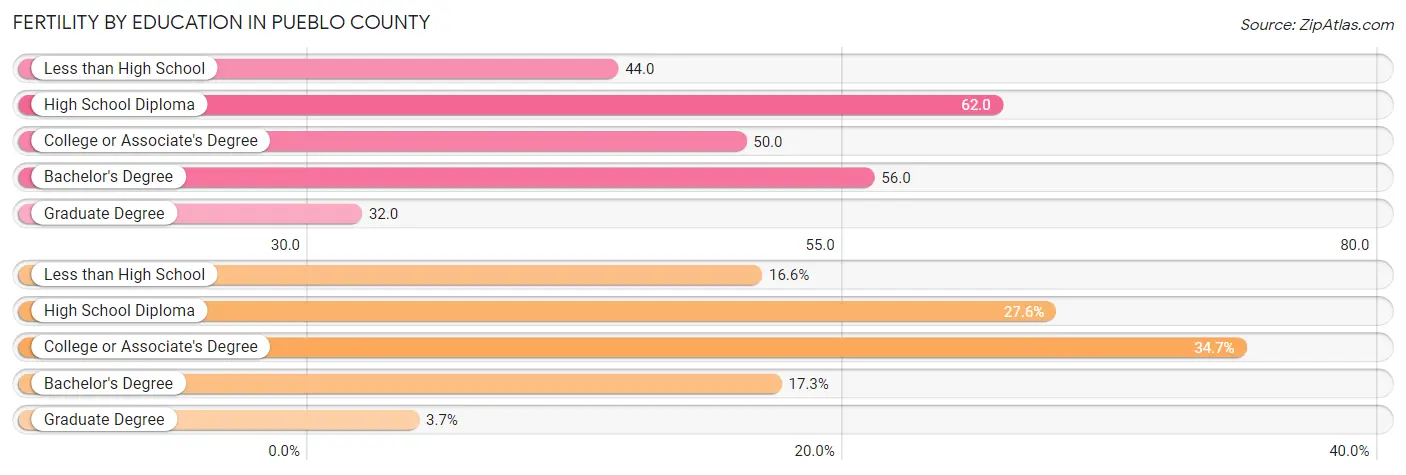
Fertility by Education in Pueblo County
Average fertility rate in Pueblo County is 51.0 births per 1,000 women. Women with the education attainment of high school diploma have the highest fertility rate of 62.0 births per 1,000 women, while women with the education attainment of graduate degree have the lowest fertility at 32.0 births per 1,000 women. Women with the education attainment of college or associate's degree represent 34.7% of all women with births.
| Educational Attainment | Women with Births | Births / 1,000 Women |
| Less than High School | 319 (16.6%) | 44.0 |
| High School Diploma | 531 (27.6%) | 62.0 |
| College or Associate's Degree | 668 (34.7%) | 50.0 |
| Bachelor's Degree | 333 (17.3%) | 56.0 |
| Graduate Degree | 72 (3.7%) | 32.0 |
| Total | 1,923 (100.0%) | 51.0 |
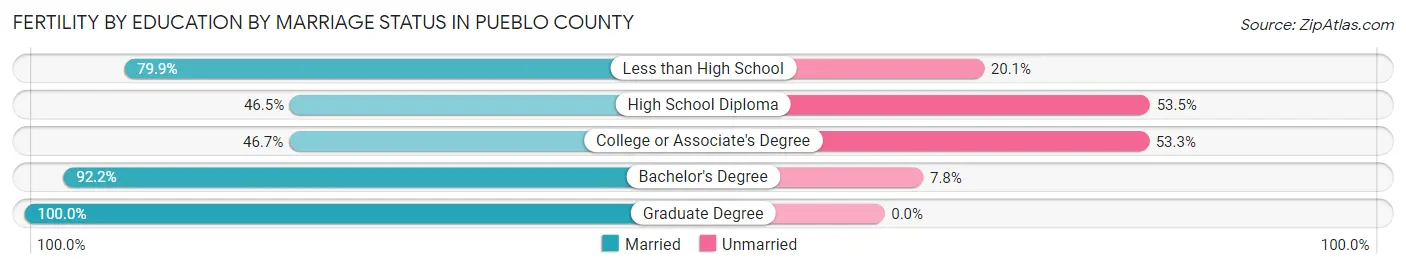
Fertility by Education by Marriage Status in Pueblo County
38.0% of women with births in Pueblo County are unmarried. Women with the educational attainment of graduate degree are most likely to be married with 100.0% of them married at childbirth, while women with the educational attainment of high school diploma are least likely to be married with 53.5% of them unmarried at childbirth.
| Educational Attainment | Married | Unmarried |
| Less than High School | 255 (79.9%) | 64 (20.1%) |
| High School Diploma | 247 (46.5%) | 284 (53.5%) |
| College or Associate's Degree | 312 (46.7%) | 356 (53.3%) |
| Bachelor's Degree | 307 (92.2%) | 26 (7.8%) |
| Graduate Degree | 72 (100.0%) | 0 (0.0%) |
| Total | 1,192 (62.0%) | 731 (38.0%) |
Income in Pueblo County
Income Overview in Pueblo County
Per Capita Income in Pueblo County is $31,513, while median incomes of families and households are $73,803 and $59,436 respectively.
| Characteristic | Number | Measure |
| Per Capita Income | 168,135 | $31,513 |
| Median Family Income | 41,479 | $73,803 |
| Mean Family Income | 41,479 | $92,529 |
| Median Household Income | 67,090 | $59,436 |
| Mean Household Income | 67,090 | $76,972 |
| Income Deficit | 41,479 | $10,306 |
| Wage / Income Gap (%) | 168,135 | 24.83% |
| Wage / Income Gap ($) | 168,135 | 75.17¢ per $1 |
| Gini / Inequality Index | 168,135 | 0.45 |
Earnings by Sex in Pueblo County
Average Earnings in Pueblo County are $38,609, $44,904 for men and $33,754 for women, a difference of 24.8%.
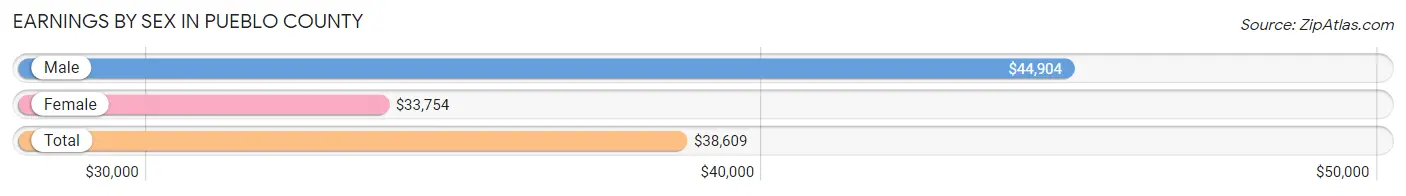
| Sex | Number | Average Earnings |
| Male | 41,511 (52.9%) | $44,904 |
| Female | 36,926 (47.1%) | $33,754 |
| Total | 78,437 (100.0%) | $38,609 |
Earnings by Sex by Income Bracket in Pueblo County
The most common earnings brackets in Pueblo County are $100,000+ for men (5,465 | 13.2%) and $55,000 to $64,999 for women (3,272 | 8.9%).
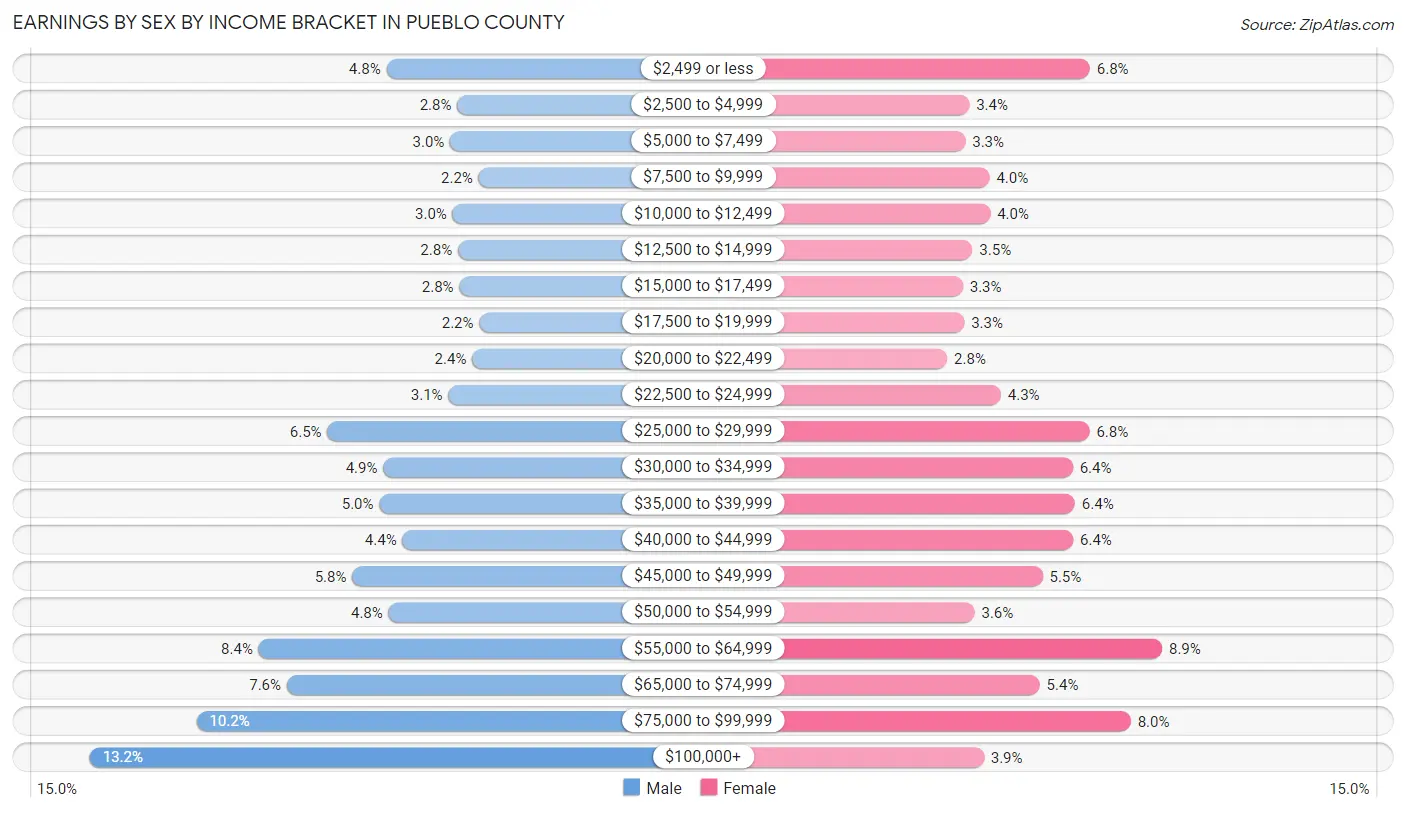
| Income | Male | Female |
| $2,499 or less | 2,003 (4.8%) | 2,523 (6.8%) |
| $2,500 to $4,999 | 1,178 (2.8%) | 1,269 (3.4%) |
| $5,000 to $7,499 | 1,260 (3.0%) | 1,228 (3.3%) |
| $7,500 to $9,999 | 928 (2.2%) | 1,479 (4.0%) |
| $10,000 to $12,499 | 1,231 (3.0%) | 1,487 (4.0%) |
| $12,500 to $14,999 | 1,172 (2.8%) | 1,304 (3.5%) |
| $15,000 to $17,499 | 1,156 (2.8%) | 1,204 (3.3%) |
| $17,500 to $19,999 | 923 (2.2%) | 1,220 (3.3%) |
| $20,000 to $22,499 | 1,003 (2.4%) | 1,043 (2.8%) |
| $22,500 to $24,999 | 1,282 (3.1%) | 1,598 (4.3%) |
| $25,000 to $29,999 | 2,693 (6.5%) | 2,518 (6.8%) |
| $30,000 to $34,999 | 2,043 (4.9%) | 2,343 (6.4%) |
| $35,000 to $39,999 | 2,089 (5.0%) | 2,366 (6.4%) |
| $40,000 to $44,999 | 1,818 (4.4%) | 2,350 (6.4%) |
| $45,000 to $49,999 | 2,402 (5.8%) | 2,030 (5.5%) |
| $50,000 to $54,999 | 1,980 (4.8%) | 1,324 (3.6%) |
| $55,000 to $64,999 | 3,497 (8.4%) | 3,272 (8.9%) |
| $65,000 to $74,999 | 3,166 (7.6%) | 2,000 (5.4%) |
| $75,000 to $99,999 | 4,222 (10.2%) | 2,946 (8.0%) |
| $100,000+ | 5,465 (13.2%) | 1,422 (3.8%) |
| Total | 41,511 (100.0%) | 36,926 (100.0%) |
Earnings by Sex by Educational Attainment in Pueblo County
Average earnings in Pueblo County are $50,347 for men and $38,350 for women, a difference of 23.8%. Men with an educational attainment of graduate degree enjoy the highest average annual earnings of $78,594, while those with less than high school education earn the least with $38,740. Women with an educational attainment of graduate degree earn the most with the average annual earnings of $65,334, while those with less than high school education have the smallest earnings of $23,185.
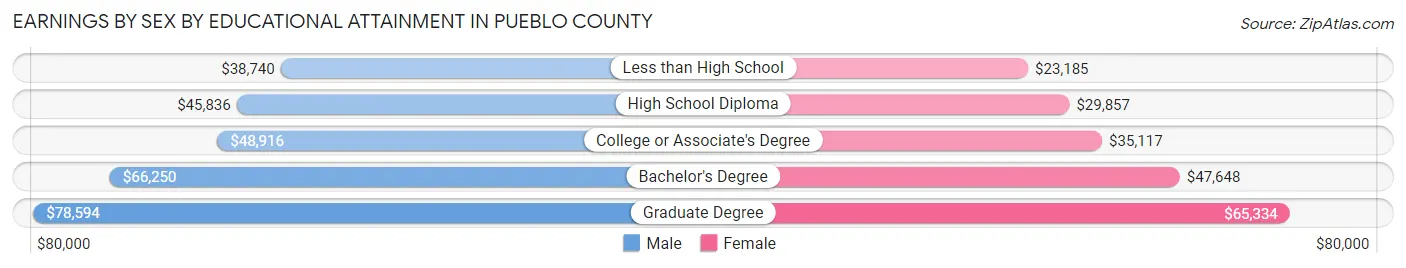
| Educational Attainment | Male Income | Female Income |
| Less than High School | $38,740 | $23,185 |
| High School Diploma | $45,836 | $29,857 |
| College or Associate's Degree | $48,916 | $35,117 |
| Bachelor's Degree | $66,250 | $47,648 |
| Graduate Degree | $78,594 | $65,334 |
| Total | $50,347 | $38,350 |
Family Income in Pueblo County
Family Income Brackets in Pueblo County
According to the Pueblo County family income data, there are 8,254 families falling into the $100,000 to $149,999 income range, which is the most common income bracket and makes up 19.9% of all families. Conversely, the $10,000 to $14,999 income bracket is the least frequent group with only 1,120 families (2.7%) belonging to this category.

| Income Bracket | # Families | % Families |
| Less than $10,000 | 1,742 | 4.2% |
| $10,000 to $14,999 | 1,120 | 2.7% |
| $15,000 to $24,999 | 2,738 | 6.6% |
| $25,000 to $34,999 | 3,069 | 7.4% |
| $35,000 to $49,999 | 4,272 | 10.3% |
| $50,000 to $74,999 | 8,047 | 19.4% |
| $75,000 to $99,999 | 6,139 | 14.8% |
| $100,000 to $149,999 | 8,254 | 19.9% |
| $150,000 to $199,999 | 3,277 | 7.9% |
| $200,000+ | 2,779 | 6.7% |
Family Income by Famaliy Size in Pueblo County
6-person families (1,254 | 3.0%) account for the highest median family income in Pueblo County with $106,053 per family, while 2-person families (19,899 | 48.0%) have the highest median income of $33,641 per family member.
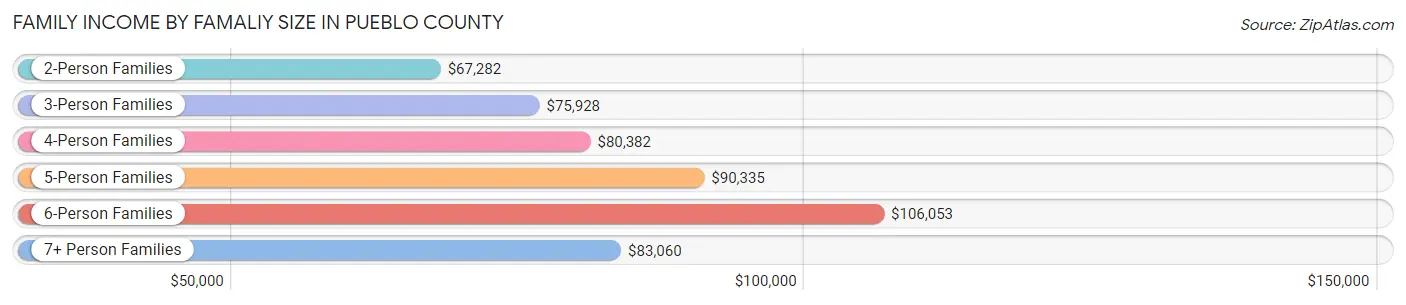
| Income Bracket | # Families | Median Income |
| 2-Person Families | 19,899 (48.0%) | $67,282 |
| 3-Person Families | 9,452 (22.8%) | $75,928 |
| 4-Person Families | 7,140 (17.2%) | $80,382 |
| 5-Person Families | 2,930 (7.1%) | $90,335 |
| 6-Person Families | 1,254 (3.0%) | $106,053 |
| 7+ Person Families | 804 (1.9%) | $83,060 |
| Total | 41,479 (100.0%) | $73,803 |
Family Income by Number of Earners in Pueblo County
The median family income in Pueblo County is $73,803, with families comprising 3+ earners (4,146) having the highest median family income of $130,566, while families with no earners (8,317) have the lowest median family income of $45,371, accounting for 10.0% and 20.1% of families, respectively.
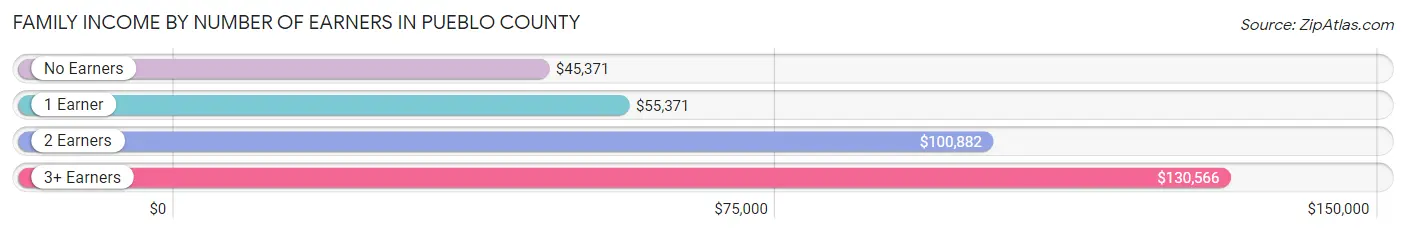
| Number of Earners | # Families | Median Income |
| No Earners | 8,317 (20.1%) | $45,371 |
| 1 Earner | 14,588 (35.2%) | $55,371 |
| 2 Earners | 14,428 (34.8%) | $100,882 |
| 3+ Earners | 4,146 (10.0%) | $130,566 |
| Total | 41,479 (100.0%) | $73,803 |
Household Income in Pueblo County
Household Income Brackets in Pueblo County
With 13,083 households falling in the category, the $50,000 to $74,999 income range is the most frequent in Pueblo County, accounting for 19.5% of all households. In contrast, only 3,220 households (4.8%) fall into the $200,000+ income bracket, making it the least populous group.
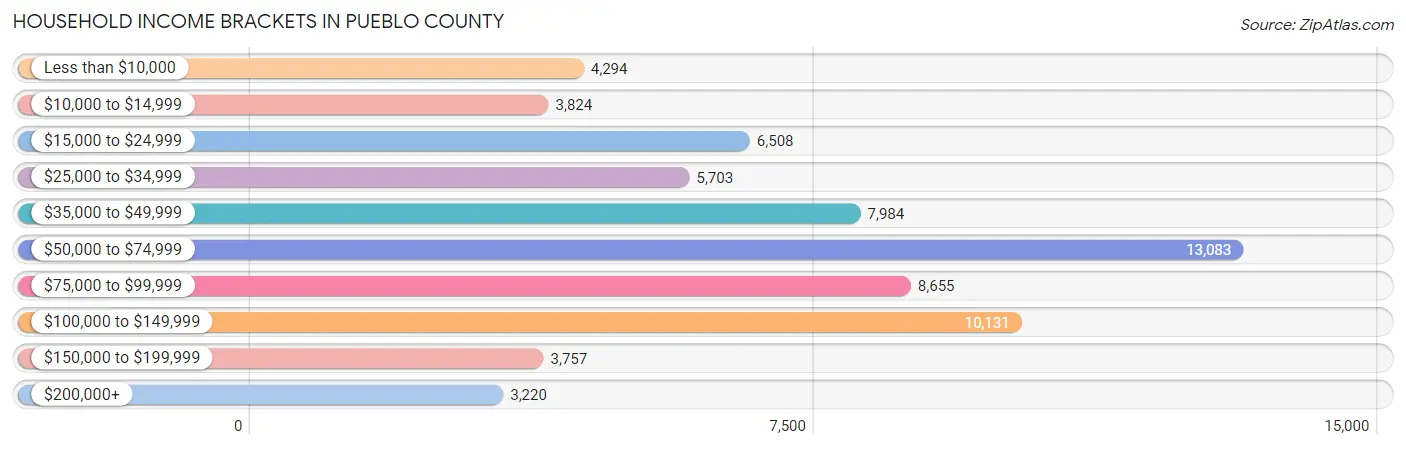
| Income Bracket | # Households | % Households |
| Less than $10,000 | 4,294 | 6.4% |
| $10,000 to $14,999 | 3,824 | 5.7% |
| $15,000 to $24,999 | 6,508 | 9.7% |
| $25,000 to $34,999 | 5,703 | 8.5% |
| $35,000 to $49,999 | 7,984 | 11.9% |
| $50,000 to $74,999 | 13,083 | 19.5% |
| $75,000 to $99,999 | 8,655 | 12.9% |
| $100,000 to $149,999 | 10,131 | 15.1% |
| $150,000 to $199,999 | 3,757 | 5.6% |
| $200,000+ | 3,220 | 4.8% |
Household Income by Householder Age in Pueblo County
The median household income in Pueblo County is $59,436, with the highest median household income of $69,930 found in the 45 to 64 years age bracket for the primary householder. A total of 23,981 households (35.7%) fall into this category. Meanwhile, the 15 to 24 years age bracket for the primary householder has the lowest median household income of $40,979, with 2,724 households (4.1%) in this group.
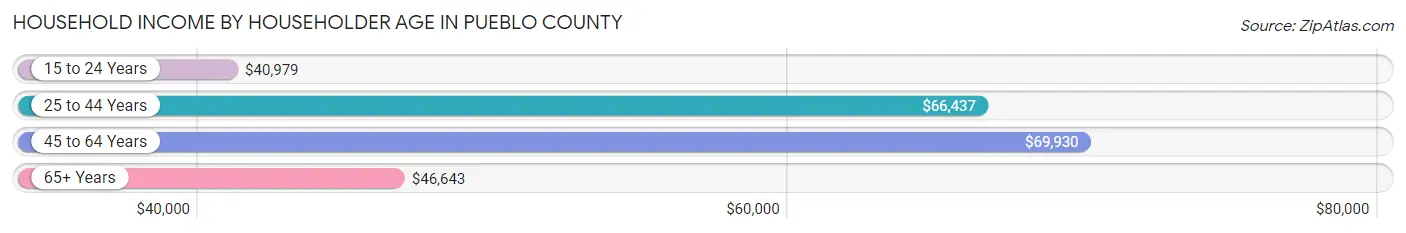
| Income Bracket | # Households | Median Income |
| 15 to 24 Years | 2,724 (4.1%) | $40,979 |
| 25 to 44 Years | 19,939 (29.7%) | $66,437 |
| 45 to 64 Years | 23,981 (35.7%) | $69,930 |
| 65+ Years | 20,446 (30.5%) | $46,643 |
| Total | 67,090 (100.0%) | $59,436 |
Poverty in Pueblo County
Income Below Poverty by Sex and Age in Pueblo County
With 15.7% poverty level for males and 17.5% for females among the residents of Pueblo County, 5 year old males and 5 year old females are the most vulnerable to poverty, with 318 males (29.8%) and 371 females (33.9%) in their respective age groups living below the poverty level.
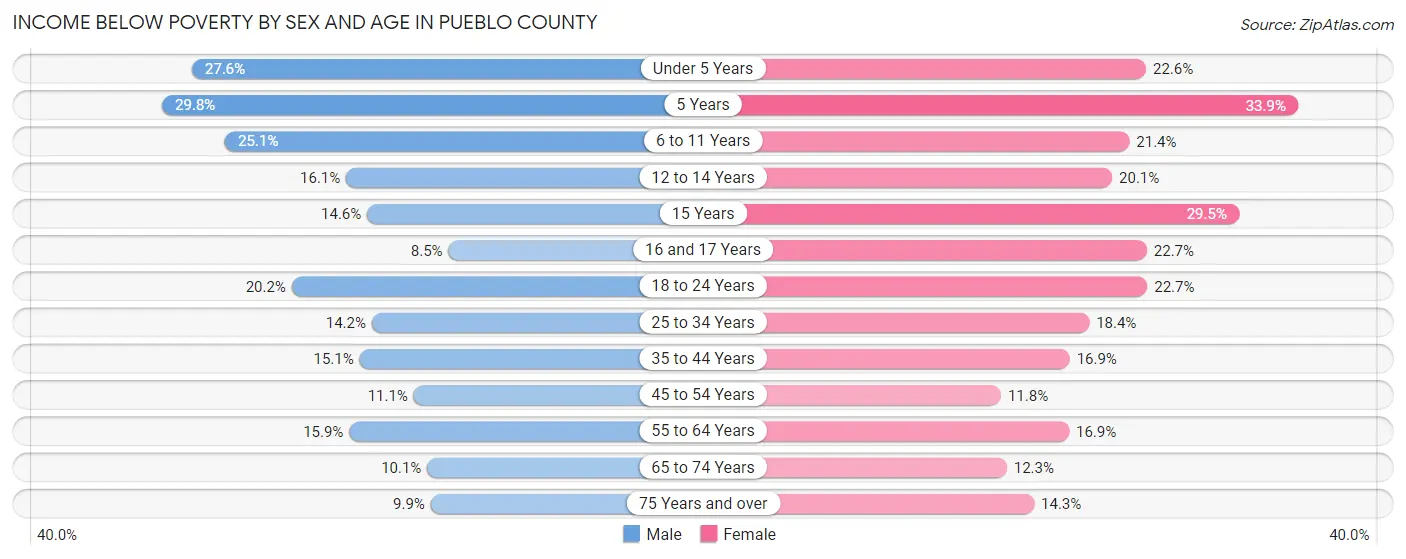
| Age Bracket | Male | Female |
| Under 5 Years | 1,290 (27.6%) | 994 (22.6%) |
| 5 Years | 318 (29.8%) | 371 (33.9%) |
| 6 to 11 Years | 1,593 (25.1%) | 1,304 (21.3%) |
| 12 to 14 Years | 549 (16.1%) | 616 (20.1%) |
| 15 Years | 182 (14.6%) | 359 (29.5%) |
| 16 and 17 Years | 185 (8.5%) | 468 (22.7%) |
| 18 to 24 Years | 1,411 (20.2%) | 1,567 (22.7%) |
| 25 to 34 Years | 1,562 (14.2%) | 1,920 (18.4%) |
| 35 to 44 Years | 1,529 (15.1%) | 1,719 (16.9%) |
| 45 to 54 Years | 1,073 (11.1%) | 1,137 (11.8%) |
| 55 to 64 Years | 1,646 (15.9%) | 1,893 (16.9%) |
| 65 to 74 Years | 891 (10.1%) | 1,181 (12.2%) |
| 75 Years and over | 506 (9.9%) | 1,010 (14.3%) |
| Total | 12,735 (15.7%) | 14,539 (17.5%) |
Income Above Poverty by Sex and Age in Pueblo County
According to the poverty statistics in Pueblo County, males aged 16 and 17 years and females aged 45 to 54 years are the age groups that are most secure financially, with 91.5% of males and 88.2% of females in these age groups living above the poverty line.

| Age Bracket | Male | Female |
| Under 5 Years | 3,387 (72.4%) | 3,406 (77.4%) |
| 5 Years | 749 (70.2%) | 725 (66.1%) |
| 6 to 11 Years | 4,749 (74.9%) | 4,803 (78.6%) |
| 12 to 14 Years | 2,854 (83.9%) | 2,453 (79.9%) |
| 15 Years | 1,067 (85.4%) | 859 (70.5%) |
| 16 and 17 Years | 1,984 (91.5%) | 1,598 (77.3%) |
| 18 to 24 Years | 5,583 (79.8%) | 5,343 (77.3%) |
| 25 to 34 Years | 9,426 (85.8%) | 8,532 (81.6%) |
| 35 to 44 Years | 8,578 (84.9%) | 8,440 (83.1%) |
| 45 to 54 Years | 8,581 (88.9%) | 8,485 (88.2%) |
| 55 to 64 Years | 8,705 (84.1%) | 9,328 (83.1%) |
| 65 to 74 Years | 7,925 (89.9%) | 8,463 (87.7%) |
| 75 Years and over | 4,631 (90.1%) | 6,061 (85.7%) |
| Total | 68,219 (84.3%) | 68,496 (82.5%) |
Income Below Poverty Among Married-Couple Families in Pueblo County
The poverty statistics for married-couple families in Pueblo County show that 5.9% or 1,670 of the total 28,285 families live below the poverty line. Families with 3 or 4 children have the highest poverty rate of 11.7%, comprising of 247 families. On the other hand, families with no children have the lowest poverty rate of 4.4%, which includes 742 families.
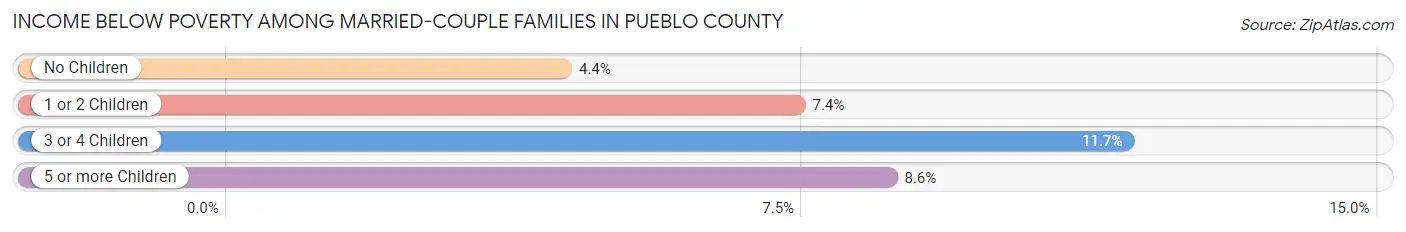
| Children | Above Poverty | Below Poverty |
| No Children | 16,295 (95.6%) | 742 (4.4%) |
| 1 or 2 Children | 8,179 (92.6%) | 655 (7.4%) |
| 3 or 4 Children | 1,865 (88.3%) | 247 (11.7%) |
| 5 or more Children | 276 (91.4%) | 26 (8.6%) |
| Total | 26,615 (94.1%) | 1,670 (5.9%) |
Income Below Poverty Among Single-Parent Households in Pueblo County
According to the poverty data in Pueblo County, 18.6% or 791 single-father households and 31.1% or 2,778 single-mother households are living below the poverty line. Among single-father households, those with 5 or more children have the highest poverty rate, with 7 households (100.0%) experiencing poverty. Likewise, among single-mother households, those with 3 or 4 children have the highest poverty rate, with 628 households (56.6%) falling below the poverty line.
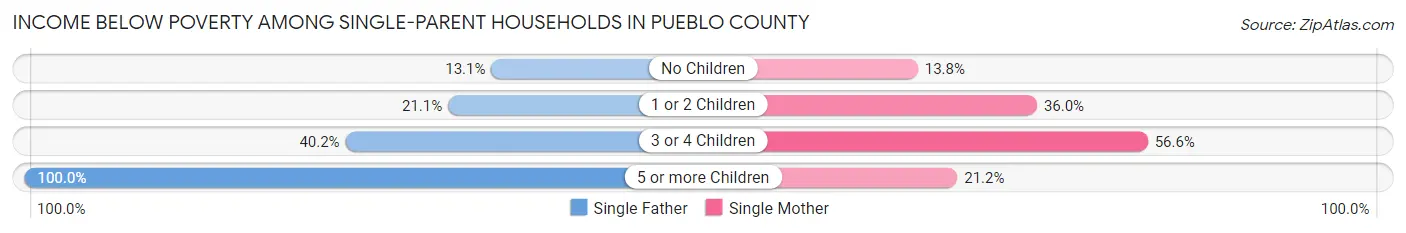
| Children | Single Father | Single Mother |
| No Children | 262 (13.1%) | 404 (13.8%) |
| 1 or 2 Children | 421 (21.1%) | 1,717 (36.0%) |
| 3 or 4 Children | 101 (40.2%) | 628 (56.6%) |
| 5 or more Children | 7 (100.0%) | 29 (21.2%) |
| Total | 791 (18.6%) | 2,778 (31.1%) |
Income Below Poverty Among Married-Couple vs Single-Parent Households in Pueblo County
The poverty data for Pueblo County shows that 1,670 of the married-couple family households (5.9%) and 3,569 of the single-parent households (27.1%) are living below the poverty level. Within the married-couple family households, those with 3 or 4 children have the highest poverty rate, with 247 households (11.7%) falling below the poverty line. Among the single-parent households, those with 3 or 4 children have the highest poverty rate, with 729 household (53.6%) living below poverty.
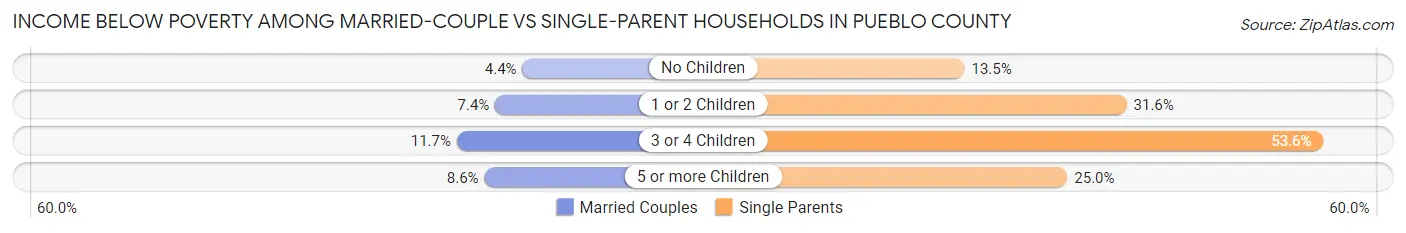
| Children | Married-Couple Families | Single-Parent Households |
| No Children | 742 (4.4%) | 666 (13.5%) |
| 1 or 2 Children | 655 (7.4%) | 2,138 (31.6%) |
| 3 or 4 Children | 247 (11.7%) | 729 (53.6%) |
| 5 or more Children | 26 (8.6%) | 36 (25.0%) |
| Total | 1,670 (5.9%) | 3,569 (27.1%) |
Employment Characteristics in Pueblo County
Employment by Class of Employer in Pueblo County
Among the 69,850 employed individuals in Pueblo County, private company employees (44,135 | 63.2%), local government employees (6,008 | 8.6%), and state government employees (5,604 | 8.0%) make up the most common classes of employment.
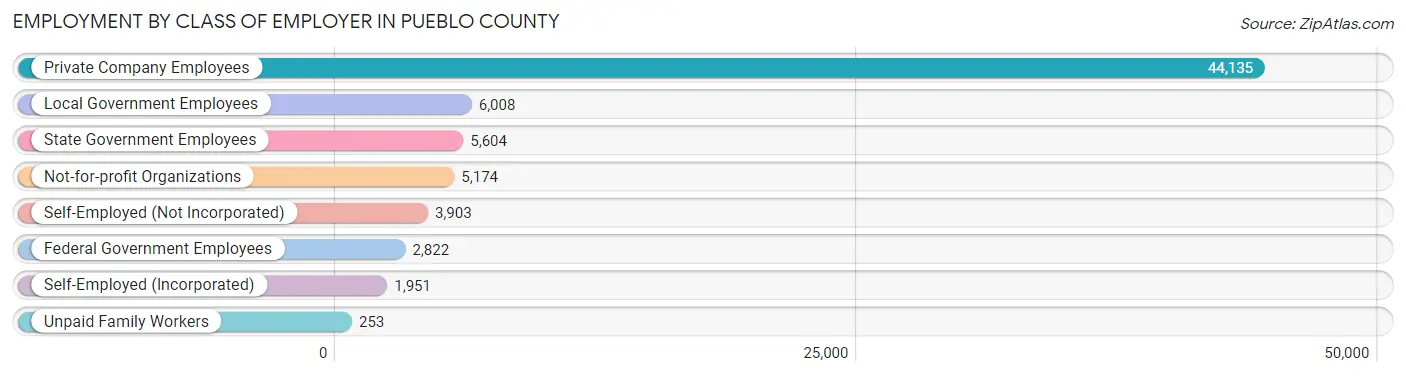
| Employer Class | # Employees | % Employees |
| Private Company Employees | 44,135 | 63.2% |
| Self-Employed (Incorporated) | 1,951 | 2.8% |
| Self-Employed (Not Incorporated) | 3,903 | 5.6% |
| Not-for-profit Organizations | 5,174 | 7.4% |
| Local Government Employees | 6,008 | 8.6% |
| State Government Employees | 5,604 | 8.0% |
| Federal Government Employees | 2,822 | 4.0% |
| Unpaid Family Workers | 253 | 0.4% |
| Total | 69,850 | 100.0% |
Employment Status by Age in Pueblo County
According to the labor force statistics for Pueblo County, out of the total population over 16 years of age (135,075), 55.8% or 75,372 individuals are in the labor force, with 5.9% or 4,447 of them unemployed. The age group with the highest labor force participation rate is 30 to 34 years, with 78.1% or 8,515 individuals in the labor force. Within the labor force, the 16 to 19 years age range has the highest percentage of unemployed individuals, with 21.5% or 713 of them being unemployed.
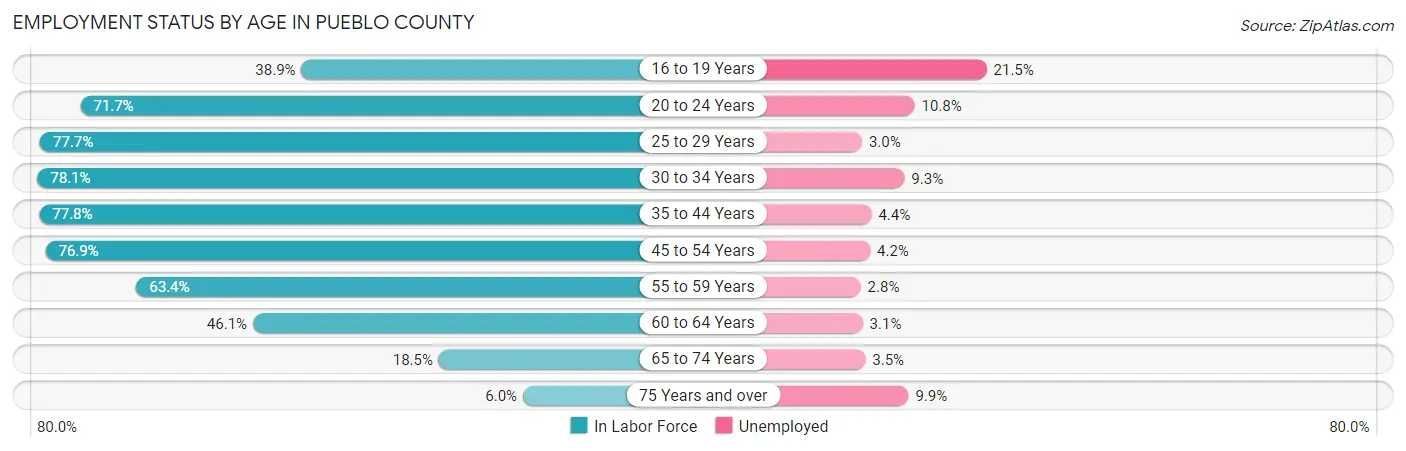
| Age Bracket | In Labor Force | Unemployed |
| 16 to 19 Years | 3,317 (38.9%) | 713 (21.5%) |
| 20 to 24 Years | 7,596 (71.7%) | 820 (10.8%) |
| 25 to 29 Years | 8,568 (77.7%) | 257 (3.0%) |
| 30 to 34 Years | 8,515 (78.1%) | 792 (9.3%) |
| 35 to 44 Years | 16,231 (77.8%) | 714 (4.4%) |
| 45 to 54 Years | 15,000 (76.9%) | 630 (4.2%) |
| 55 to 59 Years | 6,489 (63.4%) | 182 (2.8%) |
| 60 to 64 Years | 5,378 (46.1%) | 167 (3.1%) |
| 65 to 74 Years | 3,490 (18.5%) | 122 (3.5%) |
| 75 Years and over | 773 (6.0%) | 77 (9.9%) |
| Total | 75,372 (55.8%) | 4,447 (5.9%) |
Employment Status by Educational Attainment in Pueblo County
According to labor force statistics for Pueblo County, 71.5% of individuals (60,204) out of the total population between 25 and 64 years of age (84,201) are in the labor force, with 4.6% or 2,769 of them being unemployed. The group with the highest labor force participation rate are those with the educational attainment of bachelor's degree or higher, with 83.2% or 16,707 individuals in the labor force. Within the labor force, individuals with less than high school education have the highest percentage of unemployment, with 10.9% or 438 of them being unemployed.
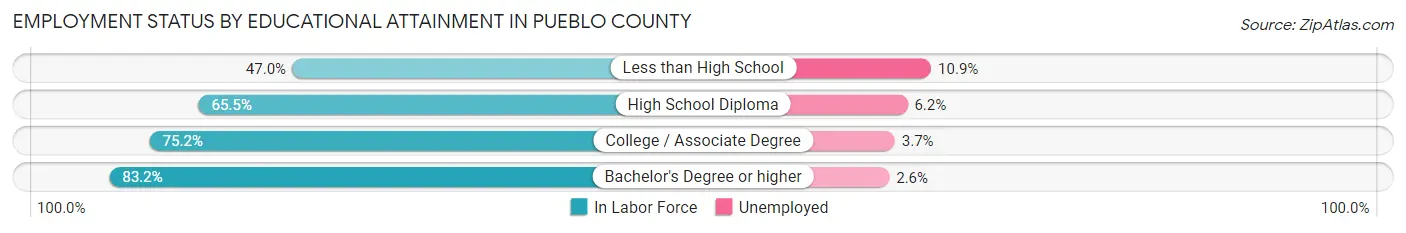
| Educational Attainment | In Labor Force | Unemployed |
| Less than High School | 4,015 (47.0%) | 931 (10.9%) |
| High School Diploma | 15,922 (65.5%) | 1,507 (6.2%) |
| College / Associate Degree | 23,514 (75.2%) | 1,157 (3.7%) |
| Bachelor's Degree or higher | 16,707 (83.2%) | 522 (2.6%) |
| Total | 60,204 (71.5%) | 3,873 (4.6%) |
Employment Occupations by Sex in Pueblo County
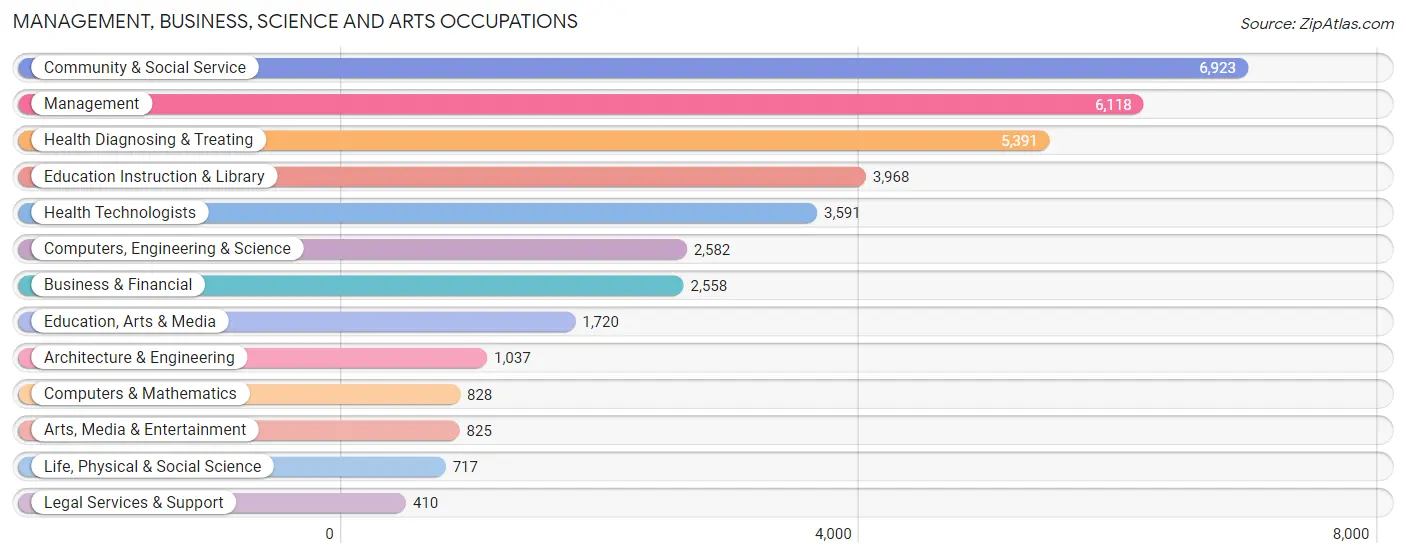
Management, Business, Science and Arts Occupations
The most common Management, Business, Science and Arts occupations in Pueblo County are Community & Social Service (6,923 | 9.8%), Management (6,118 | 8.7%), Health Diagnosing & Treating (5,391 | 7.6%), Education Instruction & Library (3,968 | 5.6%), and Health Technologists (3,591 | 5.1%).
Management, Business, Science and Arts Occupations by Sex
Within the Management, Business, Science and Arts occupations in Pueblo County, the most male-oriented occupations are Architecture & Engineering (85.2%), Computers & Mathematics (73.1%), and Computers, Engineering & Science (73.0%), while the most female-oriented occupations are Health Diagnosing & Treating (71.7%), Health Technologists (70.1%), and Legal Services & Support (68.0%).
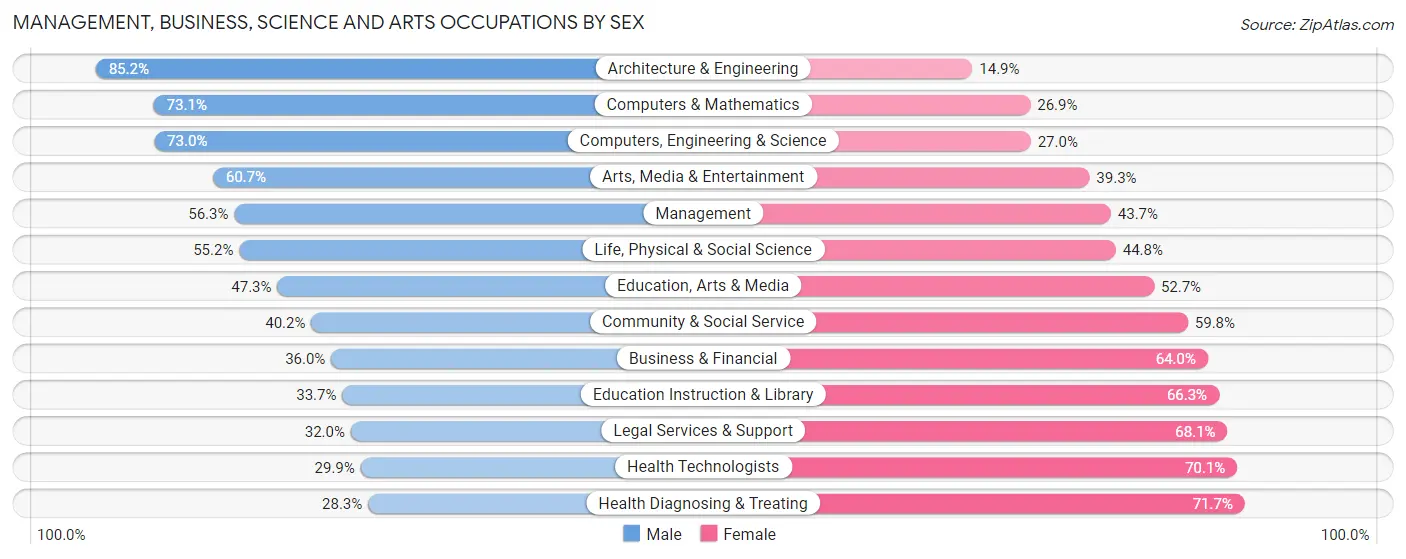
| Occupation | Male | Female |
| Management | 3,442 (56.3%) | 2,676 (43.7%) |
| Business & Financial | 922 (36.0%) | 1,636 (64.0%) |
| Computers, Engineering & Science | 1,884 (73.0%) | 698 (27.0%) |
| Computers & Mathematics | 605 (73.1%) | 223 (26.9%) |
| Architecture & Engineering | 883 (85.2%) | 154 (14.8%) |
| Life, Physical & Social Science | 396 (55.2%) | 321 (44.8%) |
| Community & Social Service | 2,783 (40.2%) | 4,140 (59.8%) |
| Education, Arts & Media | 813 (47.3%) | 907 (52.7%) |
| Legal Services & Support | 131 (32.0%) | 279 (68.0%) |
| Education Instruction & Library | 1,338 (33.7%) | 2,630 (66.3%) |
| Arts, Media & Entertainment | 501 (60.7%) | 324 (39.3%) |
| Health Diagnosing & Treating | 1,528 (28.3%) | 3,863 (71.7%) |
| Health Technologists | 1,074 (29.9%) | 2,517 (70.1%) |
| Total (Category) | 10,559 (44.8%) | 13,013 (55.2%) |
| Total (Overall) | 37,467 (53.2%) | 32,960 (46.8%) |
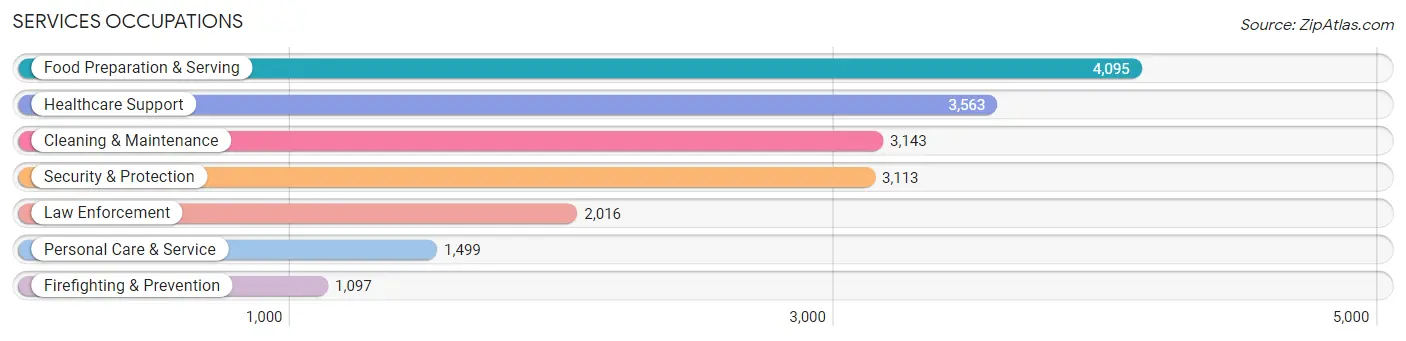
Services Occupations
The most common Services occupations in Pueblo County are Food Preparation & Serving (4,095 | 5.8%), Healthcare Support (3,563 | 5.1%), Cleaning & Maintenance (3,143 | 4.5%), Security & Protection (3,113 | 4.4%), and Law Enforcement (2,016 | 2.9%).
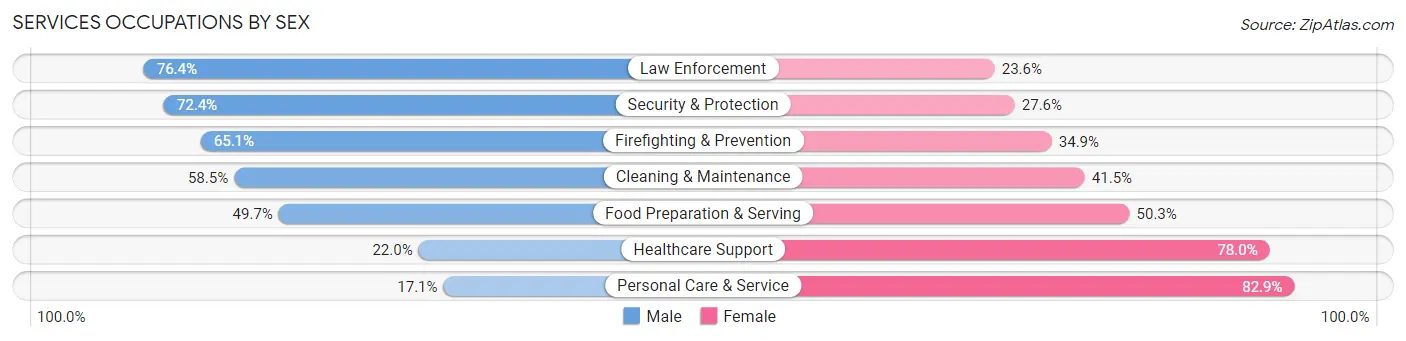
Services Occupations by Sex
Within the Services occupations in Pueblo County, the most male-oriented occupations are Law Enforcement (76.4%), Security & Protection (72.4%), and Firefighting & Prevention (65.1%), while the most female-oriented occupations are Personal Care & Service (82.9%), Healthcare Support (78.0%), and Food Preparation & Serving (50.3%).
| Occupation | Male | Female |
| Healthcare Support | 784 (22.0%) | 2,779 (78.0%) |
| Security & Protection | 2,254 (72.4%) | 859 (27.6%) |
| Firefighting & Prevention | 714 (65.1%) | 383 (34.9%) |
| Law Enforcement | 1,540 (76.4%) | 476 (23.6%) |
| Food Preparation & Serving | 2,035 (49.7%) | 2,060 (50.3%) |
| Cleaning & Maintenance | 1,840 (58.5%) | 1,303 (41.5%) |
| Personal Care & Service | 256 (17.1%) | 1,243 (82.9%) |
| Total (Category) | 7,169 (46.5%) | 8,244 (53.5%) |
| Total (Overall) | 37,467 (53.2%) | 32,960 (46.8%) |
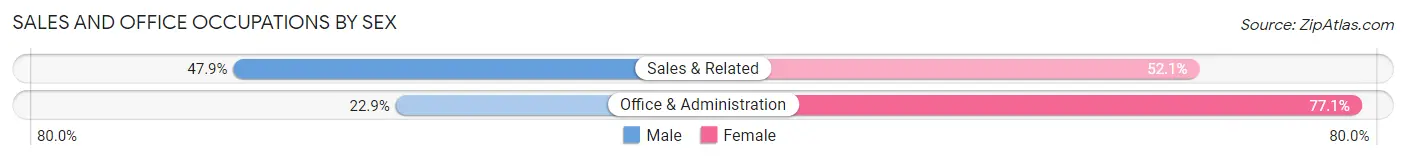
Sales and Office Occupations
The most common Sales and Office occupations in Pueblo County are Office & Administration (7,494 | 10.6%), and Sales & Related (7,137 | 10.1%).

Sales and Office Occupations by Sex
| Occupation | Male | Female |
| Sales & Related | 3,417 (47.9%) | 3,720 (52.1%) |
| Office & Administration | 1,718 (22.9%) | 5,776 (77.1%) |
| Total (Category) | 5,135 (35.1%) | 9,496 (64.9%) |
| Total (Overall) | 37,467 (53.2%) | 32,960 (46.8%) |
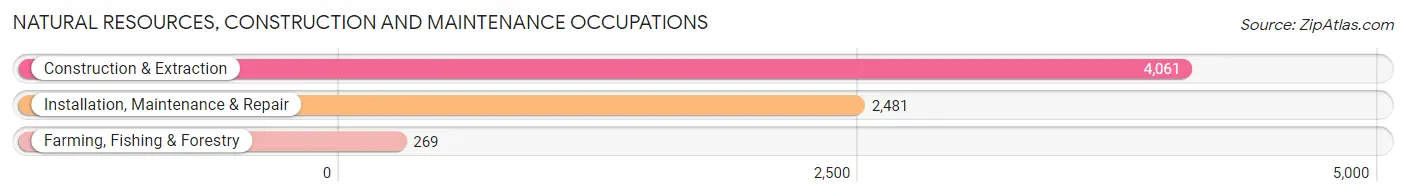
Natural Resources, Construction and Maintenance Occupations
The most common Natural Resources, Construction and Maintenance occupations in Pueblo County are Construction & Extraction (4,061 | 5.8%), Installation, Maintenance & Repair (2,481 | 3.5%), and Farming, Fishing & Forestry (269 | 0.4%).
Natural Resources, Construction and Maintenance Occupations by Sex
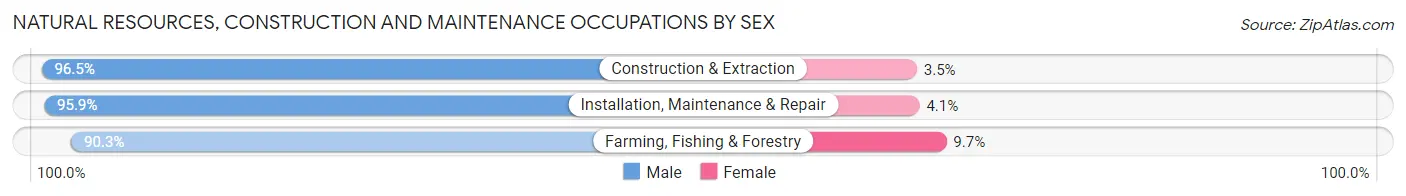
| Occupation | Male | Female |
| Farming, Fishing & Forestry | 243 (90.3%) | 26 (9.7%) |
| Construction & Extraction | 3,918 (96.5%) | 143 (3.5%) |
| Installation, Maintenance & Repair | 2,380 (95.9%) | 101 (4.1%) |
| Total (Category) | 6,541 (96.0%) | 270 (4.0%) |
| Total (Overall) | 37,467 (53.2%) | 32,960 (46.8%) |
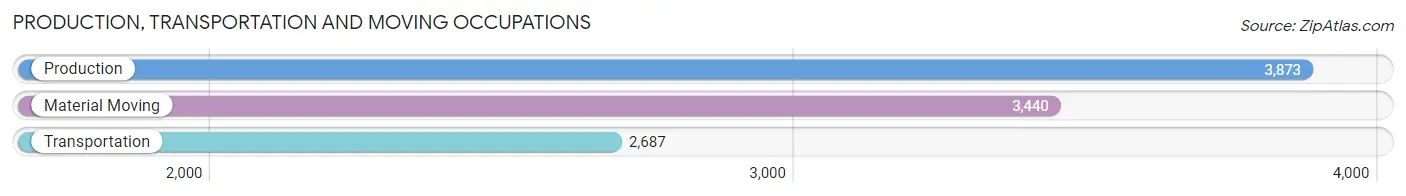
Production, Transportation and Moving Occupations
The most common Production, Transportation and Moving occupations in Pueblo County are Production (3,873 | 5.5%), Material Moving (3,440 | 4.9%), and Transportation (2,687 | 3.8%).
Production, Transportation and Moving Occupations by Sex
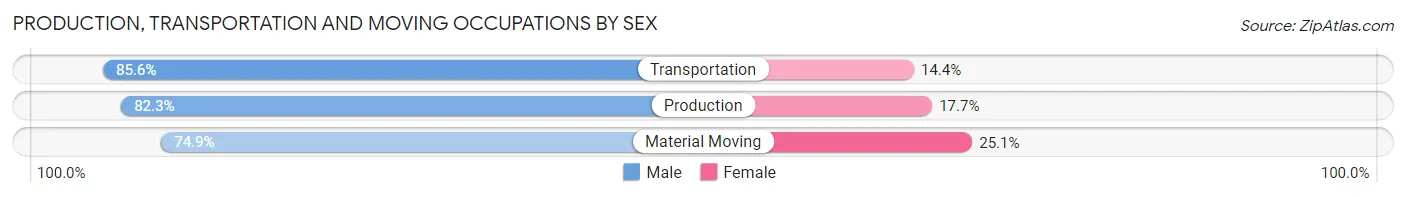
| Occupation | Male | Female |
| Production | 3,186 (82.3%) | 687 (17.7%) |
| Transportation | 2,300 (85.6%) | 387 (14.4%) |
| Material Moving | 2,577 (74.9%) | 863 (25.1%) |
| Total (Category) | 8,063 (80.6%) | 1,937 (19.4%) |
| Total (Overall) | 37,467 (53.2%) | 32,960 (46.8%) |
Employment Industries by Sex in Pueblo County
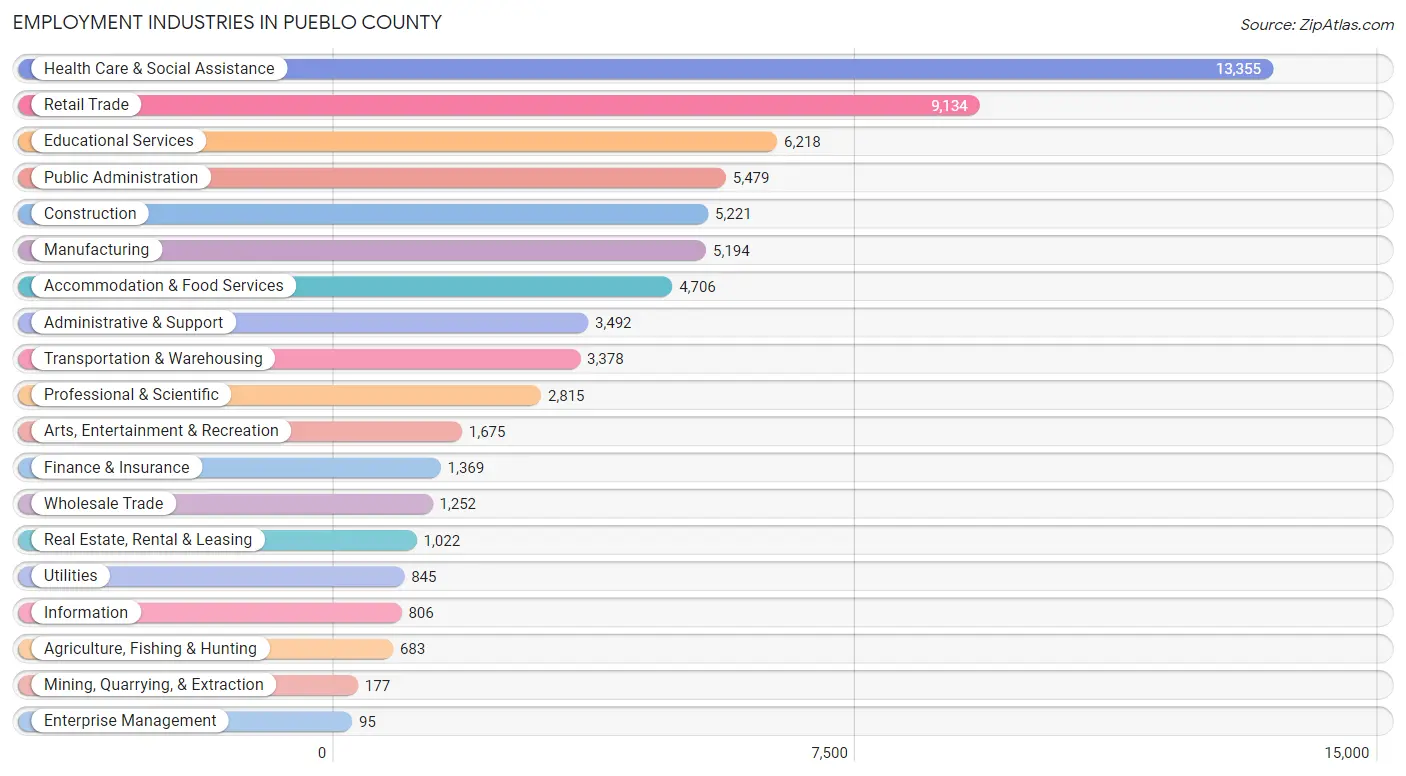
Employment Industries in Pueblo County
The major employment industries in Pueblo County include Health Care & Social Assistance (13,355 | 19.0%), Retail Trade (9,134 | 13.0%), Educational Services (6,218 | 8.8%), Public Administration (5,479 | 7.8%), and Construction (5,221 | 7.4%).
Employment Industries by Sex in Pueblo County
The Pueblo County industries that see more men than women are Mining, Quarrying, & Extraction (100.0%), Construction (88.3%), and Transportation & Warehousing (83.4%), whereas the industries that tend to have a higher number of women are Health Care & Social Assistance (74.3%), Finance & Insurance (62.6%), and Information (62.0%).
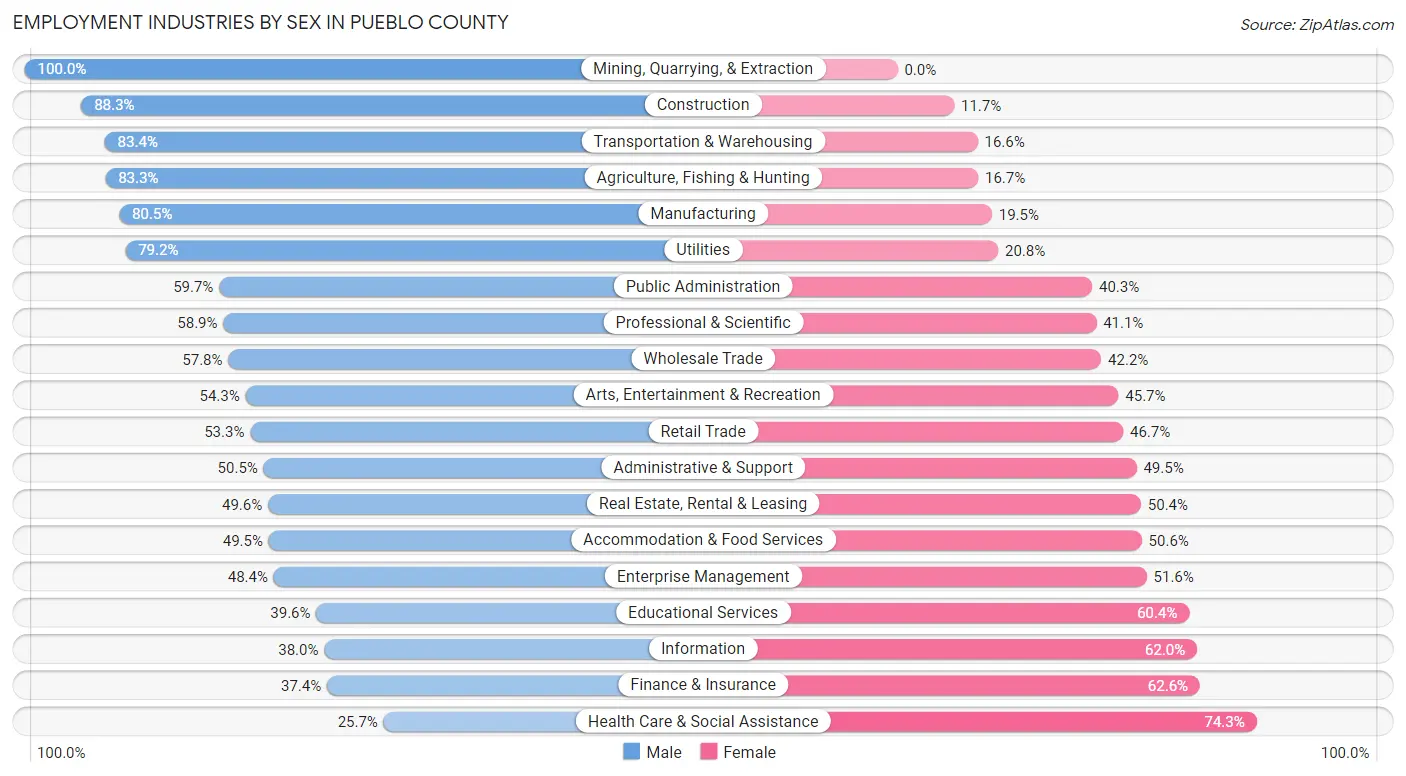
| Industry | Male | Female |
| Agriculture, Fishing & Hunting | 569 (83.3%) | 114 (16.7%) |
| Mining, Quarrying, & Extraction | 177 (100.0%) | 0 (0.0%) |
| Construction | 4,609 (88.3%) | 612 (11.7%) |
| Manufacturing | 4,179 (80.5%) | 1,015 (19.5%) |
| Wholesale Trade | 724 (57.8%) | 528 (42.2%) |
| Retail Trade | 4,868 (53.3%) | 4,266 (46.7%) |
| Transportation & Warehousing | 2,818 (83.4%) | 560 (16.6%) |
| Utilities | 669 (79.2%) | 176 (20.8%) |
| Information | 306 (38.0%) | 500 (62.0%) |
| Finance & Insurance | 512 (37.4%) | 857 (62.6%) |
| Real Estate, Rental & Leasing | 507 (49.6%) | 515 (50.4%) |
| Professional & Scientific | 1,657 (58.9%) | 1,158 (41.1%) |
| Enterprise Management | 46 (48.4%) | 49 (51.6%) |
| Administrative & Support | 1,764 (50.5%) | 1,728 (49.5%) |
| Educational Services | 2,463 (39.6%) | 3,755 (60.4%) |
| Health Care & Social Assistance | 3,428 (25.7%) | 9,927 (74.3%) |
| Arts, Entertainment & Recreation | 909 (54.3%) | 766 (45.7%) |
| Accommodation & Food Services | 2,327 (49.4%) | 2,379 (50.5%) |
| Public Administration | 3,272 (59.7%) | 2,207 (40.3%) |
| Total | 37,467 (53.2%) | 32,960 (46.8%) |
Education in Pueblo County
School Enrollment in Pueblo County
The most common levels of schooling among the 38,819 students in Pueblo County are high school (8,754 | 22.6%), middle school (8,711 | 22.4%), and elementary school (8,501 | 21.9%).

| School Level | # Students | % Students |
| Nursery / Preschool | 1,959 | 5.1% |
| Kindergarten | 2,121 | 5.5% |
| Elementary School | 8,501 | 21.9% |
| Middle School | 8,711 | 22.4% |
| High School | 8,754 | 22.6% |
| College / Undergraduate | 7,299 | 18.8% |
| Graduate / Professional | 1,474 | 3.8% |
| Total | 38,819 | 100.0% |
School Enrollment by Age by Funding Source in Pueblo County
Out of a total of 38,819 students who are enrolled in schools in Pueblo County, 3,804 (9.8%) attend a private institution, while the remaining 35,015 (90.2%) are enrolled in public schools. The age group of 35 years and over has the highest likelihood of being enrolled in private schools, with 411 (20.2% in the age bracket) enrolled. Conversely, the age group of 18 to 19 year olds has the lowest likelihood of being enrolled in a private school, with 2,604 (94.4% in the age bracket) attending a public institution.
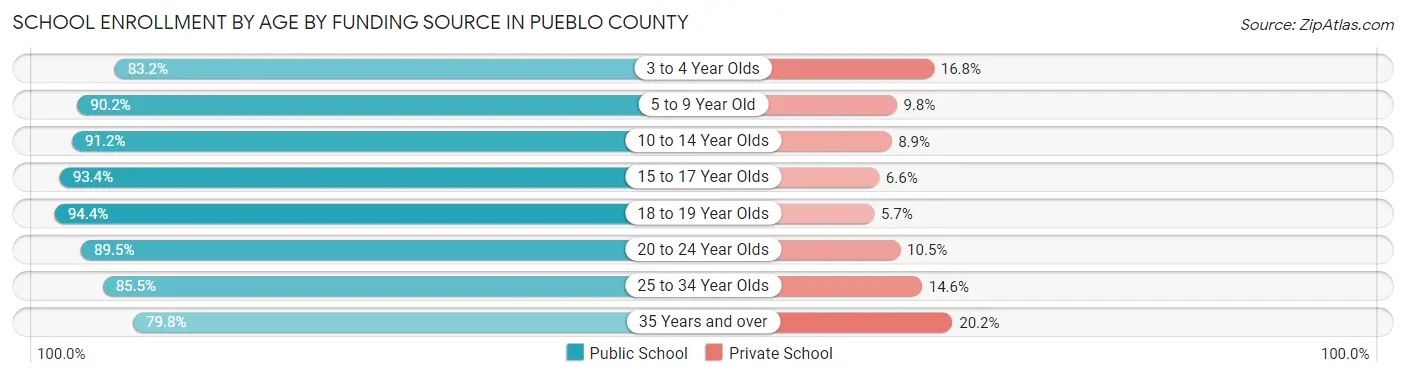
| Age Bracket | Public School | Private School |
| 3 to 4 Year Olds | 1,130 (83.2%) | 228 (16.8%) |
| 5 to 9 Year Old | 8,792 (90.2%) | 960 (9.8%) |
| 10 to 14 Year Olds | 9,839 (91.1%) | 955 (8.8%) |
| 15 to 17 Year Olds | 6,056 (93.4%) | 425 (6.6%) |
| 18 to 19 Year Olds | 2,604 (94.4%) | 156 (5.7%) |
| 20 to 24 Year Olds | 3,086 (89.5%) | 363 (10.5%) |
| 25 to 34 Year Olds | 1,874 (85.5%) | 319 (14.5%) |
| 35 Years and over | 1,621 (79.8%) | 411 (20.2%) |
| Total | 35,015 (90.2%) | 3,804 (9.8%) |
Educational Attainment by Field of Study in Pueblo County
Business (4,801 | 15.5%), education (4,042 | 13.1%), science & technology (3,710 | 12.0%), arts & humanities (2,564 | 8.3%), and social sciences (2,421 | 7.8%) are the most common fields of study among 30,915 individuals in Pueblo County who have obtained a bachelor's degree or higher.
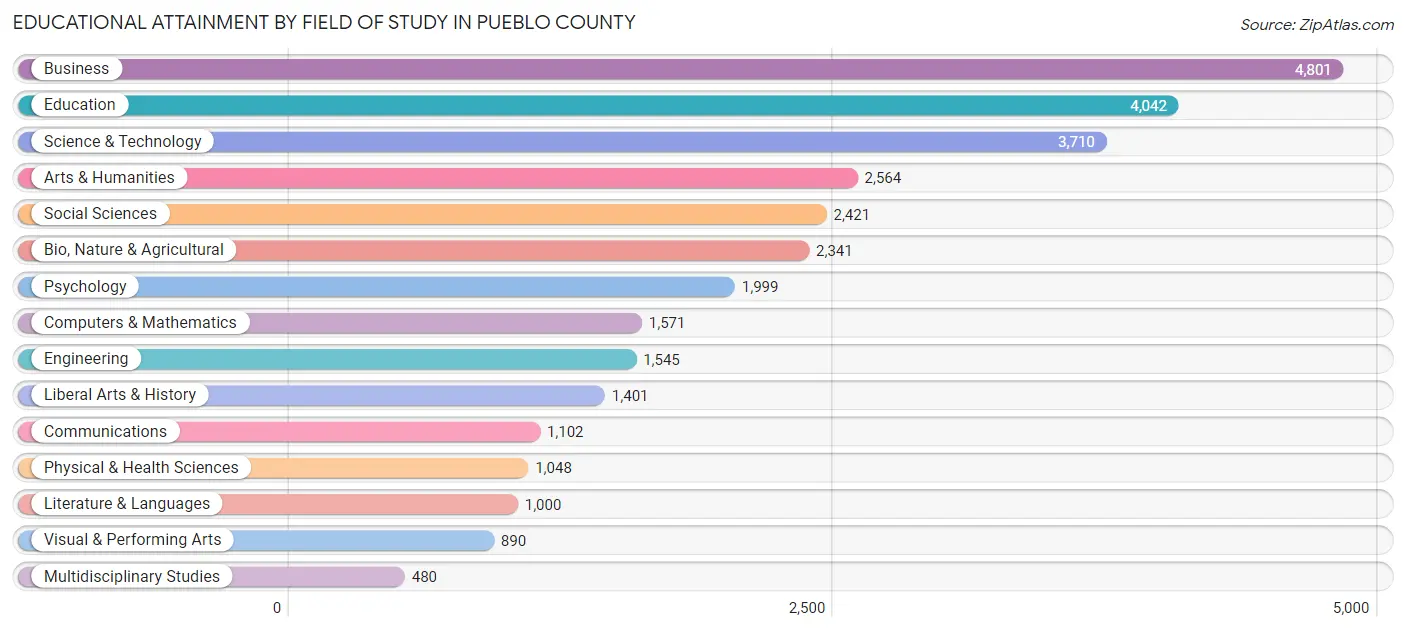
| Field of Study | # Graduates | % Graduates |
| Computers & Mathematics | 1,571 | 5.1% |
| Bio, Nature & Agricultural | 2,341 | 7.6% |
| Physical & Health Sciences | 1,048 | 3.4% |
| Psychology | 1,999 | 6.5% |
| Social Sciences | 2,421 | 7.8% |
| Engineering | 1,545 | 5.0% |
| Multidisciplinary Studies | 480 | 1.5% |
| Science & Technology | 3,710 | 12.0% |
| Business | 4,801 | 15.5% |
| Education | 4,042 | 13.1% |
| Literature & Languages | 1,000 | 3.2% |
| Liberal Arts & History | 1,401 | 4.5% |
| Visual & Performing Arts | 890 | 2.9% |
| Communications | 1,102 | 3.6% |
| Arts & Humanities | 2,564 | 8.3% |
| Total | 30,915 | 100.0% |
Transportation & Commute in Pueblo County
Vehicle Availability by Sex in Pueblo County
The most prevalent vehicle ownership categories in Pueblo County are males with 2 vehicles (14,018, accounting for 37.8%) and females with 2 vehicles (11,705, making up 43.2%).
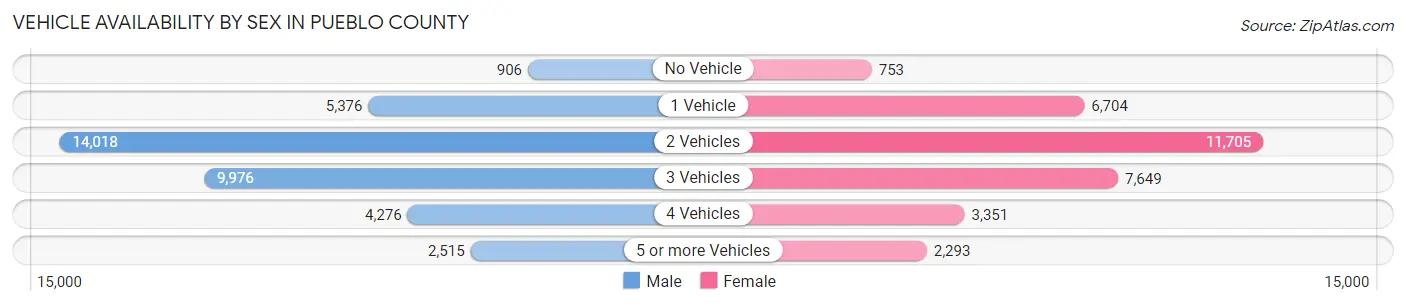
| Vehicles Available | Male | Female |
| No Vehicle | 906 (2.4%) | 753 (2.3%) |
| 1 Vehicle | 5,376 (14.5%) | 6,704 (20.7%) |
| 2 Vehicles | 14,018 (37.8%) | 11,705 (36.1%) |
| 3 Vehicles | 9,976 (26.9%) | 7,649 (23.6%) |
| 4 Vehicles | 4,276 (11.5%) | 3,351 (10.3%) |
| 5 or more Vehicles | 2,515 (6.8%) | 2,293 (7.1%) |
| Total | 37,067 (100.0%) | 32,455 (100.0%) |
Commute Time in Pueblo County
The most frequently occuring commute durations in Pueblo County are 15 to 19 minutes (15,104 commuters, 23.0%), 10 to 14 minutes (13,454 commuters, 20.4%), and 20 to 24 minutes (9,462 commuters, 14.4%).
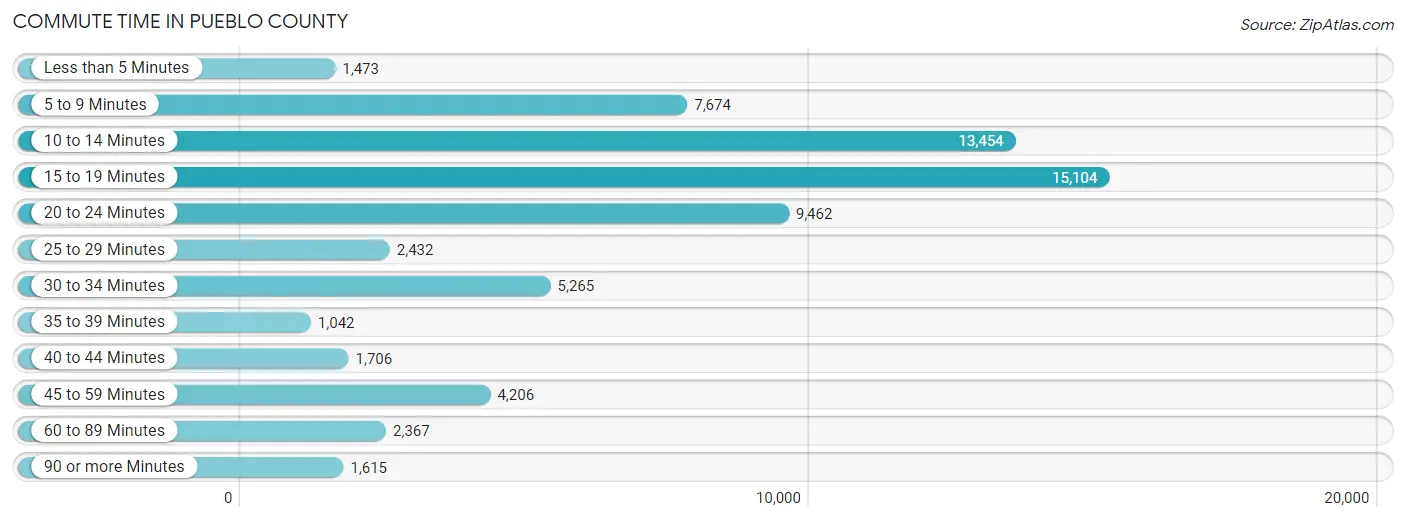
| Commute Time | # Commuters | % Commuters |
| Less than 5 Minutes | 1,473 | 2.2% |
| 5 to 9 Minutes | 7,674 | 11.7% |
| 10 to 14 Minutes | 13,454 | 20.4% |
| 15 to 19 Minutes | 15,104 | 23.0% |
| 20 to 24 Minutes | 9,462 | 14.4% |
| 25 to 29 Minutes | 2,432 | 3.7% |
| 30 to 34 Minutes | 5,265 | 8.0% |
| 35 to 39 Minutes | 1,042 | 1.6% |
| 40 to 44 Minutes | 1,706 | 2.6% |
| 45 to 59 Minutes | 4,206 | 6.4% |
| 60 to 89 Minutes | 2,367 | 3.6% |
| 90 or more Minutes | 1,615 | 2.5% |
Commute Time by Sex in Pueblo County
The most common commute times in Pueblo County are 15 to 19 minutes (7,822 commuters, 21.9%) for males and 15 to 19 minutes (7,282 commuters, 24.2%) for females.

| Commute Time | Male | Female |
| Less than 5 Minutes | 837 (2.3%) | 636 (2.1%) |
| 5 to 9 Minutes | 3,615 (10.1%) | 4,059 (13.5%) |
| 10 to 14 Minutes | 6,739 (18.9%) | 6,715 (22.3%) |
| 15 to 19 Minutes | 7,822 (21.9%) | 7,282 (24.2%) |
| 20 to 24 Minutes | 4,844 (13.6%) | 4,618 (15.4%) |
| 25 to 29 Minutes | 1,204 (3.4%) | 1,228 (4.1%) |
| 30 to 34 Minutes | 3,237 (9.1%) | 2,028 (6.8%) |
| 35 to 39 Minutes | 528 (1.5%) | 514 (1.7%) |
| 40 to 44 Minutes | 1,010 (2.8%) | 696 (2.3%) |
| 45 to 59 Minutes | 2,945 (8.2%) | 1,261 (4.2%) |
| 60 to 89 Minutes | 1,720 (4.8%) | 647 (2.1%) |
| 90 or more Minutes | 1,241 (3.5%) | 374 (1.2%) |
Time of Departure to Work by Sex in Pueblo County
The most frequent times of departure to work in Pueblo County are 6:30 AM to 6:59 AM (4,659, 13.0%) for males and 7:00 AM to 7:29 AM (4,645, 15.4%) for females.
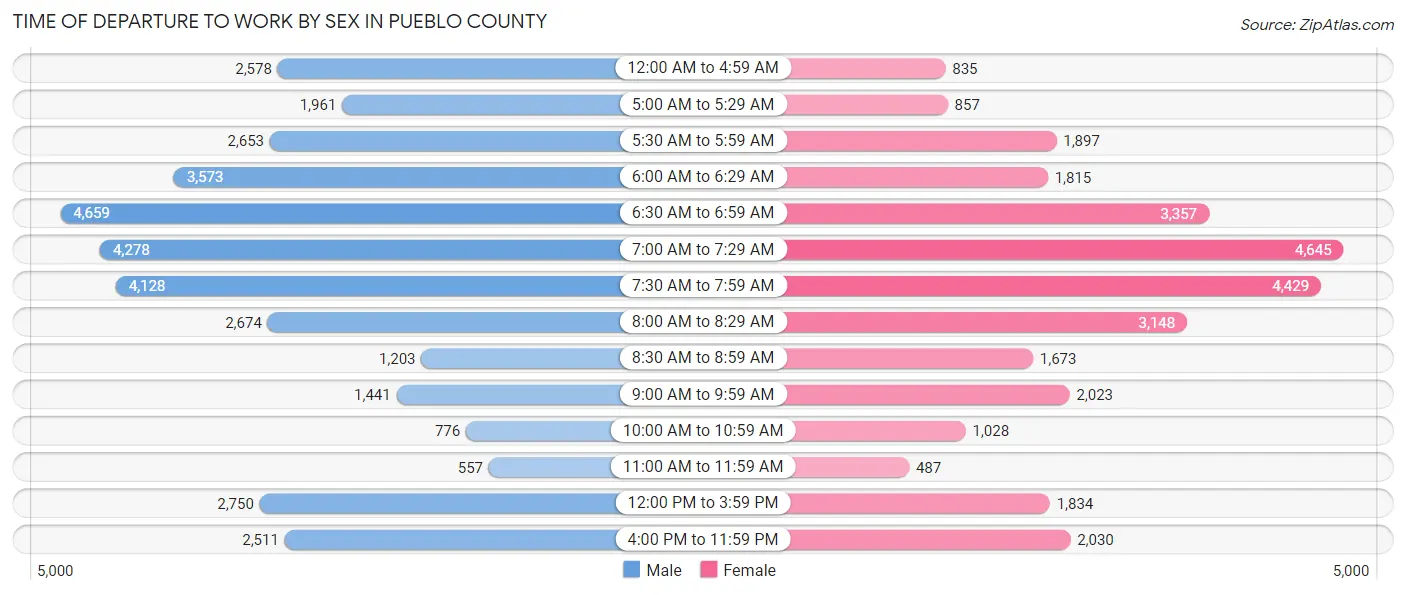
| Time of Departure | Male | Female |
| 12:00 AM to 4:59 AM | 2,578 (7.2%) | 835 (2.8%) |
| 5:00 AM to 5:29 AM | 1,961 (5.5%) | 857 (2.9%) |
| 5:30 AM to 5:59 AM | 2,653 (7.4%) | 1,897 (6.3%) |
| 6:00 AM to 6:29 AM | 3,573 (10.0%) | 1,815 (6.0%) |
| 6:30 AM to 6:59 AM | 4,659 (13.0%) | 3,357 (11.2%) |
| 7:00 AM to 7:29 AM | 4,278 (12.0%) | 4,645 (15.4%) |
| 7:30 AM to 7:59 AM | 4,128 (11.6%) | 4,429 (14.7%) |
| 8:00 AM to 8:29 AM | 2,674 (7.5%) | 3,148 (10.5%) |
| 8:30 AM to 8:59 AM | 1,203 (3.4%) | 1,673 (5.6%) |
| 9:00 AM to 9:59 AM | 1,441 (4.0%) | 2,023 (6.7%) |
| 10:00 AM to 10:59 AM | 776 (2.2%) | 1,028 (3.4%) |
| 11:00 AM to 11:59 AM | 557 (1.6%) | 487 (1.6%) |
| 12:00 PM to 3:59 PM | 2,750 (7.7%) | 1,834 (6.1%) |
| 4:00 PM to 11:59 PM | 2,511 (7.0%) | 2,030 (6.8%) |
| Total | 35,742 (100.0%) | 30,058 (100.0%) |
Housing Occupancy in Pueblo County
Occupancy by Ownership in Pueblo County
Of the total 67,090 dwellings in Pueblo County, owner-occupied units account for 44,861 (66.9%), while renter-occupied units make up 22,229 (33.1%).
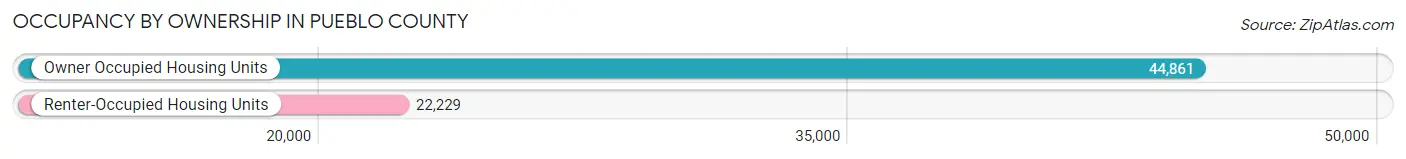
| Occupancy | # Housing Units | % Housing Units |
| Owner Occupied Housing Units | 44,861 | 66.9% |
| Renter-Occupied Housing Units | 22,229 | 33.1% |
| Total Occupied Housing Units | 67,090 | 100.0% |
Occupancy by Household Size in Pueblo County
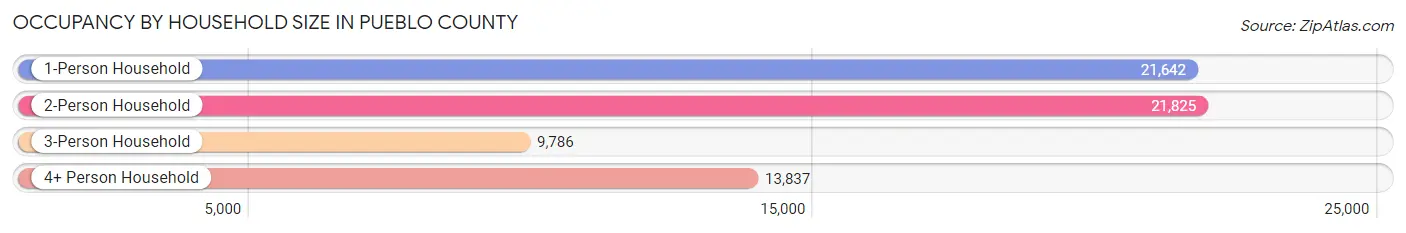
| Household Size | # Housing Units | % Housing Units |
| 1-Person Household | 21,642 | 32.3% |
| 2-Person Household | 21,825 | 32.5% |
| 3-Person Household | 9,786 | 14.6% |
| 4+ Person Household | 13,837 | 20.6% |
| Total Housing Units | 67,090 | 100.0% |
Occupancy by Ownership by Household Size in Pueblo County

| Household Size | Owner-occupied | Renter-occupied |
| 1-Person Household | 12,066 (55.7%) | 9,576 (44.3%) |
| 2-Person Household | 16,363 (75.0%) | 5,462 (25.0%) |
| 3-Person Household | 6,825 (69.7%) | 2,961 (30.3%) |
| 4+ Person Household | 9,607 (69.4%) | 4,230 (30.6%) |
| Total Housing Units | 44,861 (66.9%) | 22,229 (33.1%) |
Occupancy by Educational Attainment in Pueblo County
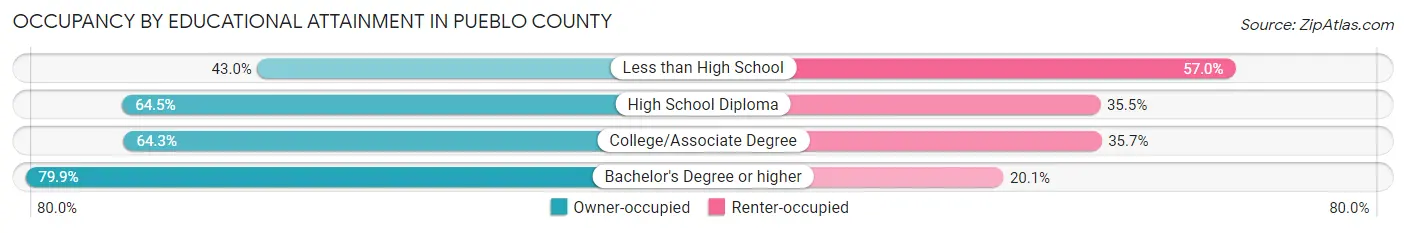
| Household Size | Owner-occupied | Renter-occupied |
| Less than High School | 2,098 (43.0%) | 2,778 (57.0%) |
| High School Diploma | 11,049 (64.5%) | 6,082 (35.5%) |
| College/Associate Degree | 17,746 (64.3%) | 9,854 (35.7%) |
| Bachelor's Degree or higher | 13,968 (79.9%) | 3,515 (20.1%) |
Occupancy by Age of Householder in Pueblo County
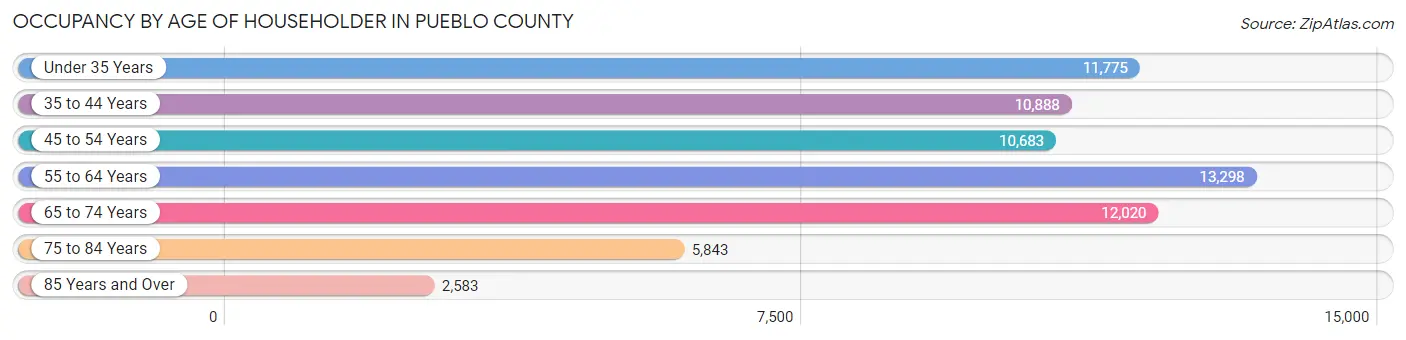
| Age Bracket | # Households | % Households |
| Under 35 Years | 11,775 | 17.5% |
| 35 to 44 Years | 10,888 | 16.2% |
| 45 to 54 Years | 10,683 | 15.9% |
| 55 to 64 Years | 13,298 | 19.8% |
| 65 to 74 Years | 12,020 | 17.9% |
| 75 to 84 Years | 5,843 | 8.7% |
| 85 Years and Over | 2,583 | 3.8% |
| Total | 67,090 | 100.0% |
Housing Finances in Pueblo County
Median Income by Occupancy in Pueblo County
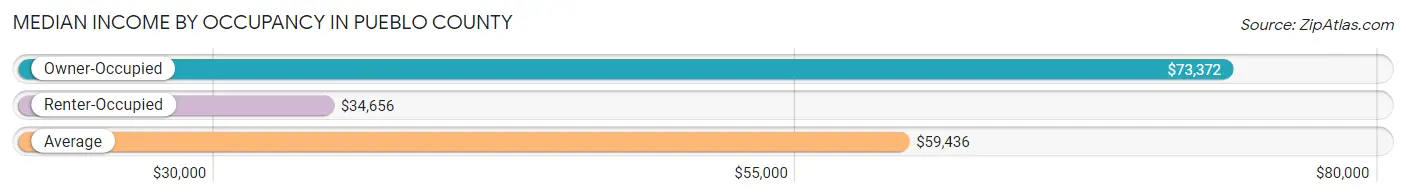
| Occupancy Type | # Households | Median Income |
| Owner-Occupied | 44,861 (66.9%) | $73,372 |
| Renter-Occupied | 22,229 (33.1%) | $34,656 |
| Average | 67,090 (100.0%) | $59,436 |
Occupancy by Householder Income Bracket in Pueblo County
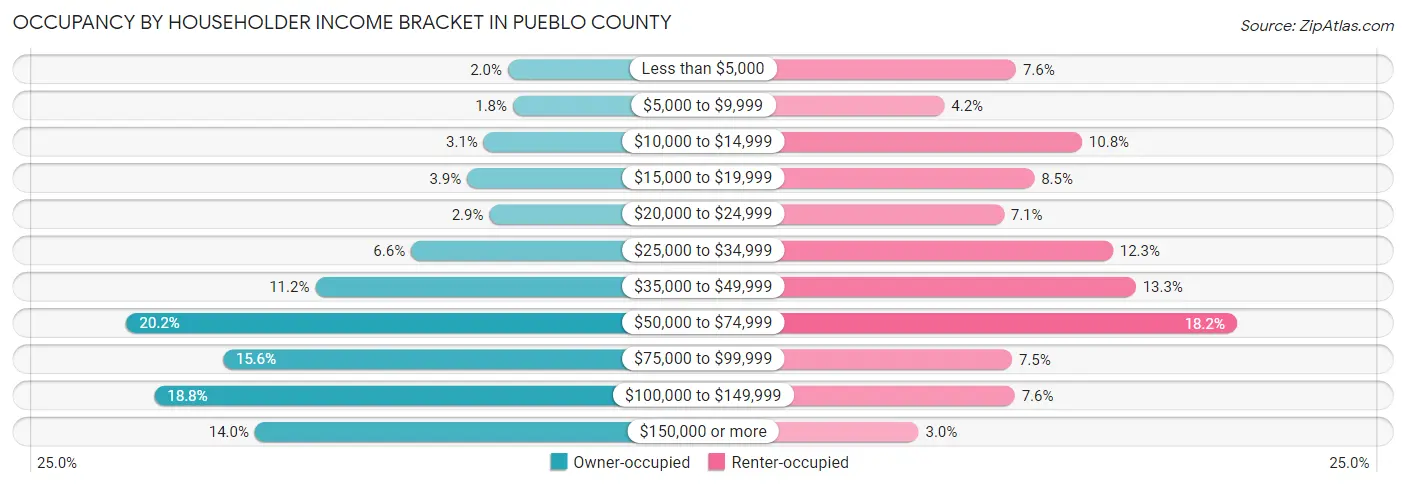
| Income Bracket | Owner-occupied | Renter-occupied |
| Less than $5,000 | 891 (2.0%) | 1,699 (7.6%) |
| $5,000 to $9,999 | 785 (1.8%) | 941 (4.2%) |
| $10,000 to $14,999 | 1,407 (3.1%) | 2,396 (10.8%) |
| $15,000 to $19,999 | 1,762 (3.9%) | 1,891 (8.5%) |
| $20,000 to $24,999 | 1,289 (2.9%) | 1,570 (7.1%) |
| $25,000 to $34,999 | 2,962 (6.6%) | 2,724 (12.2%) |
| $35,000 to $49,999 | 5,005 (11.2%) | 2,966 (13.3%) |
| $50,000 to $74,999 | 9,040 (20.2%) | 4,034 (18.1%) |
| $75,000 to $99,999 | 6,979 (15.6%) | 1,655 (7.4%) |
| $100,000 to $149,999 | 8,442 (18.8%) | 1,686 (7.6%) |
| $150,000 or more | 6,299 (14.0%) | 667 (3.0%) |
| Total | 44,861 (100.0%) | 22,229 (100.0%) |
Monthly Housing Cost Tiers in Pueblo County
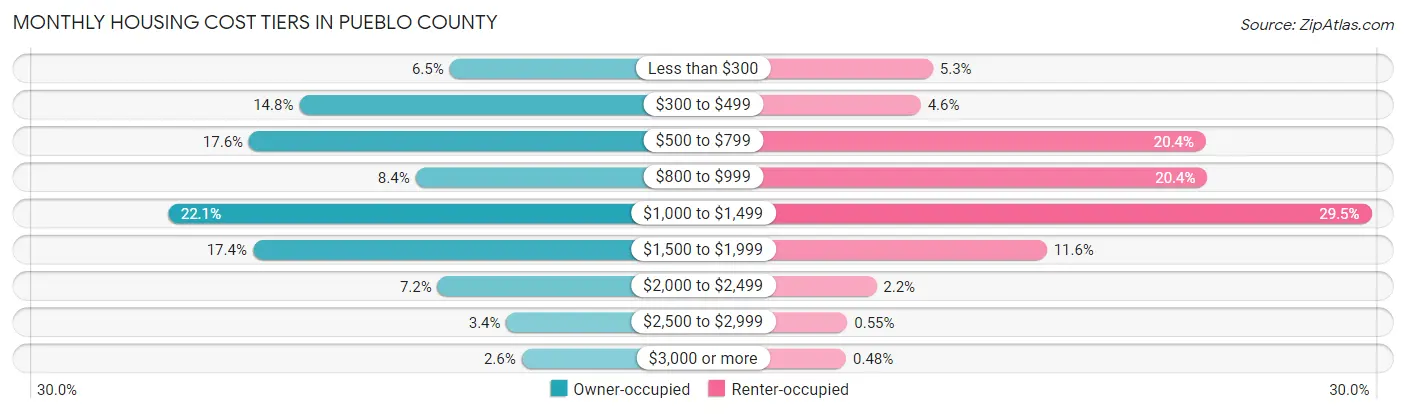
| Monthly Cost | Owner-occupied | Renter-occupied |
| Less than $300 | 2,928 (6.5%) | 1,172 (5.3%) |
| $300 to $499 | 6,655 (14.8%) | 1,022 (4.6%) |
| $500 to $799 | 7,902 (17.6%) | 4,523 (20.3%) |
| $800 to $999 | 3,771 (8.4%) | 4,542 (20.4%) |
| $1,000 to $1,499 | 9,908 (22.1%) | 6,555 (29.5%) |
| $1,500 to $1,999 | 7,805 (17.4%) | 2,569 (11.6%) |
| $2,000 to $2,499 | 3,227 (7.2%) | 478 (2.1%) |
| $2,500 to $2,999 | 1,523 (3.4%) | 123 (0.5%) |
| $3,000 or more | 1,142 (2.5%) | 106 (0.5%) |
| Total | 44,861 (100.0%) | 22,229 (100.0%) |
Physical Housing Characteristics in Pueblo County
Housing Structures in Pueblo County
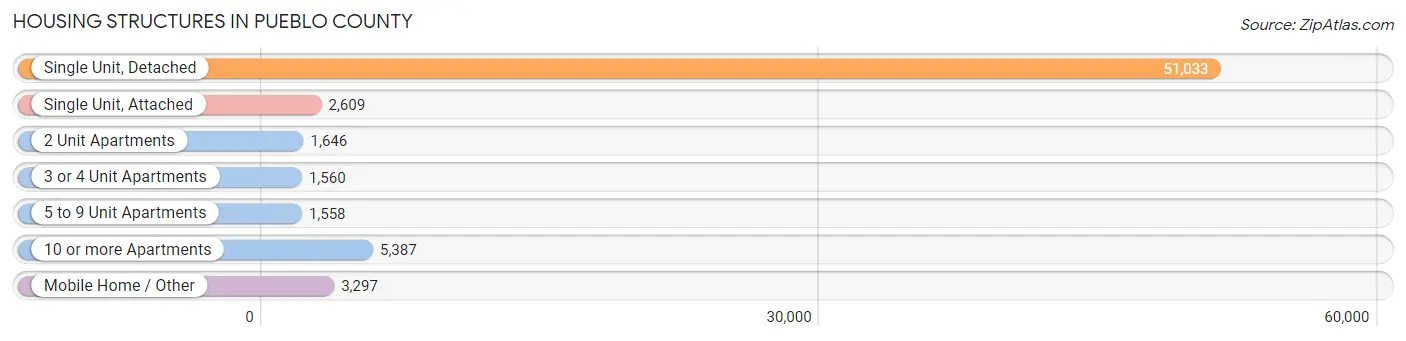
| Structure Type | # Housing Units | % Housing Units |
| Single Unit, Detached | 51,033 | 76.1% |
| Single Unit, Attached | 2,609 | 3.9% |
| 2 Unit Apartments | 1,646 | 2.5% |
| 3 or 4 Unit Apartments | 1,560 | 2.3% |
| 5 to 9 Unit Apartments | 1,558 | 2.3% |
| 10 or more Apartments | 5,387 | 8.0% |
| Mobile Home / Other | 3,297 | 4.9% |
| Total | 67,090 | 100.0% |
Housing Structures by Occupancy in Pueblo County
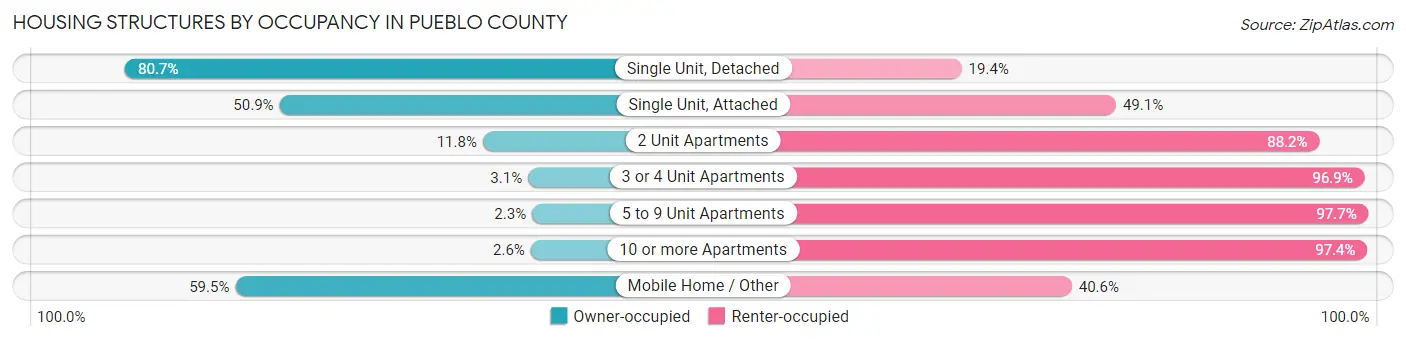
| Structure Type | Owner-occupied | Renter-occupied |
| Single Unit, Detached | 41,156 (80.6%) | 9,877 (19.4%) |
| Single Unit, Attached | 1,329 (50.9%) | 1,280 (49.1%) |
| 2 Unit Apartments | 194 (11.8%) | 1,452 (88.2%) |
| 3 or 4 Unit Apartments | 48 (3.1%) | 1,512 (96.9%) |
| 5 to 9 Unit Apartments | 36 (2.3%) | 1,522 (97.7%) |
| 10 or more Apartments | 138 (2.6%) | 5,249 (97.4%) |
| Mobile Home / Other | 1,960 (59.5%) | 1,337 (40.6%) |
| Total | 44,861 (66.9%) | 22,229 (33.1%) |
Housing Structures by Number of Rooms in Pueblo County
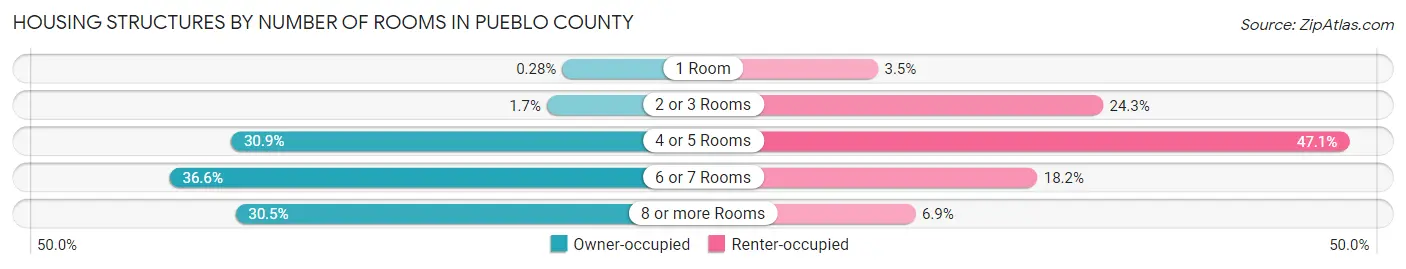
| Number of Rooms | Owner-occupied | Renter-occupied |
| 1 Room | 127 (0.3%) | 773 (3.5%) |
| 2 or 3 Rooms | 764 (1.7%) | 5,399 (24.3%) |
| 4 or 5 Rooms | 13,866 (30.9%) | 10,465 (47.1%) |
| 6 or 7 Rooms | 16,416 (36.6%) | 4,049 (18.2%) |
| 8 or more Rooms | 13,688 (30.5%) | 1,543 (6.9%) |
| Total | 44,861 (100.0%) | 22,229 (100.0%) |
Housing Structure by Heating Type in Pueblo County
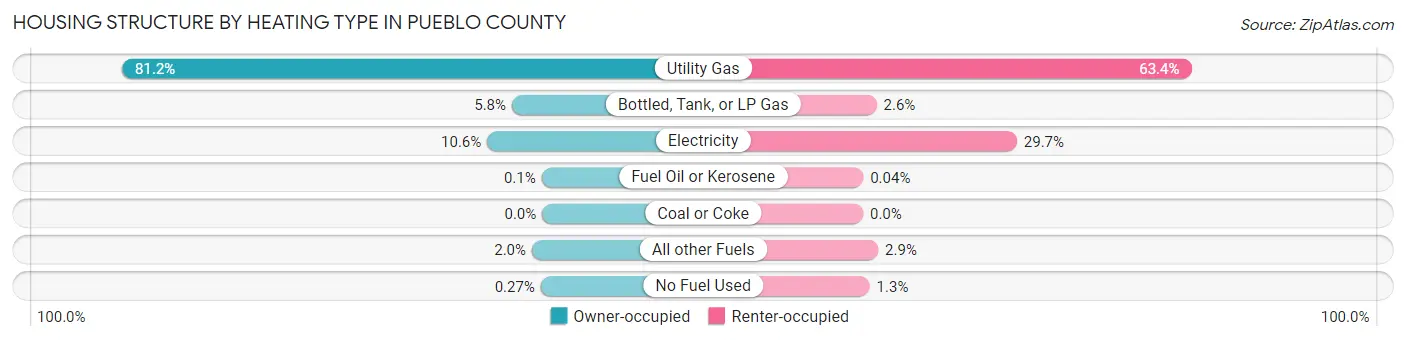
| Heating Type | Owner-occupied | Renter-occupied |
| Utility Gas | 36,422 (81.2%) | 14,098 (63.4%) |
| Bottled, Tank, or LP Gas | 2,618 (5.8%) | 582 (2.6%) |
| Electricity | 4,770 (10.6%) | 6,607 (29.7%) |
| Fuel Oil or Kerosene | 43 (0.1%) | 9 (0.0%) |
| Coal or Coke | 0 (0.0%) | 0 (0.0%) |
| All other Fuels | 888 (2.0%) | 649 (2.9%) |
| No Fuel Used | 120 (0.3%) | 284 (1.3%) |
| Total | 44,861 (100.0%) | 22,229 (100.0%) |
Household Vehicle Usage in Pueblo County
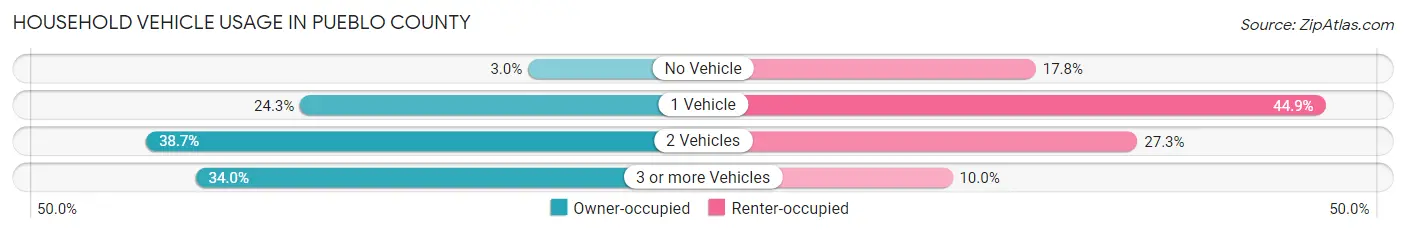
| Vehicles per Household | Owner-occupied | Renter-occupied |
| No Vehicle | 1,347 (3.0%) | 3,961 (17.8%) |
| 1 Vehicle | 10,893 (24.3%) | 9,969 (44.9%) |
| 2 Vehicles | 17,349 (38.7%) | 6,068 (27.3%) |
| 3 or more Vehicles | 15,272 (34.0%) | 2,231 (10.0%) |
| Total | 44,861 (100.0%) | 22,229 (100.0%) |
Real Estate & Mortgages in Pueblo County
Real Estate and Mortgage Overview in Pueblo County
| Characteristic | Without Mortgage | With Mortgage |
| Housing Units | 16,505 | 28,356 |
| Median Property Value | $218,600 | $249,500 |
| Median Household Income | $56,400 | $4,836 |
| Monthly Housing Costs | $476 | $1,082 |
| Real Estate Taxes | $1,098 | $641 |
Property Value by Mortgage Status in Pueblo County
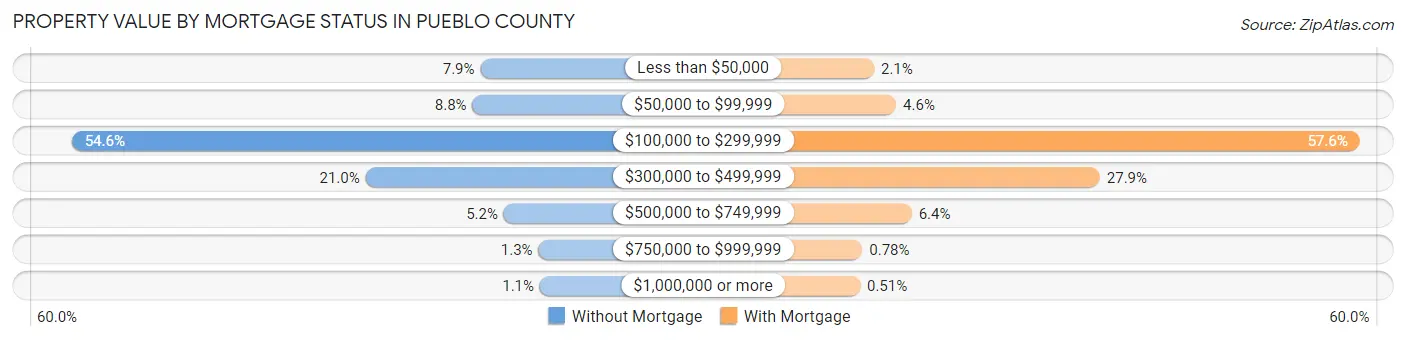
| Property Value | Without Mortgage | With Mortgage |
| Less than $50,000 | 1,305 (7.9%) | 597 (2.1%) |
| $50,000 to $99,999 | 1,455 (8.8%) | 1,315 (4.6%) |
| $100,000 to $299,999 | 9,014 (54.6%) | 16,339 (57.6%) |
| $300,000 to $499,999 | 3,472 (21.0%) | 7,917 (27.9%) |
| $500,000 to $749,999 | 863 (5.2%) | 1,820 (6.4%) |
| $750,000 to $999,999 | 212 (1.3%) | 222 (0.8%) |
| $1,000,000 or more | 184 (1.1%) | 146 (0.5%) |
| Total | 16,505 (100.0%) | 28,356 (100.0%) |
Household Income by Mortgage Status in Pueblo County
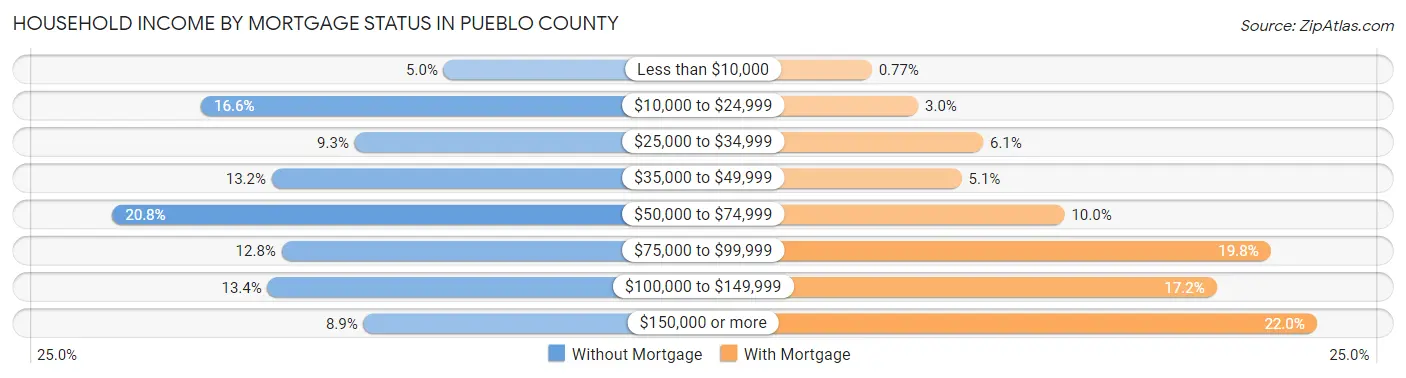
| Household Income | Without Mortgage | With Mortgage |
| Less than $10,000 | 832 (5.0%) | 218 (0.8%) |
| $10,000 to $24,999 | 2,738 (16.6%) | 844 (3.0%) |
| $25,000 to $34,999 | 1,531 (9.3%) | 1,720 (6.1%) |
| $35,000 to $49,999 | 2,183 (13.2%) | 1,431 (5.1%) |
| $50,000 to $74,999 | 3,436 (20.8%) | 2,822 (10.0%) |
| $75,000 to $99,999 | 2,106 (12.8%) | 5,604 (19.8%) |
| $100,000 to $149,999 | 2,216 (13.4%) | 4,873 (17.2%) |
| $150,000 or more | 1,463 (8.9%) | 6,226 (22.0%) |
| Total | 16,505 (100.0%) | 28,356 (100.0%) |
Property Value to Household Income Ratio in Pueblo County
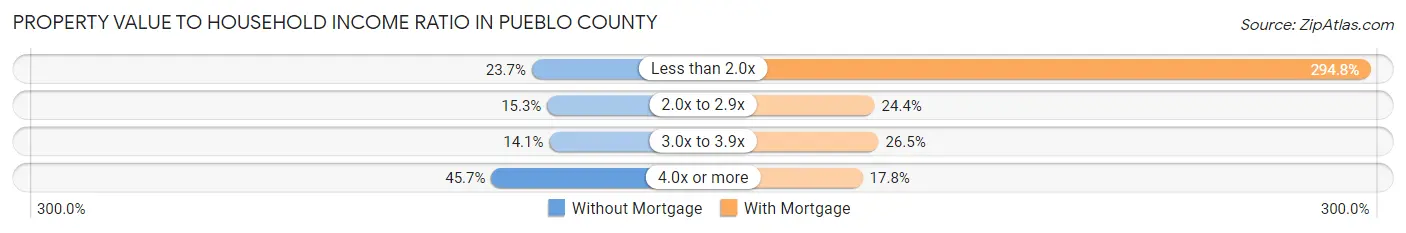
| Value-to-Income Ratio | Without Mortgage | With Mortgage |
| Less than 2.0x | 3,904 (23.6%) | 83,604 (294.8%) |
| 2.0x to 2.9x | 2,522 (15.3%) | 6,914 (24.4%) |
| 3.0x to 3.9x | 2,334 (14.1%) | 7,507 (26.5%) |
| 4.0x or more | 7,548 (45.7%) | 5,058 (17.8%) |
| Total | 16,505 (100.0%) | 28,356 (100.0%) |
Real Estate Taxes by Mortgage Status in Pueblo County
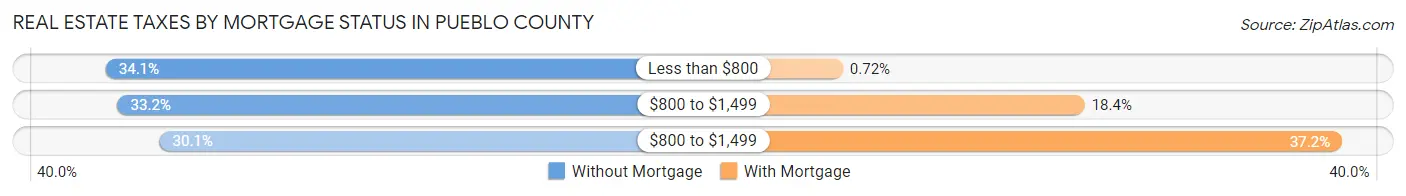
| Property Taxes | Without Mortgage | With Mortgage |
| Less than $800 | 5,621 (34.1%) | 203 (0.7%) |
| $800 to $1,499 | 5,480 (33.2%) | 5,215 (18.4%) |
| $800 to $1,499 | 4,973 (30.1%) | 10,544 (37.2%) |
| Total | 16,505 (100.0%) | 28,356 (100.0%) |
Health & Disability in Pueblo County
Health Insurance Coverage by Age in Pueblo County
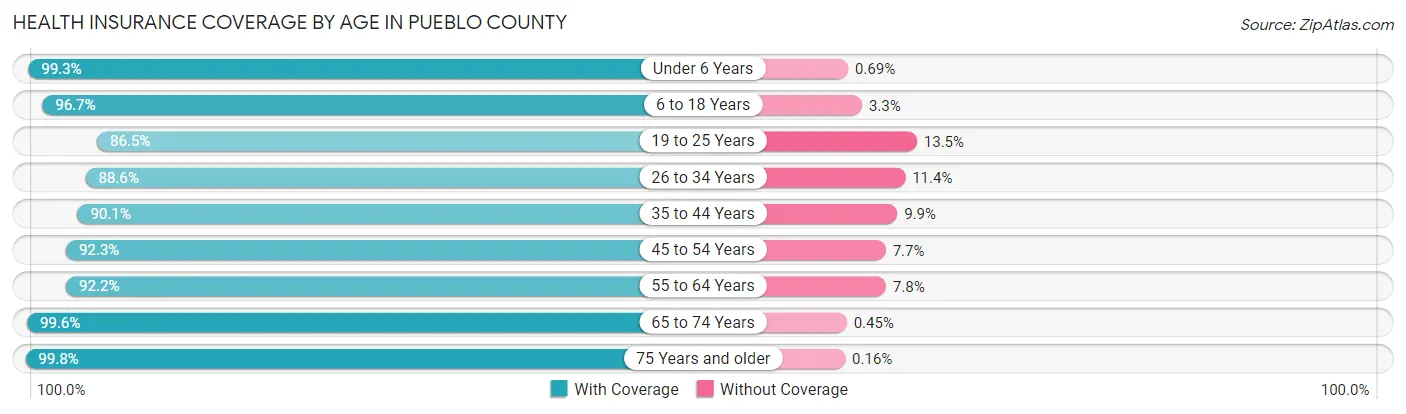
| Age Bracket | With Coverage | Without Coverage |
| Under 6 Years | 11,359 (99.3%) | 79 (0.7%) |
| 6 to 18 Years | 26,683 (96.7%) | 912 (3.3%) |
| 19 to 25 Years | 12,288 (86.5%) | 1,922 (13.5%) |
| 26 to 34 Years | 17,356 (88.6%) | 2,224 (11.4%) |
| 35 to 44 Years | 18,165 (90.1%) | 1,990 (9.9%) |
| 45 to 54 Years | 17,788 (92.3%) | 1,488 (7.7%) |
| 55 to 64 Years | 19,898 (92.2%) | 1,674 (7.8%) |
| 65 to 74 Years | 18,377 (99.6%) | 83 (0.4%) |
| 75 Years and older | 12,189 (99.8%) | 19 (0.2%) |
| Total | 154,103 (93.7%) | 10,391 (6.3%) |
Health Insurance Coverage by Citizenship Status in Pueblo County

| Citizenship Status | With Coverage | Without Coverage |
| Native Born | 11,359 (99.3%) | 79 (0.7%) |
| Foreign Born, Citizen | 26,683 (96.7%) | 912 (3.3%) |
| Foreign Born, not a Citizen | 12,288 (86.5%) | 1,922 (13.5%) |
Health Insurance Coverage by Household Income in Pueblo County
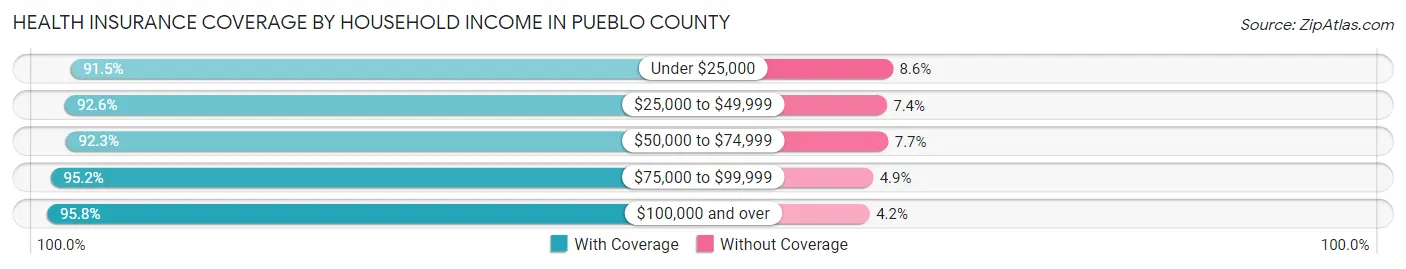
| Household Income | With Coverage | Without Coverage |
| Under $25,000 | 22,583 (91.4%) | 2,111 (8.6%) |
| $25,000 to $49,999 | 26,847 (92.6%) | 2,146 (7.4%) |
| $50,000 to $74,999 | 28,926 (92.3%) | 2,407 (7.7%) |
| $75,000 to $99,999 | 22,826 (95.2%) | 1,164 (4.9%) |
| $100,000 and over | 51,518 (95.8%) | 2,258 (4.2%) |
Public vs Private Health Insurance Coverage by Age in Pueblo County
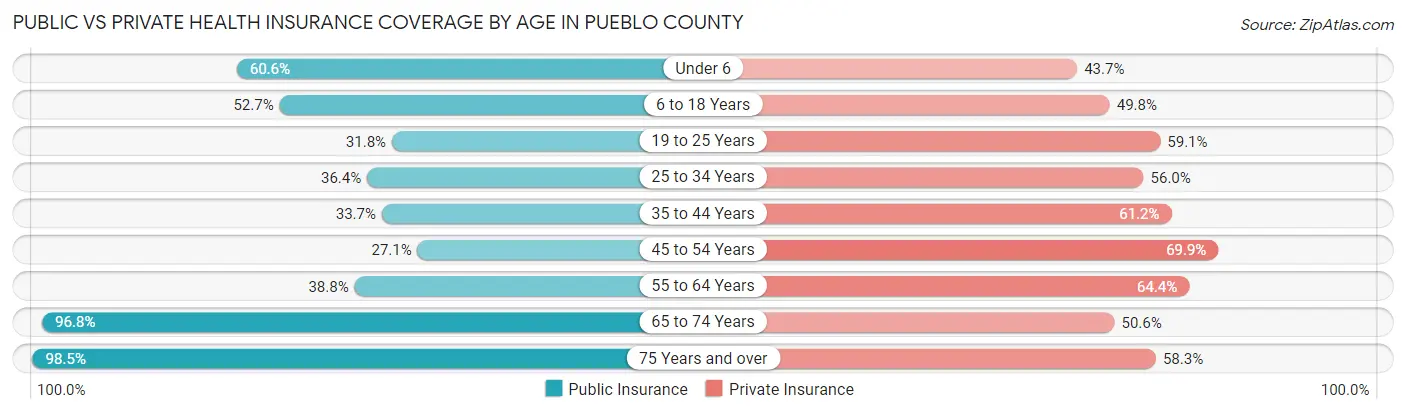
| Age Bracket | Public Insurance | Private Insurance |
| Under 6 | 6,933 (60.6%) | 4,998 (43.7%) |
| 6 to 18 Years | 14,540 (52.7%) | 13,728 (49.7%) |
| 19 to 25 Years | 4,521 (31.8%) | 8,403 (59.1%) |
| 25 to 34 Years | 7,135 (36.4%) | 10,968 (56.0%) |
| 35 to 44 Years | 6,792 (33.7%) | 12,325 (61.2%) |
| 45 to 54 Years | 5,218 (27.1%) | 13,467 (69.9%) |
| 55 to 64 Years | 8,364 (38.8%) | 13,901 (64.4%) |
| 65 to 74 Years | 17,860 (96.8%) | 9,346 (50.6%) |
| 75 Years and over | 12,029 (98.5%) | 7,120 (58.3%) |
| Total | 83,392 (50.7%) | 94,256 (57.3%) |
Disability Status by Sex by Age in Pueblo County
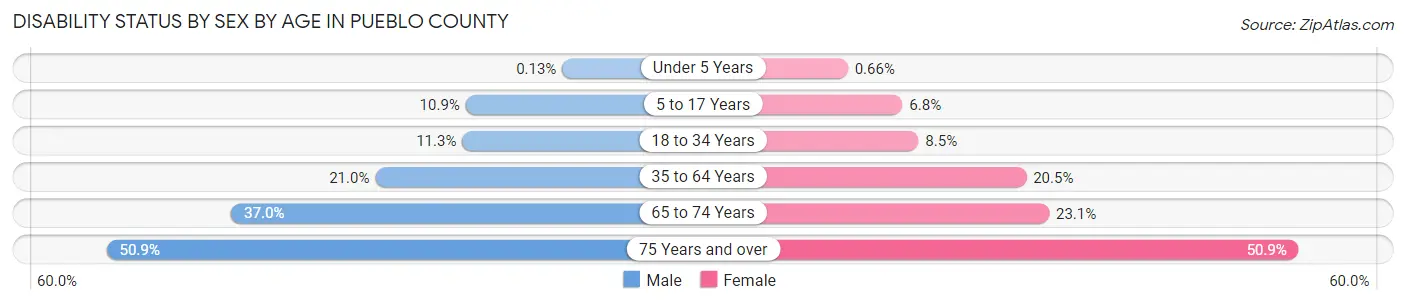
| Age Bracket | Male | Female |
| Under 5 Years | 6 (0.1%) | 30 (0.7%) |
| 5 to 17 Years | 1,565 (10.9%) | 921 (6.8%) |
| 18 to 34 Years | 2,031 (11.3%) | 1,492 (8.5%) |
| 35 to 64 Years | 6,297 (20.9%) | 6,356 (20.5%) |
| 65 to 74 Years | 3,261 (37.0%) | 2,226 (23.1%) |
| 75 Years and over | 2,613 (50.9%) | 3,598 (50.9%) |
Disability Class by Sex by Age in Pueblo County
Disability Class: Hearing Difficulty
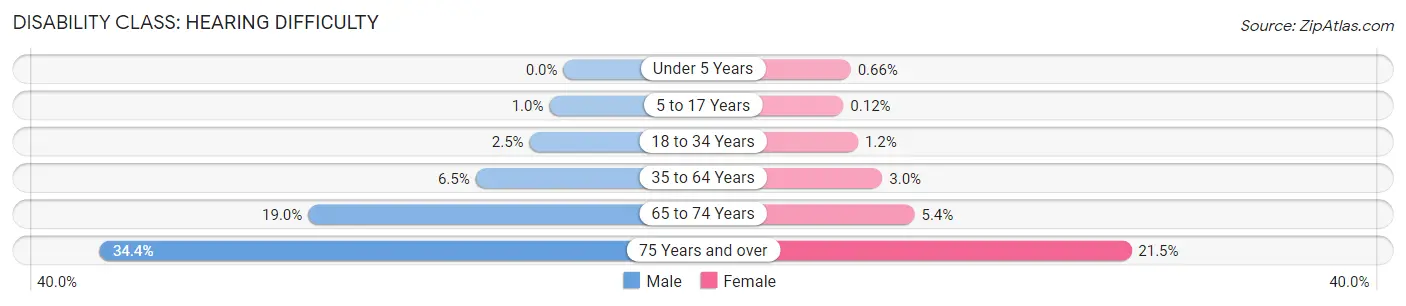
| Age Bracket | Male | Female |
| Under 5 Years | 0 (0.0%) | 30 (0.7%) |
| 5 to 17 Years | 149 (1.0%) | 17 (0.1%) |
| 18 to 34 Years | 455 (2.5%) | 210 (1.2%) |
| 35 to 64 Years | 1,958 (6.5%) | 933 (3.0%) |
| 65 to 74 Years | 1,671 (19.0%) | 521 (5.4%) |
| 75 Years and over | 1,767 (34.4%) | 1,520 (21.5%) |
Disability Class: Vision Difficulty
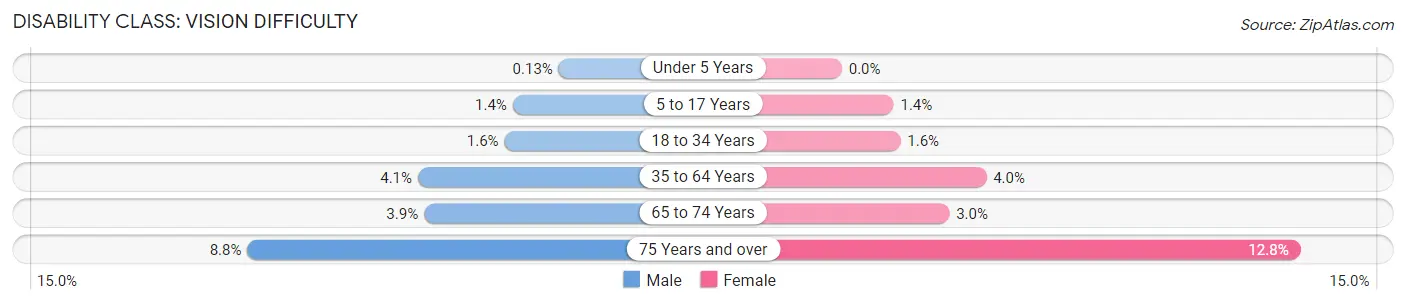
| Age Bracket | Male | Female |
| Under 5 Years | 6 (0.1%) | 0 (0.0%) |
| 5 to 17 Years | 203 (1.4%) | 197 (1.4%) |
| 18 to 34 Years | 296 (1.6%) | 286 (1.6%) |
| 35 to 64 Years | 1,218 (4.1%) | 1,243 (4.0%) |
| 65 to 74 Years | 342 (3.9%) | 288 (3.0%) |
| 75 Years and over | 452 (8.8%) | 903 (12.8%) |
Disability Class: Cognitive Difficulty
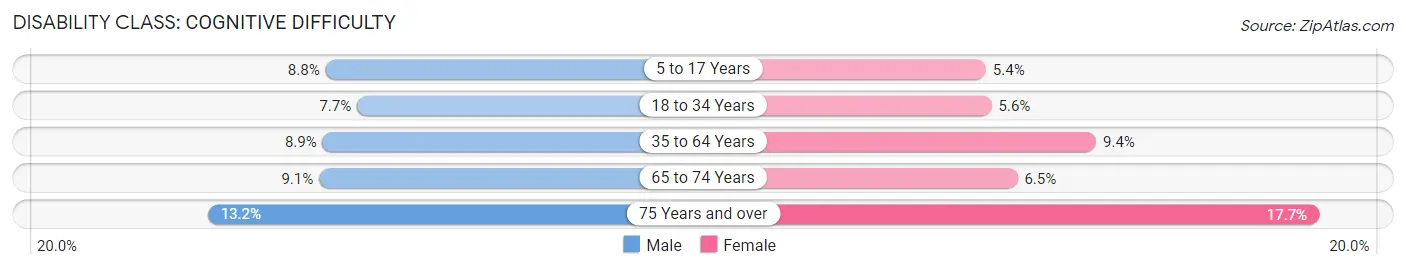
| Age Bracket | Male | Female |
| 5 to 17 Years | 1,269 (8.8%) | 731 (5.3%) |
| 18 to 34 Years | 1,382 (7.7%) | 973 (5.6%) |
| 35 to 64 Years | 2,687 (8.9%) | 2,921 (9.4%) |
| 65 to 74 Years | 800 (9.1%) | 629 (6.5%) |
| 75 Years and over | 678 (13.2%) | 1,252 (17.7%) |
Disability Class: Ambulatory Difficulty
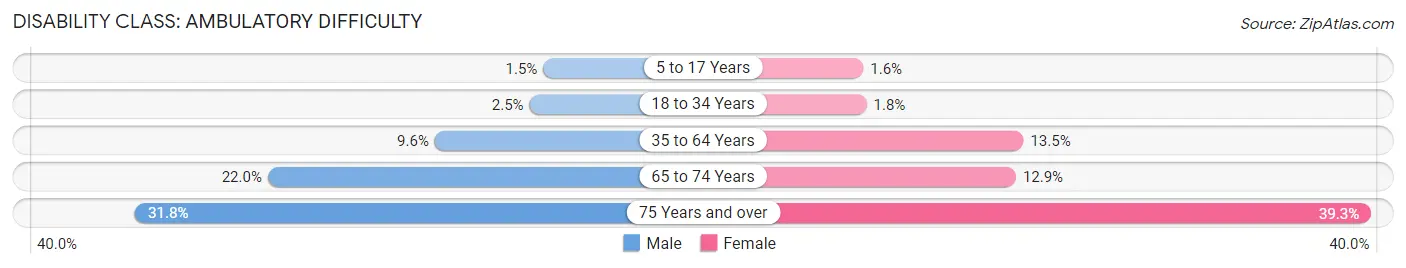
| Age Bracket | Male | Female |
| 5 to 17 Years | 215 (1.5%) | 219 (1.6%) |
| 18 to 34 Years | 455 (2.5%) | 322 (1.8%) |
| 35 to 64 Years | 2,869 (9.6%) | 4,175 (13.5%) |
| 65 to 74 Years | 1,935 (22.0%) | 1,247 (12.9%) |
| 75 Years and over | 1,633 (31.8%) | 2,778 (39.3%) |
Disability Class: Self-Care Difficulty
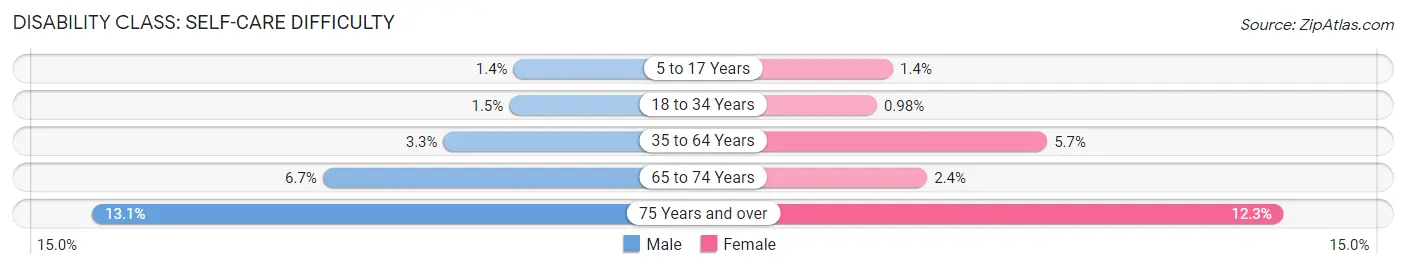
| Age Bracket | Male | Female |
| 5 to 17 Years | 200 (1.4%) | 195 (1.4%) |
| 18 to 34 Years | 273 (1.5%) | 172 (1.0%) |
| 35 to 64 Years | 1,004 (3.3%) | 1,771 (5.7%) |
| 65 to 74 Years | 591 (6.7%) | 230 (2.4%) |
| 75 Years and over | 674 (13.1%) | 870 (12.3%) |
Technology Access in Pueblo County
Computing Device Access in Pueblo County

| Device Type | # Households | % Households |
| Desktop or Laptop | 48,393 | 72.1% |
| Smartphone | 56,915 | 84.8% |
| Tablet | 37,499 | 55.9% |
| No Computing Device | 5,392 | 8.0% |
| Total | 67,090 | 100.0% |
Internet Access in Pueblo County
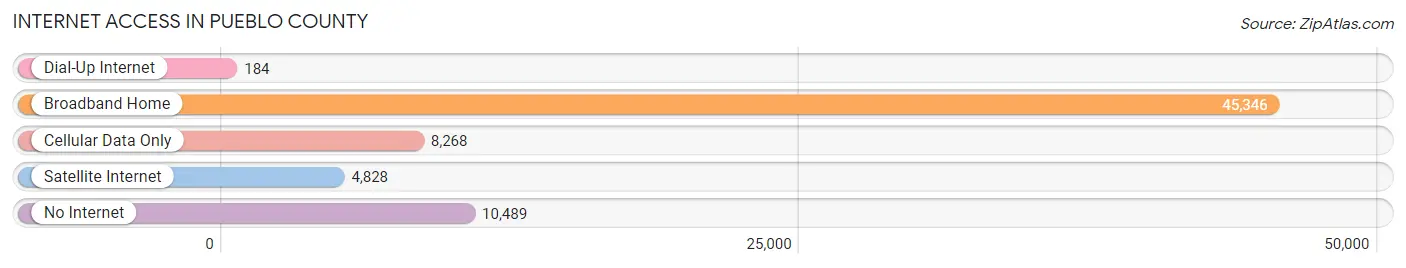
| Internet Type | # Households | % Households |
| Dial-Up Internet | 184 | 0.3% |
| Broadband Home | 45,346 | 67.6% |
| Cellular Data Only | 8,268 | 12.3% |
| Satellite Internet | 4,828 | 7.2% |
| No Internet | 10,489 | 15.6% |
| Total | 67,090 | 100.0% |
Pueblo County Summary
Pueblo County, Colorado is located in the south-central part of the state and is bordered by El Paso County to the north, Huerfano County to the west, Las Animas County to the east, and Fremont County to the south. The county seat is the city of Pueblo, which is the largest city in the county. Pueblo County is part of the Pueblo, CO Metropolitan Statistical Area.
History
The area that is now Pueblo County was originally inhabited by the Ute and Apache tribes. The first Europeans to explore the area were Spanish explorers in the late 1700s. The area was part of the Spanish Empire until 1821, when Mexico gained independence from Spain. In 1848, the area became part of the United States after the Mexican-American War.
In 1861, Pueblo County was created from part of El Paso County. The county was named after the Spanish word for “village” or “town”. The county seat was originally located in the town of Pueblo, which was founded in 1870.
Geography
Pueblo County covers an area of 2,398 square miles and is located in the south-central part of Colorado. The county is bordered by El Paso County to the north, Huerfano County to the west, Las Animas County to the east, and Fremont County to the south. The county is located in the Arkansas River Valley and is home to several mountain ranges, including the Sangre de Cristo Mountains, the Wet Mountains, and the Greenhorn Mountains.
The county is home to several rivers, including the Arkansas River, the Purgatoire River, and the Fountain Creek. The county also contains several reservoirs, including Lake Pueblo, which is the largest reservoir in the state.
Economy
The economy of Pueblo County is largely based on agriculture, manufacturing, and tourism. The county is home to several large agricultural operations, including the Colorado State Fairgrounds, which is the largest fairgrounds in the state. The county is also home to several large manufacturing companies, including Vestas, a wind turbine manufacturer, and the Pueblo Chemical Depot, which is the largest chemical weapons storage facility in the United States.
The county is also home to several tourist attractions, including the Royal Gorge Bridge and Park, the Pueblo Zoo, and the Pueblo Motorsports Park. The county is also home to several casinos, including the Pueblo Grande Casino and the Pueblo Casino.
Demographics
As of the 2010 census, Pueblo County had a population of 159,063. The population was spread out with 33.3% under the age of 18, 10.2% from 18 to 24, 28.2% from 25 to 44, 20.2% from 45 to 64, and 8.1% who were 65 years of age or older. The median age was 32.4 years.
The racial makeup of the county was 77.2% White, 4.3% African American, 1.2% Native American, 0.9% Asian, 0.1% Pacific Islander, 13.7% from other races, and 2.6% from two or more races. Hispanic or Latino of any race were 33.2% of the population.
The median income for a household in the county was $41,845 and the median income for a family was $50,817. The per capita income for the county was $20,945. About 14.2% of families and 18.2% of the population were below the poverty line, including 25.2% of those under age 18 and 8.3% of those age 65 or over.
Common Questions
What is the Total Population of Pueblo County?
Total Population of Pueblo County is 168,135.
What is the Total Male Population of Pueblo County?
Total Male Population of Pueblo County is 83,410.
What is the Total Female Population of Pueblo County?
Total Female Population of Pueblo County is 84,725.
What is the Ratio of Males per 100 Females in Pueblo County?
There are 98.45 Males per 100 Females in Pueblo County.
What is the Ratio of Females per 100 Males in Pueblo County?
There are 101.58 Females per 100 Males in Pueblo County.
What is the Median Population Age in Pueblo County?
Median Population Age in Pueblo County is 39.8 Years.
What is the Average Family Size in Pueblo County
Average Family Size in Pueblo County is 3.1 People.
What is the Average Household Size in Pueblo County
Average Household Size in Pueblo County is 2.4 People.
What is Per Capita Income in Pueblo County?
Per Capita income in Pueblo County is $31,513.
What is the Median Family Income in Pueblo County?
Median Family Income in Pueblo County is $73,803.
What is the Median Household income in Pueblo County?
Median Household Income in Pueblo County is $59,436.
What is Income or Wage Gap in Pueblo County?
Income or Wage Gap in Pueblo County is 24.8%.
Women in Pueblo County earn 75.2 cents for every dollar earned by a man.
What is Family Income Deficit in Pueblo County?
Family Income Deficit in Pueblo County is $10,306.
Families that are below poverty line in Pueblo County earn $10,306 less on average than the poverty threshold level.
What is Inequality or Gini Index in Pueblo County?
Inequality or Gini Index in Pueblo County is 0.45.
How Large is the Labor Force in Pueblo County?
There are 75,372 People in the Labor Forcein in Pueblo County.
What is the Percentage of People in the Labor Force in Pueblo County?
55.8% of People are in the Labor Force in Pueblo County.
What is the Unemployment Rate in Pueblo County?
Unemployment Rate in Pueblo County is 5.9%.