Pitkin County, CO
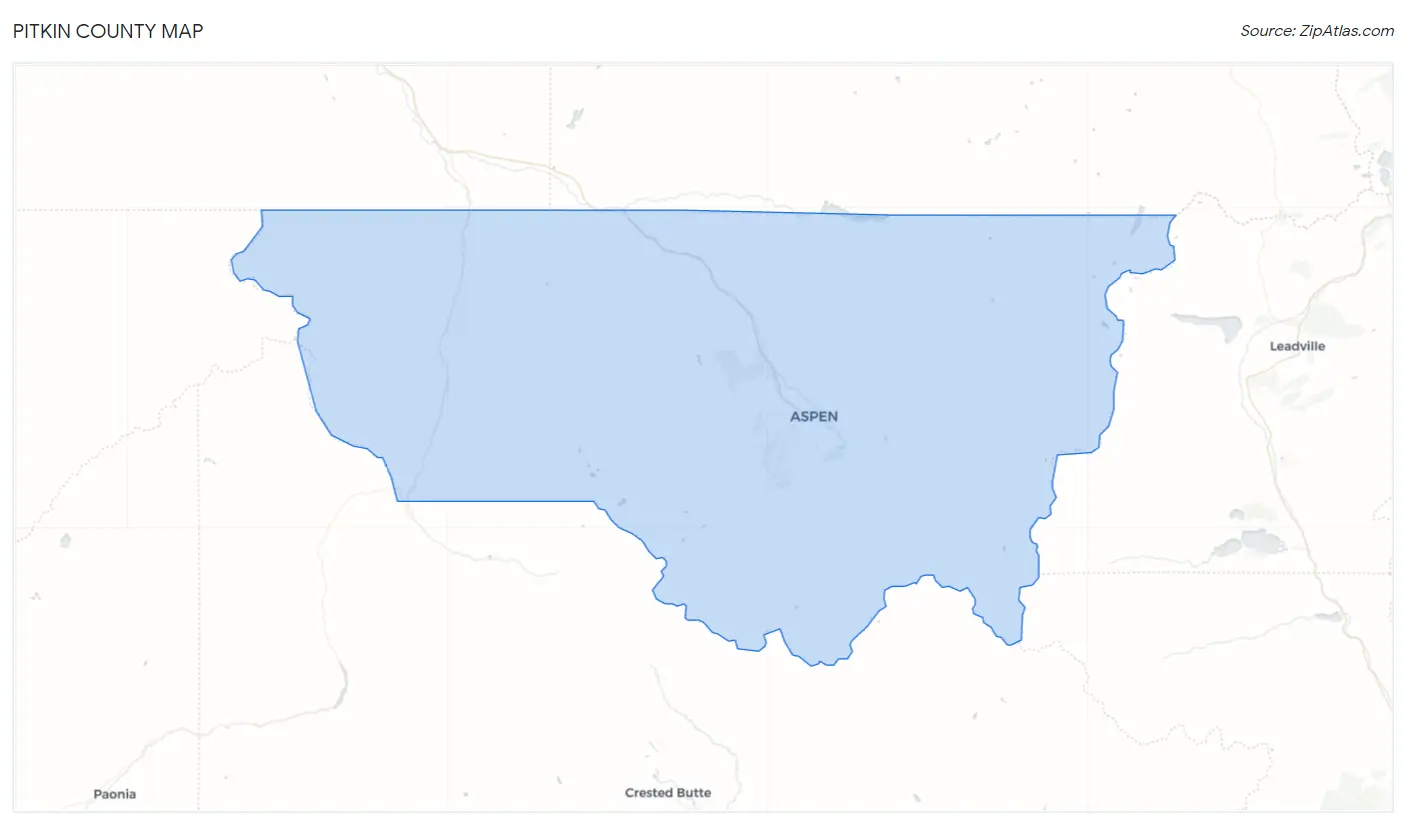
Pitkin County Map
Pitkin County Overview
17,325
TOTAL POPULATION
9,070
MALE POPULATION
8,255
FEMALE POPULATION
109.87
MALES / 100 FEMALES
91.01
FEMALES / 100 MALES
46.7
MEDIAN AGE
2.8
AVG FAMILY SIZE
2.1
AVG HOUSEHOLD SIZE
$87,561
PER CAPITA INCOME
$122,870
AVG FAMILY INCOME
$96,123
AVG HOUSEHOLD INCOME
18.0%
WAGE / INCOME GAP [ % ]
82.0¢/ $1
WAGE / INCOME GAP [ $ ]
0.59
INEQUALITY / GINI INDEX
10,727
LABOR FORCE [ PEOPLE ]
71.9%
PERCENT IN LABOR FORCE
2.1%
UNEMPLOYMENT RATE
Pitkin County Area Codes
Race in Pitkin County
The most populous races in Pitkin County are White / Caucasian (15,266 | 88.1%), Hispanic or Latino (1,865 | 10.8%), and Two or more Races (1,191 | 6.9%).

| Race | # Population | % Population |
| Asian | 391 | 2.3% |
| Black / African American | 75 | 0.4% |
| Hawaiian / Pacific | 0 | 0.0% |
| Hispanic or Latino | 1,865 | 10.8% |
| Native / Alaskan | 97 | 0.6% |
| White / Caucasian | 15,266 | 88.1% |
| Two or more Races | 1,191 | 6.9% |
| Some other Race | 305 | 1.8% |
| Total | 17,325 | 100.0% |
Ancestry in Pitkin County
The most populous ancestries reported in Pitkin County are German (3,291 | 19.0%), English (2,856 | 16.5%), Irish (1,655 | 9.6%), Italian (1,217 | 7.0%), and Scottish (1,075 | 6.2%), together accounting for 58.3% of all Pitkin County residents.

| Ancestry | # Population | % Population |
| Afghan | 14 | 0.1% |
| African | 44 | 0.3% |
| American | 694 | 4.0% |
| Arab | 107 | 0.6% |
| Argentinean | 302 | 1.7% |
| Australian | 37 | 0.2% |
| Austrian | 177 | 1.0% |
| Basque | 5 | 0.0% |
| Belgian | 17 | 0.1% |
| Bhutanese | 1 | 0.0% |
| Brazilian | 127 | 0.7% |
| British | 255 | 1.5% |
| Burmese | 70 | 0.4% |
| Canadian | 99 | 0.6% |
| Celtic | 46 | 0.3% |
| Cherokee | 89 | 0.5% |
| Chilean | 19 | 0.1% |
| Croatian | 8 | 0.1% |
| Cuban | 289 | 1.7% |
| Czech | 133 | 0.8% |
| Czechoslovakian | 8 | 0.1% |
| Danish | 97 | 0.6% |
| Dominican | 17 | 0.1% |
| Dutch | 577 | 3.3% |
| Eastern European | 94 | 0.5% |
| English | 2,856 | 16.5% |
| Ethiopian | 4 | 0.0% |
| European | 349 | 2.0% |
| Finnish | 19 | 0.1% |
| French | 715 | 4.1% |
| French Canadian | 143 | 0.8% |
| German | 3,291 | 19.0% |
| Greek | 51 | 0.3% |
| Hungarian | 150 | 0.9% |
| Indian (Asian) | 209 | 1.2% |
| Irish | 1,655 | 9.6% |
| Israeli | 12 | 0.1% |
| Italian | 1,217 | 7.0% |
| Laotian | 31 | 0.2% |
| Lebanese | 107 | 0.6% |
| Lithuanian | 31 | 0.2% |
| Macedonian | 64 | 0.4% |
| Mexican | 865 | 5.0% |
| Mexican American Indian | 20 | 0.1% |
| Native Hawaiian | 1 | 0.0% |
| Northern European | 52 | 0.3% |
| Norwegian | 306 | 1.8% |
| Pakistani | 110 | 0.6% |
| Peruvian | 76 | 0.4% |
| Polish | 555 | 3.2% |
| Portuguese | 19 | 0.1% |
| Puerto Rican | 108 | 0.6% |
| Russian | 309 | 1.8% |
| Scandinavian | 127 | 0.7% |
| Scotch-Irish | 297 | 1.7% |
| Scottish | 1,075 | 6.2% |
| Slavic | 59 | 0.3% |
| Slovak | 9 | 0.1% |
| Slovene | 28 | 0.2% |
| South American | 397 | 2.3% |
| Spaniard | 171 | 1.0% |
| Spanish | 12 | 0.1% |
| Sri Lankan | 44 | 0.3% |
| Subsaharan African | 48 | 0.3% |
| Swedish | 435 | 2.5% |
| Swiss | 145 | 0.8% |
| Thai | 35 | 0.2% |
| Ukrainian | 25 | 0.1% |
| Welsh | 130 | 0.7% |
| Yugoslavian | 19 | 0.1% | View All 70 Rows |
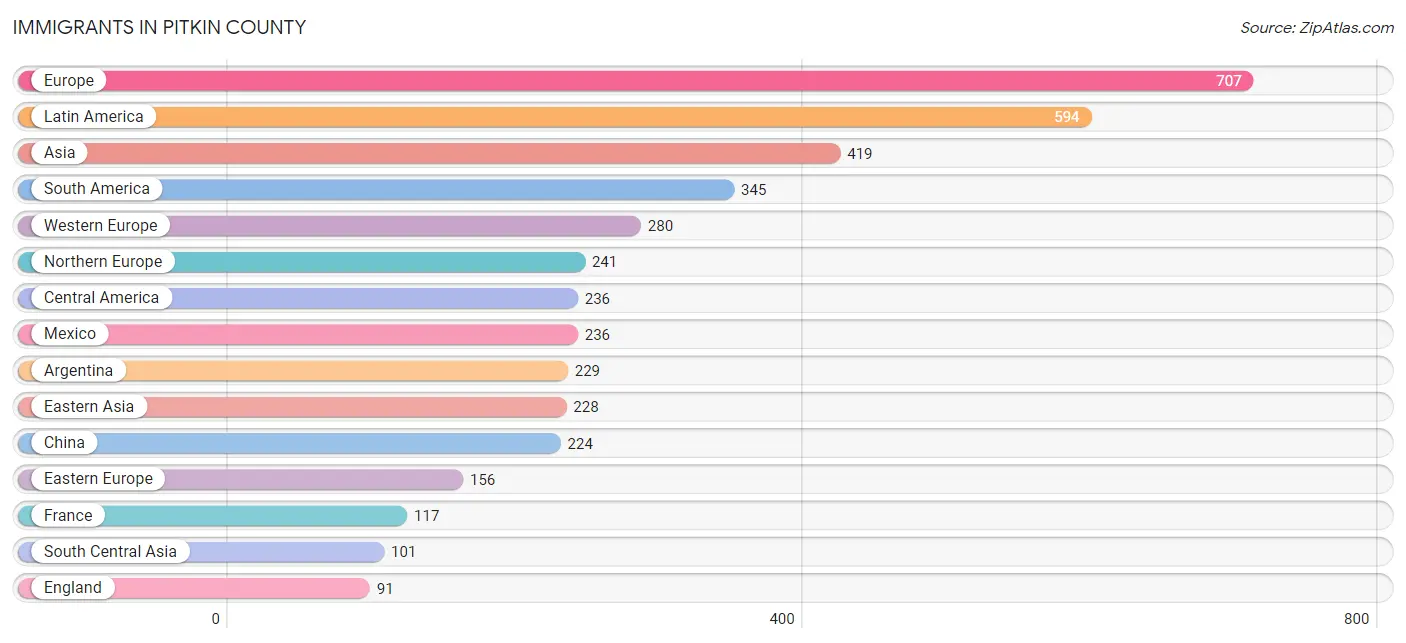
Immigrants in Pitkin County
The most numerous immigrant groups reported in Pitkin County came from Europe (707 | 4.1%), Latin America (594 | 3.4%), Asia (419 | 2.4%), South America (345 | 2.0%), and Western Europe (280 | 1.6%), together accounting for 13.5% of all Pitkin County residents.
| Immigration Origin | # Population | % Population |
| Africa | 21 | 0.1% |
| Argentina | 229 | 1.3% |
| Asia | 419 | 2.4% |
| Australia | 48 | 0.3% |
| Austria | 11 | 0.1% |
| Belgium | 7 | 0.0% |
| Brazil | 59 | 0.3% |
| Canada | 57 | 0.3% |
| Caribbean | 13 | 0.1% |
| Central America | 236 | 1.4% |
| Chile | 19 | 0.1% |
| China | 224 | 1.3% |
| Croatia | 8 | 0.1% |
| Cuba | 13 | 0.1% |
| Eastern Africa | 4 | 0.0% |
| Eastern Asia | 228 | 1.3% |
| Eastern Europe | 156 | 0.9% |
| England | 91 | 0.5% |
| Ethiopia | 4 | 0.0% |
| Europe | 707 | 4.1% |
| France | 117 | 0.7% |
| Germany | 84 | 0.5% |
| Hungary | 28 | 0.2% |
| India | 35 | 0.2% |
| Indonesia | 31 | 0.2% |
| Israel | 13 | 0.1% |
| Kazakhstan | 66 | 0.4% |
| Korea | 4 | 0.0% |
| Latin America | 594 | 3.4% |
| Latvia | 25 | 0.1% |
| Mexico | 236 | 1.4% |
| Netherlands | 52 | 0.3% |
| Northern Europe | 241 | 1.4% |
| Oceania | 48 | 0.3% |
| Peru | 38 | 0.2% |
| Portugal | 15 | 0.1% |
| Russia | 15 | 0.1% |
| South Africa | 17 | 0.1% |
| South America | 345 | 2.0% |
| South Central Asia | 101 | 0.6% |
| South Eastern Asia | 77 | 0.4% |
| Southern Europe | 15 | 0.1% |
| Sweden | 27 | 0.2% |
| Switzerland | 9 | 0.1% |
| Thailand | 46 | 0.3% |
| Ukraine | 16 | 0.1% |
| Western Asia | 13 | 0.1% |
| Western Europe | 280 | 1.6% | View All 48 Rows |
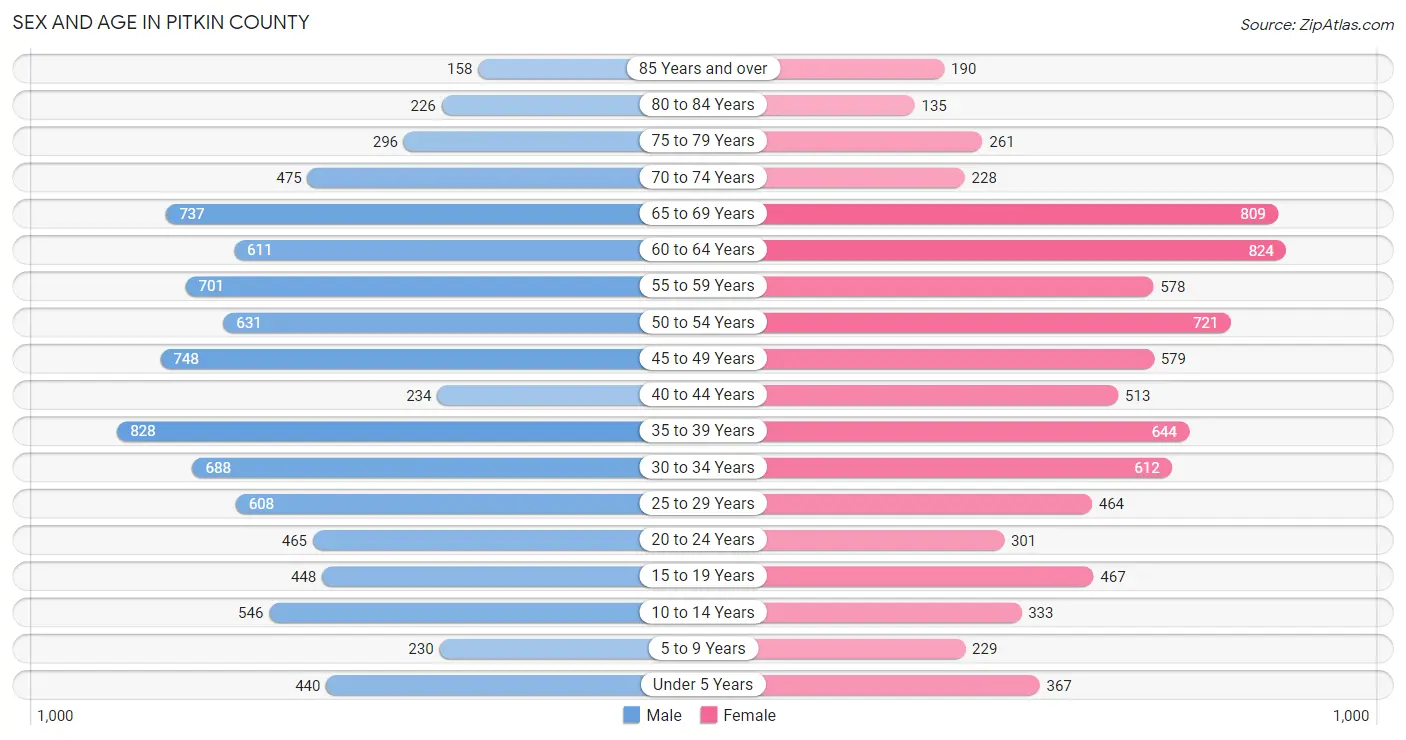
Sex and Age in Pitkin County
Sex and Age in Pitkin County
The most populous age groups in Pitkin County are 35 to 39 Years (828 | 9.1%) for men and 60 to 64 Years (824 | 10.0%) for women.
| Age Bracket | Male | Female |
| Under 5 Years | 440 (4.9%) | 367 (4.4%) |
| 5 to 9 Years | 230 (2.5%) | 229 (2.8%) |
| 10 to 14 Years | 546 (6.0%) | 333 (4.0%) |
| 15 to 19 Years | 448 (4.9%) | 467 (5.7%) |
| 20 to 24 Years | 465 (5.1%) | 301 (3.6%) |
| 25 to 29 Years | 608 (6.7%) | 464 (5.6%) |
| 30 to 34 Years | 688 (7.6%) | 612 (7.4%) |
| 35 to 39 Years | 828 (9.1%) | 644 (7.8%) |
| 40 to 44 Years | 234 (2.6%) | 513 (6.2%) |
| 45 to 49 Years | 748 (8.3%) | 579 (7.0%) |
| 50 to 54 Years | 631 (7.0%) | 721 (8.7%) |
| 55 to 59 Years | 701 (7.7%) | 578 (7.0%) |
| 60 to 64 Years | 611 (6.7%) | 824 (10.0%) |
| 65 to 69 Years | 737 (8.1%) | 809 (9.8%) |
| 70 to 74 Years | 475 (5.2%) | 228 (2.8%) |
| 75 to 79 Years | 296 (3.3%) | 261 (3.2%) |
| 80 to 84 Years | 226 (2.5%) | 135 (1.6%) |
| 85 Years and over | 158 (1.7%) | 190 (2.3%) |
| Total | 9,070 (100.0%) | 8,255 (100.0%) |
Families and Households in Pitkin County
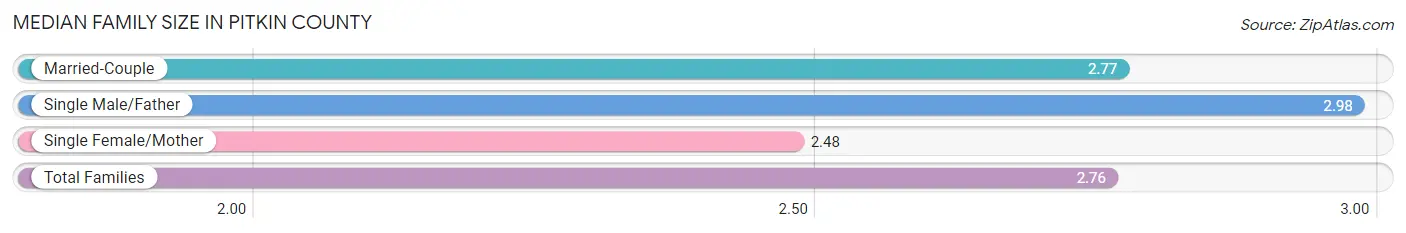
Median Family Size in Pitkin County
The median family size in Pitkin County is 2.76 persons per family, with single male/father families (172 | 4.2%) accounting for the largest median family size of 2.98 persons per family. On the other hand, single female/mother families (331 | 8.0%) represent the smallest median family size with 2.48 persons per family.
| Family Type | # Families | Family Size |
| Married-Couple | 3,633 (87.8%) | 2.77 |
| Single Male/Father | 172 (4.2%) | 2.98 |
| Single Female/Mother | 331 (8.0%) | 2.48 |
| Total Families | 4,136 (100.0%) | 2.76 |
Median Household Size in Pitkin County
The median household size in Pitkin County is 2.11 persons per household, with single male/father households (172 | 2.1%) accounting for the largest median household size of 3.45 persons per household. non-family households (3,978 | 49.0%) represent the smallest median household size with 1.40 persons per household.
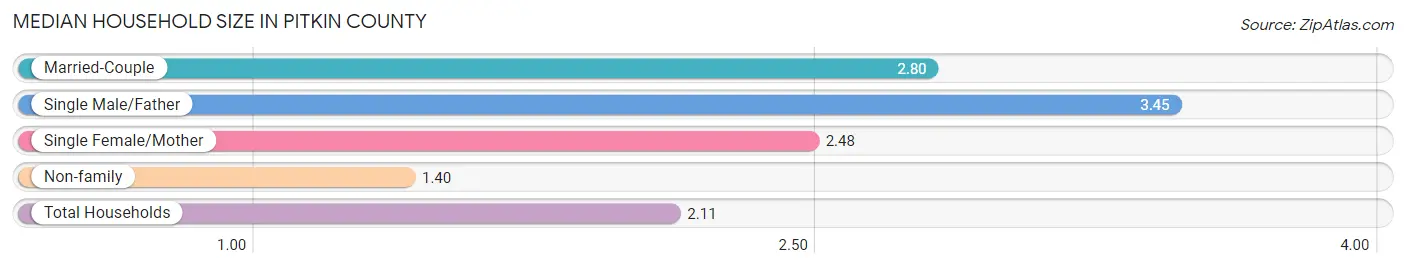
| Household Type | # Households | Household Size |
| Married-Couple | 3,633 (44.8%) | 2.80 |
| Single Male/Father | 172 (2.1%) | 3.45 |
| Single Female/Mother | 331 (4.1%) | 2.48 |
| Non-family | 3,978 (49.0%) | 1.40 |
| Total Households | 8,114 (100.0%) | 2.11 |
Household Size by Marriage Status in Pitkin County
Out of a total of 8,114 households in Pitkin County, 4,136 (51.0%) are family households, while 3,978 (49.0%) are nonfamily households. The most numerous type of family households are 2-person households, comprising 2,327, and the most common type of nonfamily households are 1-person households, comprising 2,969.
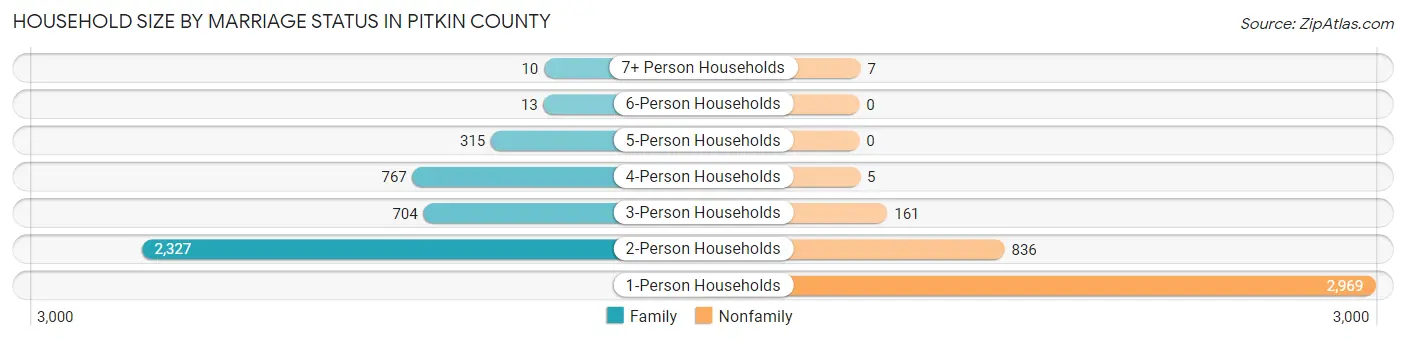
| Household Size | Family Households | Nonfamily Households |
| 1-Person Households | - | 2,969 (36.6%) |
| 2-Person Households | 2,327 (28.7%) | 836 (10.3%) |
| 3-Person Households | 704 (8.7%) | 161 (2.0%) |
| 4-Person Households | 767 (9.5%) | 5 (0.1%) |
| 5-Person Households | 315 (3.9%) | 0 (0.0%) |
| 6-Person Households | 13 (0.2%) | 0 (0.0%) |
| 7+ Person Households | 10 (0.1%) | 7 (0.1%) |
| Total | 4,136 (51.0%) | 3,978 (49.0%) |
Female Fertility in Pitkin County
Fertility by Age in Pitkin County
Average fertility rate in Pitkin County is 12.0 births per 1,000 women. Women in the age bracket of 20 to 34 years have the highest fertility rate with 31.0 births per 1,000 women. Women in the age bracket of 20 to 34 years acount for 100.0% of all women with births.
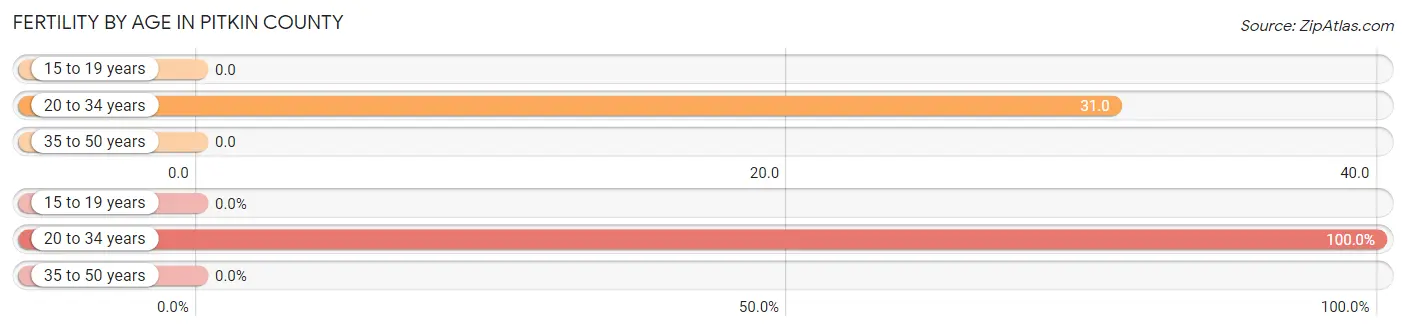
| Age Bracket | Women with Births | Births / 1,000 Women |
| 15 to 19 years | 0 (0.0%) | 0.0 |
| 20 to 34 years | 43 (100.0%) | 31.0 |
| 35 to 50 years | 0 (0.0%) | 0.0 |
| Total | 43 (100.0%) | 12.0 |
Fertility by Age by Marriage Status in Pitkin County
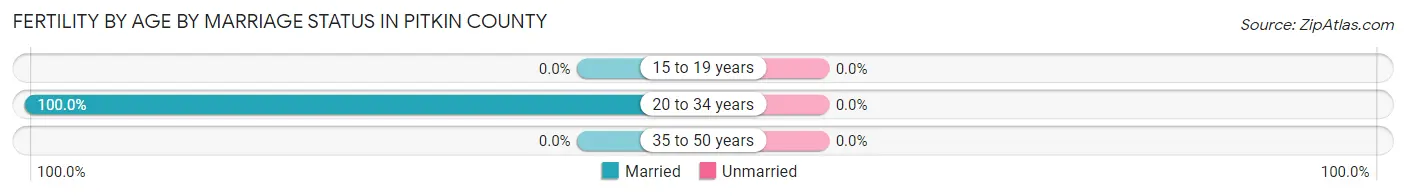
| Age Bracket | Married | Unmarried |
| 15 to 19 years | 0 (0.0%) | 0 (0.0%) |
| 20 to 34 years | 43 (100.0%) | 0 (0.0%) |
| 35 to 50 years | 0 (0.0%) | 0 (0.0%) |
| Total | 43 (100.0%) | 0 (0.0%) |
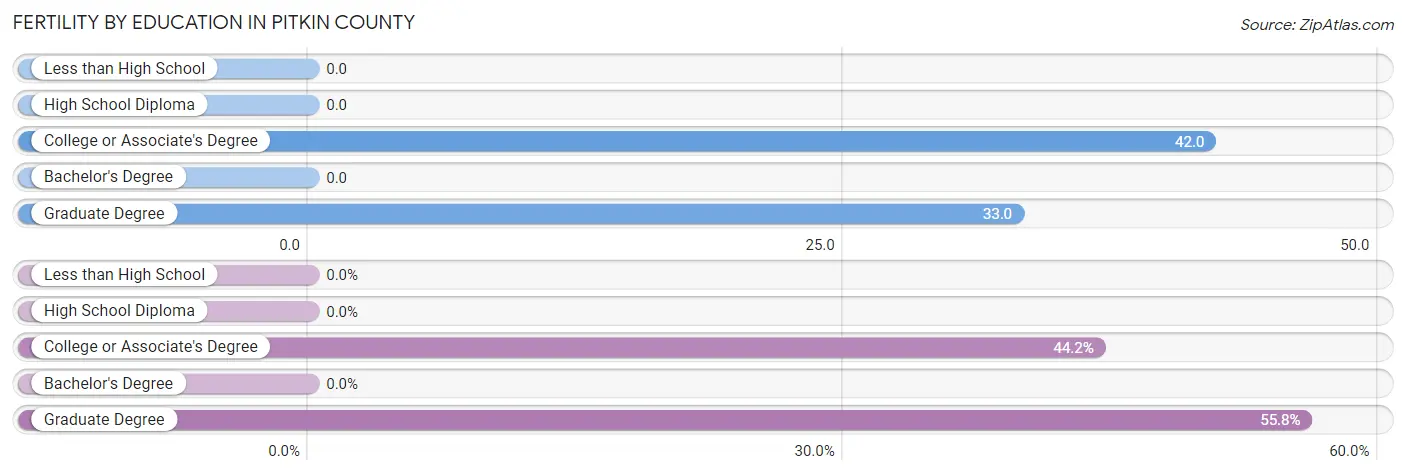
Fertility by Education in Pitkin County
| Educational Attainment | Women with Births | Births / 1,000 Women |
| Less than High School | 0 (0.0%) | 0.0 |
| High School Diploma | 0 (0.0%) | 0.0 |
| College or Associate's Degree | 19 (44.2%) | 42.0 |
| Bachelor's Degree | 0 (0.0%) | 0.0 |
| Graduate Degree | 24 (55.8%) | 33.0 |
| Total | 43 (100.0%) | 12.0 |
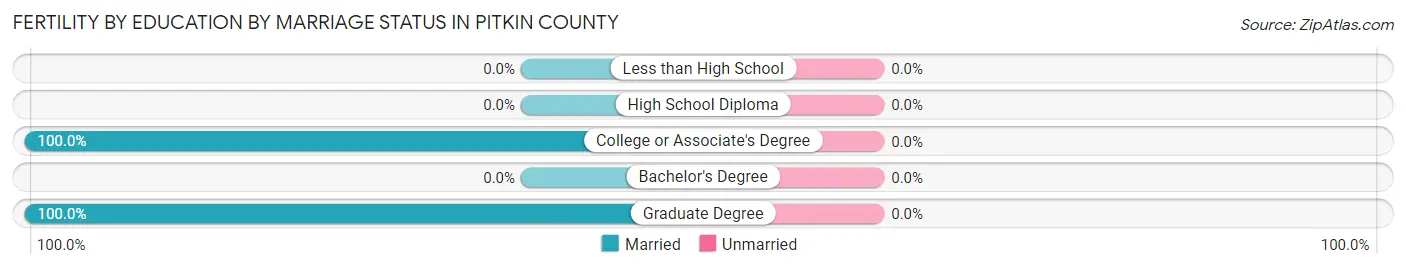
Fertility by Education by Marriage Status in Pitkin County
| Educational Attainment | Married | Unmarried |
| Less than High School | 0 (0.0%) | 0 (0.0%) |
| High School Diploma | 0 (0.0%) | 0 (0.0%) |
| College or Associate's Degree | 19 (100.0%) | 0 (0.0%) |
| Bachelor's Degree | 0 (0.0%) | 0 (0.0%) |
| Graduate Degree | 24 (100.0%) | 0 (0.0%) |
| Total | 43 (100.0%) | 0 (0.0%) |
Income in Pitkin County
Income Overview in Pitkin County
Per Capita Income in Pitkin County is $87,561, while median incomes of families and households are $122,870 and $96,123 respectively.
| Characteristic | Number | Measure |
| Per Capita Income | 17,325 | $87,561 |
| Median Family Income | 4,136 | $122,870 |
| Mean Family Income | 4,136 | $250,031 |
| Median Household Income | 8,114 | $96,123 |
| Mean Household Income | 8,114 | $180,169 |
| Income Deficit | 4,136 | $0 |
| Wage / Income Gap (%) | 17,325 | 18.01% |
| Wage / Income Gap ($) | 17,325 | 81.99¢ per $1 |
| Gini / Inequality Index | 17,325 | 0.59 |
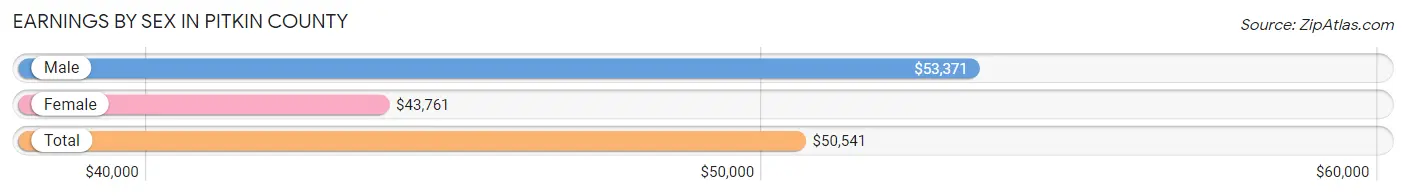
Earnings by Sex in Pitkin County
Average Earnings in Pitkin County are $50,541, $53,371 for men and $43,761 for women, a difference of 18.0%.
| Sex | Number | Average Earnings |
| Male | 6,382 (54.7%) | $53,371 |
| Female | 5,285 (45.3%) | $43,761 |
| Total | 11,667 (100.0%) | $50,541 |
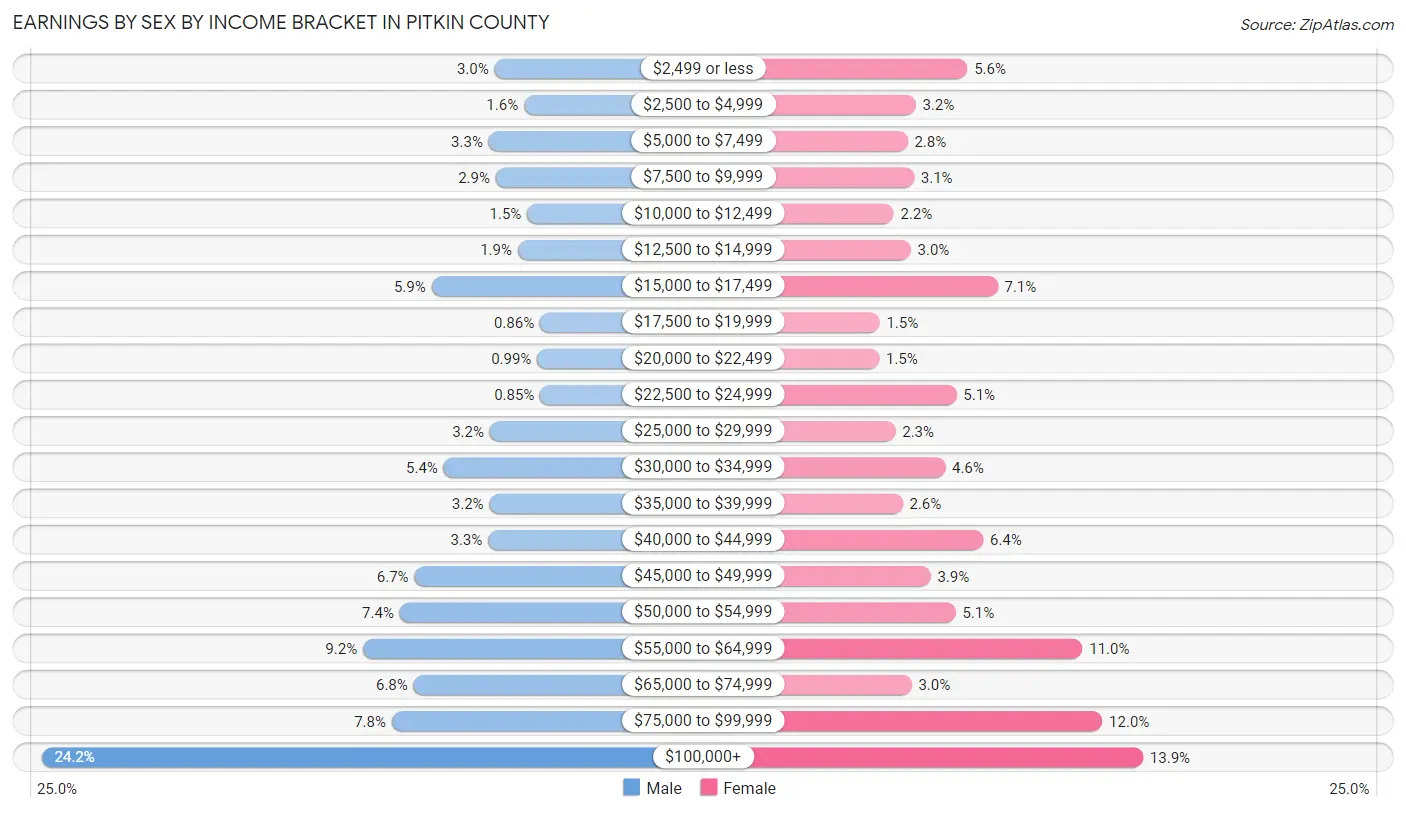
Earnings by Sex by Income Bracket in Pitkin County
The most common earnings brackets in Pitkin County are $100,000+ for men (1,545 | 24.2%) and $100,000+ for women (733 | 13.9%).
| Income | Male | Female |
| $2,499 or less | 191 (3.0%) | 298 (5.6%) |
| $2,500 to $4,999 | 103 (1.6%) | 170 (3.2%) |
| $5,000 to $7,499 | 208 (3.3%) | 150 (2.8%) |
| $7,500 to $9,999 | 187 (2.9%) | 166 (3.1%) |
| $10,000 to $12,499 | 93 (1.5%) | 116 (2.2%) |
| $12,500 to $14,999 | 121 (1.9%) | 158 (3.0%) |
| $15,000 to $17,499 | 379 (5.9%) | 373 (7.1%) |
| $17,500 to $19,999 | 55 (0.9%) | 81 (1.5%) |
| $20,000 to $22,499 | 63 (1.0%) | 80 (1.5%) |
| $22,500 to $24,999 | 54 (0.9%) | 271 (5.1%) |
| $25,000 to $29,999 | 205 (3.2%) | 120 (2.3%) |
| $30,000 to $34,999 | 343 (5.4%) | 243 (4.6%) |
| $35,000 to $39,999 | 206 (3.2%) | 138 (2.6%) |
| $40,000 to $44,999 | 210 (3.3%) | 337 (6.4%) |
| $45,000 to $49,999 | 430 (6.7%) | 207 (3.9%) |
| $50,000 to $54,999 | 474 (7.4%) | 269 (5.1%) |
| $55,000 to $64,999 | 584 (9.1%) | 583 (11.0%) |
| $65,000 to $74,999 | 433 (6.8%) | 160 (3.0%) |
| $75,000 to $99,999 | 498 (7.8%) | 632 (12.0%) |
| $100,000+ | 1,545 (24.2%) | 733 (13.9%) |
| Total | 6,382 (100.0%) | 5,285 (100.0%) |
Earnings by Sex by Educational Attainment in Pitkin County
Average earnings in Pitkin County are $56,935 for men and $48,007 for women, a difference of 15.7%. Men with an educational attainment of graduate degree enjoy the highest average annual earnings of $199,113, while those with high school diploma education earn the least with $45,643. Women with an educational attainment of graduate degree earn the most with the average annual earnings of $61,875, while those with less than high school education have the smallest earnings of $16,875.
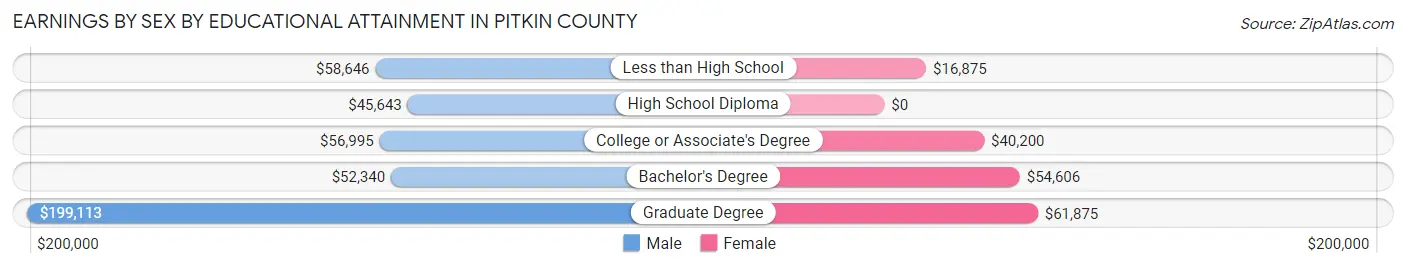
| Educational Attainment | Male Income | Female Income |
| Less than High School | $58,646 | $16,875 |
| High School Diploma | $45,643 | $0 |
| College or Associate's Degree | $56,995 | $40,200 |
| Bachelor's Degree | $52,340 | $54,606 |
| Graduate Degree | $199,113 | $61,875 |
| Total | $56,935 | $48,007 |
Family Income in Pitkin County
Family Income Brackets in Pitkin County
According to the Pitkin County family income data, there are 1,311 families falling into the $200,000+ income range, which is the most common income bracket and makes up 31.7% of all families. Conversely, the $10,000 to $14,999 income bracket is the least frequent group with only 29 families (0.7%) belonging to this category.
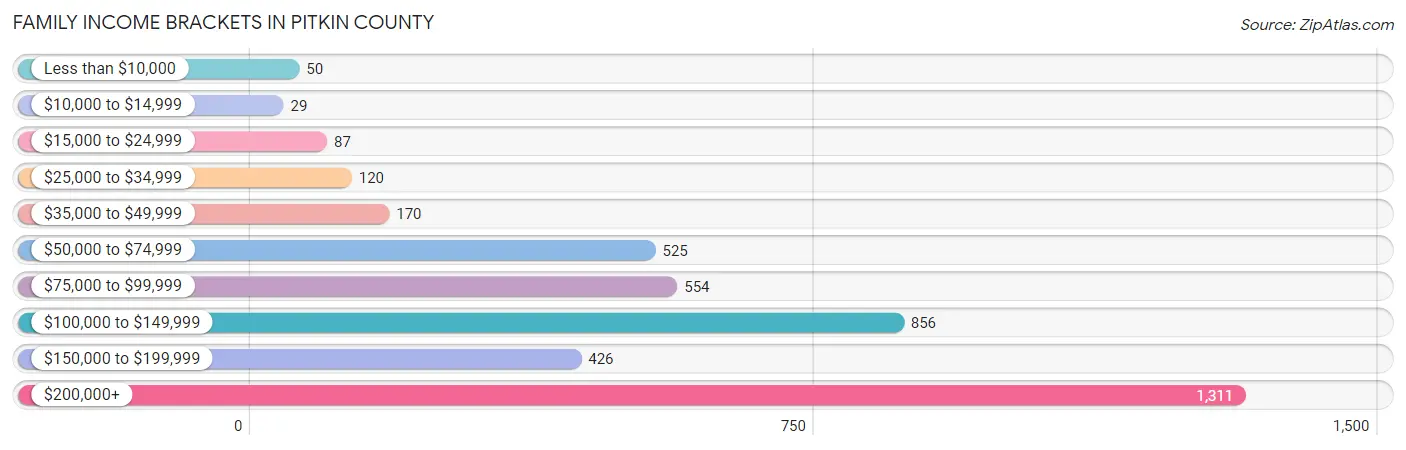
| Income Bracket | # Families | % Families |
| Less than $10,000 | 50 | 1.2% |
| $10,000 to $14,999 | 29 | 0.7% |
| $15,000 to $24,999 | 87 | 2.1% |
| $25,000 to $34,999 | 120 | 2.9% |
| $35,000 to $49,999 | 170 | 4.1% |
| $50,000 to $74,999 | 525 | 12.7% |
| $75,000 to $99,999 | 554 | 13.4% |
| $100,000 to $149,999 | 856 | 20.7% |
| $150,000 to $199,999 | 426 | 10.3% |
| $200,000+ | 1,311 | 31.7% |
Family Income by Famaliy Size in Pitkin County
5-person families (191 | 4.6%) account for the highest median family income in Pitkin County with $249,851 per family, while 2-person families (2,376 | 57.5%) have the highest median income of $55,542 per family member.
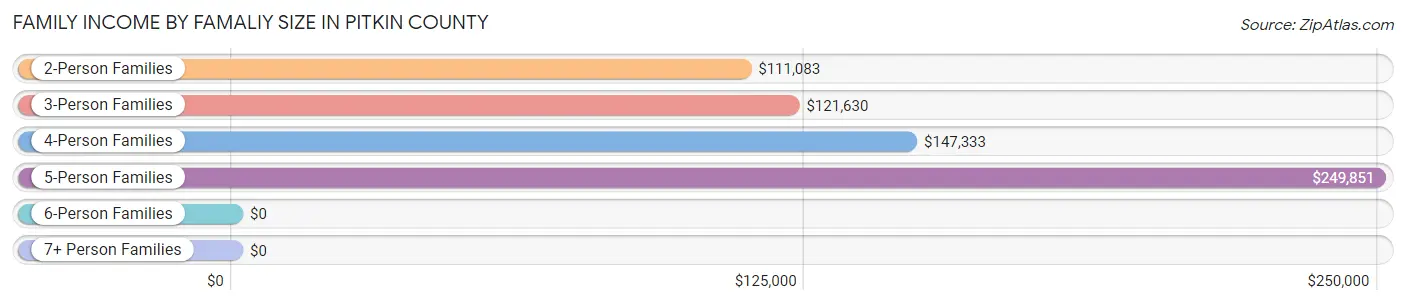
| Income Bracket | # Families | Median Income |
| 2-Person Families | 2,376 (57.5%) | $111,083 |
| 3-Person Families | 666 (16.1%) | $121,630 |
| 4-Person Families | 880 (21.3%) | $147,333 |
| 5-Person Families | 191 (4.6%) | $249,851 |
| 6-Person Families | 13 (0.3%) | $0 |
| 7+ Person Families | 10 (0.2%) | $0 |
| Total | 4,136 (100.0%) | $122,870 |
Family Income by Number of Earners in Pitkin County
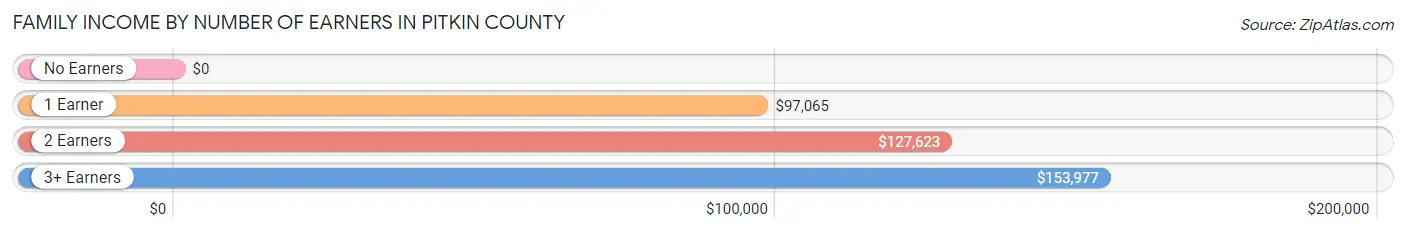
| Number of Earners | # Families | Median Income |
| No Earners | 687 (16.6%) | $0 |
| 1 Earner | 830 (20.1%) | $97,065 |
| 2 Earners | 2,302 (55.7%) | $127,623 |
| 3+ Earners | 317 (7.7%) | $153,977 |
| Total | 4,136 (100.0%) | $122,870 |
Household Income in Pitkin County
Household Income Brackets in Pitkin County
With 1,647 households falling in the category, the $200,000+ income range is the most frequent in Pitkin County, accounting for 20.3% of all households. In contrast, only 227 households (2.8%) fall into the less than $10,000 income bracket, making it the least populous group.
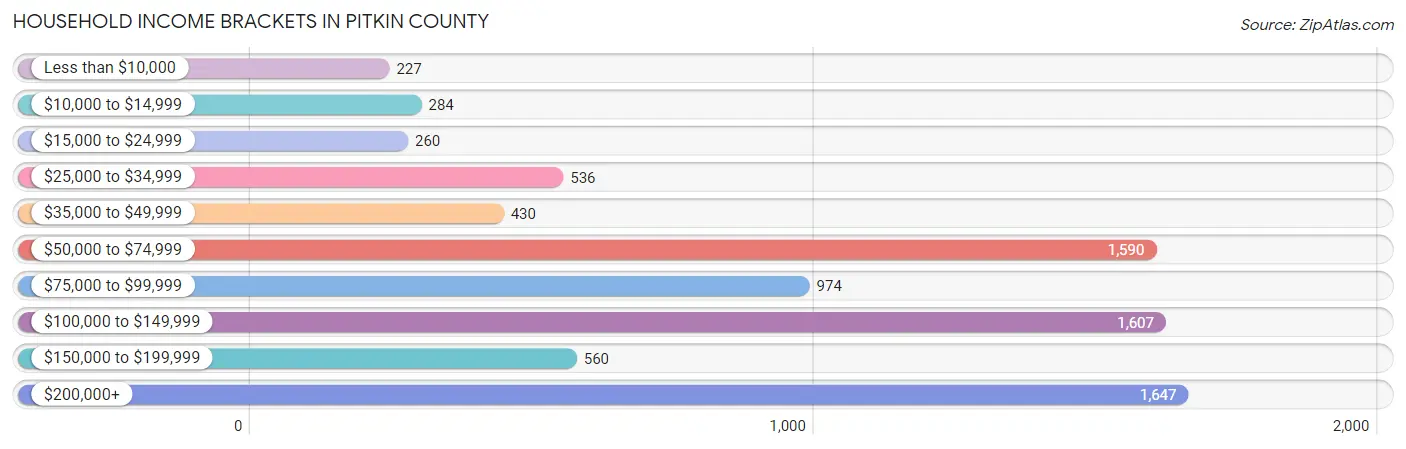
| Income Bracket | # Households | % Households |
| Less than $10,000 | 227 | 2.8% |
| $10,000 to $14,999 | 284 | 3.5% |
| $15,000 to $24,999 | 260 | 3.2% |
| $25,000 to $34,999 | 536 | 6.6% |
| $35,000 to $49,999 | 430 | 5.3% |
| $50,000 to $74,999 | 1,590 | 19.6% |
| $75,000 to $99,999 | 974 | 12.0% |
| $100,000 to $149,999 | 1,607 | 19.8% |
| $150,000 to $199,999 | 560 | 6.9% |
| $200,000+ | 1,647 | 20.3% |
Household Income by Householder Age in Pitkin County
The median household income in Pitkin County is $96,123, with the highest median household income of $105,897 found in the 45 to 64 years age bracket for the primary householder. A total of 3,333 households (41.1%) fall into this category. Meanwhile, the 15 to 24 years age bracket for the primary householder has the lowest median household income of $0, with 230 households (2.8%) in this group.
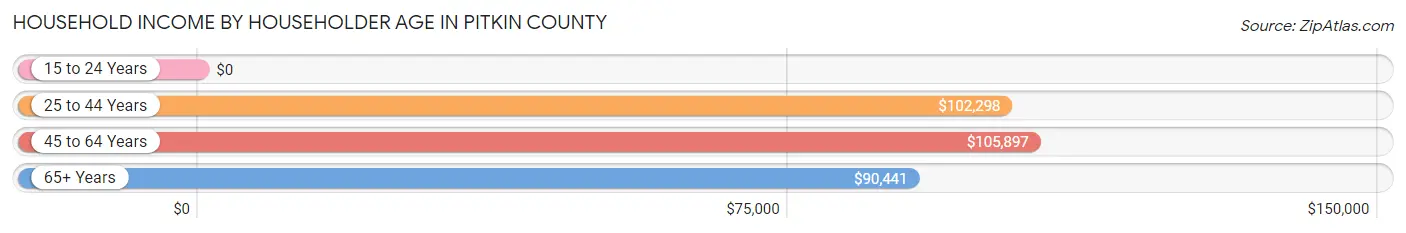
| Income Bracket | # Households | Median Income |
| 15 to 24 Years | 230 (2.8%) | $0 |
| 25 to 44 Years | 2,339 (28.8%) | $102,298 |
| 45 to 64 Years | 3,333 (41.1%) | $105,897 |
| 65+ Years | 2,212 (27.3%) | $90,441 |
| Total | 8,114 (100.0%) | $96,123 |
Poverty in Pitkin County
Income Below Poverty by Sex and Age in Pitkin County
With 6.1% poverty level for males and 7.3% for females among the residents of Pitkin County, 15 year old males and 18 to 24 year old females are the most vulnerable to poverty, with 62 males (47.0%) and 112 females (24.9%) in their respective age groups living below the poverty level.
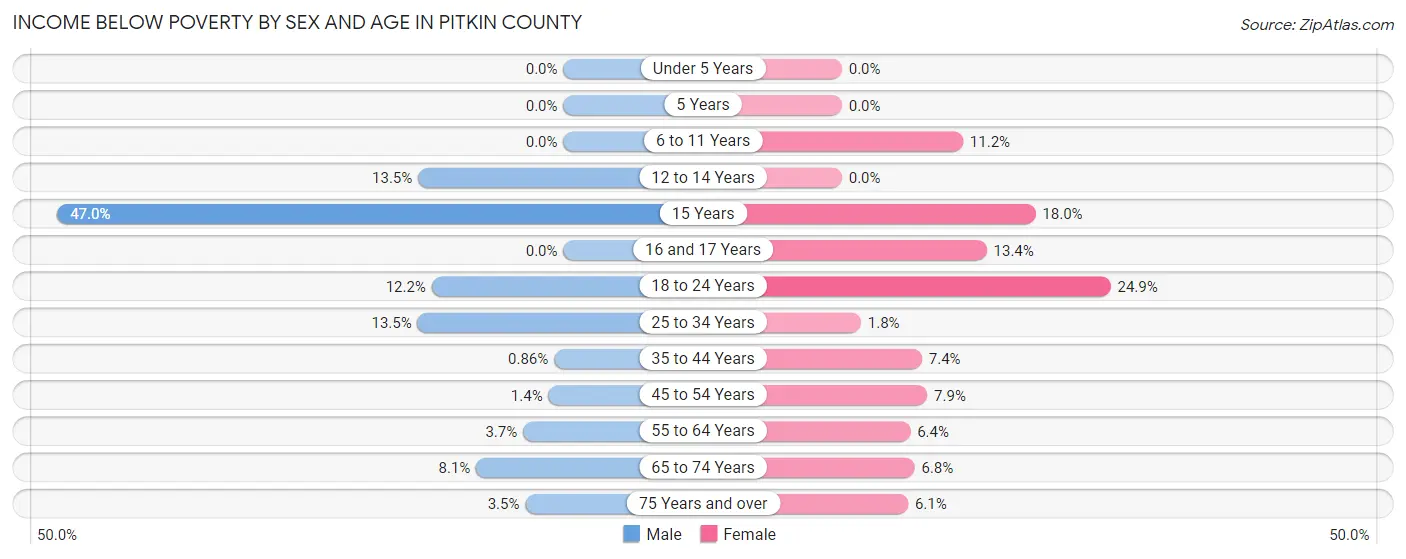
| Age Bracket | Male | Female |
| Under 5 Years | 0 (0.0%) | 0 (0.0%) |
| 5 Years | 0 (0.0%) | 0 (0.0%) |
| 6 to 11 Years | 0 (0.0%) | 40 (11.2%) |
| 12 to 14 Years | 36 (13.5%) | 0 (0.0%) |
| 15 Years | 62 (47.0%) | 23 (18.0%) |
| 16 and 17 Years | 0 (0.0%) | 25 (13.4%) |
| 18 to 24 Years | 76 (12.2%) | 112 (24.9%) |
| 25 to 34 Years | 174 (13.5%) | 19 (1.8%) |
| 35 to 44 Years | 9 (0.9%) | 86 (7.4%) |
| 45 to 54 Years | 19 (1.4%) | 103 (7.9%) |
| 55 to 64 Years | 49 (3.7%) | 89 (6.4%) |
| 65 to 74 Years | 98 (8.1%) | 70 (6.8%) |
| 75 Years and over | 24 (3.5%) | 36 (6.1%) |
| Total | 547 (6.1%) | 603 (7.3%) |
Income Above Poverty by Sex and Age in Pitkin County
According to the poverty statistics in Pitkin County, males aged under 5 years and females aged under 5 years are the age groups that are most secure financially, with 100.0% of males and 100.0% of females in these age groups living above the poverty line.
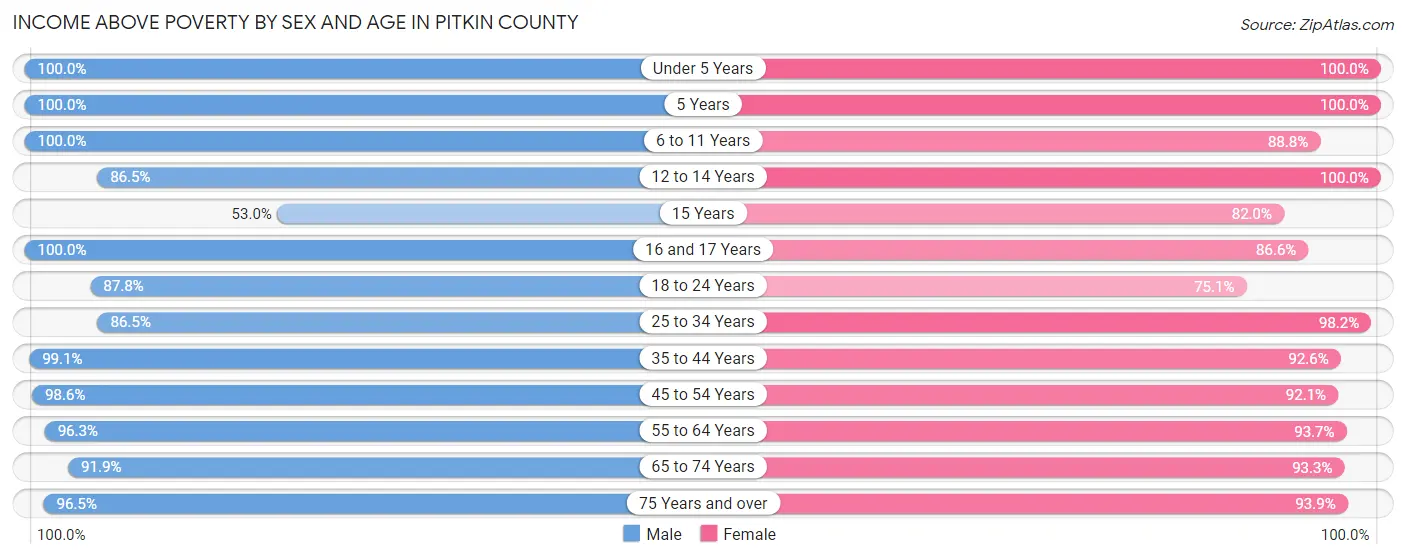
| Age Bracket | Male | Female |
| Under 5 Years | 440 (100.0%) | 367 (100.0%) |
| 5 Years | 10 (100.0%) | 24 (100.0%) |
| 6 to 11 Years | 476 (100.0%) | 316 (88.8%) |
| 12 to 14 Years | 231 (86.5%) | 182 (100.0%) |
| 15 Years | 70 (53.0%) | 105 (82.0%) |
| 16 and 17 Years | 145 (100.0%) | 161 (86.6%) |
| 18 to 24 Years | 546 (87.8%) | 337 (75.1%) |
| 25 to 34 Years | 1,112 (86.5%) | 1,057 (98.2%) |
| 35 to 44 Years | 1,041 (99.1%) | 1,071 (92.6%) |
| 45 to 54 Years | 1,360 (98.6%) | 1,197 (92.1%) |
| 55 to 64 Years | 1,262 (96.3%) | 1,313 (93.6%) |
| 65 to 74 Years | 1,114 (91.9%) | 967 (93.2%) |
| 75 Years and over | 656 (96.5%) | 550 (93.9%) |
| Total | 8,463 (93.9%) | 7,647 (92.7%) |
Income Below Poverty Among Married-Couple Families in Pitkin County
The poverty statistics for married-couple families in Pitkin County show that 1.0% or 36 of the total 3,633 families live below the poverty line. Families with 1 or 2 children have the highest poverty rate of 2.4%, comprising of 30 families. On the other hand, families with 3 or 4 children have the lowest poverty rate of 0.0%, which includes 0 families.
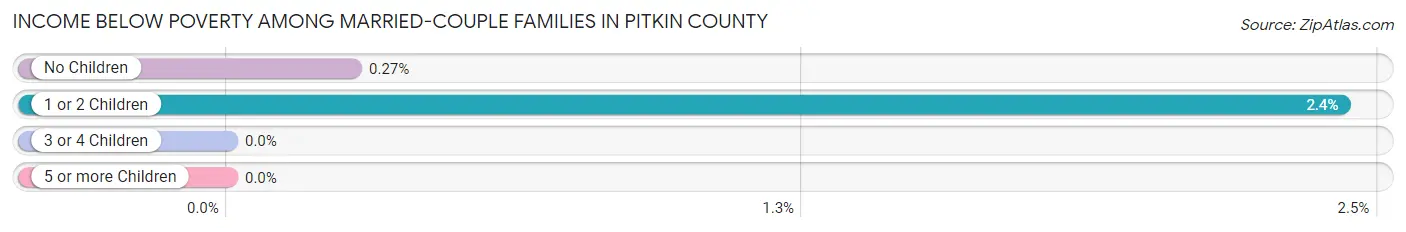
| Children | Above Poverty | Below Poverty |
| No Children | 2,239 (99.7%) | 6 (0.3%) |
| 1 or 2 Children | 1,210 (97.6%) | 30 (2.4%) |
| 3 or 4 Children | 148 (100.0%) | 0 (0.0%) |
| 5 or more Children | 0 (0.0%) | 0 (0.0%) |
| Total | 3,597 (99.0%) | 36 (1.0%) |
Income Below Poverty Among Single-Parent Households in Pitkin County
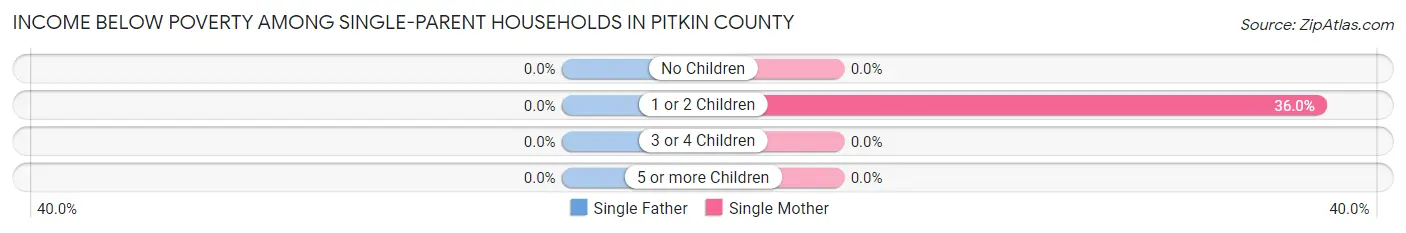
| Children | Single Father | Single Mother |
| No Children | 0 (0.0%) | 0 (0.0%) |
| 1 or 2 Children | 0 (0.0%) | 95 (36.0%) |
| 3 or 4 Children | 0 (0.0%) | 0 (0.0%) |
| 5 or more Children | 0 (0.0%) | 0 (0.0%) |
| Total | 0 (0.0%) | 95 (28.7%) |
Income Below Poverty Among Married-Couple vs Single-Parent Households in Pitkin County
The poverty data for Pitkin County shows that 36 of the married-couple family households (1.0%) and 95 of the single-parent households (18.9%) are living below the poverty level. Within the married-couple family households, those with 1 or 2 children have the highest poverty rate, with 30 households (2.4%) falling below the poverty line. Among the single-parent households, those with 1 or 2 children have the highest poverty rate, with 95 household (30.7%) living below poverty.
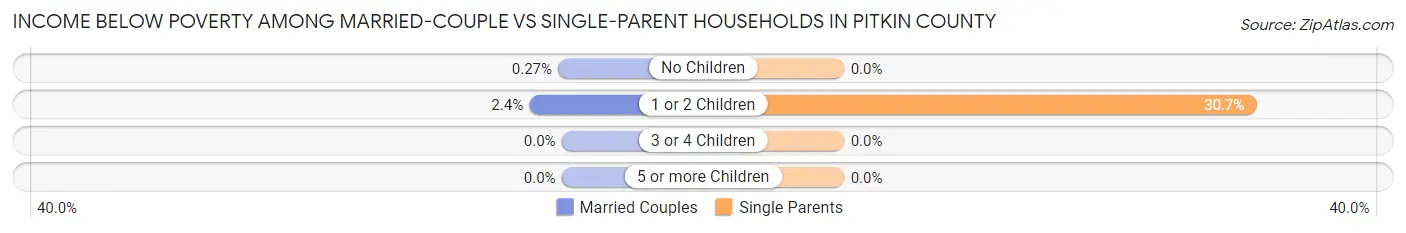
| Children | Married-Couple Families | Single-Parent Households |
| No Children | 6 (0.3%) | 0 (0.0%) |
| 1 or 2 Children | 30 (2.4%) | 95 (30.7%) |
| 3 or 4 Children | 0 (0.0%) | 0 (0.0%) |
| 5 or more Children | 0 (0.0%) | 0 (0.0%) |
| Total | 36 (1.0%) | 95 (18.9%) |
Employment Characteristics in Pitkin County
Employment by Class of Employer in Pitkin County
Among the 10,314 employed individuals in Pitkin County, private company employees (5,991 | 58.1%), self-employed (incorporated) (1,600 | 15.5%), and local government employees (939 | 9.1%) make up the most common classes of employment.
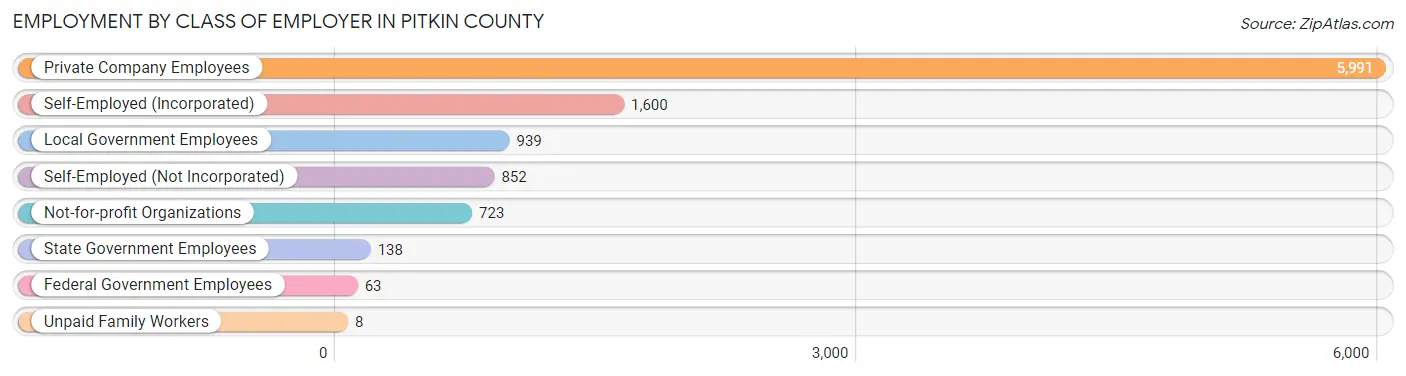
| Employer Class | # Employees | % Employees |
| Private Company Employees | 5,991 | 58.1% |
| Self-Employed (Incorporated) | 1,600 | 15.5% |
| Self-Employed (Not Incorporated) | 852 | 8.3% |
| Not-for-profit Organizations | 723 | 7.0% |
| Local Government Employees | 939 | 9.1% |
| State Government Employees | 138 | 1.3% |
| Federal Government Employees | 63 | 0.6% |
| Unpaid Family Workers | 8 | 0.1% |
| Total | 10,314 | 100.0% |
Employment Status by Age in Pitkin County
According to the labor force statistics for Pitkin County, out of the total population over 16 years of age (14,920), 71.9% or 10,727 individuals are in the labor force, with 2.1% or 225 of them unemployed. The age group with the highest labor force participation rate is 25 to 29 years, with 89.2% or 956 individuals in the labor force. Within the labor force, the 45 to 54 years age range has the highest percentage of unemployed individuals, with 3.3% or 77 of them being unemployed.
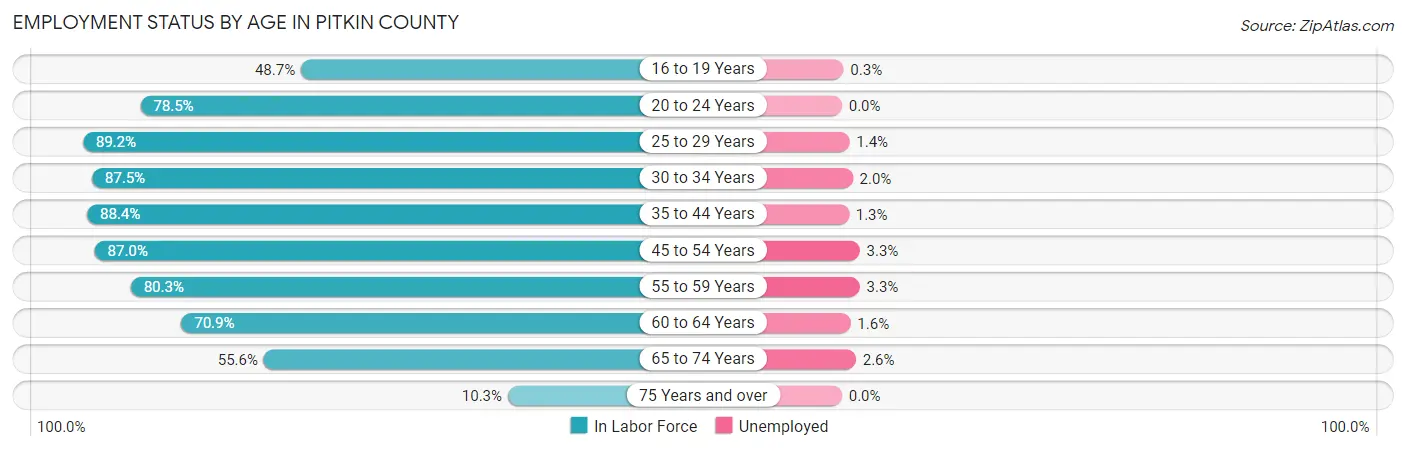
| Age Bracket | In Labor Force | Unemployed |
| 16 to 19 Years | 319 (48.7%) | 1 (0.3%) |
| 20 to 24 Years | 601 (78.5%) | 0 (0.0%) |
| 25 to 29 Years | 956 (89.2%) | 13 (1.4%) |
| 30 to 34 Years | 1,138 (87.5%) | 23 (2.0%) |
| 35 to 44 Years | 1,962 (88.4%) | 26 (1.3%) |
| 45 to 54 Years | 2,331 (87.0%) | 77 (3.3%) |
| 55 to 59 Years | 1,027 (80.3%) | 34 (3.3%) |
| 60 to 64 Years | 1,017 (70.9%) | 16 (1.6%) |
| 65 to 74 Years | 1,250 (55.6%) | 32 (2.6%) |
| 75 Years and over | 130 (10.3%) | 0 (0.0%) |
| Total | 10,727 (71.9%) | 225 (2.1%) |
Employment Status by Educational Attainment in Pitkin County
According to labor force statistics for Pitkin County, 84.4% of individuals (8,426) out of the total population between 25 and 64 years of age (9,984) are in the labor force, with 2.2% or 185 of them being unemployed. The group with the highest labor force participation rate are those with the educational attainment of college / associate degree, with 92.0% or 2,094 individuals in the labor force. Within the labor force, individuals with bachelor's degree or higher education have the highest percentage of unemployment, with 3.2% or 158 of them being unemployed.
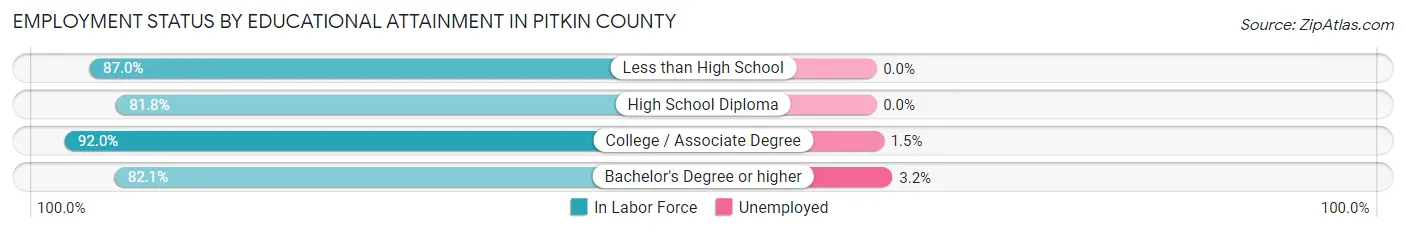
| Educational Attainment | In Labor Force | Unemployed |
| Less than High School | 194 (87.0%) | 0 (0.0%) |
| High School Diploma | 1,193 (81.8%) | 0 (0.0%) |
| College / Associate Degree | 2,094 (92.0%) | 34 (1.5%) |
| Bachelor's Degree or higher | 4,947 (82.1%) | 193 (3.2%) |
| Total | 8,426 (84.4%) | 220 (2.2%) |
Employment Occupations by Sex in Pitkin County
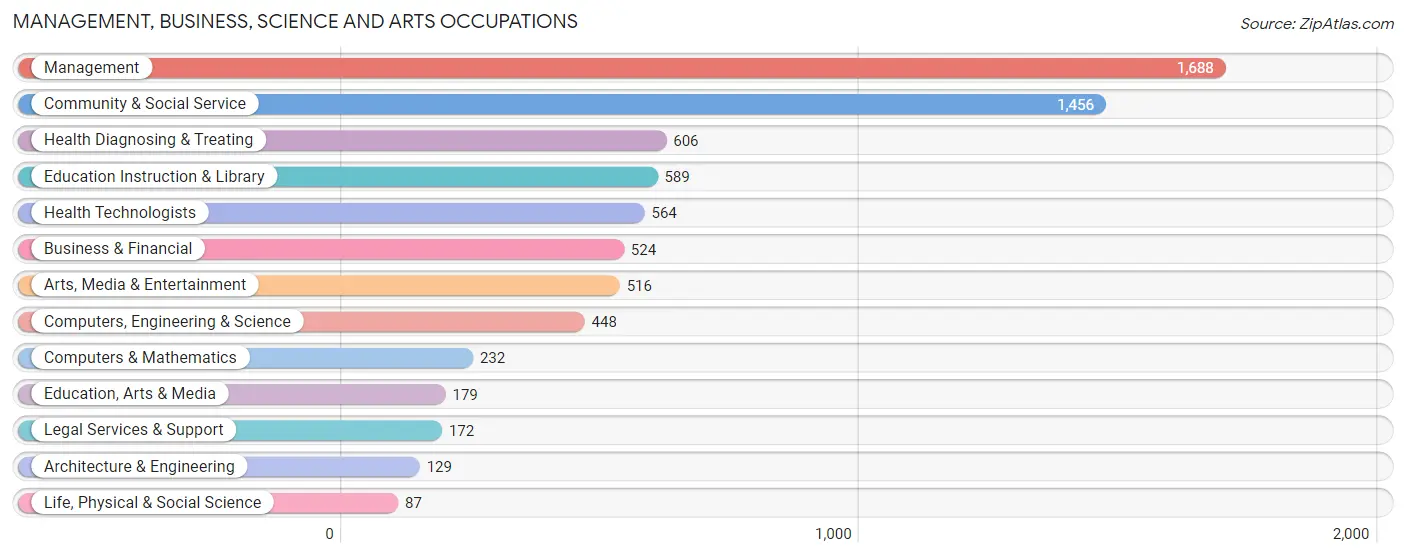
Management, Business, Science and Arts Occupations
The most common Management, Business, Science and Arts occupations in Pitkin County are Management (1,688 | 16.1%), Community & Social Service (1,456 | 13.9%), Health Diagnosing & Treating (606 | 5.8%), Education Instruction & Library (589 | 5.6%), and Health Technologists (564 | 5.4%).
Management, Business, Science and Arts Occupations by Sex
Within the Management, Business, Science and Arts occupations in Pitkin County, the most male-oriented occupations are Architecture & Engineering (71.3%), Computers & Mathematics (70.3%), and Business & Financial (67.7%), while the most female-oriented occupations are Life, Physical & Social Science (94.3%), Education, Arts & Media (85.5%), and Health Technologists (72.7%).
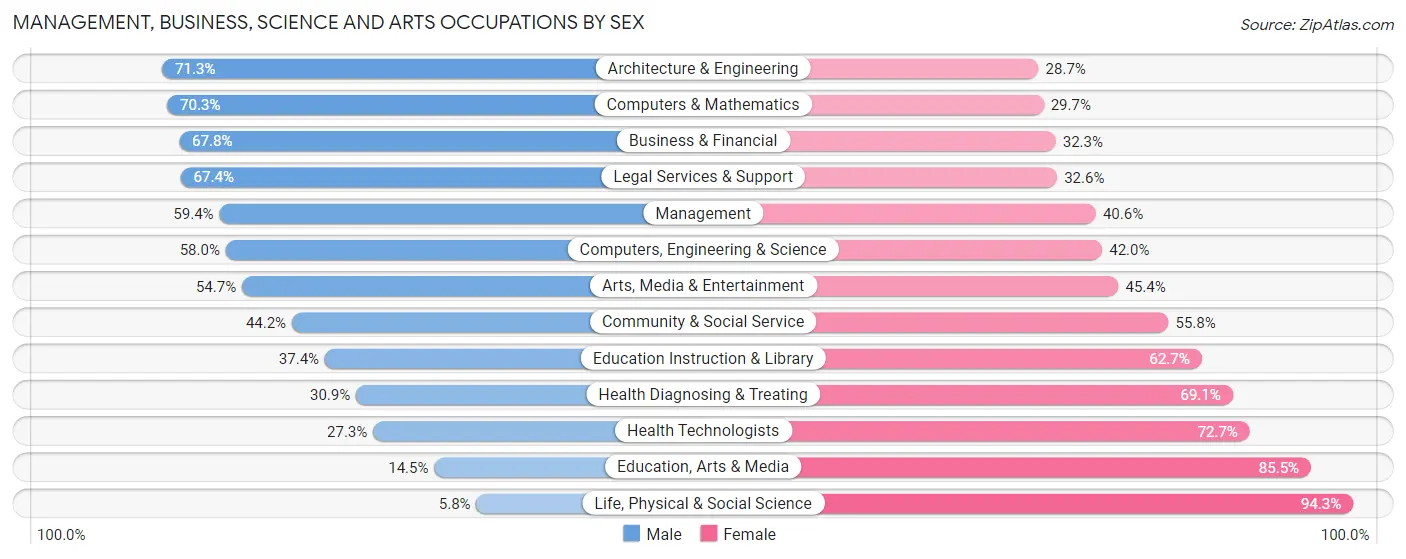
| Occupation | Male | Female |
| Management | 1,002 (59.4%) | 686 (40.6%) |
| Business & Financial | 355 (67.7%) | 169 (32.3%) |
| Computers, Engineering & Science | 260 (58.0%) | 188 (42.0%) |
| Computers & Mathematics | 163 (70.3%) | 69 (29.7%) |
| Architecture & Engineering | 92 (71.3%) | 37 (28.7%) |
| Life, Physical & Social Science | 5 (5.8%) | 82 (94.3%) |
| Community & Social Service | 644 (44.2%) | 812 (55.8%) |
| Education, Arts & Media | 26 (14.5%) | 153 (85.5%) |
| Legal Services & Support | 116 (67.4%) | 56 (32.6%) |
| Education Instruction & Library | 220 (37.3%) | 369 (62.6%) |
| Arts, Media & Entertainment | 282 (54.6%) | 234 (45.4%) |
| Health Diagnosing & Treating | 187 (30.9%) | 419 (69.1%) |
| Health Technologists | 154 (27.3%) | 410 (72.7%) |
| Total (Category) | 2,448 (51.8%) | 2,274 (48.2%) |
| Total (Overall) | 5,813 (55.4%) | 4,686 (44.6%) |
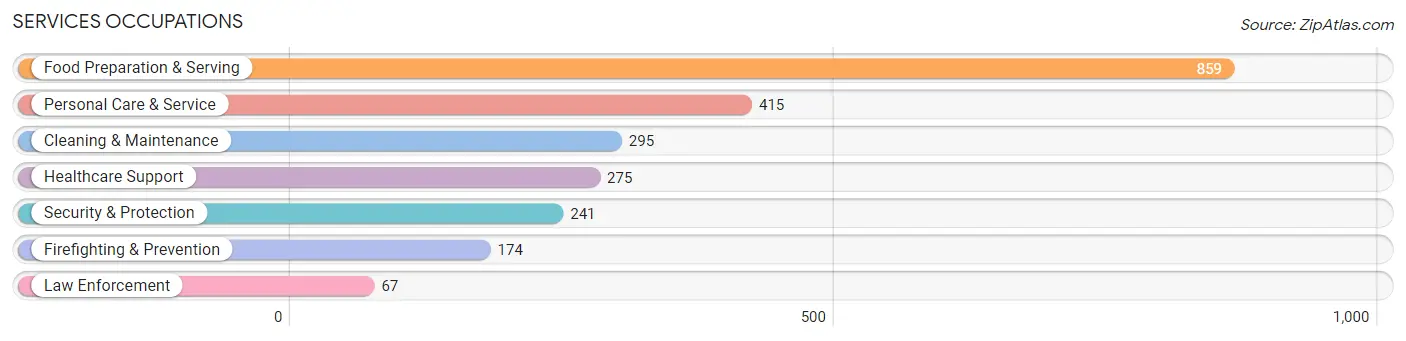
Services Occupations
The most common Services occupations in Pitkin County are Food Preparation & Serving (859 | 8.2%), Personal Care & Service (415 | 4.0%), Cleaning & Maintenance (295 | 2.8%), Healthcare Support (275 | 2.6%), and Security & Protection (241 | 2.3%).
Services Occupations by Sex
Within the Services occupations in Pitkin County, the most male-oriented occupations are Firefighting & Prevention (97.7%), Security & Protection (86.7%), and Cleaning & Maintenance (72.9%), while the most female-oriented occupations are Healthcare Support (61.8%), Personal Care & Service (49.6%), and Law Enforcement (41.8%).

| Occupation | Male | Female |
| Healthcare Support | 105 (38.2%) | 170 (61.8%) |
| Security & Protection | 209 (86.7%) | 32 (13.3%) |
| Firefighting & Prevention | 170 (97.7%) | 4 (2.3%) |
| Law Enforcement | 39 (58.2%) | 28 (41.8%) |
| Food Preparation & Serving | 511 (59.5%) | 348 (40.5%) |
| Cleaning & Maintenance | 215 (72.9%) | 80 (27.1%) |
| Personal Care & Service | 209 (50.4%) | 206 (49.6%) |
| Total (Category) | 1,249 (59.9%) | 836 (40.1%) |
| Total (Overall) | 5,813 (55.4%) | 4,686 (44.6%) |
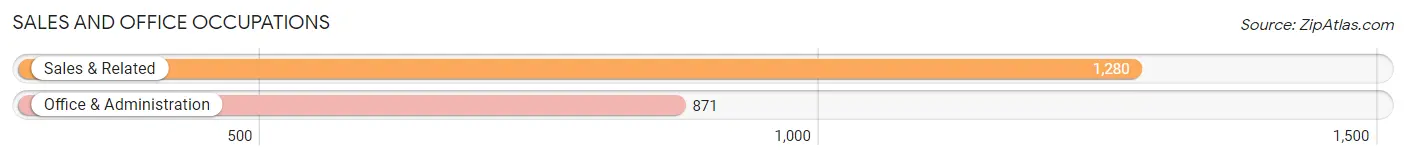
Sales and Office Occupations
The most common Sales and Office occupations in Pitkin County are Sales & Related (1,280 | 12.2%), and Office & Administration (871 | 8.3%).
Sales and Office Occupations by Sex

| Occupation | Male | Female |
| Sales & Related | 592 (46.3%) | 688 (53.7%) |
| Office & Administration | 264 (30.3%) | 607 (69.7%) |
| Total (Category) | 856 (39.8%) | 1,295 (60.2%) |
| Total (Overall) | 5,813 (55.4%) | 4,686 (44.6%) |
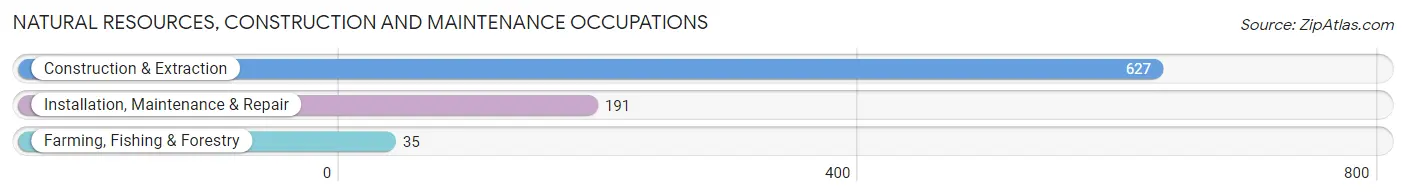
Natural Resources, Construction and Maintenance Occupations
The most common Natural Resources, Construction and Maintenance occupations in Pitkin County are Construction & Extraction (627 | 6.0%), Installation, Maintenance & Repair (191 | 1.8%), and Farming, Fishing & Forestry (35 | 0.3%).
Natural Resources, Construction and Maintenance Occupations by Sex
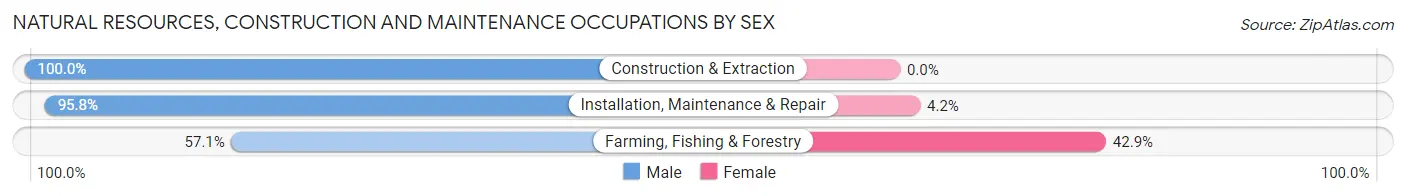
| Occupation | Male | Female |
| Farming, Fishing & Forestry | 20 (57.1%) | 15 (42.9%) |
| Construction & Extraction | 627 (100.0%) | 0 (0.0%) |
| Installation, Maintenance & Repair | 183 (95.8%) | 8 (4.2%) |
| Total (Category) | 830 (97.3%) | 23 (2.7%) |
| Total (Overall) | 5,813 (55.4%) | 4,686 (44.6%) |
Production, Transportation and Moving Occupations
The most common Production, Transportation and Moving occupations in Pitkin County are Transportation (419 | 4.0%), Production (225 | 2.1%), and Material Moving (44 | 0.4%).

Production, Transportation and Moving Occupations by Sex
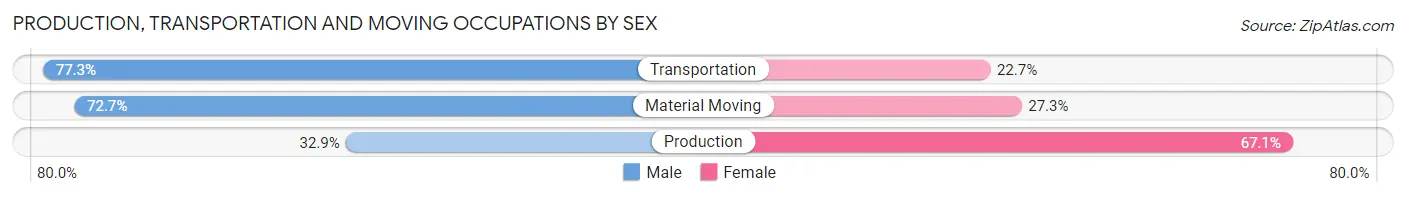
| Occupation | Male | Female |
| Production | 74 (32.9%) | 151 (67.1%) |
| Transportation | 324 (77.3%) | 95 (22.7%) |
| Material Moving | 32 (72.7%) | 12 (27.3%) |
| Total (Category) | 430 (62.5%) | 258 (37.5%) |
| Total (Overall) | 5,813 (55.4%) | 4,686 (44.6%) |
Employment Industries by Sex in Pitkin County
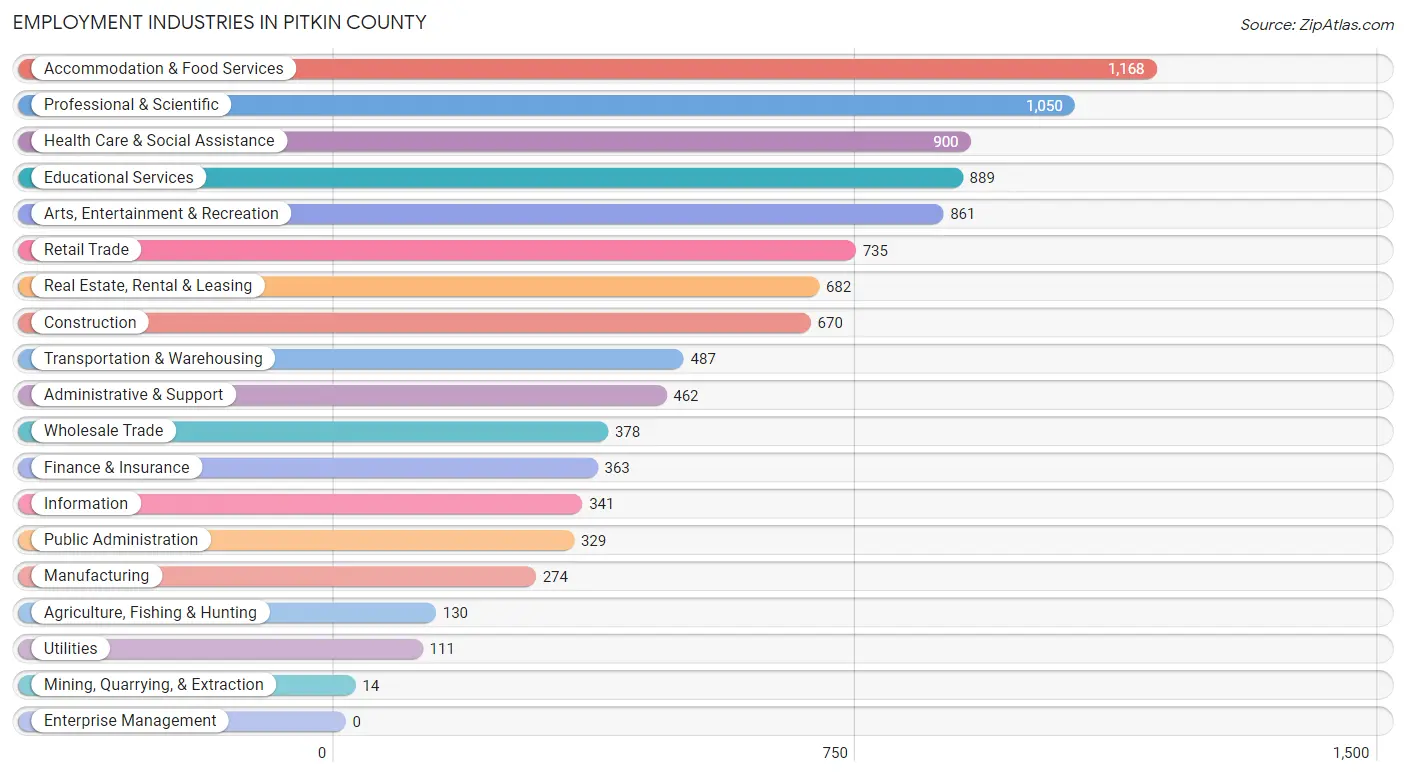
Employment Industries in Pitkin County
The major employment industries in Pitkin County include Accommodation & Food Services (1,168 | 11.1%), Professional & Scientific (1,050 | 10.0%), Health Care & Social Assistance (900 | 8.6%), Educational Services (889 | 8.5%), and Arts, Entertainment & Recreation (861 | 8.2%).
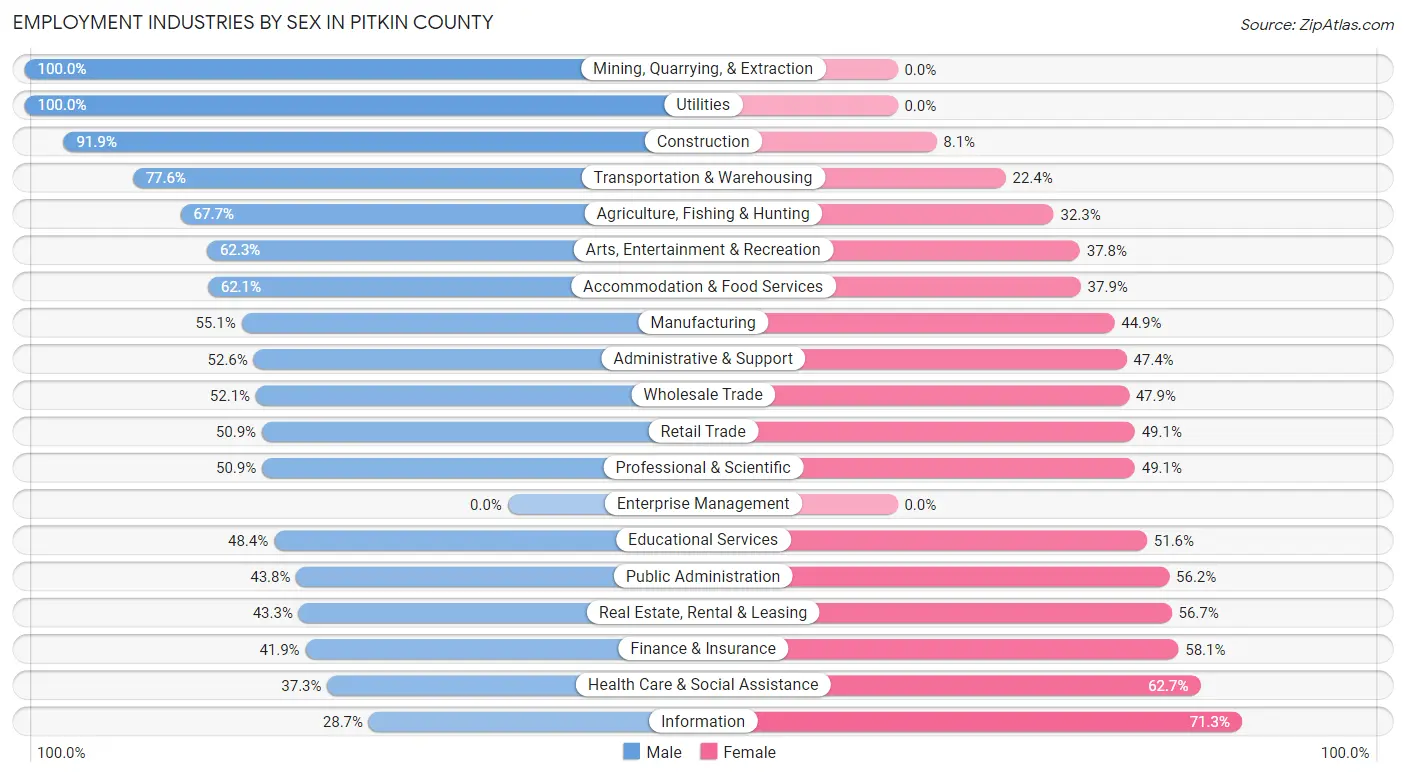
Employment Industries by Sex in Pitkin County
The Pitkin County industries that see more men than women are Mining, Quarrying, & Extraction (100.0%), Utilities (100.0%), and Construction (91.9%), whereas the industries that tend to have a higher number of women are Information (71.3%), Health Care & Social Assistance (62.7%), and Finance & Insurance (58.1%).
| Industry | Male | Female |
| Agriculture, Fishing & Hunting | 88 (67.7%) | 42 (32.3%) |
| Mining, Quarrying, & Extraction | 14 (100.0%) | 0 (0.0%) |
| Construction | 616 (91.9%) | 54 (8.1%) |
| Manufacturing | 151 (55.1%) | 123 (44.9%) |
| Wholesale Trade | 197 (52.1%) | 181 (47.9%) |
| Retail Trade | 374 (50.9%) | 361 (49.1%) |
| Transportation & Warehousing | 378 (77.6%) | 109 (22.4%) |
| Utilities | 111 (100.0%) | 0 (0.0%) |
| Information | 98 (28.7%) | 243 (71.3%) |
| Finance & Insurance | 152 (41.9%) | 211 (58.1%) |
| Real Estate, Rental & Leasing | 295 (43.3%) | 387 (56.7%) |
| Professional & Scientific | 534 (50.9%) | 516 (49.1%) |
| Enterprise Management | 0 (0.0%) | 0 (0.0%) |
| Administrative & Support | 243 (52.6%) | 219 (47.4%) |
| Educational Services | 430 (48.4%) | 459 (51.6%) |
| Health Care & Social Assistance | 336 (37.3%) | 564 (62.7%) |
| Arts, Entertainment & Recreation | 536 (62.3%) | 325 (37.8%) |
| Accommodation & Food Services | 725 (62.1%) | 443 (37.9%) |
| Public Administration | 144 (43.8%) | 185 (56.2%) |
| Total | 5,813 (55.4%) | 4,686 (44.6%) |
Education in Pitkin County
School Enrollment in Pitkin County
The most common levels of schooling among the 2,958 students in Pitkin County are high school (766 | 25.9%), middle school (735 | 24.8%), and elementary school (512 | 17.3%).

| School Level | # Students | % Students |
| Nursery / Preschool | 257 | 8.7% |
| Kindergarten | 36 | 1.2% |
| Elementary School | 512 | 17.3% |
| Middle School | 735 | 24.8% |
| High School | 766 | 25.9% |
| College / Undergraduate | 511 | 17.3% |
| Graduate / Professional | 141 | 4.8% |
| Total | 2,958 | 100.0% |
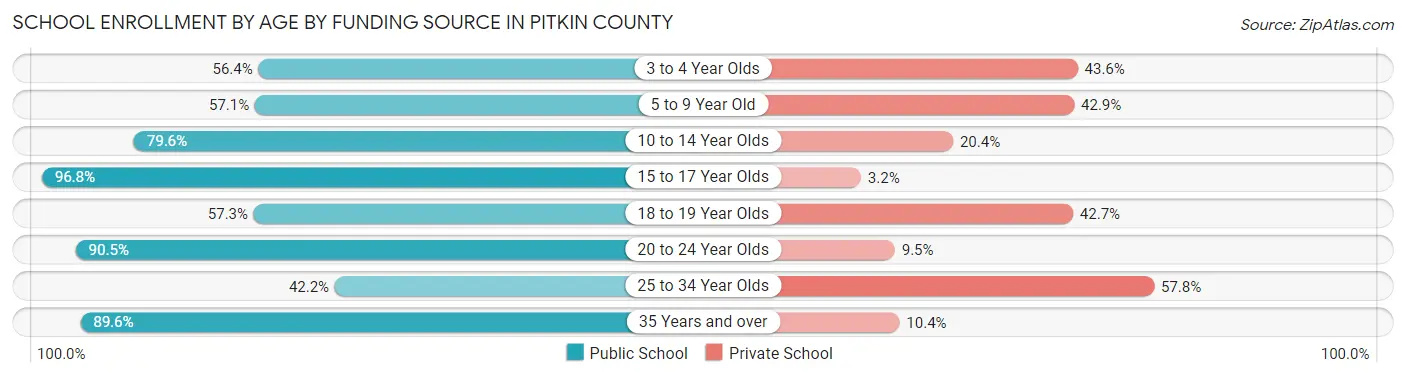
School Enrollment by Age by Funding Source in Pitkin County
Out of a total of 2,958 students who are enrolled in schools in Pitkin County, 701 (23.7%) attend a private institution, while the remaining 2,257 (76.3%) are enrolled in public schools. The age group of 25 to 34 year olds has the highest likelihood of being enrolled in private schools, with 37 (57.8% in the age bracket) enrolled. Conversely, the age group of 15 to 17 year olds has the lowest likelihood of being enrolled in a private school, with 572 (96.8% in the age bracket) attending a public institution.
| Age Bracket | Public School | Private School |
| 3 to 4 Year Olds | 136 (56.4%) | 105 (43.6%) |
| 5 to 9 Year Old | 262 (57.1%) | 197 (42.9%) |
| 10 to 14 Year Olds | 700 (79.6%) | 179 (20.4%) |
| 15 to 17 Year Olds | 572 (96.8%) | 19 (3.2%) |
| 18 to 19 Year Olds | 161 (57.3%) | 120 (42.7%) |
| 20 to 24 Year Olds | 209 (90.5%) | 22 (9.5%) |
| 25 to 34 Year Olds | 27 (42.2%) | 37 (57.8%) |
| 35 Years and over | 190 (89.6%) | 22 (10.4%) |
| Total | 2,257 (76.3%) | 701 (23.7%) |
Educational Attainment by Field of Study in Pitkin County
Business (1,900 | 20.5%), social sciences (1,086 | 11.7%), bio, nature & agricultural (829 | 8.9%), arts & humanities (824 | 8.9%), and education (797 | 8.6%) are the most common fields of study among 9,262 individuals in Pitkin County who have obtained a bachelor's degree or higher.
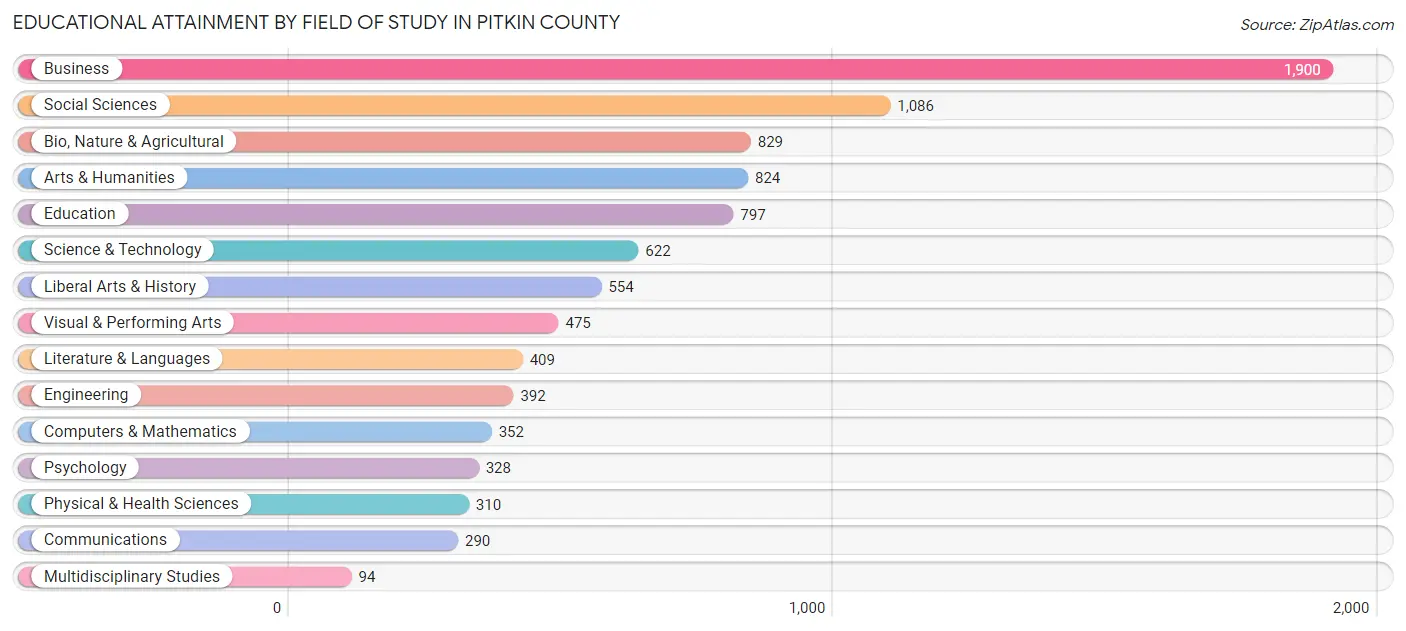
| Field of Study | # Graduates | % Graduates |
| Computers & Mathematics | 352 | 3.8% |
| Bio, Nature & Agricultural | 829 | 8.9% |
| Physical & Health Sciences | 310 | 3.4% |
| Psychology | 328 | 3.5% |
| Social Sciences | 1,086 | 11.7% |
| Engineering | 392 | 4.2% |
| Multidisciplinary Studies | 94 | 1.0% |
| Science & Technology | 622 | 6.7% |
| Business | 1,900 | 20.5% |
| Education | 797 | 8.6% |
| Literature & Languages | 409 | 4.4% |
| Liberal Arts & History | 554 | 6.0% |
| Visual & Performing Arts | 475 | 5.1% |
| Communications | 290 | 3.1% |
| Arts & Humanities | 824 | 8.9% |
| Total | 9,262 | 100.0% |
Transportation & Commute in Pitkin County
Vehicle Availability by Sex in Pitkin County
The most prevalent vehicle ownership categories in Pitkin County are males with 2 vehicles (2,571, accounting for 45.4%) and females with 2 vehicles (2,160, making up 55.9%).
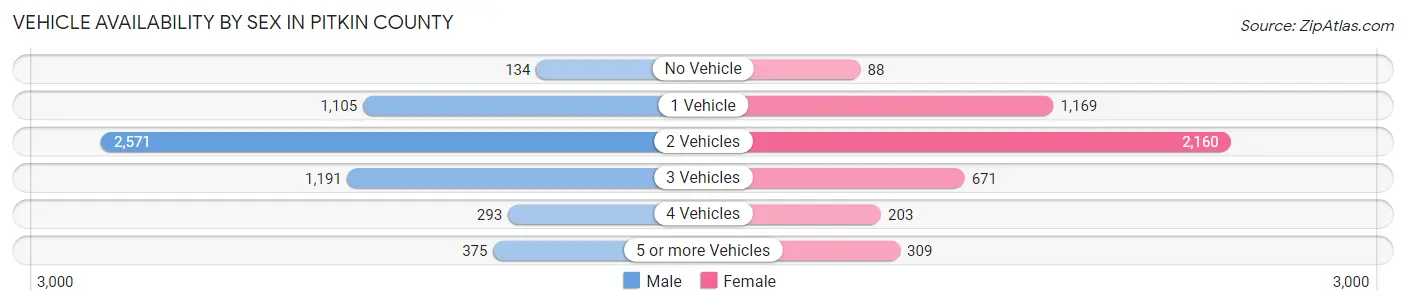
| Vehicles Available | Male | Female |
| No Vehicle | 134 (2.4%) | 88 (1.9%) |
| 1 Vehicle | 1,105 (19.5%) | 1,169 (25.4%) |
| 2 Vehicles | 2,571 (45.4%) | 2,160 (47.0%) |
| 3 Vehicles | 1,191 (21.0%) | 671 (14.6%) |
| 4 Vehicles | 293 (5.2%) | 203 (4.4%) |
| 5 or more Vehicles | 375 (6.6%) | 309 (6.7%) |
| Total | 5,669 (100.0%) | 4,600 (100.0%) |
Commute Time in Pitkin County
The most frequently occuring commute durations in Pitkin County are 10 to 14 minutes (1,743 commuters, 19.8%), 15 to 19 minutes (1,478 commuters, 16.7%), and 30 to 34 minutes (1,414 commuters, 16.0%).
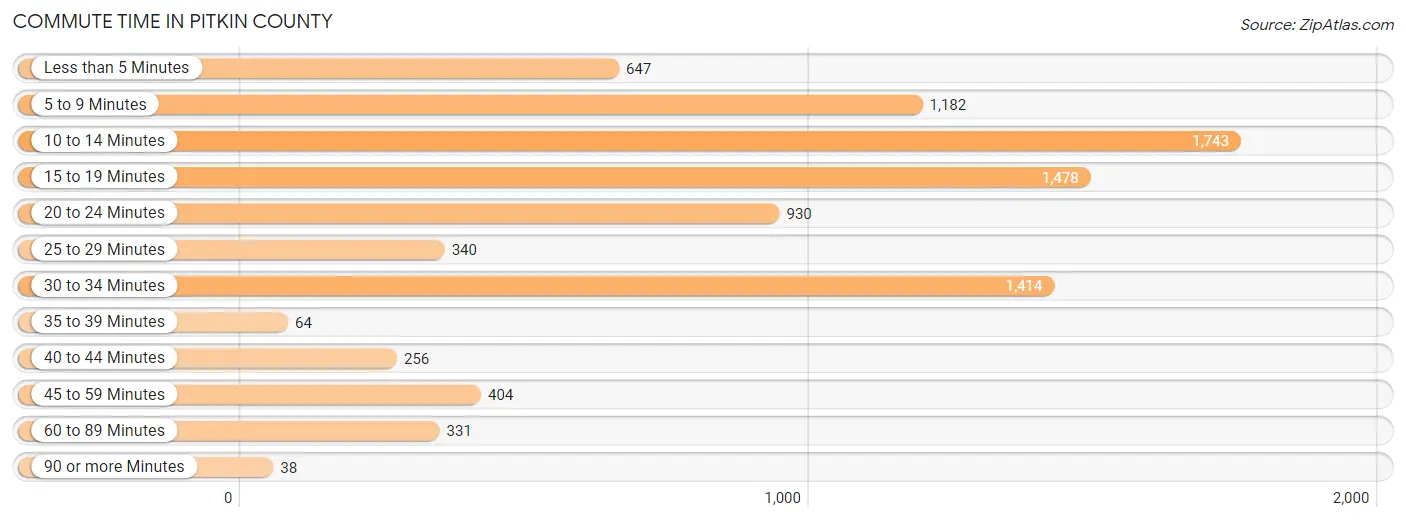
| Commute Time | # Commuters | % Commuters |
| Less than 5 Minutes | 647 | 7.3% |
| 5 to 9 Minutes | 1,182 | 13.4% |
| 10 to 14 Minutes | 1,743 | 19.8% |
| 15 to 19 Minutes | 1,478 | 16.7% |
| 20 to 24 Minutes | 930 | 10.5% |
| 25 to 29 Minutes | 340 | 3.8% |
| 30 to 34 Minutes | 1,414 | 16.0% |
| 35 to 39 Minutes | 64 | 0.7% |
| 40 to 44 Minutes | 256 | 2.9% |
| 45 to 59 Minutes | 404 | 4.6% |
| 60 to 89 Minutes | 331 | 3.7% |
| 90 or more Minutes | 38 | 0.4% |
Commute Time by Sex in Pitkin County
The most common commute times in Pitkin County are 10 to 14 minutes (997 commuters, 20.3%) for males and 15 to 19 minutes (767 commuters, 19.6%) for females.
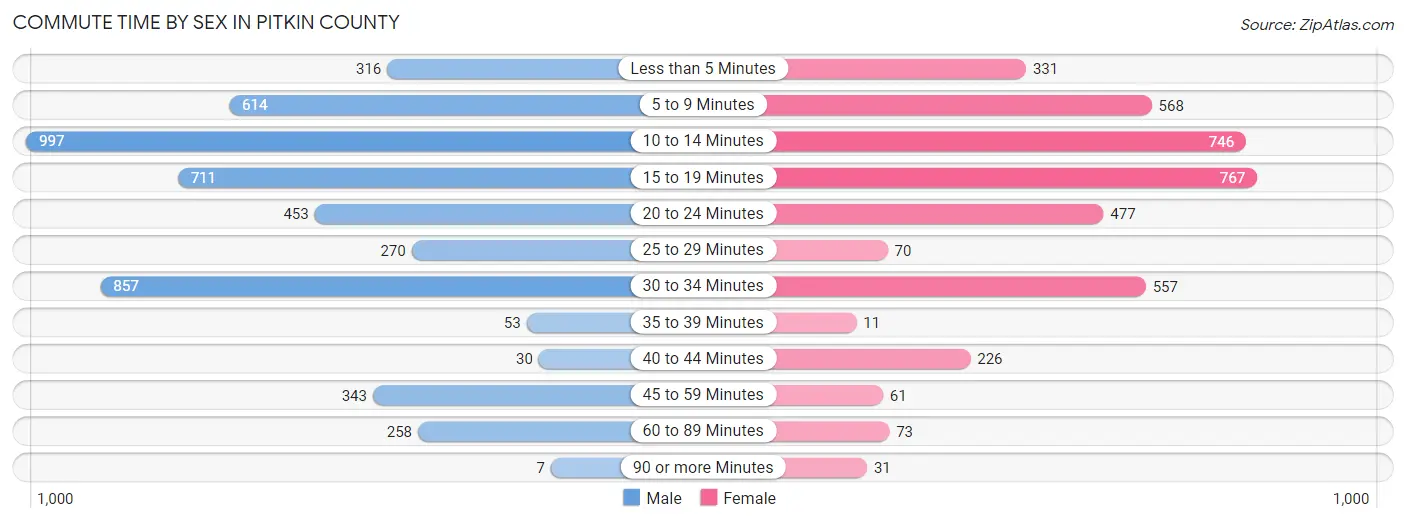
| Commute Time | Male | Female |
| Less than 5 Minutes | 316 (6.4%) | 331 (8.5%) |
| 5 to 9 Minutes | 614 (12.5%) | 568 (14.5%) |
| 10 to 14 Minutes | 997 (20.3%) | 746 (19.0%) |
| 15 to 19 Minutes | 711 (14.5%) | 767 (19.6%) |
| 20 to 24 Minutes | 453 (9.2%) | 477 (12.2%) |
| 25 to 29 Minutes | 270 (5.5%) | 70 (1.8%) |
| 30 to 34 Minutes | 857 (17.5%) | 557 (14.2%) |
| 35 to 39 Minutes | 53 (1.1%) | 11 (0.3%) |
| 40 to 44 Minutes | 30 (0.6%) | 226 (5.8%) |
| 45 to 59 Minutes | 343 (7.0%) | 61 (1.6%) |
| 60 to 89 Minutes | 258 (5.3%) | 73 (1.9%) |
| 90 or more Minutes | 7 (0.1%) | 31 (0.8%) |
Time of Departure to Work by Sex in Pitkin County
The most frequent times of departure to work in Pitkin County are 8:00 AM to 8:29 AM (1,093, 22.3%) for males and 9:00 AM to 9:59 AM (759, 19.4%) for females.
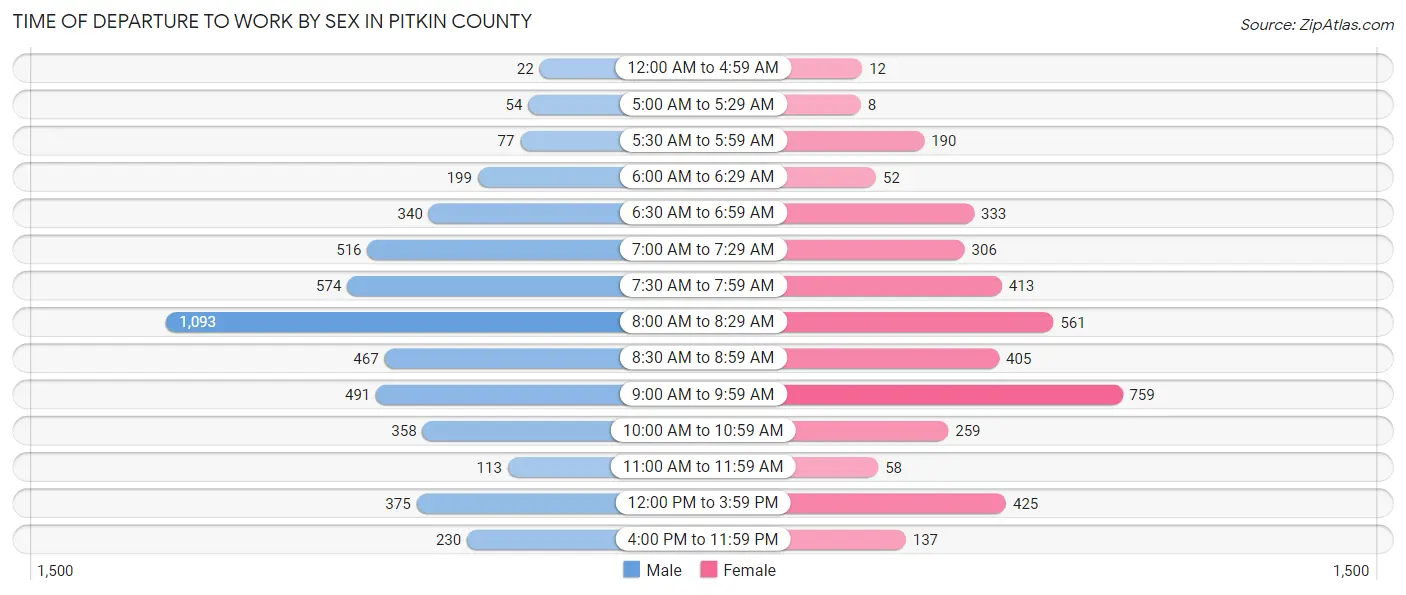
| Time of Departure | Male | Female |
| 12:00 AM to 4:59 AM | 22 (0.4%) | 12 (0.3%) |
| 5:00 AM to 5:29 AM | 54 (1.1%) | 8 (0.2%) |
| 5:30 AM to 5:59 AM | 77 (1.6%) | 190 (4.9%) |
| 6:00 AM to 6:29 AM | 199 (4.1%) | 52 (1.3%) |
| 6:30 AM to 6:59 AM | 340 (6.9%) | 333 (8.5%) |
| 7:00 AM to 7:29 AM | 516 (10.5%) | 306 (7.8%) |
| 7:30 AM to 7:59 AM | 574 (11.7%) | 413 (10.5%) |
| 8:00 AM to 8:29 AM | 1,093 (22.3%) | 561 (14.3%) |
| 8:30 AM to 8:59 AM | 467 (9.5%) | 405 (10.3%) |
| 9:00 AM to 9:59 AM | 491 (10.0%) | 759 (19.4%) |
| 10:00 AM to 10:59 AM | 358 (7.3%) | 259 (6.6%) |
| 11:00 AM to 11:59 AM | 113 (2.3%) | 58 (1.5%) |
| 12:00 PM to 3:59 PM | 375 (7.6%) | 425 (10.8%) |
| 4:00 PM to 11:59 PM | 230 (4.7%) | 137 (3.5%) |
| Total | 4,909 (100.0%) | 3,918 (100.0%) |
Housing Occupancy in Pitkin County
Occupancy by Ownership in Pitkin County
Of the total 8,114 dwellings in Pitkin County, owner-occupied units account for 5,282 (65.1%), while renter-occupied units make up 2,832 (34.9%).
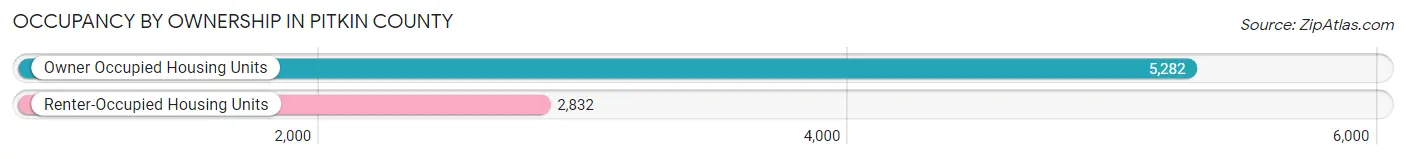
| Occupancy | # Housing Units | % Housing Units |
| Owner Occupied Housing Units | 5,282 | 65.1% |
| Renter-Occupied Housing Units | 2,832 | 34.9% |
| Total Occupied Housing Units | 8,114 | 100.0% |
Occupancy by Household Size in Pitkin County

| Household Size | # Housing Units | % Housing Units |
| 1-Person Household | 2,969 | 36.6% |
| 2-Person Household | 3,163 | 39.0% |
| 3-Person Household | 865 | 10.7% |
| 4+ Person Household | 1,117 | 13.8% |
| Total Housing Units | 8,114 | 100.0% |
Occupancy by Ownership by Household Size in Pitkin County
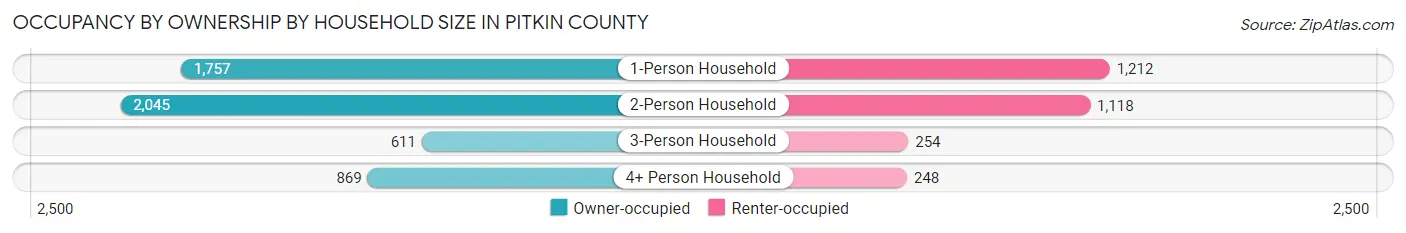
| Household Size | Owner-occupied | Renter-occupied |
| 1-Person Household | 1,757 (59.2%) | 1,212 (40.8%) |
| 2-Person Household | 2,045 (64.6%) | 1,118 (35.3%) |
| 3-Person Household | 611 (70.6%) | 254 (29.4%) |
| 4+ Person Household | 869 (77.8%) | 248 (22.2%) |
| Total Housing Units | 5,282 (65.1%) | 2,832 (34.9%) |
Occupancy by Educational Attainment in Pitkin County
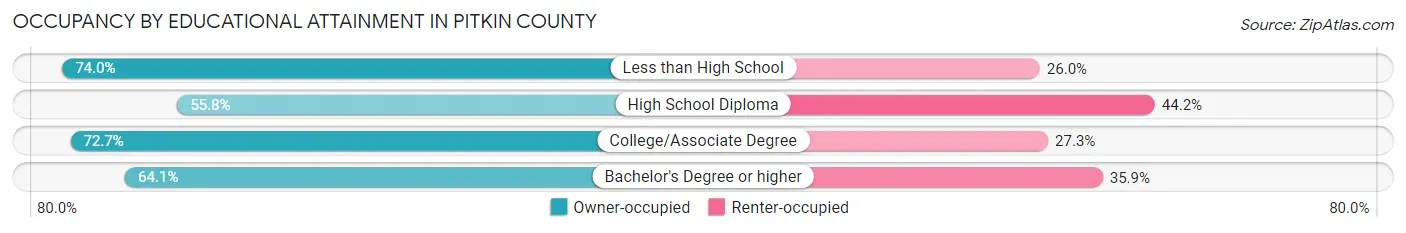
| Household Size | Owner-occupied | Renter-occupied |
| Less than High School | 57 (74.0%) | 20 (26.0%) |
| High School Diploma | 511 (55.8%) | 405 (44.2%) |
| College/Associate Degree | 1,277 (72.7%) | 479 (27.3%) |
| Bachelor's Degree or higher | 3,437 (64.1%) | 1,928 (35.9%) |
Occupancy by Age of Householder in Pitkin County
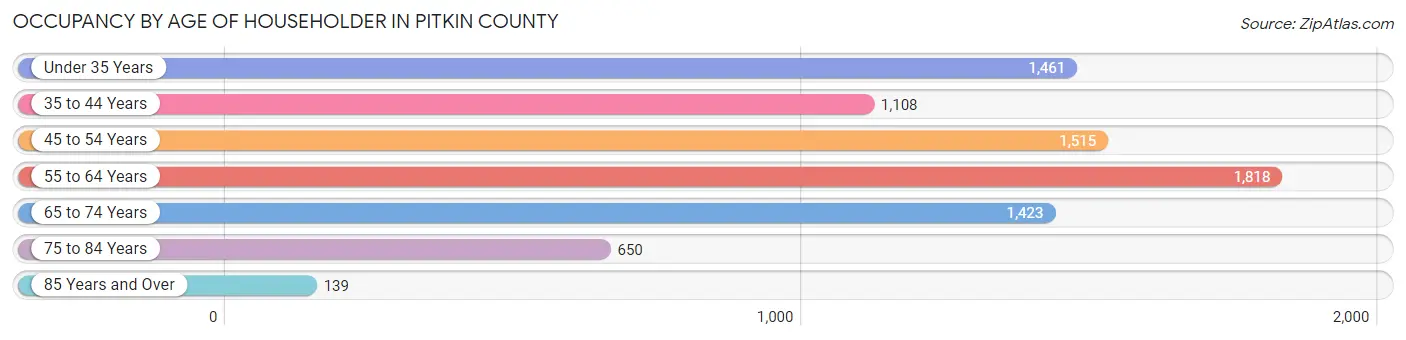
| Age Bracket | # Households | % Households |
| Under 35 Years | 1,461 | 18.0% |
| 35 to 44 Years | 1,108 | 13.7% |
| 45 to 54 Years | 1,515 | 18.7% |
| 55 to 64 Years | 1,818 | 22.4% |
| 65 to 74 Years | 1,423 | 17.5% |
| 75 to 84 Years | 650 | 8.0% |
| 85 Years and Over | 139 | 1.7% |
| Total | 8,114 | 100.0% |
Housing Finances in Pitkin County
Median Income by Occupancy in Pitkin County
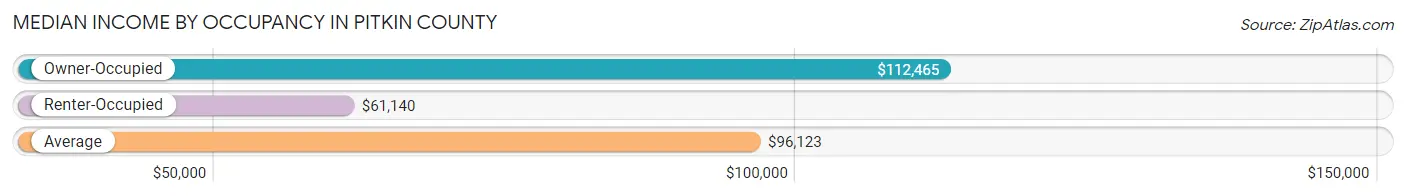
| Occupancy Type | # Households | Median Income |
| Owner-Occupied | 5,282 (65.1%) | $112,465 |
| Renter-Occupied | 2,832 (34.9%) | $61,140 |
| Average | 8,114 (100.0%) | $96,123 |
Occupancy by Householder Income Bracket in Pitkin County
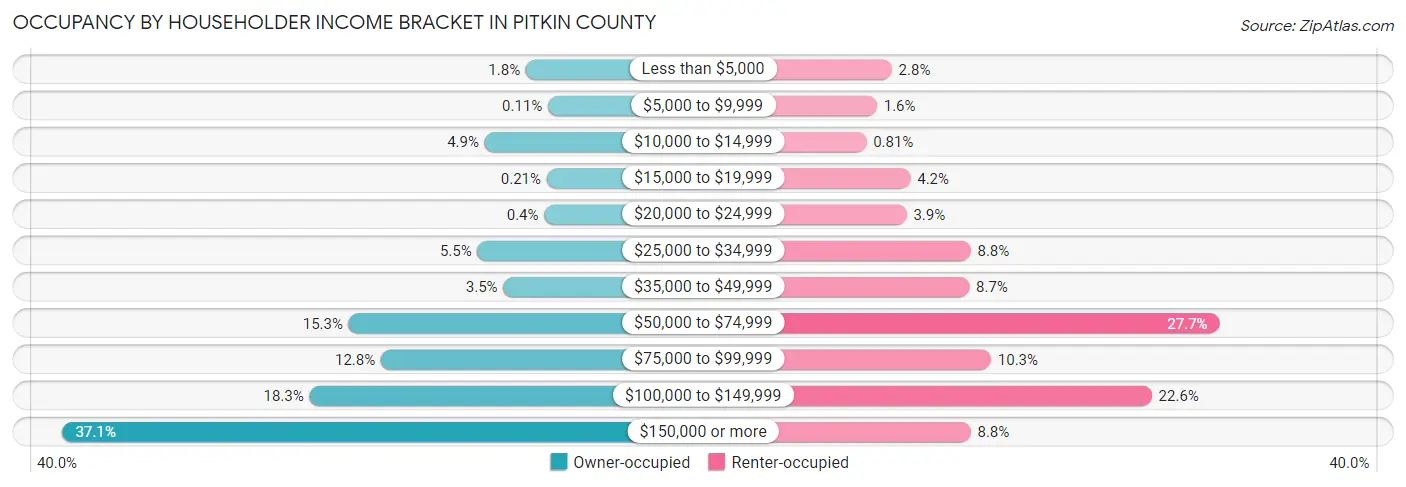
| Income Bracket | Owner-occupied | Renter-occupied |
| Less than $5,000 | 95 (1.8%) | 78 (2.8%) |
| $5,000 to $9,999 | 6 (0.1%) | 46 (1.6%) |
| $10,000 to $14,999 | 261 (4.9%) | 23 (0.8%) |
| $15,000 to $19,999 | 11 (0.2%) | 118 (4.2%) |
| $20,000 to $24,999 | 21 (0.4%) | 110 (3.9%) |
| $25,000 to $34,999 | 290 (5.5%) | 248 (8.8%) |
| $35,000 to $49,999 | 186 (3.5%) | 245 (8.6%) |
| $50,000 to $74,999 | 808 (15.3%) | 785 (27.7%) |
| $75,000 to $99,999 | 678 (12.8%) | 292 (10.3%) |
| $100,000 to $149,999 | 966 (18.3%) | 639 (22.6%) |
| $150,000 or more | 1,960 (37.1%) | 248 (8.8%) |
| Total | 5,282 (100.0%) | 2,832 (100.0%) |
Monthly Housing Cost Tiers in Pitkin County
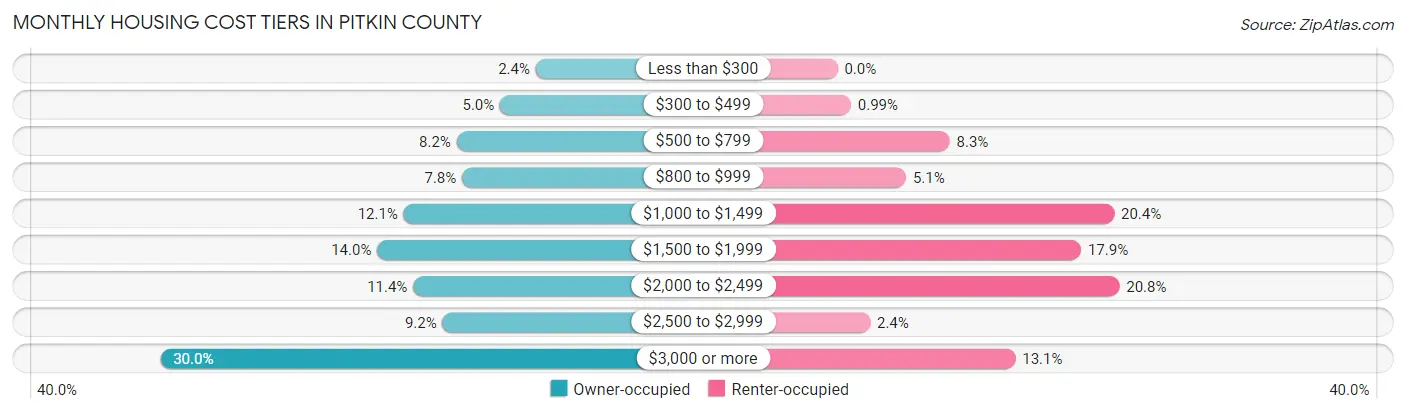
| Monthly Cost | Owner-occupied | Renter-occupied |
| Less than $300 | 124 (2.4%) | 0 (0.0%) |
| $300 to $499 | 263 (5.0%) | 28 (1.0%) |
| $500 to $799 | 432 (8.2%) | 234 (8.3%) |
| $800 to $999 | 411 (7.8%) | 143 (5.1%) |
| $1,000 to $1,499 | 638 (12.1%) | 577 (20.4%) |
| $1,500 to $1,999 | 741 (14.0%) | 508 (17.9%) |
| $2,000 to $2,499 | 601 (11.4%) | 588 (20.8%) |
| $2,500 to $2,999 | 487 (9.2%) | 68 (2.4%) |
| $3,000 or more | 1,585 (30.0%) | 371 (13.1%) |
| Total | 5,282 (100.0%) | 2,832 (100.0%) |
Physical Housing Characteristics in Pitkin County
Housing Structures in Pitkin County
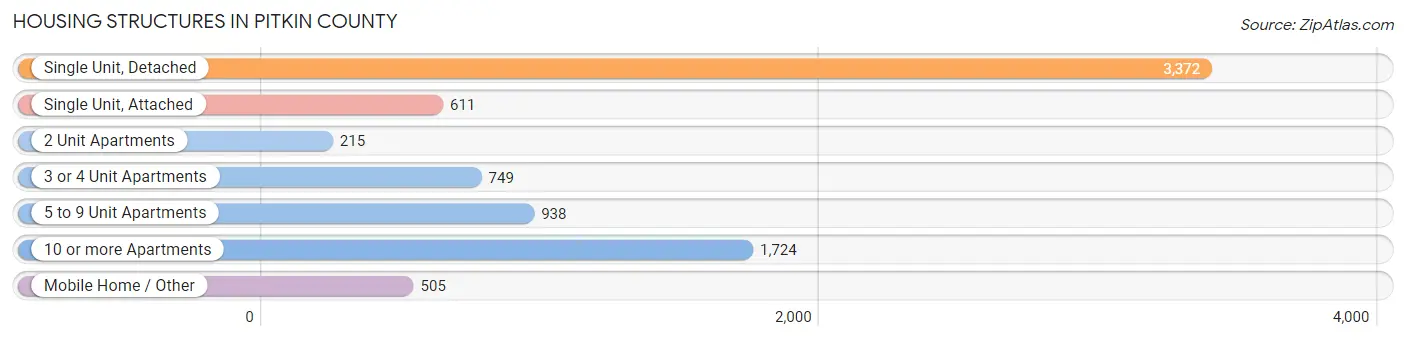
| Structure Type | # Housing Units | % Housing Units |
| Single Unit, Detached | 3,372 | 41.6% |
| Single Unit, Attached | 611 | 7.5% |
| 2 Unit Apartments | 215 | 2.6% |
| 3 or 4 Unit Apartments | 749 | 9.2% |
| 5 to 9 Unit Apartments | 938 | 11.6% |
| 10 or more Apartments | 1,724 | 21.2% |
| Mobile Home / Other | 505 | 6.2% |
| Total | 8,114 | 100.0% |
Housing Structures by Occupancy in Pitkin County
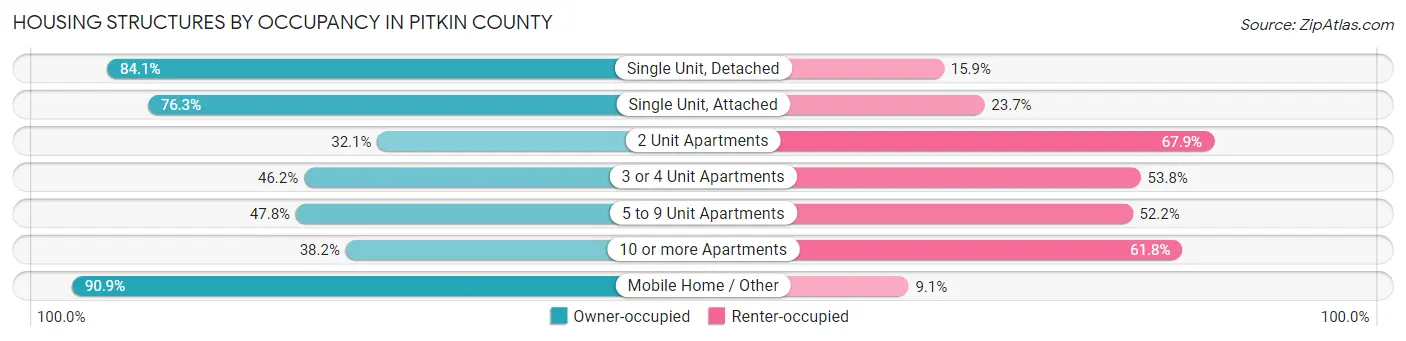
| Structure Type | Owner-occupied | Renter-occupied |
| Single Unit, Detached | 2,836 (84.1%) | 536 (15.9%) |
| Single Unit, Attached | 466 (76.3%) | 145 (23.7%) |
| 2 Unit Apartments | 69 (32.1%) | 146 (67.9%) |
| 3 or 4 Unit Apartments | 346 (46.2%) | 403 (53.8%) |
| 5 to 9 Unit Apartments | 448 (47.8%) | 490 (52.2%) |
| 10 or more Apartments | 658 (38.2%) | 1,066 (61.8%) |
| Mobile Home / Other | 459 (90.9%) | 46 (9.1%) |
| Total | 5,282 (65.1%) | 2,832 (34.9%) |
Housing Structures by Number of Rooms in Pitkin County
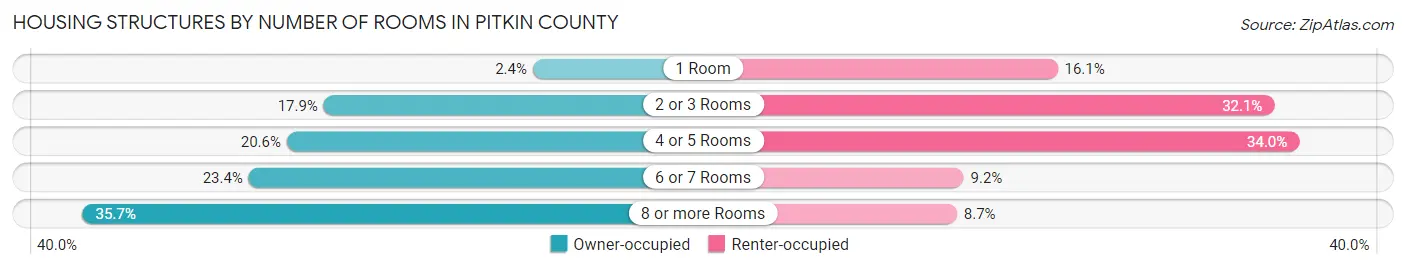
| Number of Rooms | Owner-occupied | Renter-occupied |
| 1 Room | 127 (2.4%) | 456 (16.1%) |
| 2 or 3 Rooms | 944 (17.9%) | 910 (32.1%) |
| 4 or 5 Rooms | 1,088 (20.6%) | 962 (34.0%) |
| 6 or 7 Rooms | 1,237 (23.4%) | 259 (9.1%) |
| 8 or more Rooms | 1,886 (35.7%) | 245 (8.6%) |
| Total | 5,282 (100.0%) | 2,832 (100.0%) |
Housing Structure by Heating Type in Pitkin County
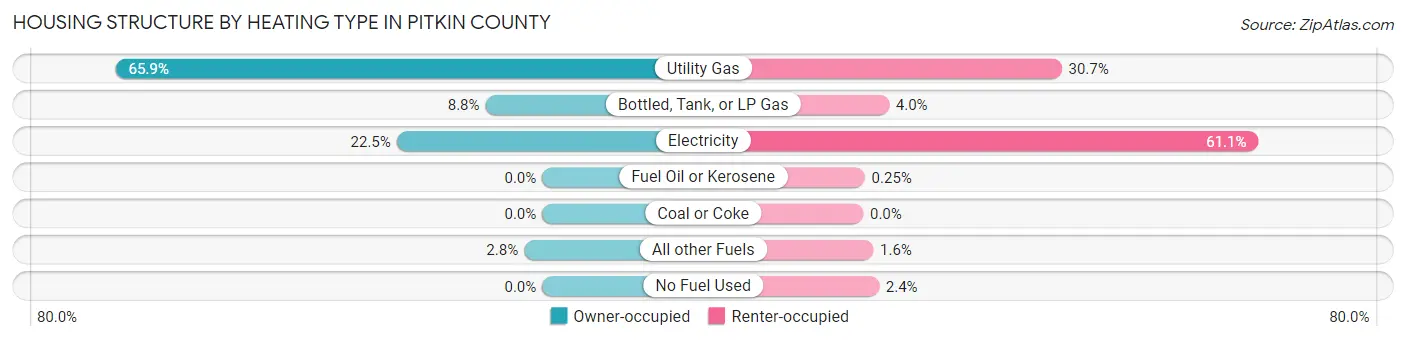
| Heating Type | Owner-occupied | Renter-occupied |
| Utility Gas | 3,483 (65.9%) | 869 (30.7%) |
| Bottled, Tank, or LP Gas | 463 (8.8%) | 113 (4.0%) |
| Electricity | 1,188 (22.5%) | 1,730 (61.1%) |
| Fuel Oil or Kerosene | 0 (0.0%) | 7 (0.3%) |
| Coal or Coke | 0 (0.0%) | 0 (0.0%) |
| All other Fuels | 148 (2.8%) | 44 (1.5%) |
| No Fuel Used | 0 (0.0%) | 69 (2.4%) |
| Total | 5,282 (100.0%) | 2,832 (100.0%) |
Household Vehicle Usage in Pitkin County
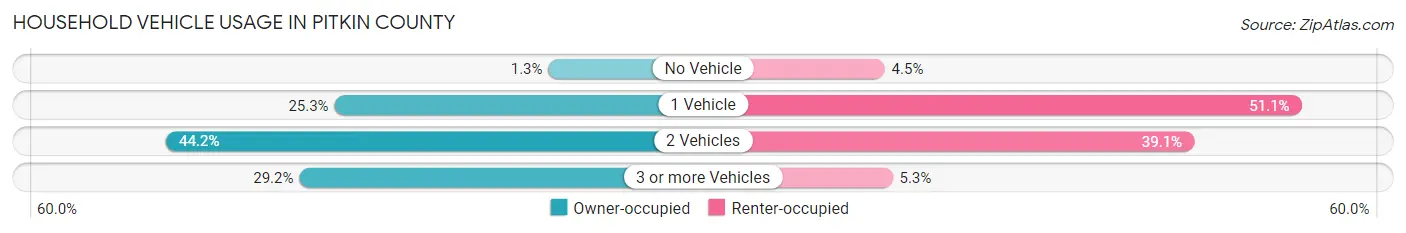
| Vehicles per Household | Owner-occupied | Renter-occupied |
| No Vehicle | 70 (1.3%) | 126 (4.4%) |
| 1 Vehicle | 1,336 (25.3%) | 1,448 (51.1%) |
| 2 Vehicles | 2,332 (44.2%) | 1,107 (39.1%) |
| 3 or more Vehicles | 1,544 (29.2%) | 151 (5.3%) |
| Total | 5,282 (100.0%) | 2,832 (100.0%) |
Real Estate & Mortgages in Pitkin County
Real Estate and Mortgage Overview in Pitkin County
| Characteristic | Without Mortgage | With Mortgage |
| Housing Units | 2,403 | 2,879 |
| Median Property Value | $1,181,400 | $693,000 |
| Median Household Income | $96,235 | $1,098 |
| Monthly Housing Costs | $1,151 | $1,202 |
| Real Estate Taxes | $5,338 | $121 |
Property Value by Mortgage Status in Pitkin County
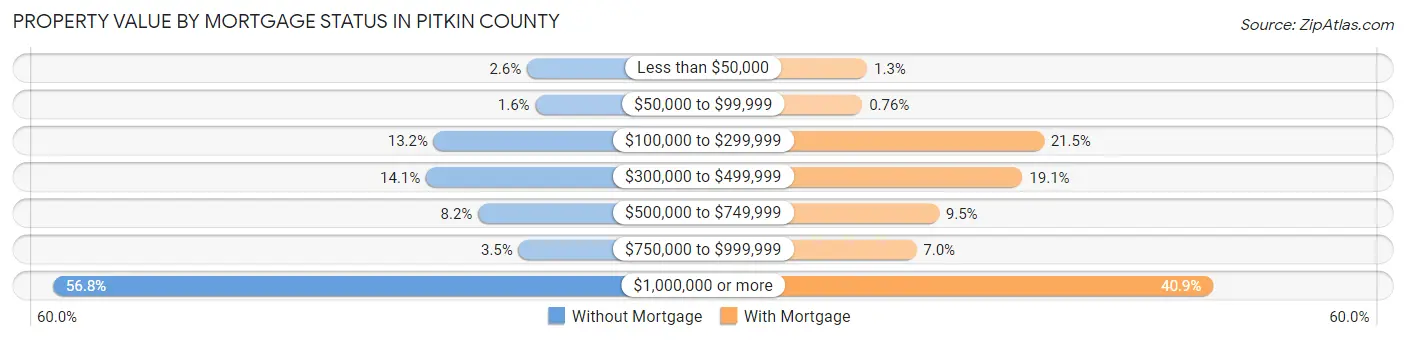
| Property Value | Without Mortgage | With Mortgage |
| Less than $50,000 | 62 (2.6%) | 38 (1.3%) |
| $50,000 to $99,999 | 39 (1.6%) | 22 (0.8%) |
| $100,000 to $299,999 | 318 (13.2%) | 619 (21.5%) |
| $300,000 to $499,999 | 339 (14.1%) | 549 (19.1%) |
| $500,000 to $749,999 | 196 (8.2%) | 274 (9.5%) |
| $750,000 to $999,999 | 85 (3.5%) | 200 (7.0%) |
| $1,000,000 or more | 1,364 (56.8%) | 1,177 (40.9%) |
| Total | 2,403 (100.0%) | 2,879 (100.0%) |
Household Income by Mortgage Status in Pitkin County
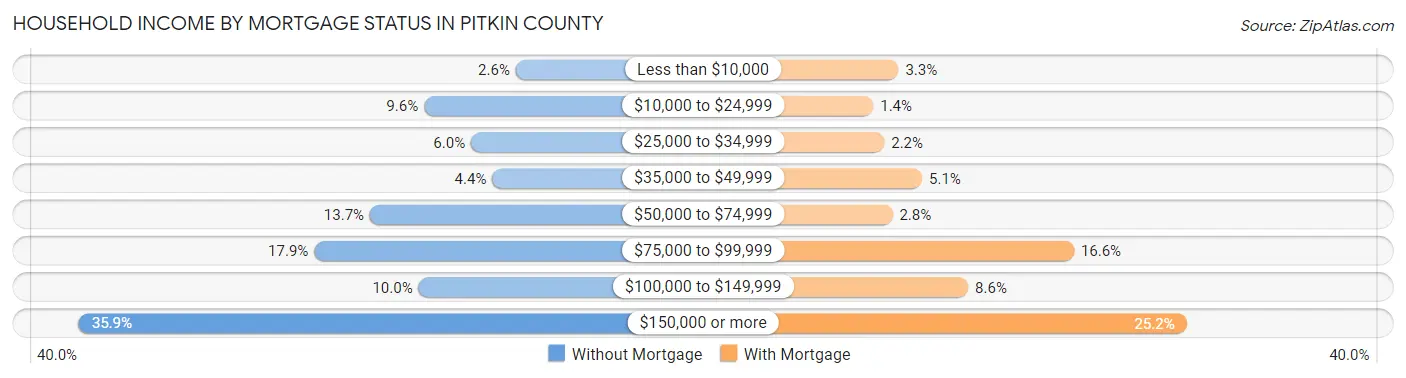
| Household Income | Without Mortgage | With Mortgage |
| Less than $10,000 | 62 (2.6%) | 94 (3.3%) |
| $10,000 to $24,999 | 230 (9.6%) | 39 (1.3%) |
| $25,000 to $34,999 | 144 (6.0%) | 63 (2.2%) |
| $35,000 to $49,999 | 105 (4.4%) | 146 (5.1%) |
| $50,000 to $74,999 | 329 (13.7%) | 81 (2.8%) |
| $75,000 to $99,999 | 431 (17.9%) | 479 (16.6%) |
| $100,000 to $149,999 | 240 (10.0%) | 247 (8.6%) |
| $150,000 or more | 862 (35.9%) | 726 (25.2%) |
| Total | 2,403 (100.0%) | 2,879 (100.0%) |
Property Value to Household Income Ratio in Pitkin County
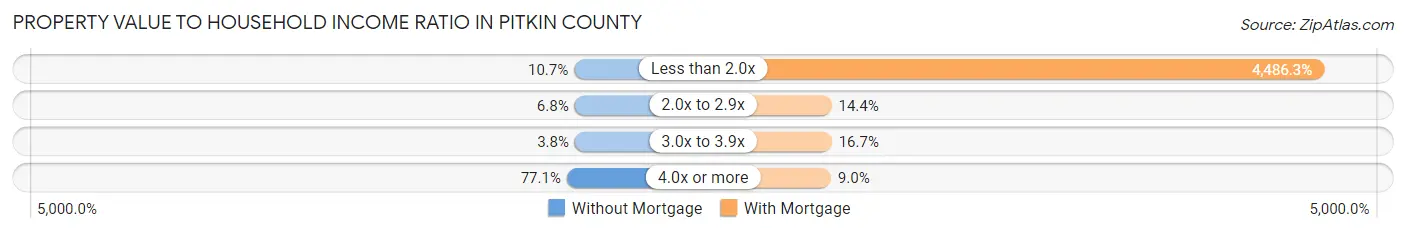
| Value-to-Income Ratio | Without Mortgage | With Mortgage |
| Less than 2.0x | 257 (10.7%) | 129,160 (4,486.3%) |
| 2.0x to 2.9x | 164 (6.8%) | 415 (14.4%) |
| 3.0x to 3.9x | 90 (3.7%) | 480 (16.7%) |
| 4.0x or more | 1,853 (77.1%) | 260 (9.0%) |
| Total | 2,403 (100.0%) | 2,879 (100.0%) |
Real Estate Taxes by Mortgage Status in Pitkin County
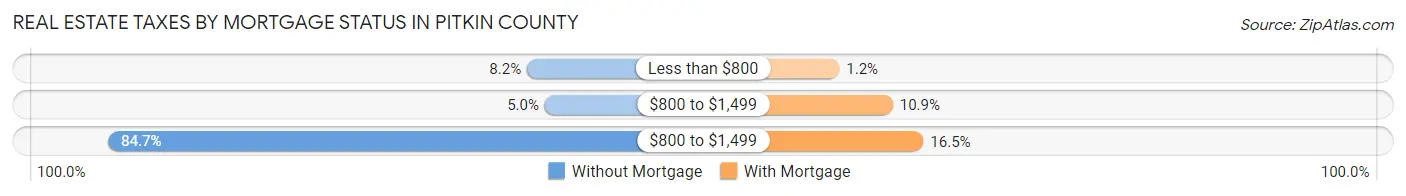
| Property Taxes | Without Mortgage | With Mortgage |
| Less than $800 | 198 (8.2%) | 33 (1.1%) |
| $800 to $1,499 | 120 (5.0%) | 314 (10.9%) |
| $800 to $1,499 | 2,036 (84.7%) | 475 (16.5%) |
| Total | 2,403 (100.0%) | 2,879 (100.0%) |
Health & Disability in Pitkin County
Health Insurance Coverage by Age in Pitkin County
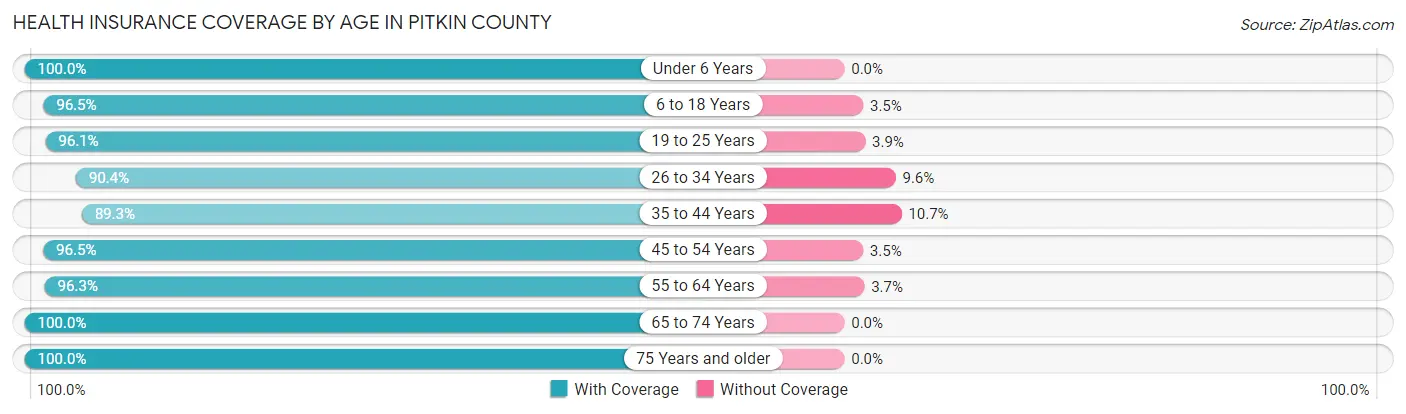
| Age Bracket | With Coverage | Without Coverage |
| Under 6 Years | 841 (100.0%) | 0 (0.0%) |
| 6 to 18 Years | 2,038 (96.5%) | 74 (3.5%) |
| 19 to 25 Years | 991 (96.1%) | 40 (3.9%) |
| 26 to 34 Years | 1,987 (90.4%) | 210 (9.6%) |
| 35 to 44 Years | 1,962 (89.3%) | 234 (10.7%) |
| 45 to 54 Years | 2,586 (96.5%) | 93 (3.5%) |
| 55 to 64 Years | 2,612 (96.3%) | 101 (3.7%) |
| 65 to 74 Years | 2,249 (100.0%) | 0 (0.0%) |
| 75 Years and older | 1,266 (100.0%) | 0 (0.0%) |
| Total | 16,532 (95.7%) | 752 (4.3%) |
Health Insurance Coverage by Citizenship Status in Pitkin County
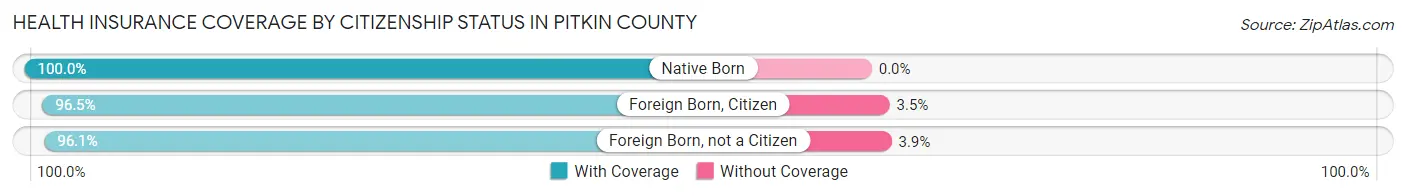
| Citizenship Status | With Coverage | Without Coverage |
| Native Born | 841 (100.0%) | 0 (0.0%) |
| Foreign Born, Citizen | 2,038 (96.5%) | 74 (3.5%) |
| Foreign Born, not a Citizen | 991 (96.1%) | 40 (3.9%) |
Health Insurance Coverage by Household Income in Pitkin County
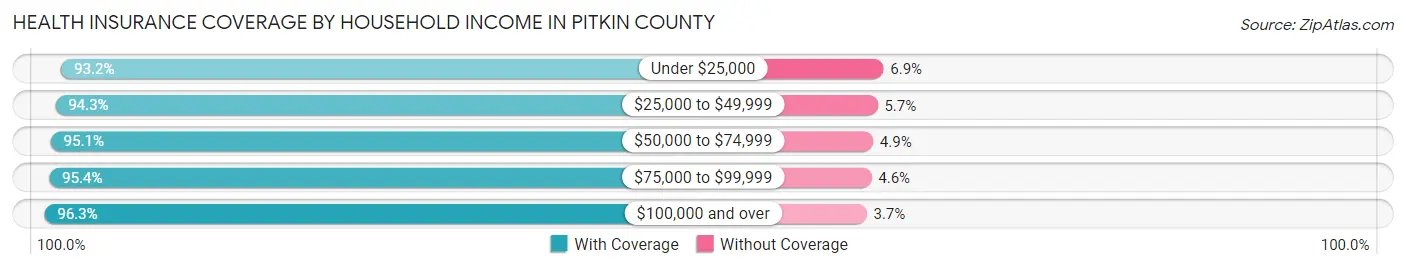
| Household Income | With Coverage | Without Coverage |
| Under $25,000 | 993 (93.1%) | 73 (6.9%) |
| $25,000 to $49,999 | 1,428 (94.3%) | 87 (5.7%) |
| $50,000 to $74,999 | 2,644 (95.1%) | 136 (4.9%) |
| $75,000 to $99,999 | 2,053 (95.4%) | 99 (4.6%) |
| $100,000 and over | 9,276 (96.3%) | 356 (3.7%) |
Public vs Private Health Insurance Coverage by Age in Pitkin County
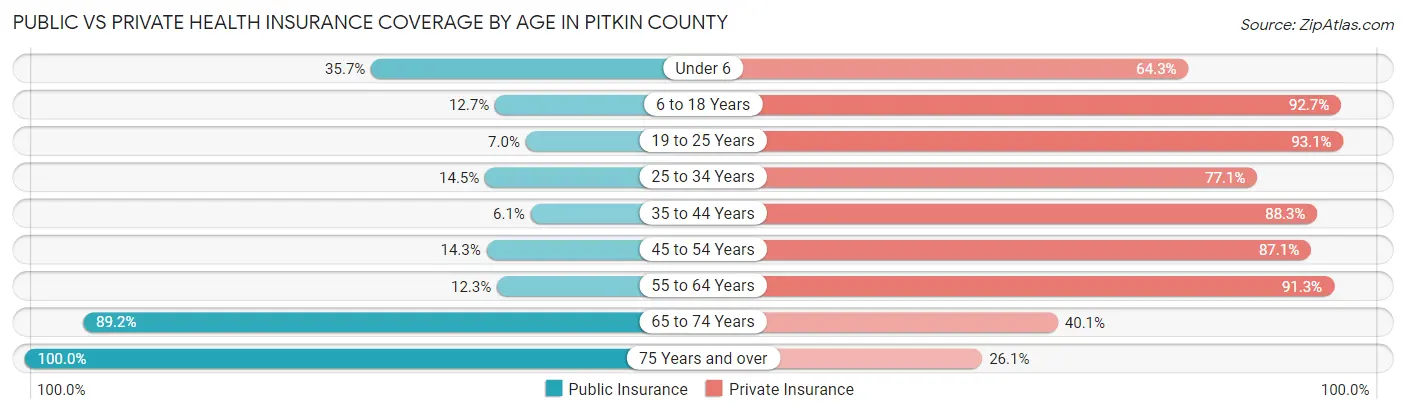
| Age Bracket | Public Insurance | Private Insurance |
| Under 6 | 300 (35.7%) | 541 (64.3%) |
| 6 to 18 Years | 268 (12.7%) | 1,957 (92.7%) |
| 19 to 25 Years | 72 (7.0%) | 960 (93.1%) |
| 25 to 34 Years | 319 (14.5%) | 1,694 (77.1%) |
| 35 to 44 Years | 133 (6.1%) | 1,938 (88.2%) |
| 45 to 54 Years | 382 (14.3%) | 2,333 (87.1%) |
| 55 to 64 Years | 334 (12.3%) | 2,478 (91.3%) |
| 65 to 74 Years | 2,005 (89.1%) | 902 (40.1%) |
| 75 Years and over | 1,266 (100.0%) | 330 (26.1%) |
| Total | 5,079 (29.4%) | 13,133 (76.0%) |
Disability Status by Sex by Age in Pitkin County

| Age Bracket | Male | Female |
| Under 5 Years | 0 (0.0%) | 0 (0.0%) |
| 5 to 17 Years | 0 (0.0%) | 0 (0.0%) |
| 18 to 34 Years | 207 (10.8%) | 76 (5.0%) |
| 35 to 64 Years | 260 (7.0%) | 295 (7.6%) |
| 65 to 74 Years | 393 (32.4%) | 66 (6.4%) |
| 75 Years and over | 140 (20.6%) | 108 (18.4%) |
Disability Class by Sex by Age in Pitkin County
Disability Class: Hearing Difficulty
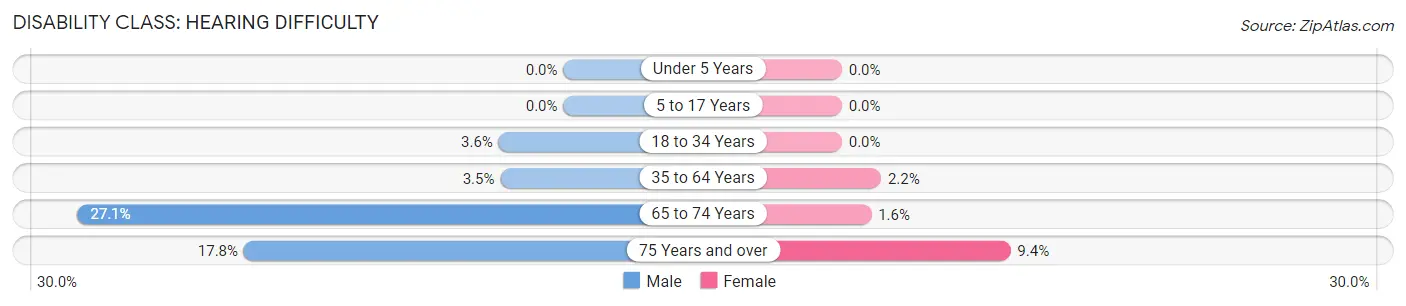
| Age Bracket | Male | Female |
| Under 5 Years | 0 (0.0%) | 0 (0.0%) |
| 5 to 17 Years | 0 (0.0%) | 0 (0.0%) |
| 18 to 34 Years | 69 (3.6%) | 0 (0.0%) |
| 35 to 64 Years | 131 (3.5%) | 84 (2.2%) |
| 65 to 74 Years | 328 (27.1%) | 17 (1.6%) |
| 75 Years and over | 121 (17.8%) | 55 (9.4%) |
Disability Class: Vision Difficulty
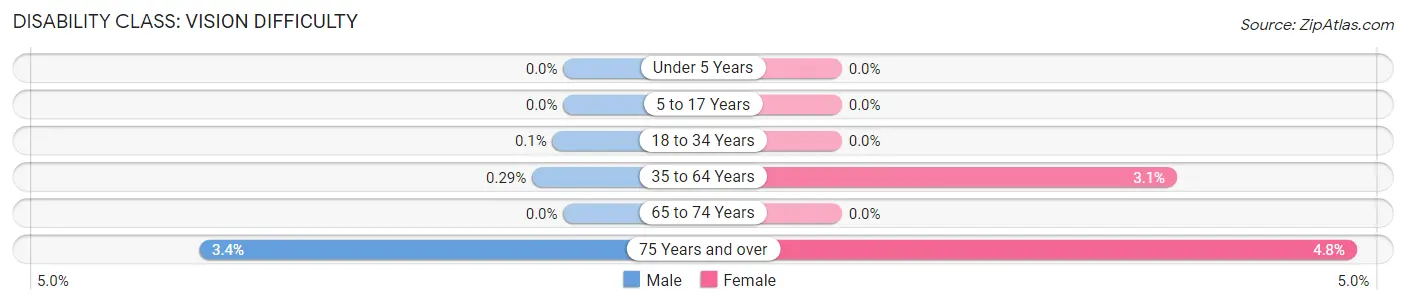
| Age Bracket | Male | Female |
| Under 5 Years | 0 (0.0%) | 0 (0.0%) |
| 5 to 17 Years | 0 (0.0%) | 0 (0.0%) |
| 18 to 34 Years | 2 (0.1%) | 0 (0.0%) |
| 35 to 64 Years | 11 (0.3%) | 120 (3.1%) |
| 65 to 74 Years | 0 (0.0%) | 0 (0.0%) |
| 75 Years and over | 23 (3.4%) | 28 (4.8%) |
Disability Class: Cognitive Difficulty
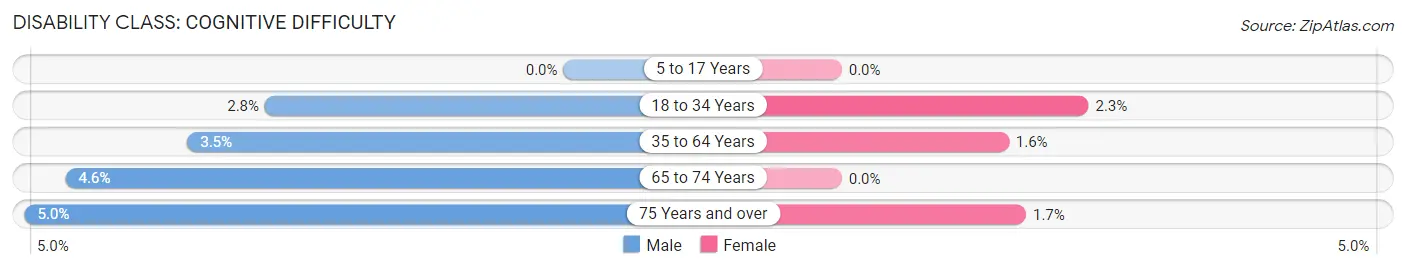
| Age Bracket | Male | Female |
| 5 to 17 Years | 0 (0.0%) | 0 (0.0%) |
| 18 to 34 Years | 53 (2.8%) | 35 (2.3%) |
| 35 to 64 Years | 130 (3.5%) | 60 (1.5%) |
| 65 to 74 Years | 56 (4.6%) | 0 (0.0%) |
| 75 Years and over | 34 (5.0%) | 10 (1.7%) |
Disability Class: Ambulatory Difficulty

| Age Bracket | Male | Female |
| 5 to 17 Years | 0 (0.0%) | 0 (0.0%) |
| 18 to 34 Years | 87 (4.5%) | 0 (0.0%) |
| 35 to 64 Years | 104 (2.8%) | 81 (2.1%) |
| 65 to 74 Years | 9 (0.7%) | 0 (0.0%) |
| 75 Years and over | 33 (4.9%) | 29 (5.0%) |
Disability Class: Self-Care Difficulty
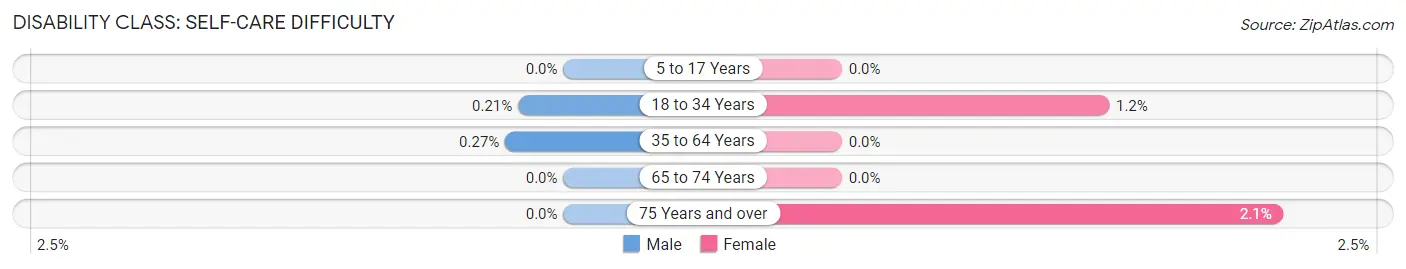
| Age Bracket | Male | Female |
| 5 to 17 Years | 0 (0.0%) | 0 (0.0%) |
| 18 to 34 Years | 4 (0.2%) | 19 (1.2%) |
| 35 to 64 Years | 10 (0.3%) | 0 (0.0%) |
| 65 to 74 Years | 0 (0.0%) | 0 (0.0%) |
| 75 Years and over | 0 (0.0%) | 12 (2.1%) |
Technology Access in Pitkin County
Computing Device Access in Pitkin County
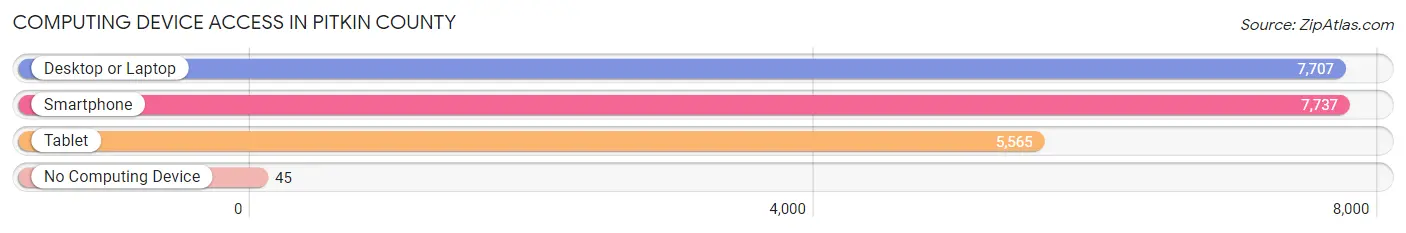
| Device Type | # Households | % Households |
| Desktop or Laptop | 7,707 | 95.0% |
| Smartphone | 7,737 | 95.4% |
| Tablet | 5,565 | 68.6% |
| No Computing Device | 45 | 0.5% |
| Total | 8,114 | 100.0% |
Internet Access in Pitkin County
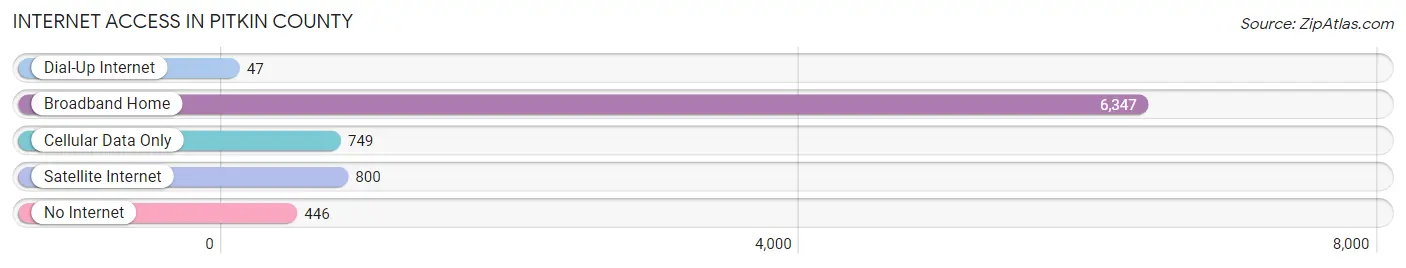
| Internet Type | # Households | % Households |
| Dial-Up Internet | 47 | 0.6% |
| Broadband Home | 6,347 | 78.2% |
| Cellular Data Only | 749 | 9.2% |
| Satellite Internet | 800 | 9.9% |
| No Internet | 446 | 5.5% |
| Total | 8,114 | 100.0% |
Pitkin County Summary
Pitkin County is located in the central Rocky Mountains of Colorado, and is one of the 64 counties in the state. It is bordered by Eagle County to the north, Garfield County to the east, Gunnison County to the south, and Summit County to the west. The county seat is Aspen, and the county has a total area of 1,017 square miles, with a population of 17,148 as of the 2010 census.
Pitkin County was created in 1881 from parts of Gunnison and Summit counties. It was named after former Colorado Governor Frederick Walker Pitkin. The county is home to the cities of Aspen, Snowmass Village, and Basalt, as well as the unincorporated communities of Woody Creek, Old Snowmass, and Redstone.
Geography
Pitkin County is located in the central Rocky Mountains of Colorado, and is one of the 64 counties in the state. It is bordered by Eagle County to the north, Garfield County to the east, Gunnison County to the south, and Summit County to the west. The county has a total area of 1,017 square miles, with a population of 17,148 as of the 2010 census.
The county is home to the cities of Aspen, Snowmass Village, and Basalt, as well as the unincorporated communities of Woody Creek, Old Snowmass, and Redstone. The county is home to the White River National Forest, the Maroon Bells-Snowmass Wilderness, and the Ruedi Reservoir. The highest point in the county is the summit of Mount Sopris at 12,953 feet.
History
Pitkin County was created in 1881 from parts of Gunnison and Summit counties. It was named after former Colorado Governor Frederick Walker Pitkin. The county was originally inhabited by the Ute people, and was later settled by miners and ranchers in the late 19th century.
The county was home to the Aspen Skiing Company, which was founded in 1946 and is now one of the largest ski resorts in the United States. The county is also home to the Aspen Music Festival and School, which was founded in 1949 and is now one of the most prestigious music festivals in the world.
Economy
Pitkin County’s economy is largely based on tourism, with the ski resorts and other recreational activities being the main sources of income. The county is also home to a number of high-end retail stores, restaurants, and hotels. The county is also home to a number of technology companies, such as Aspen Technology, which is a software company that specializes in energy and process optimization.
The county is also home to a number of agricultural operations, such as cattle ranches, hay farms, and vegetable farms. The county is also home to a number of mining operations, such as gold, silver, and molybdenum.
Demographics
As of the 2010 census, the population of Pitkin County was 17,148, with a population density of 16.8 people per square mile. The racial makeup of the county was 94.3% White, 0.7% Black or African American, 0.3% Native American, 1.2% Asian, 0.1% Pacific Islander, 1.3% from other races, and 2.3% from two or more races.
The median income for a household in the county was $77,837, and the median income for a family was $90,945. The per capita income for the county was $50,945. The poverty rate was 5.3%.
Conclusion
Pitkin County is located in the central Rocky Mountains of Colorado, and is one of the 64 counties in the state. It is bordered by Eagle County to the north, Garfield County to the east, Gunnison County to the south, and Summit County to the west. The county was created in 1881 from parts of Gunnison and Summit counties, and was named after former Colorado Governor Frederick Walker Pitkin. The county is home to the cities of Aspen, Snowmass Village, and Basalt, as well as the unincorporated communities of Woody Creek, Old Snowmass, and Redstone. The county’s economy is largely based on tourism, with the ski resorts and other recreational activities being the main sources of income. As of the 2010 census, the population of Pitkin County was 17,148, with a population density of 16.8 people per square mile. The median income for a household in the county was $77,837, and the median income for a family was $90,945. The per capita income for the county was $50,945. The poverty rate was 5.3%.
Common Questions
What is the Total Population of Pitkin County?
Total Population of Pitkin County is 17,325.
What is the Total Male Population of Pitkin County?
Total Male Population of Pitkin County is 9,070.
What is the Total Female Population of Pitkin County?
Total Female Population of Pitkin County is 8,255.
What is the Ratio of Males per 100 Females in Pitkin County?
There are 109.87 Males per 100 Females in Pitkin County.
What is the Ratio of Females per 100 Males in Pitkin County?
There are 91.01 Females per 100 Males in Pitkin County.
What is the Median Population Age in Pitkin County?
Median Population Age in Pitkin County is 46.7 Years.
What is the Average Family Size in Pitkin County
Average Family Size in Pitkin County is 2.8 People.
What is the Average Household Size in Pitkin County
Average Household Size in Pitkin County is 2.1 People.
What is Per Capita Income in Pitkin County?
Per Capita income in Pitkin County is $87,561.
What is the Median Family Income in Pitkin County?
Median Family Income in Pitkin County is $122,870.
What is the Median Household income in Pitkin County?
Median Household Income in Pitkin County is $96,123.
What is Income or Wage Gap in Pitkin County?
Income or Wage Gap in Pitkin County is 18.0%.
Women in Pitkin County earn 82.0 cents for every dollar earned by a man.
What is Inequality or Gini Index in Pitkin County?
Inequality or Gini Index in Pitkin County is 0.59.
How Large is the Labor Force in Pitkin County?
There are 10,727 People in the Labor Forcein in Pitkin County.
What is the Percentage of People in the Labor Force in Pitkin County?
71.9% of People are in the Labor Force in Pitkin County.
What is the Unemployment Rate in Pitkin County?
Unemployment Rate in Pitkin County is 2.1%.