Park County, CO
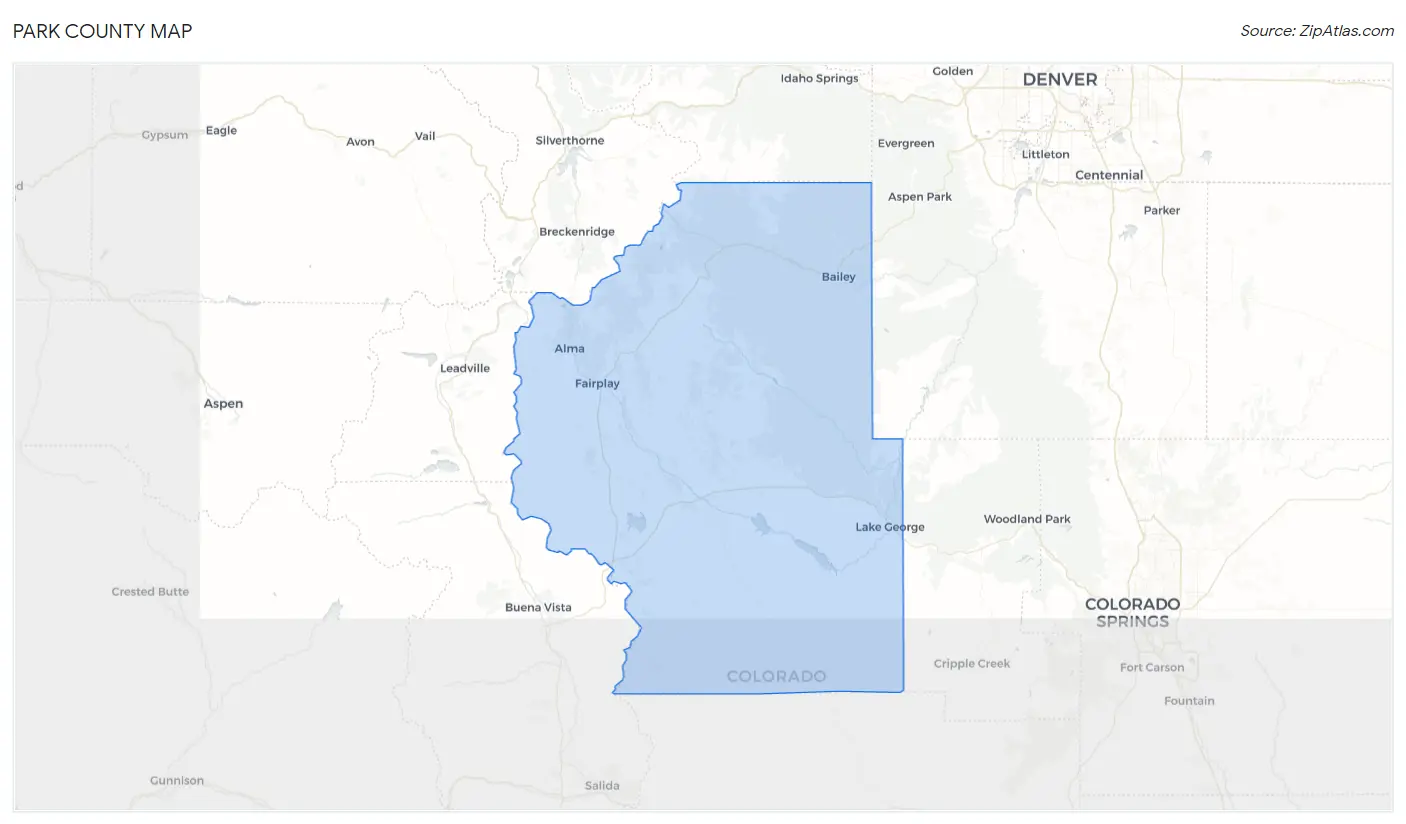
Park County Map
Park County Overview
17,597
TOTAL POPULATION
9,422
MALE POPULATION
8,175
FEMALE POPULATION
115.25
MALES / 100 FEMALES
86.77
FEMALES / 100 MALES
51.3
MEDIAN AGE
2.6
AVG FAMILY SIZE
2.3
AVG HOUSEHOLD SIZE
$48,221
PER CAPITA INCOME
$107,599
AVG FAMILY INCOME
$85,019
AVG HOUSEHOLD INCOME
16.4%
WAGE / INCOME GAP [ % ]
83.6¢/ $1
WAGE / INCOME GAP [ $ ]
0.41
INEQUALITY / GINI INDEX
8,993
LABOR FORCE [ PEOPLE ]
58.8%
PERCENT IN LABOR FORCE
3.9%
UNEMPLOYMENT RATE
Park County Area Codes
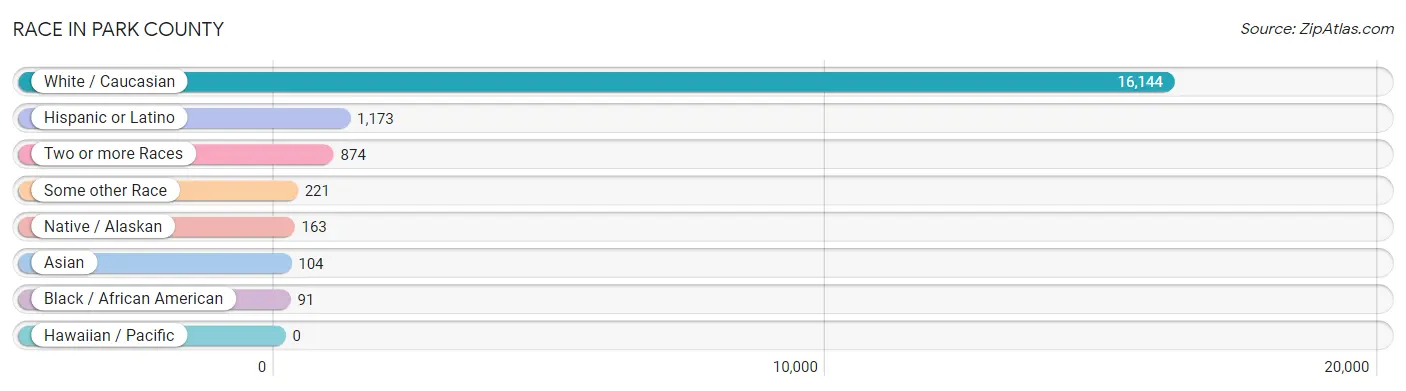
Race in Park County
The most populous races in Park County are White / Caucasian (16,144 | 91.7%), Hispanic or Latino (1,173 | 6.7%), and Two or more Races (874 | 5.0%).
| Race | # Population | % Population |
| Asian | 104 | 0.6% |
| Black / African American | 91 | 0.5% |
| Hawaiian / Pacific | 0 | 0.0% |
| Hispanic or Latino | 1,173 | 6.7% |
| Native / Alaskan | 163 | 0.9% |
| White / Caucasian | 16,144 | 91.7% |
| Two or more Races | 874 | 5.0% |
| Some other Race | 221 | 1.3% |
| Total | 17,597 | 100.0% |
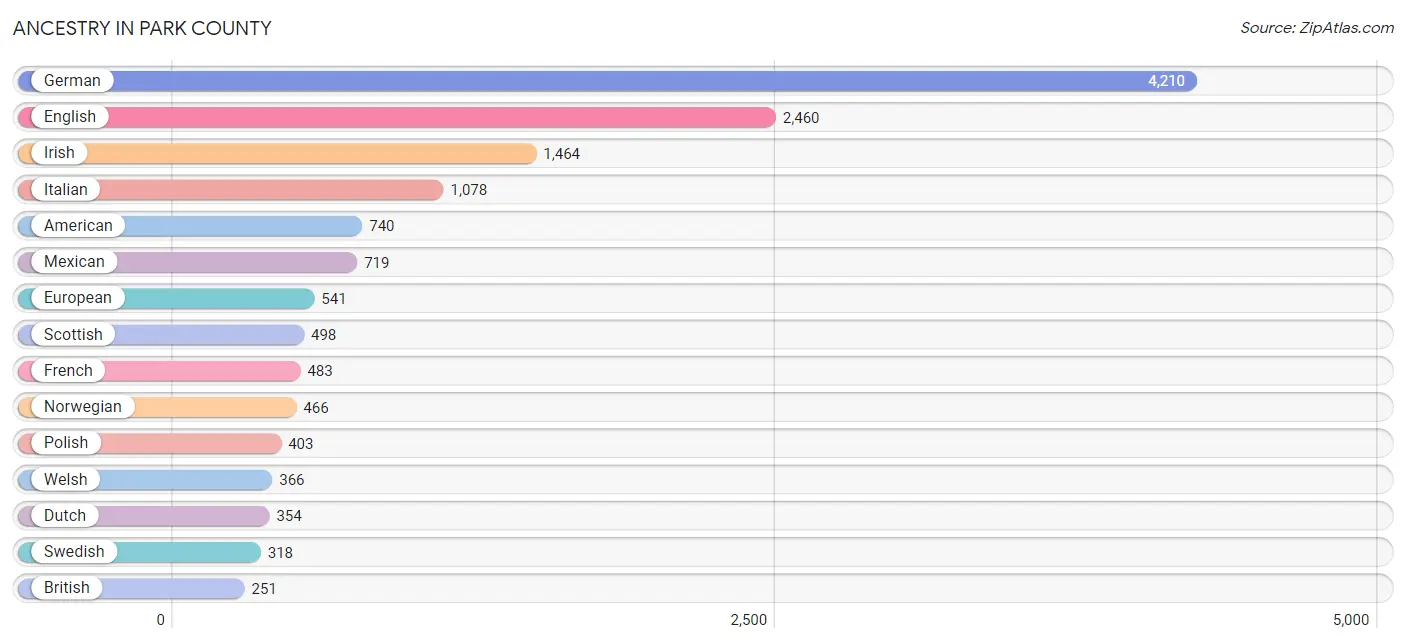
Ancestry in Park County
The most populous ancestries reported in Park County are German (4,210 | 23.9%), English (2,460 | 14.0%), Irish (1,464 | 8.3%), Italian (1,078 | 6.1%), and American (740 | 4.2%), together accounting for 56.6% of all Park County residents.
| Ancestry | # Population | % Population |
| African | 14 | 0.1% |
| American | 740 | 4.2% |
| Apache | 61 | 0.4% |
| Arab | 21 | 0.1% |
| Armenian | 23 | 0.1% |
| Australian | 28 | 0.2% |
| Austrian | 57 | 0.3% |
| Belgian | 13 | 0.1% |
| Bhutanese | 28 | 0.2% |
| Blackfeet | 84 | 0.5% |
| British | 251 | 1.4% |
| Burmese | 76 | 0.4% |
| Canadian | 45 | 0.3% |
| Central American | 14 | 0.1% |
| Cherokee | 33 | 0.2% |
| Chippewa | 34 | 0.2% |
| Choctaw | 114 | 0.6% |
| Creek | 28 | 0.2% |
| Croatian | 7 | 0.0% |
| Crow | 44 | 0.3% |
| Cuban | 40 | 0.2% |
| Czech | 163 | 0.9% |
| Czechoslovakian | 15 | 0.1% |
| Danish | 105 | 0.6% |
| Dutch | 354 | 2.0% |
| Eastern European | 100 | 0.6% |
| English | 2,460 | 14.0% |
| European | 541 | 3.1% |
| Finnish | 214 | 1.2% |
| French | 483 | 2.7% |
| French Canadian | 22 | 0.1% |
| German | 4,210 | 23.9% |
| Greek | 131 | 0.7% |
| Hungarian | 44 | 0.3% |
| Icelander | 88 | 0.5% |
| Indian (Asian) | 28 | 0.2% |
| Irish | 1,464 | 8.3% |
| Italian | 1,078 | 6.1% |
| Lithuanian | 70 | 0.4% |
| Luxembourger | 10 | 0.1% |
| Mexican | 719 | 4.1% |
| Mexican American Indian | 21 | 0.1% |
| Navajo | 35 | 0.2% |
| Northern European | 25 | 0.1% |
| Norwegian | 466 | 2.6% |
| Pennsylvania German | 4 | 0.0% |
| Peruvian | 8 | 0.1% |
| Polish | 403 | 2.3% |
| Portuguese | 24 | 0.1% |
| Puerto Rican | 121 | 0.7% |
| Russian | 174 | 1.0% |
| Salvadoran | 14 | 0.1% |
| Scandinavian | 37 | 0.2% |
| Scotch-Irish | 238 | 1.3% |
| Scottish | 498 | 2.8% |
| Serbian | 40 | 0.2% |
| Slavic | 18 | 0.1% |
| Slovak | 12 | 0.1% |
| Slovene | 108 | 0.6% |
| South American | 8 | 0.1% |
| Spaniard | 75 | 0.4% |
| Spanish | 26 | 0.2% |
| Spanish American | 4 | 0.0% |
| Subsaharan African | 22 | 0.1% |
| Sudanese | 8 | 0.1% |
| Swedish | 318 | 1.8% |
| Swiss | 125 | 0.7% |
| Tohono O'Odham | 19 | 0.1% |
| Ukrainian | 70 | 0.4% |
| Welsh | 366 | 2.1% |
| Yugoslavian | 27 | 0.2% | View All 71 Rows |
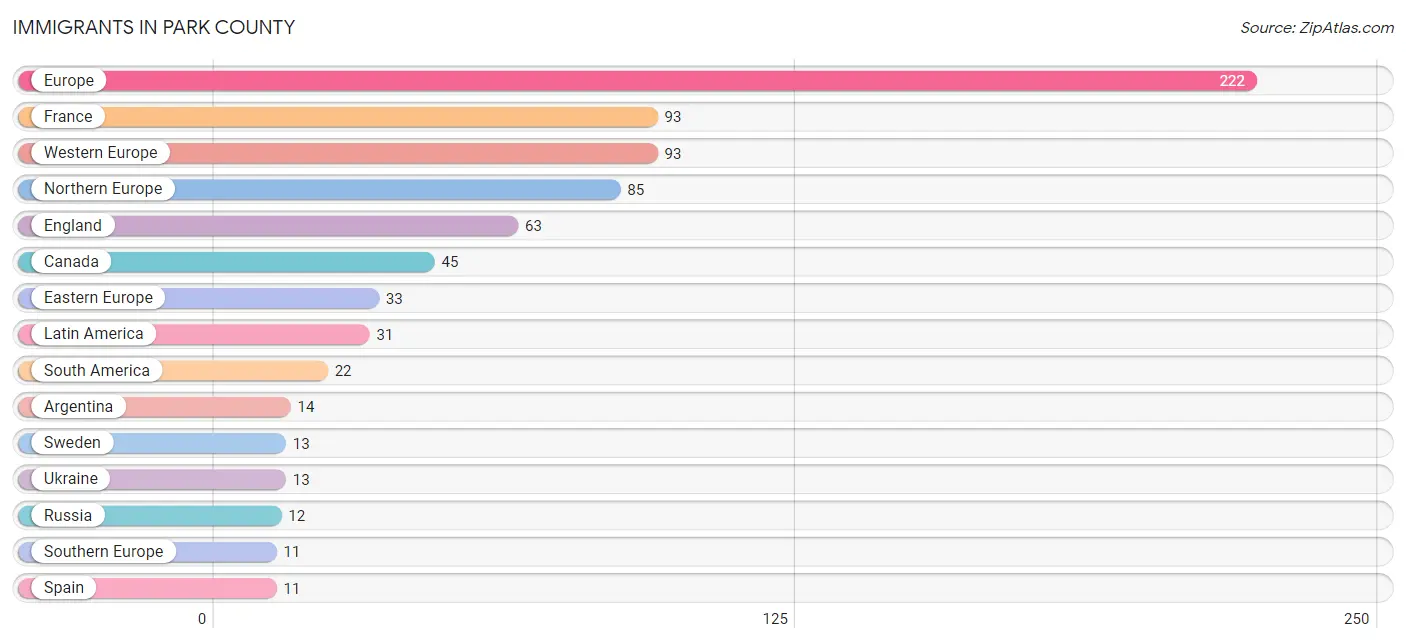
Immigrants in Park County
The most numerous immigrant groups reported in Park County came from Europe (222 | 1.3%), France (93 | 0.5%), Western Europe (93 | 0.5%), Northern Europe (85 | 0.5%), and England (63 | 0.4%), together accounting for 3.2% of all Park County residents.
| Immigration Origin | # Population | % Population |
| Africa | 8 | 0.1% |
| Argentina | 14 | 0.1% |
| Canada | 45 | 0.3% |
| Central America | 9 | 0.1% |
| Eastern Europe | 33 | 0.2% |
| England | 63 | 0.4% |
| Europe | 222 | 1.3% |
| France | 93 | 0.5% |
| Latin America | 31 | 0.2% |
| Latvia | 8 | 0.1% |
| Mexico | 9 | 0.1% |
| Northern Europe | 85 | 0.5% |
| Peru | 8 | 0.1% |
| Russia | 12 | 0.1% |
| South Africa | 8 | 0.1% |
| South America | 22 | 0.1% |
| Southern Europe | 11 | 0.1% |
| Spain | 11 | 0.1% |
| Sweden | 13 | 0.1% |
| Ukraine | 13 | 0.1% |
| Western Europe | 93 | 0.5% | View All 21 Rows |
Sex and Age in Park County
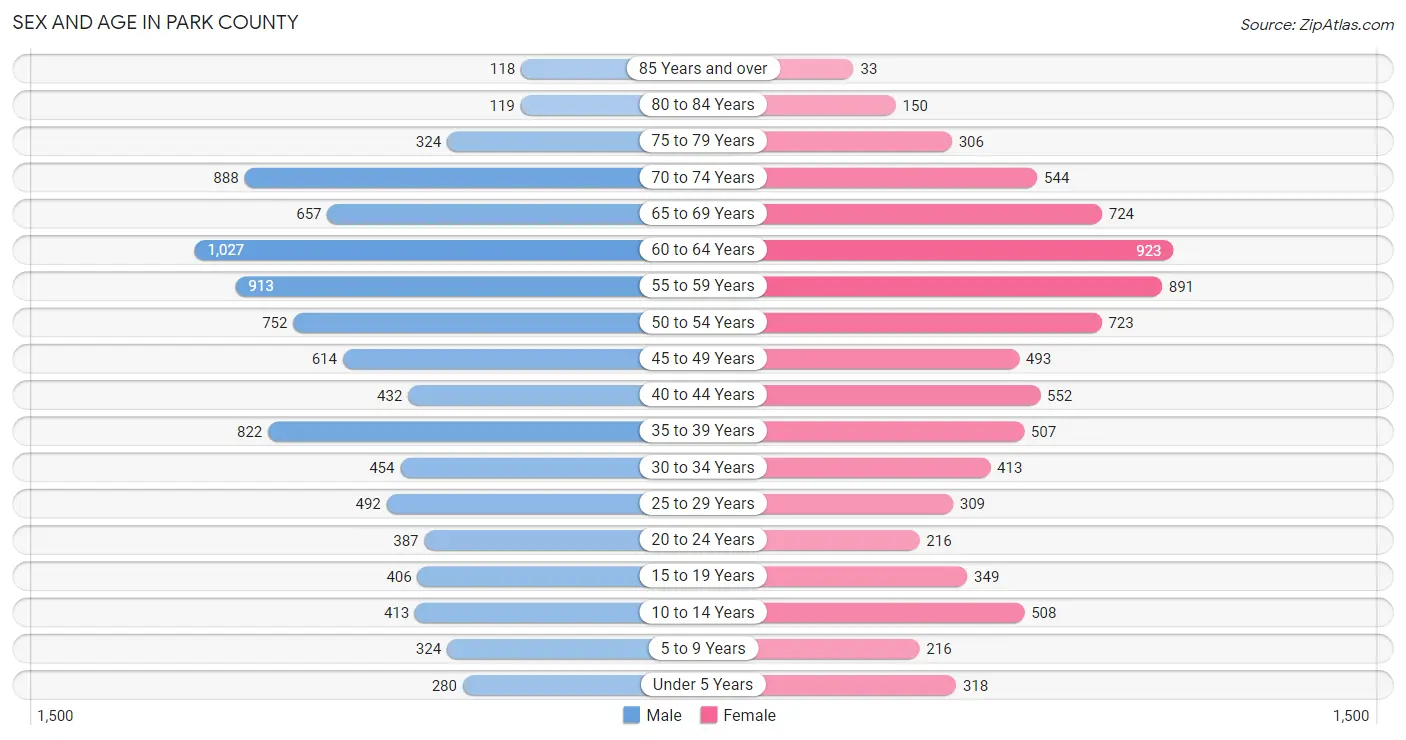
Sex and Age in Park County
The most populous age groups in Park County are 60 to 64 Years (1,027 | 10.9%) for men and 60 to 64 Years (923 | 11.3%) for women.
| Age Bracket | Male | Female |
| Under 5 Years | 280 (3.0%) | 318 (3.9%) |
| 5 to 9 Years | 324 (3.4%) | 216 (2.6%) |
| 10 to 14 Years | 413 (4.4%) | 508 (6.2%) |
| 15 to 19 Years | 406 (4.3%) | 349 (4.3%) |
| 20 to 24 Years | 387 (4.1%) | 216 (2.6%) |
| 25 to 29 Years | 492 (5.2%) | 309 (3.8%) |
| 30 to 34 Years | 454 (4.8%) | 413 (5.1%) |
| 35 to 39 Years | 822 (8.7%) | 507 (6.2%) |
| 40 to 44 Years | 432 (4.6%) | 552 (6.8%) |
| 45 to 49 Years | 614 (6.5%) | 493 (6.0%) |
| 50 to 54 Years | 752 (8.0%) | 723 (8.8%) |
| 55 to 59 Years | 913 (9.7%) | 891 (10.9%) |
| 60 to 64 Years | 1,027 (10.9%) | 923 (11.3%) |
| 65 to 69 Years | 657 (7.0%) | 724 (8.9%) |
| 70 to 74 Years | 888 (9.4%) | 544 (6.7%) |
| 75 to 79 Years | 324 (3.4%) | 306 (3.7%) |
| 80 to 84 Years | 119 (1.3%) | 150 (1.8%) |
| 85 Years and over | 118 (1.3%) | 33 (0.4%) |
| Total | 9,422 (100.0%) | 8,175 (100.0%) |
Families and Households in Park County
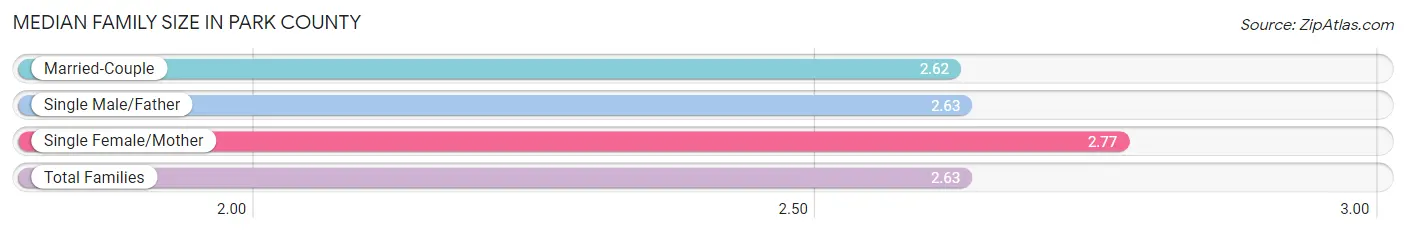
Median Family Size in Park County
The median family size in Park County is 2.63 persons per family, with single female/mother families (266 | 4.9%) accounting for the largest median family size of 2.77 persons per family. On the other hand, married-couple families (4,935 | 91.2%) represent the smallest median family size with 2.62 persons per family.
| Family Type | # Families | Family Size |
| Married-Couple | 4,935 (91.2%) | 2.62 |
| Single Male/Father | 208 (3.8%) | 2.63 |
| Single Female/Mother | 266 (4.9%) | 2.77 |
| Total Families | 5,409 (100.0%) | 2.63 |
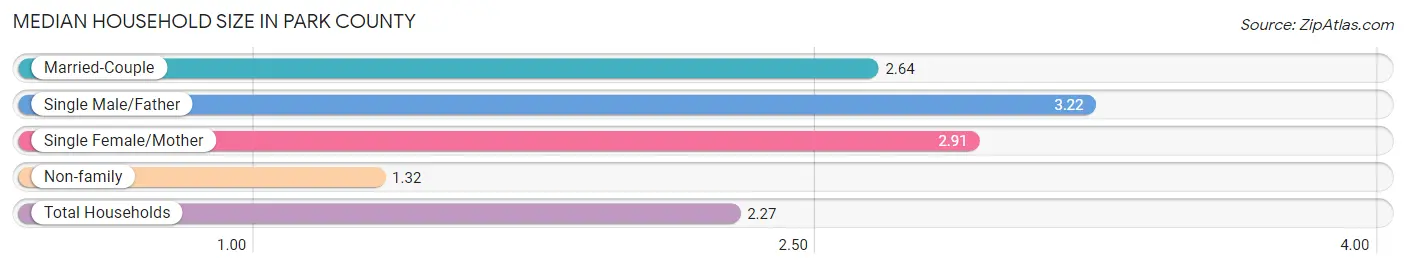
Median Household Size in Park County
The median household size in Park County is 2.27 persons per household, with single male/father households (208 | 2.7%) accounting for the largest median household size of 3.22 persons per household. non-family households (2,279 | 29.6%) represent the smallest median household size with 1.32 persons per household.
| Household Type | # Households | Household Size |
| Married-Couple | 4,935 (64.2%) | 2.64 |
| Single Male/Father | 208 (2.7%) | 3.22 |
| Single Female/Mother | 266 (3.5%) | 2.91 |
| Non-family | 2,279 (29.6%) | 1.32 |
| Total Households | 7,688 (100.0%) | 2.27 |
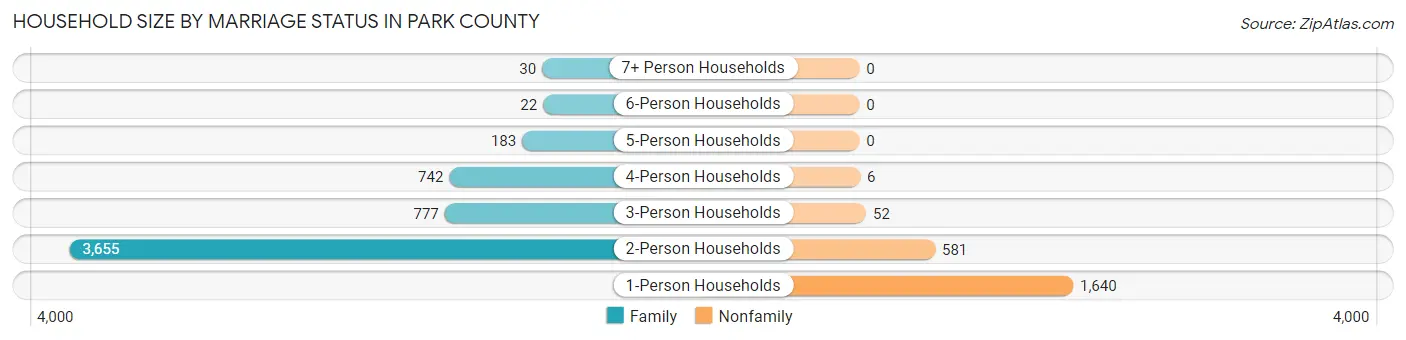
Household Size by Marriage Status in Park County
Out of a total of 7,688 households in Park County, 5,409 (70.4%) are family households, while 2,279 (29.6%) are nonfamily households. The most numerous type of family households are 2-person households, comprising 3,655, and the most common type of nonfamily households are 1-person households, comprising 1,640.
| Household Size | Family Households | Nonfamily Households |
| 1-Person Households | - | 1,640 (21.3%) |
| 2-Person Households | 3,655 (47.5%) | 581 (7.6%) |
| 3-Person Households | 777 (10.1%) | 52 (0.7%) |
| 4-Person Households | 742 (9.7%) | 6 (0.1%) |
| 5-Person Households | 183 (2.4%) | 0 (0.0%) |
| 6-Person Households | 22 (0.3%) | 0 (0.0%) |
| 7+ Person Households | 30 (0.4%) | 0 (0.0%) |
| Total | 5,409 (70.4%) | 2,279 (29.6%) |
Female Fertility in Park County
Fertility by Age in Park County
Average fertility rate in Park County is 29.0 births per 1,000 women. Women in the age bracket of 20 to 34 years have the highest fertility rate with 59.0 births per 1,000 women. Women in the age bracket of 20 to 34 years acount for 65.5% of all women with births.
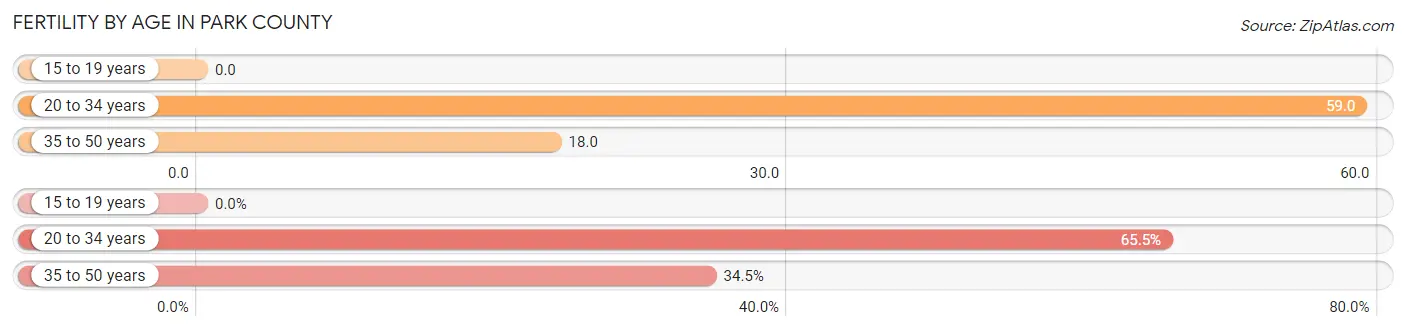
| Age Bracket | Women with Births | Births / 1,000 Women |
| 15 to 19 years | 0 (0.0%) | 0.0 |
| 20 to 34 years | 55 (65.5%) | 59.0 |
| 35 to 50 years | 29 (34.5%) | 18.0 |
| Total | 84 (100.0%) | 29.0 |
Fertility by Age by Marriage Status in Park County
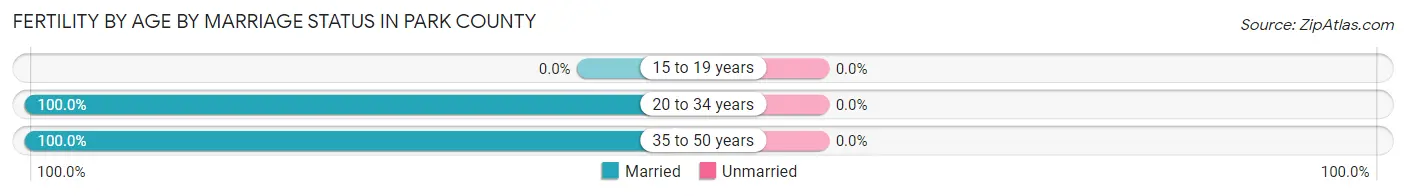
| Age Bracket | Married | Unmarried |
| 15 to 19 years | 0 (0.0%) | 0 (0.0%) |
| 20 to 34 years | 55 (100.0%) | 0 (0.0%) |
| 35 to 50 years | 29 (100.0%) | 0 (0.0%) |
| Total | 84 (100.0%) | 0 (0.0%) |
Fertility by Education in Park County
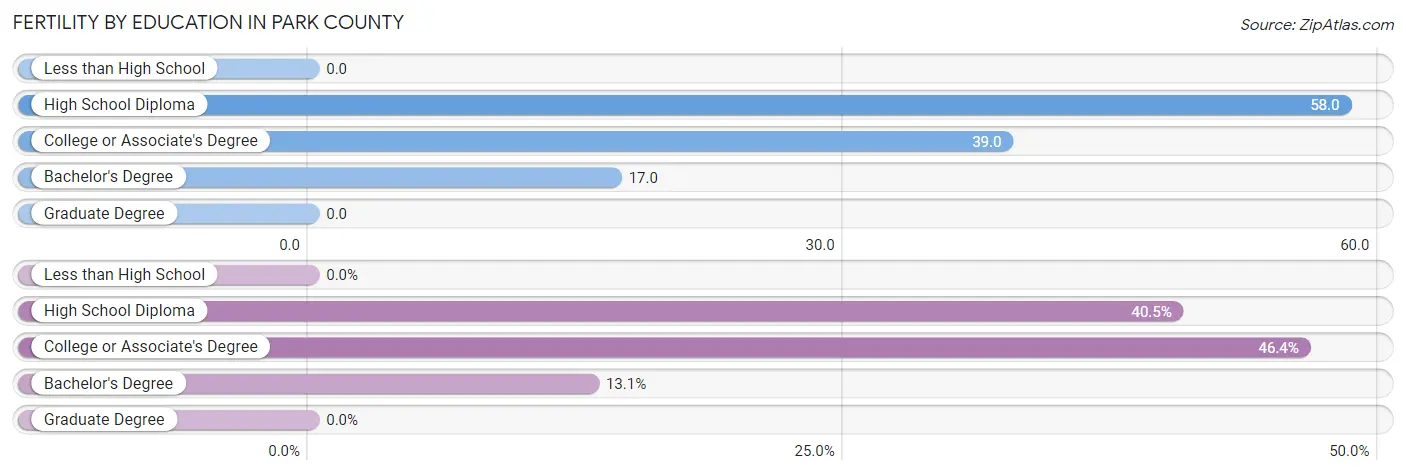
| Educational Attainment | Women with Births | Births / 1,000 Women |
| Less than High School | 0 (0.0%) | 0.0 |
| High School Diploma | 34 (40.5%) | 58.0 |
| College or Associate's Degree | 39 (46.4%) | 39.0 |
| Bachelor's Degree | 11 (13.1%) | 17.0 |
| Graduate Degree | 0 (0.0%) | 0.0 |
| Total | 84 (100.0%) | 29.0 |
Fertility by Education by Marriage Status in Park County
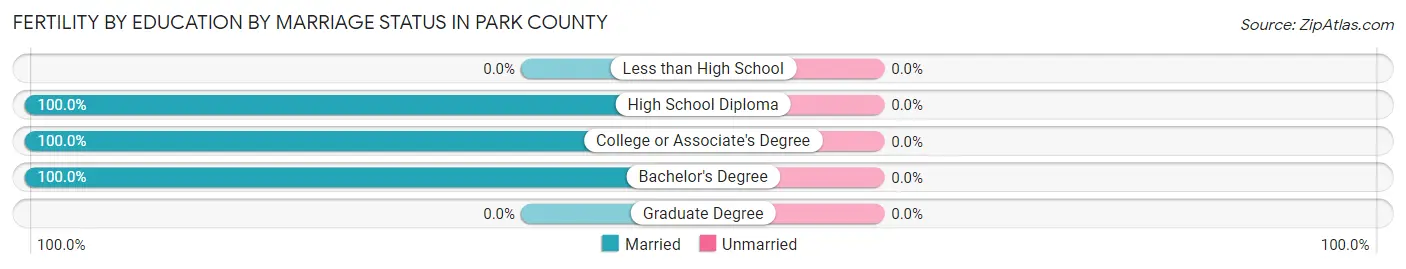
| Educational Attainment | Married | Unmarried |
| Less than High School | 0 (0.0%) | 0 (0.0%) |
| High School Diploma | 34 (100.0%) | 0 (0.0%) |
| College or Associate's Degree | 39 (100.0%) | 0 (0.0%) |
| Bachelor's Degree | 11 (100.0%) | 0 (0.0%) |
| Graduate Degree | 0 (0.0%) | 0 (0.0%) |
| Total | 84 (100.0%) | 0 (0.0%) |
Income in Park County
Income Overview in Park County
Per Capita Income in Park County is $48,221, while median incomes of families and households are $107,599 and $85,019 respectively.
| Characteristic | Number | Measure |
| Per Capita Income | 17,597 | $48,221 |
| Median Family Income | 5,409 | $107,599 |
| Mean Family Income | 5,409 | $123,932 |
| Median Household Income | 7,688 | $85,019 |
| Mean Household Income | 7,688 | $105,999 |
| Income Deficit | 5,409 | $0 |
| Wage / Income Gap (%) | 17,597 | 16.44% |
| Wage / Income Gap ($) | 17,597 | 83.56¢ per $1 |
| Gini / Inequality Index | 17,597 | 0.41 |
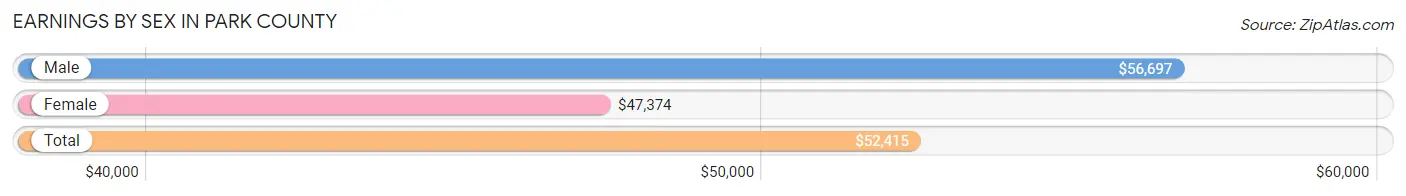
Earnings by Sex in Park County
Average Earnings in Park County are $52,415, $56,697 for men and $47,374 for women, a difference of 16.4%.
| Sex | Number | Average Earnings |
| Male | 5,399 (55.7%) | $56,697 |
| Female | 4,287 (44.3%) | $47,374 |
| Total | 9,686 (100.0%) | $52,415 |
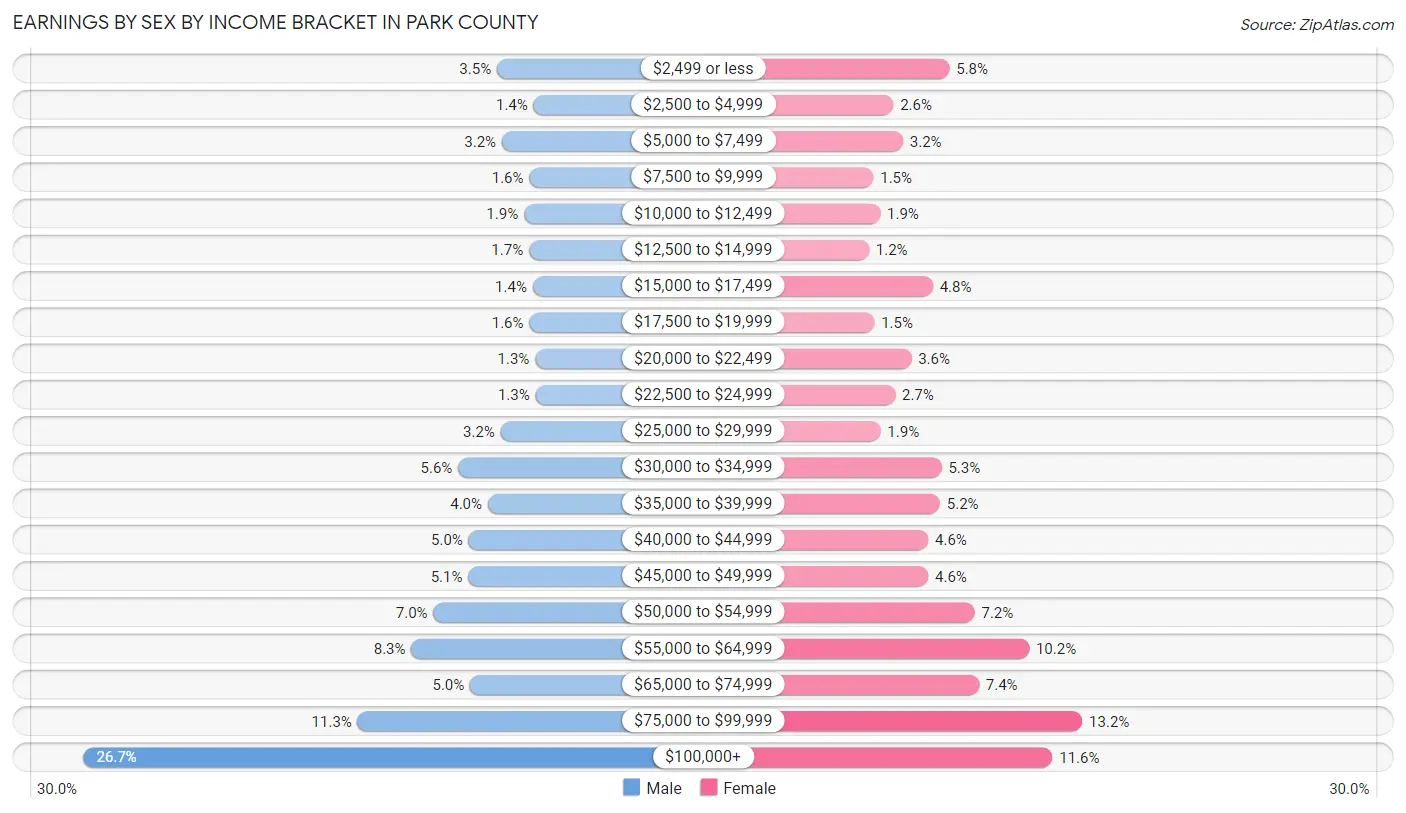
Earnings by Sex by Income Bracket in Park County
The most common earnings brackets in Park County are $100,000+ for men (1,441 | 26.7%) and $75,000 to $99,999 for women (567 | 13.2%).
| Income | Male | Female |
| $2,499 or less | 186 (3.5%) | 247 (5.8%) |
| $2,500 to $4,999 | 75 (1.4%) | 112 (2.6%) |
| $5,000 to $7,499 | 171 (3.2%) | 135 (3.2%) |
| $7,500 to $9,999 | 88 (1.6%) | 64 (1.5%) |
| $10,000 to $12,499 | 104 (1.9%) | 80 (1.9%) |
| $12,500 to $14,999 | 89 (1.7%) | 53 (1.2%) |
| $15,000 to $17,499 | 78 (1.4%) | 207 (4.8%) |
| $17,500 to $19,999 | 88 (1.6%) | 66 (1.5%) |
| $20,000 to $22,499 | 70 (1.3%) | 155 (3.6%) |
| $22,500 to $24,999 | 69 (1.3%) | 116 (2.7%) |
| $25,000 to $29,999 | 175 (3.2%) | 81 (1.9%) |
| $30,000 to $34,999 | 304 (5.6%) | 228 (5.3%) |
| $35,000 to $39,999 | 214 (4.0%) | 224 (5.2%) |
| $40,000 to $44,999 | 272 (5.0%) | 196 (4.6%) |
| $45,000 to $49,999 | 273 (5.1%) | 196 (4.6%) |
| $50,000 to $54,999 | 379 (7.0%) | 308 (7.2%) |
| $55,000 to $64,999 | 446 (8.3%) | 439 (10.2%) |
| $65,000 to $74,999 | 268 (5.0%) | 318 (7.4%) |
| $75,000 to $99,999 | 609 (11.3%) | 567 (13.2%) |
| $100,000+ | 1,441 (26.7%) | 495 (11.6%) |
| Total | 5,399 (100.0%) | 4,287 (100.0%) |
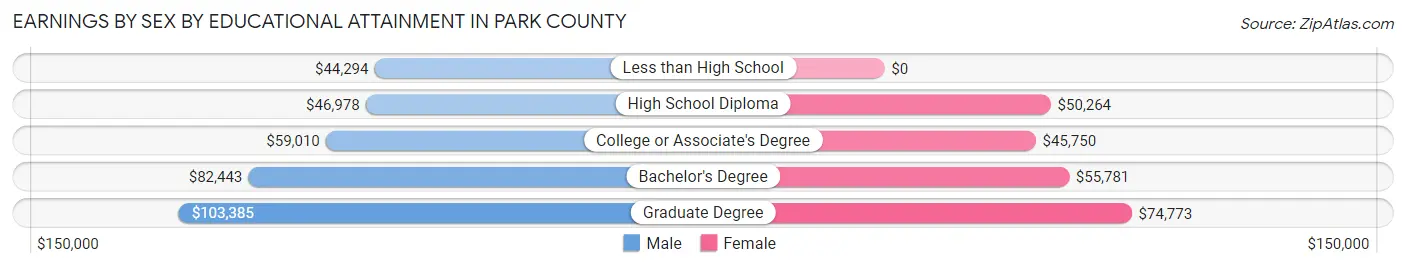
Earnings by Sex by Educational Attainment in Park County
Average earnings in Park County are $60,864 for men and $51,886 for women, a difference of 14.7%. Men with an educational attainment of graduate degree enjoy the highest average annual earnings of $103,385, while those with less than high school education earn the least with $44,294. Women with an educational attainment of graduate degree earn the most with the average annual earnings of $74,773, while those with college or associate's degree education have the smallest earnings of $45,750.
| Educational Attainment | Male Income | Female Income |
| Less than High School | $44,294 | $0 |
| High School Diploma | $46,978 | $50,264 |
| College or Associate's Degree | $59,010 | $45,750 |
| Bachelor's Degree | $82,443 | $55,781 |
| Graduate Degree | $103,385 | $74,773 |
| Total | $60,864 | $51,886 |
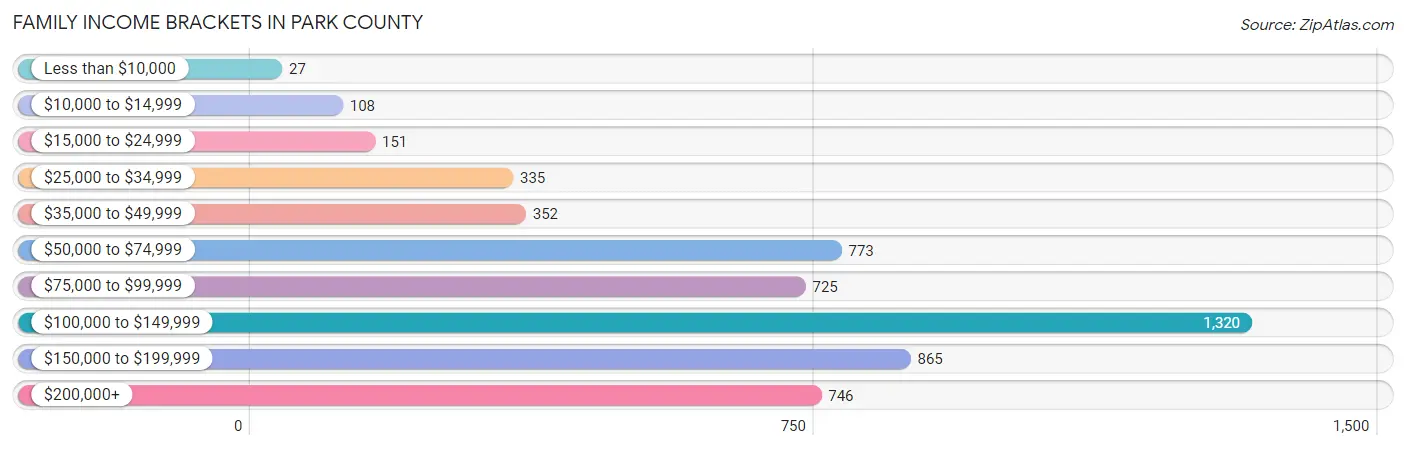
Family Income in Park County
Family Income Brackets in Park County
According to the Park County family income data, there are 1,320 families falling into the $100,000 to $149,999 income range, which is the most common income bracket and makes up 24.4% of all families. Conversely, the less than $10,000 income bracket is the least frequent group with only 27 families (0.5%) belonging to this category.
| Income Bracket | # Families | % Families |
| Less than $10,000 | 27 | 0.5% |
| $10,000 to $14,999 | 108 | 2.0% |
| $15,000 to $24,999 | 151 | 2.8% |
| $25,000 to $34,999 | 335 | 6.2% |
| $35,000 to $49,999 | 352 | 6.5% |
| $50,000 to $74,999 | 773 | 14.3% |
| $75,000 to $99,999 | 725 | 13.4% |
| $100,000 to $149,999 | 1,320 | 24.4% |
| $150,000 to $199,999 | 865 | 16.0% |
| $200,000+ | 746 | 13.8% |
Family Income by Famaliy Size in Park County
4-person families (731 | 13.5%) account for the highest median family income in Park County with $137,543 per family, while 2-person families (3,715 | 68.7%) have the highest median income of $47,046 per family member.
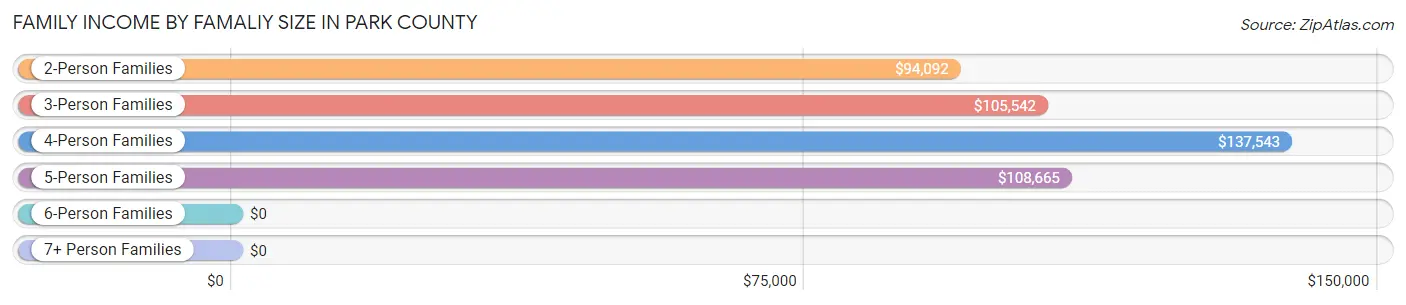
| Income Bracket | # Families | Median Income |
| 2-Person Families | 3,715 (68.7%) | $94,092 |
| 3-Person Families | 741 (13.7%) | $105,542 |
| 4-Person Families | 731 (13.5%) | $137,543 |
| 5-Person Families | 179 (3.3%) | $108,665 |
| 6-Person Families | 22 (0.4%) | $0 |
| 7+ Person Families | 21 (0.4%) | $0 |
| Total | 5,409 (100.0%) | $107,599 |
Family Income by Number of Earners in Park County
The median family income in Park County is $107,599, with families comprising 3+ earners (337) having the highest median family income of $206,078, while families with no earners (1,220) have the lowest median family income of $68,659, accounting for 6.2% and 22.6% of families, respectively.
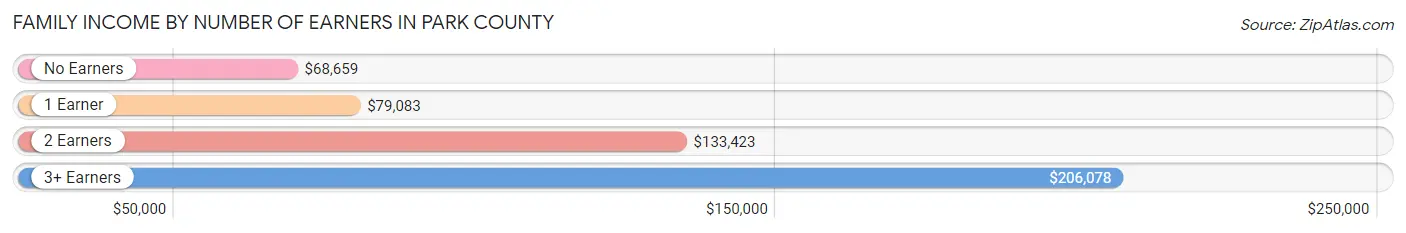
| Number of Earners | # Families | Median Income |
| No Earners | 1,220 (22.6%) | $68,659 |
| 1 Earner | 1,461 (27.0%) | $79,083 |
| 2 Earners | 2,391 (44.2%) | $133,423 |
| 3+ Earners | 337 (6.2%) | $206,078 |
| Total | 5,409 (100.0%) | $107,599 |
Household Income in Park County
Household Income Brackets in Park County
With 1,622 households falling in the category, the $100,000 to $149,999 income range is the most frequent in Park County, accounting for 21.1% of all households. In contrast, only 123 households (1.6%) fall into the less than $10,000 income bracket, making it the least populous group.
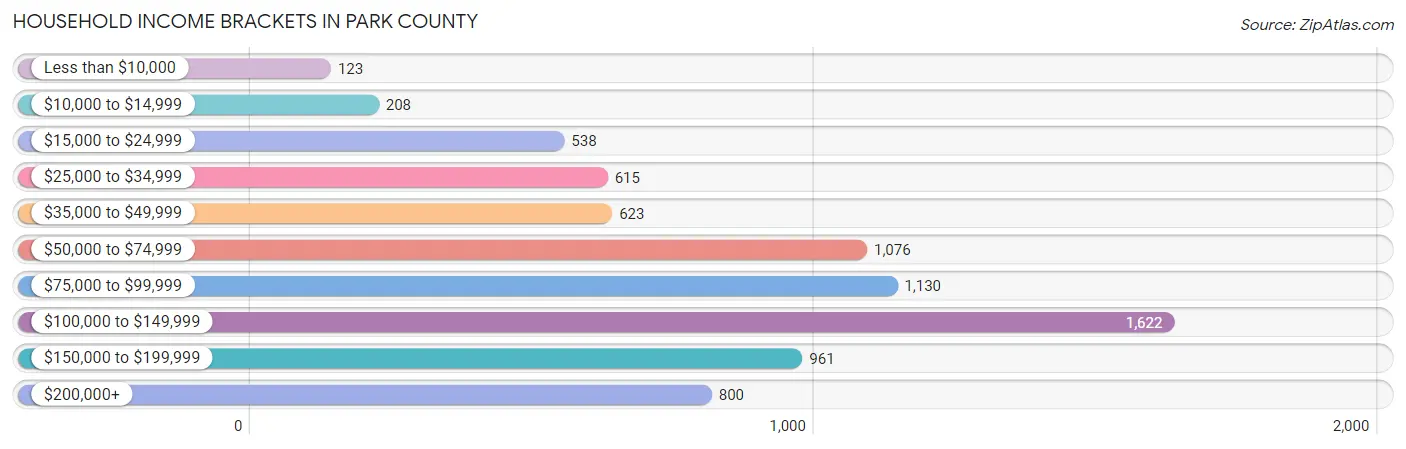
| Income Bracket | # Households | % Households |
| Less than $10,000 | 123 | 1.6% |
| $10,000 to $14,999 | 208 | 2.7% |
| $15,000 to $24,999 | 538 | 7.0% |
| $25,000 to $34,999 | 615 | 8.0% |
| $35,000 to $49,999 | 623 | 8.1% |
| $50,000 to $74,999 | 1,076 | 14.0% |
| $75,000 to $99,999 | 1,130 | 14.7% |
| $100,000 to $149,999 | 1,622 | 21.1% |
| $150,000 to $199,999 | 961 | 12.5% |
| $200,000+ | 800 | 10.4% |
Household Income by Householder Age in Park County
The median household income in Park County is $85,019, with the highest median household income of $106,116 found in the 25 to 44 years age bracket for the primary householder. A total of 1,688 households (22.0%) fall into this category. Meanwhile, the 15 to 24 years age bracket for the primary householder has the lowest median household income of $0, with 171 households (2.2%) in this group.
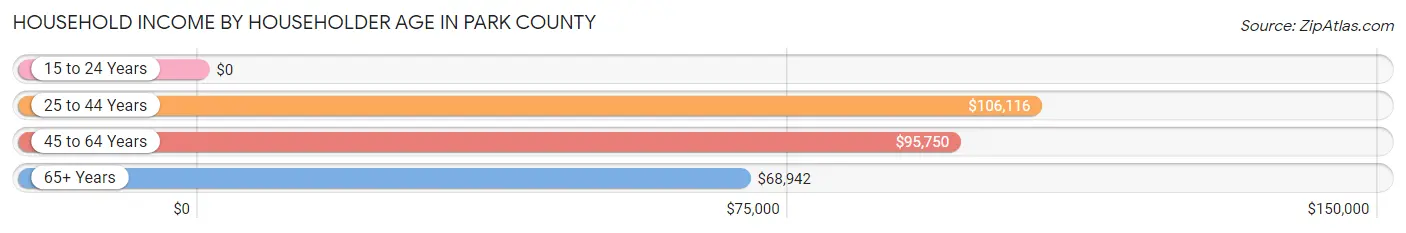
| Income Bracket | # Households | Median Income |
| 15 to 24 Years | 171 (2.2%) | $0 |
| 25 to 44 Years | 1,688 (22.0%) | $106,116 |
| 45 to 64 Years | 3,635 (47.3%) | $95,750 |
| 65+ Years | 2,194 (28.5%) | $68,942 |
| Total | 7,688 (100.0%) | $85,019 |
Poverty in Park County
Income Below Poverty by Sex and Age in Park County
With 7.6% poverty level for males and 5.9% for females among the residents of Park County, 15 year old males and 5 year old females are the most vulnerable to poverty, with 62 males (40.8%) and 34 females (75.6%) in their respective age groups living below the poverty level.
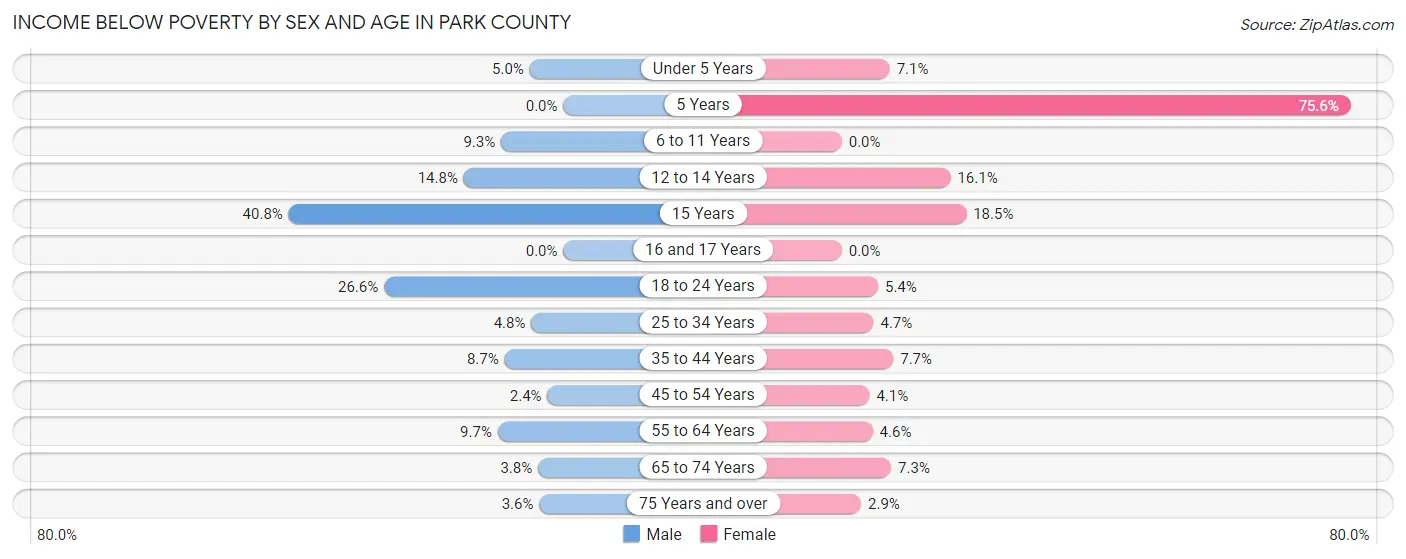
| Age Bracket | Male | Female |
| Under 5 Years | 14 (5.0%) | 19 (7.1%) |
| 5 Years | 0 (0.0%) | 34 (75.6%) |
| 6 to 11 Years | 47 (9.2%) | 0 (0.0%) |
| 12 to 14 Years | 21 (14.8%) | 36 (16.1%) |
| 15 Years | 62 (40.8%) | 17 (18.5%) |
| 16 and 17 Years | 0 (0.0%) | 0 (0.0%) |
| 18 to 24 Years | 111 (26.6%) | 19 (5.4%) |
| 25 to 34 Years | 44 (4.8%) | 34 (4.7%) |
| 35 to 44 Years | 107 (8.7%) | 81 (7.6%) |
| 45 to 54 Years | 32 (2.4%) | 50 (4.1%) |
| 55 to 64 Years | 189 (9.7%) | 83 (4.6%) |
| 65 to 74 Years | 58 (3.7%) | 93 (7.3%) |
| 75 Years and over | 20 (3.6%) | 14 (2.9%) |
| Total | 705 (7.6%) | 480 (5.9%) |
Income Above Poverty by Sex and Age in Park County
According to the poverty statistics in Park County, males aged 5 years and females aged 6 to 11 years are the age groups that are most secure financially, with 100.0% of males and 100.0% of females in these age groups living above the poverty line.
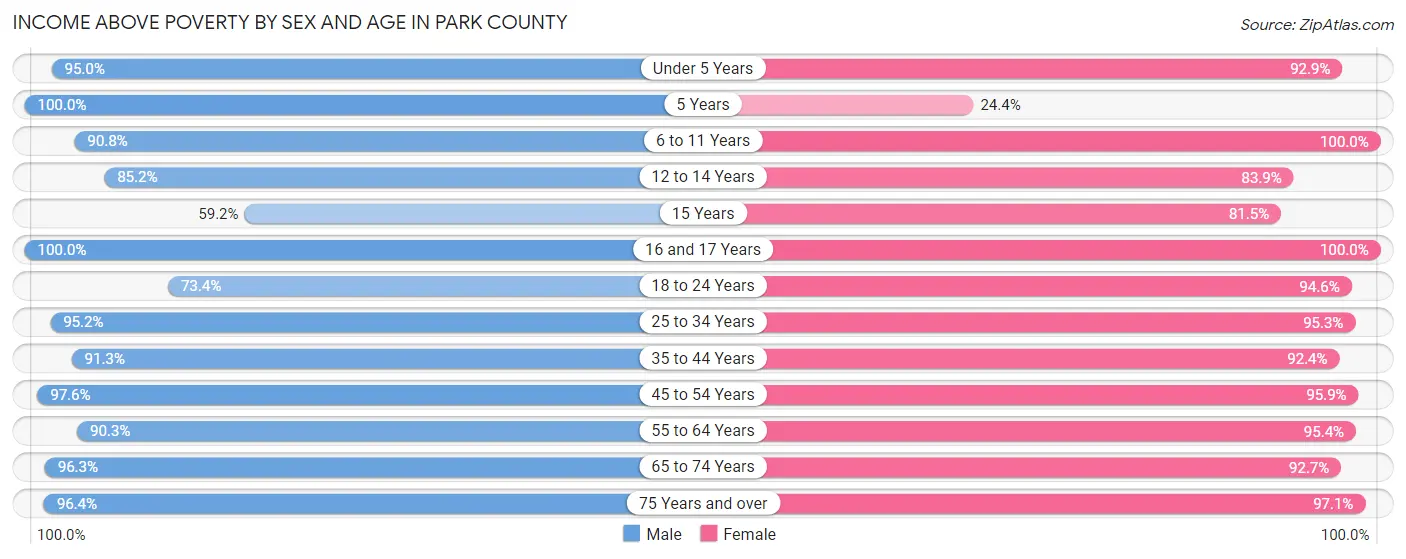
| Age Bracket | Male | Female |
| Under 5 Years | 266 (95.0%) | 248 (92.9%) |
| 5 Years | 57 (100.0%) | 11 (24.4%) |
| 6 to 11 Years | 461 (90.7%) | 456 (100.0%) |
| 12 to 14 Years | 121 (85.2%) | 187 (83.9%) |
| 15 Years | 90 (59.2%) | 75 (81.5%) |
| 16 and 17 Years | 190 (100.0%) | 119 (100.0%) |
| 18 to 24 Years | 306 (73.4%) | 334 (94.6%) |
| 25 to 34 Years | 881 (95.2%) | 688 (95.3%) |
| 35 to 44 Years | 1,119 (91.3%) | 978 (92.3%) |
| 45 to 54 Years | 1,324 (97.6%) | 1,166 (95.9%) |
| 55 to 64 Years | 1,751 (90.3%) | 1,731 (95.4%) |
| 65 to 74 Years | 1,487 (96.3%) | 1,175 (92.7%) |
| 75 Years and over | 541 (96.4%) | 475 (97.1%) |
| Total | 8,594 (92.4%) | 7,643 (94.1%) |
Income Below Poverty Among Married-Couple Families in Park County
The poverty statistics for married-couple families in Park County show that 1.9% or 95 of the total 4,935 families live below the poverty line. Families with 3 or 4 children have the highest poverty rate of 30.3%, comprising of 44 families. On the other hand, families with 1 or 2 children have the lowest poverty rate of 0.0%, which includes 0 families.
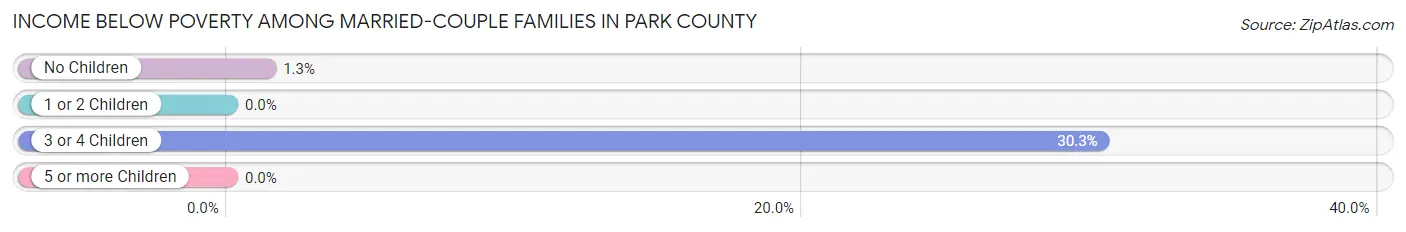
| Children | Above Poverty | Below Poverty |
| No Children | 3,771 (98.7%) | 51 (1.3%) |
| 1 or 2 Children | 968 (100.0%) | 0 (0.0%) |
| 3 or 4 Children | 101 (69.7%) | 44 (30.3%) |
| 5 or more Children | 0 (0.0%) | 0 (0.0%) |
| Total | 4,840 (98.1%) | 95 (1.9%) |
Income Below Poverty Among Single-Parent Households in Park County
According to the poverty data in Park County, 6.7% or 14 single-father households and 16.2% or 43 single-mother households are living below the poverty line. Among single-father households, those with 1 or 2 children have the highest poverty rate, with 14 households (11.0%) experiencing poverty. Likewise, among single-mother households, those with 1 or 2 children have the highest poverty rate, with 37 households (29.8%) falling below the poverty line.
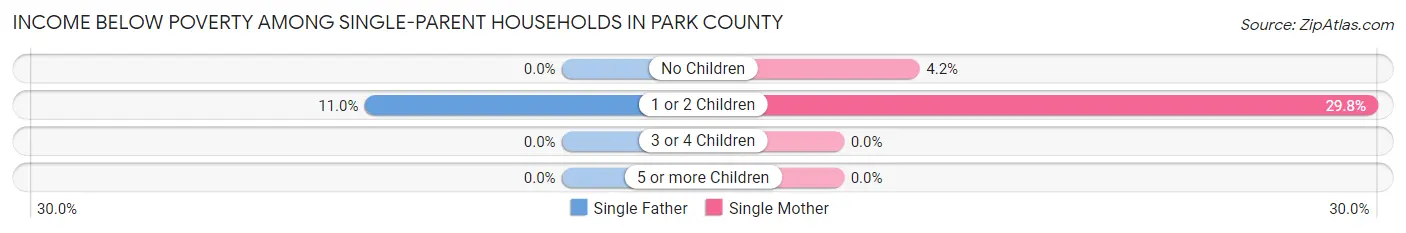
| Children | Single Father | Single Mother |
| No Children | 0 (0.0%) | 6 (4.2%) |
| 1 or 2 Children | 14 (11.0%) | 37 (29.8%) |
| 3 or 4 Children | 0 (0.0%) | 0 (0.0%) |
| 5 or more Children | 0 (0.0%) | 0 (0.0%) |
| Total | 14 (6.7%) | 43 (16.2%) |
Income Below Poverty Among Married-Couple vs Single-Parent Households in Park County
The poverty data for Park County shows that 95 of the married-couple family households (1.9%) and 57 of the single-parent households (12.0%) are living below the poverty level. Within the married-couple family households, those with 3 or 4 children have the highest poverty rate, with 44 households (30.3%) falling below the poverty line. Among the single-parent households, those with 1 or 2 children have the highest poverty rate, with 51 household (20.3%) living below poverty.
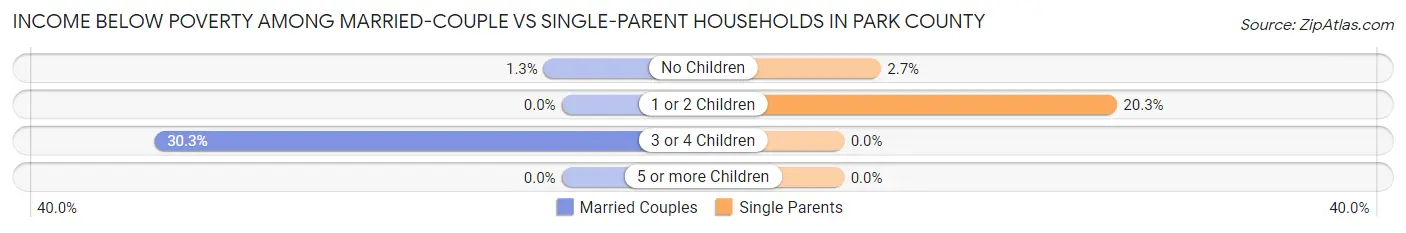
| Children | Married-Couple Families | Single-Parent Households |
| No Children | 51 (1.3%) | 6 (2.7%) |
| 1 or 2 Children | 0 (0.0%) | 51 (20.3%) |
| 3 or 4 Children | 44 (30.3%) | 0 (0.0%) |
| 5 or more Children | 0 (0.0%) | 0 (0.0%) |
| Total | 95 (1.9%) | 57 (12.0%) |
Employment Characteristics in Park County
Employment by Class of Employer in Park County
Among the 8,580 employed individuals in Park County, private company employees (5,084 | 59.3%), local government employees (977 | 11.4%), and self-employed (not incorporated) (972 | 11.3%) make up the most common classes of employment.
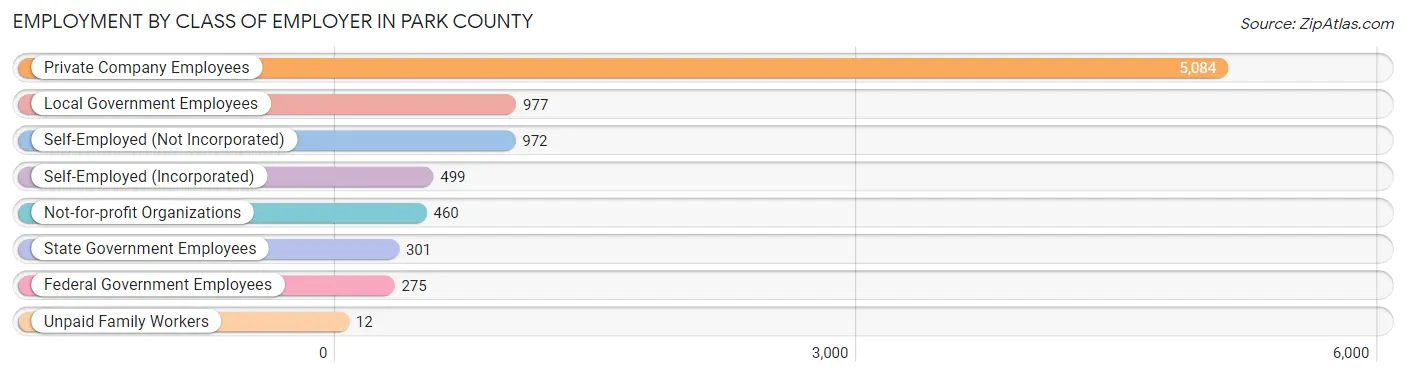
| Employer Class | # Employees | % Employees |
| Private Company Employees | 5,084 | 59.3% |
| Self-Employed (Incorporated) | 499 | 5.8% |
| Self-Employed (Not Incorporated) | 972 | 11.3% |
| Not-for-profit Organizations | 460 | 5.4% |
| Local Government Employees | 977 | 11.4% |
| State Government Employees | 301 | 3.5% |
| Federal Government Employees | 275 | 3.2% |
| Unpaid Family Workers | 12 | 0.1% |
| Total | 8,580 | 100.0% |
Employment Status by Age in Park County
According to the labor force statistics for Park County, out of the total population over 16 years of age (15,294), 58.8% or 8,993 individuals are in the labor force, with 3.9% or 351 of them unemployed. The age group with the highest labor force participation rate is 25 to 29 years, with 91.0% or 729 individuals in the labor force. Within the labor force, the 16 to 19 years age range has the highest percentage of unemployed individuals, with 15.4% or 37 of them being unemployed.
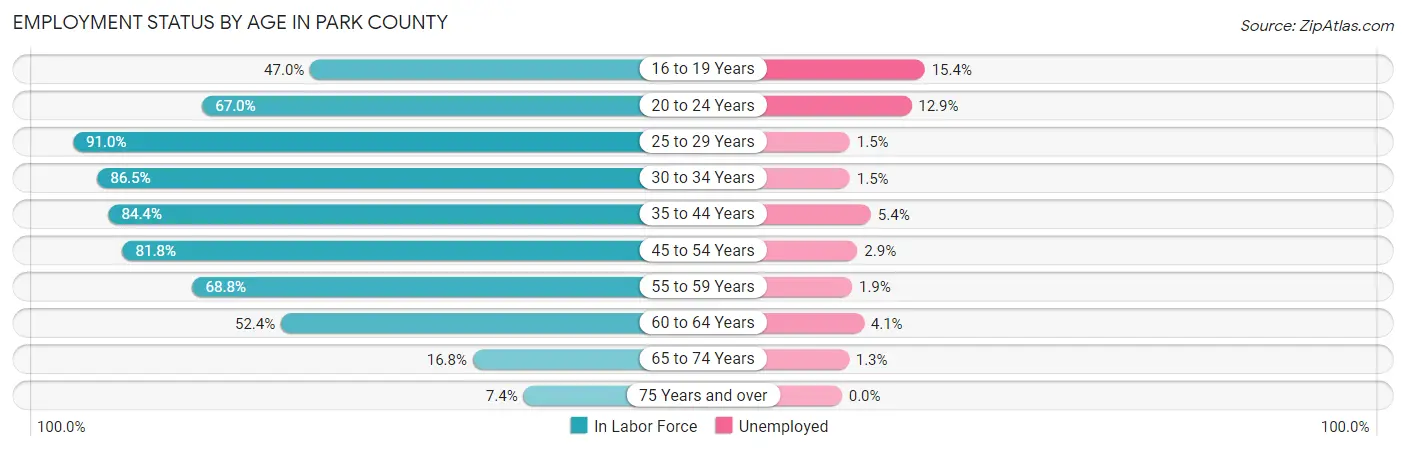
| Age Bracket | In Labor Force | Unemployed |
| 16 to 19 Years | 240 (47.0%) | 37 (15.4%) |
| 20 to 24 Years | 404 (67.0%) | 52 (12.9%) |
| 25 to 29 Years | 729 (91.0%) | 11 (1.5%) |
| 30 to 34 Years | 750 (86.5%) | 11 (1.5%) |
| 35 to 44 Years | 1,952 (84.4%) | 105 (5.4%) |
| 45 to 54 Years | 2,112 (81.8%) | 61 (2.9%) |
| 55 to 59 Years | 1,241 (68.8%) | 24 (1.9%) |
| 60 to 64 Years | 1,022 (52.4%) | 42 (4.1%) |
| 65 to 74 Years | 473 (16.8%) | 6 (1.3%) |
| 75 Years and over | 78 (7.4%) | 0 (0.0%) |
| Total | 8,993 (58.8%) | 351 (3.9%) |
Employment Status by Educational Attainment in Park County
According to labor force statistics for Park County, 75.7% of individuals (7,810) out of the total population between 25 and 64 years of age (10,317) are in the labor force, with 3.3% or 258 of them being unemployed. The group with the highest labor force participation rate are those with the educational attainment of bachelor's degree or higher, with 81.6% or 2,818 individuals in the labor force. Within the labor force, individuals with college / associate degree education have the highest percentage of unemployment, with 6.5% or 197 of them being unemployed.
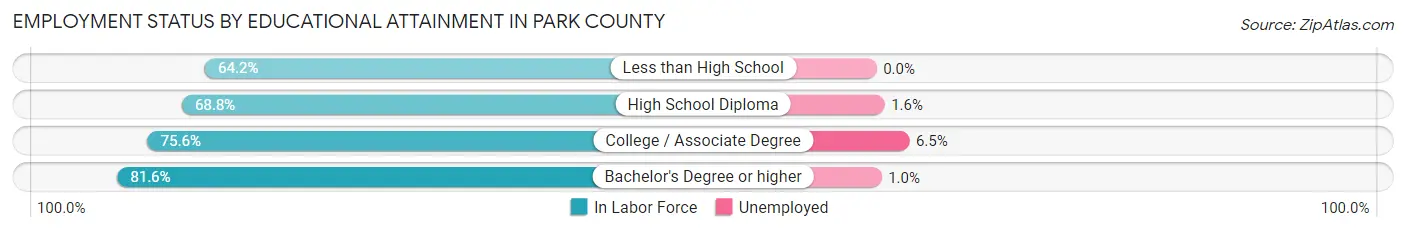
| Educational Attainment | In Labor Force | Unemployed |
| Less than High School | 140 (64.2%) | 0 (0.0%) |
| High School Diploma | 1,818 (68.8%) | 42 (1.6%) |
| College / Associate Degree | 3,026 (75.6%) | 260 (6.5%) |
| Bachelor's Degree or higher | 2,818 (81.6%) | 35 (1.0%) |
| Total | 7,810 (75.7%) | 340 (3.3%) |
Employment Occupations by Sex in Park County
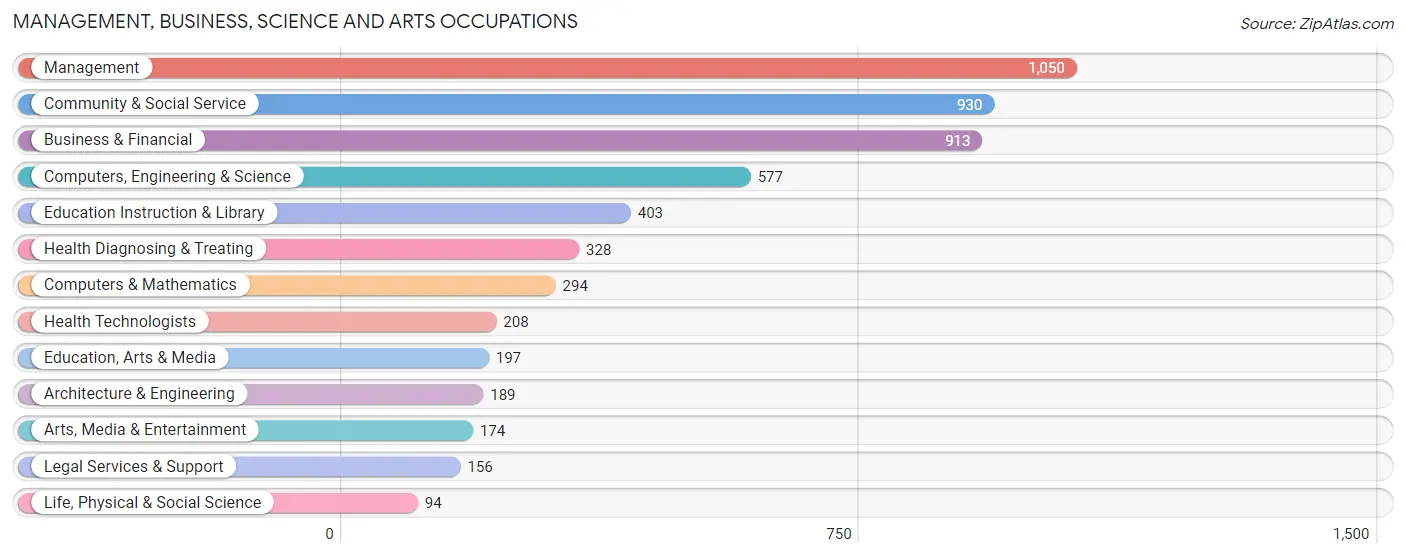
Management, Business, Science and Arts Occupations
The most common Management, Business, Science and Arts occupations in Park County are Management (1,050 | 12.1%), Community & Social Service (930 | 10.7%), Business & Financial (913 | 10.5%), Computers, Engineering & Science (577 | 6.7%), and Education Instruction & Library (403 | 4.7%).
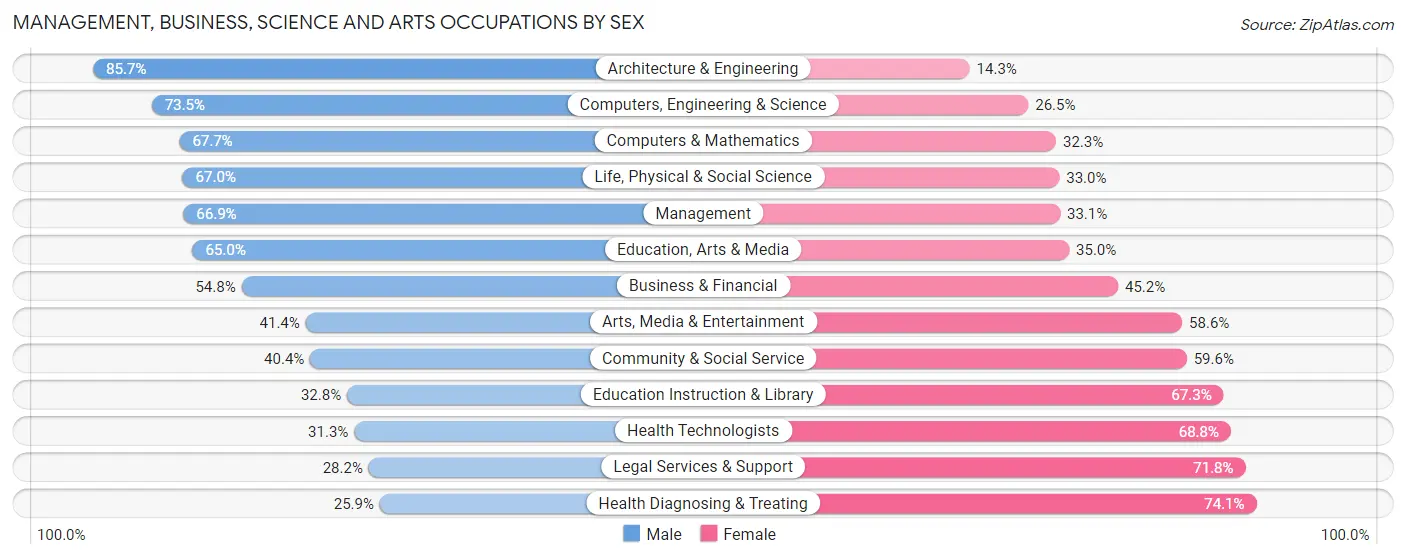
Management, Business, Science and Arts Occupations by Sex
Within the Management, Business, Science and Arts occupations in Park County, the most male-oriented occupations are Architecture & Engineering (85.7%), Computers, Engineering & Science (73.5%), and Computers & Mathematics (67.7%), while the most female-oriented occupations are Health Diagnosing & Treating (74.1%), Legal Services & Support (71.8%), and Health Technologists (68.8%).
| Occupation | Male | Female |
| Management | 702 (66.9%) | 348 (33.1%) |
| Business & Financial | 500 (54.8%) | 413 (45.2%) |
| Computers, Engineering & Science | 424 (73.5%) | 153 (26.5%) |
| Computers & Mathematics | 199 (67.7%) | 95 (32.3%) |
| Architecture & Engineering | 162 (85.7%) | 27 (14.3%) |
| Life, Physical & Social Science | 63 (67.0%) | 31 (33.0%) |
| Community & Social Service | 376 (40.4%) | 554 (59.6%) |
| Education, Arts & Media | 128 (65.0%) | 69 (35.0%) |
| Legal Services & Support | 44 (28.2%) | 112 (71.8%) |
| Education Instruction & Library | 132 (32.8%) | 271 (67.2%) |
| Arts, Media & Entertainment | 72 (41.4%) | 102 (58.6%) |
| Health Diagnosing & Treating | 85 (25.9%) | 243 (74.1%) |
| Health Technologists | 65 (31.2%) | 143 (68.8%) |
| Total (Category) | 2,087 (54.9%) | 1,711 (45.1%) |
| Total (Overall) | 4,648 (53.7%) | 4,003 (46.3%) |
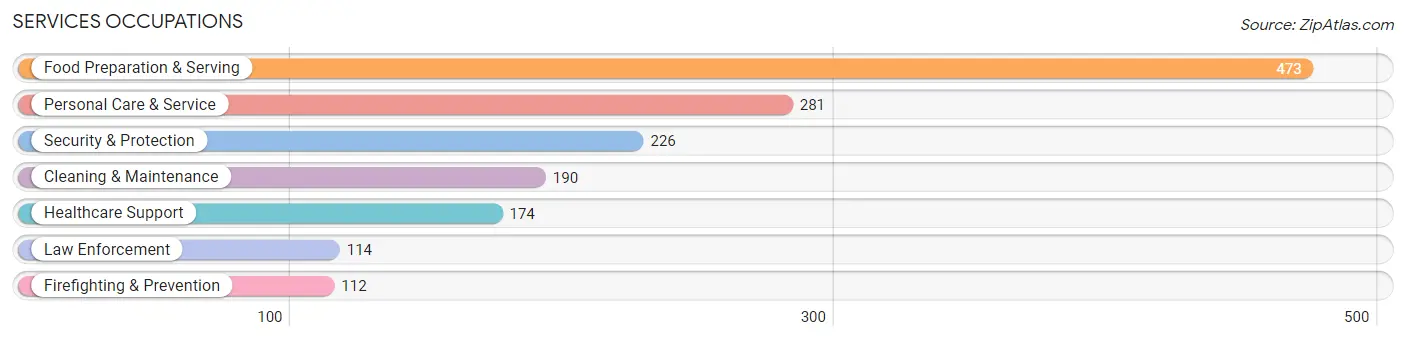
Services Occupations
The most common Services occupations in Park County are Food Preparation & Serving (473 | 5.5%), Personal Care & Service (281 | 3.3%), Security & Protection (226 | 2.6%), Cleaning & Maintenance (190 | 2.2%), and Healthcare Support (174 | 2.0%).
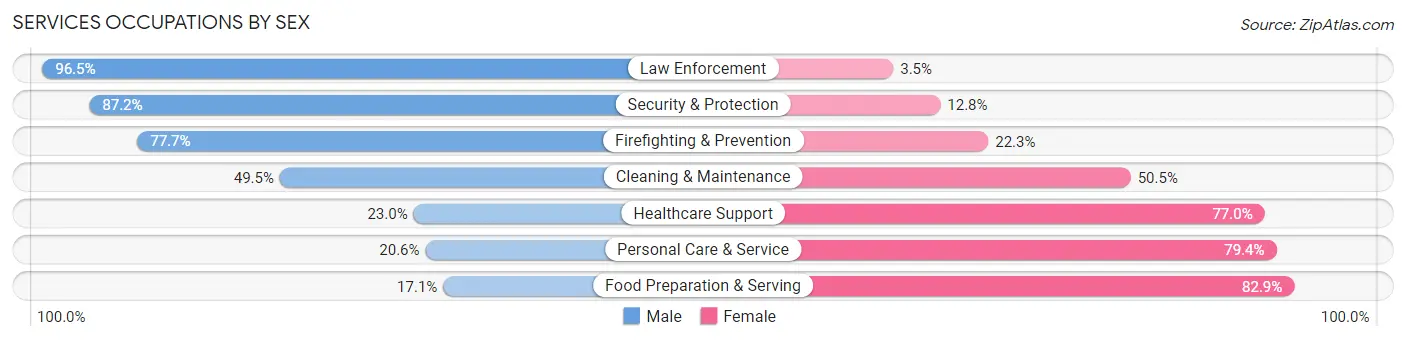
Services Occupations by Sex
Within the Services occupations in Park County, the most male-oriented occupations are Law Enforcement (96.5%), Security & Protection (87.2%), and Firefighting & Prevention (77.7%), while the most female-oriented occupations are Food Preparation & Serving (82.9%), Personal Care & Service (79.4%), and Healthcare Support (77.0%).
| Occupation | Male | Female |
| Healthcare Support | 40 (23.0%) | 134 (77.0%) |
| Security & Protection | 197 (87.2%) | 29 (12.8%) |
| Firefighting & Prevention | 87 (77.7%) | 25 (22.3%) |
| Law Enforcement | 110 (96.5%) | 4 (3.5%) |
| Food Preparation & Serving | 81 (17.1%) | 392 (82.9%) |
| Cleaning & Maintenance | 94 (49.5%) | 96 (50.5%) |
| Personal Care & Service | 58 (20.6%) | 223 (79.4%) |
| Total (Category) | 470 (35.0%) | 874 (65.0%) |
| Total (Overall) | 4,648 (53.7%) | 4,003 (46.3%) |
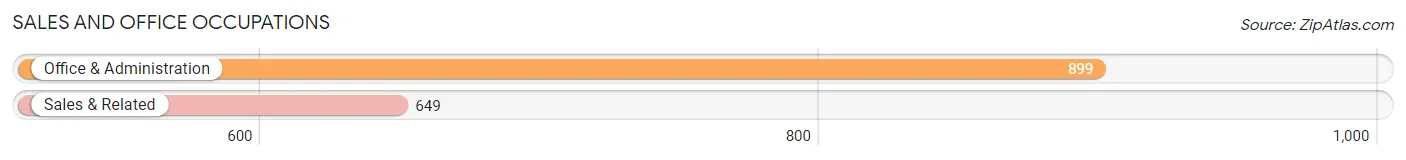
Sales and Office Occupations
The most common Sales and Office occupations in Park County are Office & Administration (899 | 10.4%), and Sales & Related (649 | 7.5%).
Sales and Office Occupations by Sex
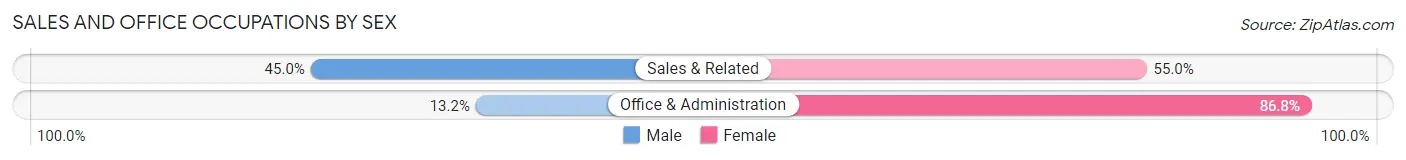
| Occupation | Male | Female |
| Sales & Related | 292 (45.0%) | 357 (55.0%) |
| Office & Administration | 119 (13.2%) | 780 (86.8%) |
| Total (Category) | 411 (26.6%) | 1,137 (73.5%) |
| Total (Overall) | 4,648 (53.7%) | 4,003 (46.3%) |
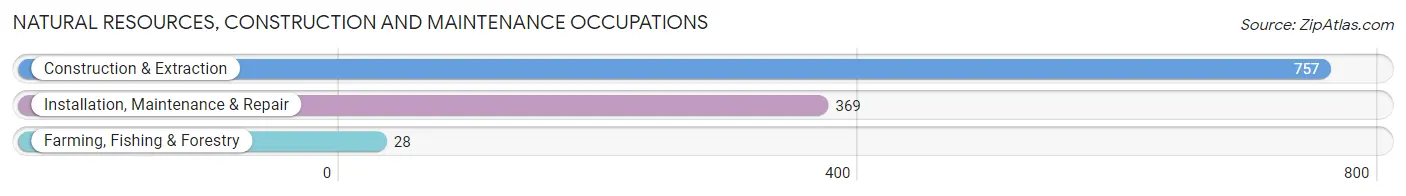
Natural Resources, Construction and Maintenance Occupations
The most common Natural Resources, Construction and Maintenance occupations in Park County are Construction & Extraction (757 | 8.7%), Installation, Maintenance & Repair (369 | 4.3%), and Farming, Fishing & Forestry (28 | 0.3%).
Natural Resources, Construction and Maintenance Occupations by Sex
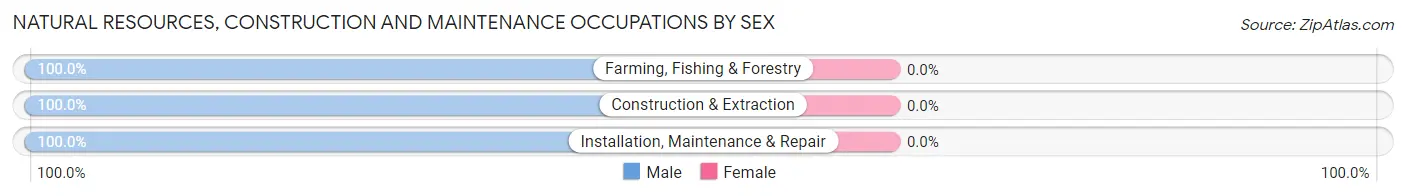
| Occupation | Male | Female |
| Farming, Fishing & Forestry | 28 (100.0%) | 0 (0.0%) |
| Construction & Extraction | 757 (100.0%) | 0 (0.0%) |
| Installation, Maintenance & Repair | 369 (100.0%) | 0 (0.0%) |
| Total (Category) | 1,154 (100.0%) | 0 (0.0%) |
| Total (Overall) | 4,648 (53.7%) | 4,003 (46.3%) |
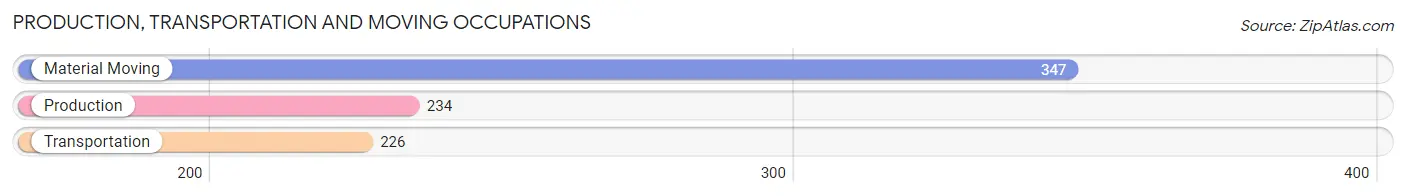
Production, Transportation and Moving Occupations
The most common Production, Transportation and Moving occupations in Park County are Material Moving (347 | 4.0%), Production (234 | 2.7%), and Transportation (226 | 2.6%).
Production, Transportation and Moving Occupations by Sex
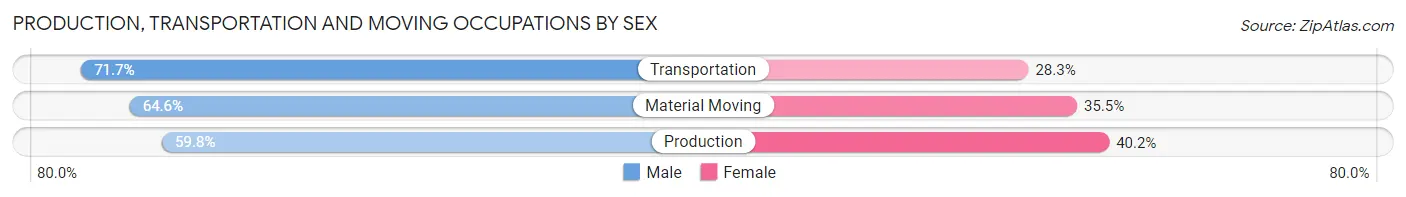
| Occupation | Male | Female |
| Production | 140 (59.8%) | 94 (40.2%) |
| Transportation | 162 (71.7%) | 64 (28.3%) |
| Material Moving | 224 (64.5%) | 123 (35.4%) |
| Total (Category) | 526 (65.2%) | 281 (34.8%) |
| Total (Overall) | 4,648 (53.7%) | 4,003 (46.3%) |
Employment Industries by Sex in Park County
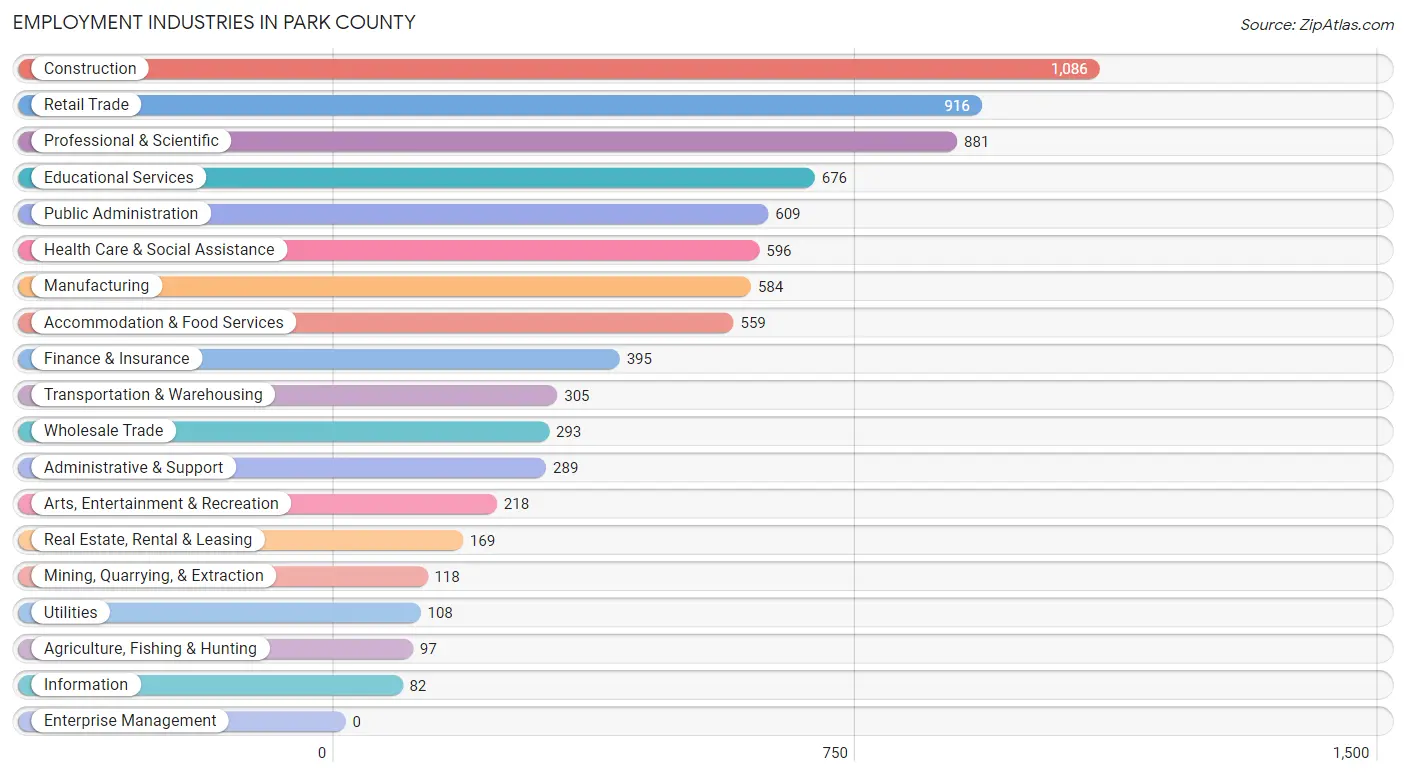
Employment Industries in Park County
The major employment industries in Park County include Construction (1,086 | 12.6%), Retail Trade (916 | 10.6%), Professional & Scientific (881 | 10.2%), Educational Services (676 | 7.8%), and Public Administration (609 | 7.0%).
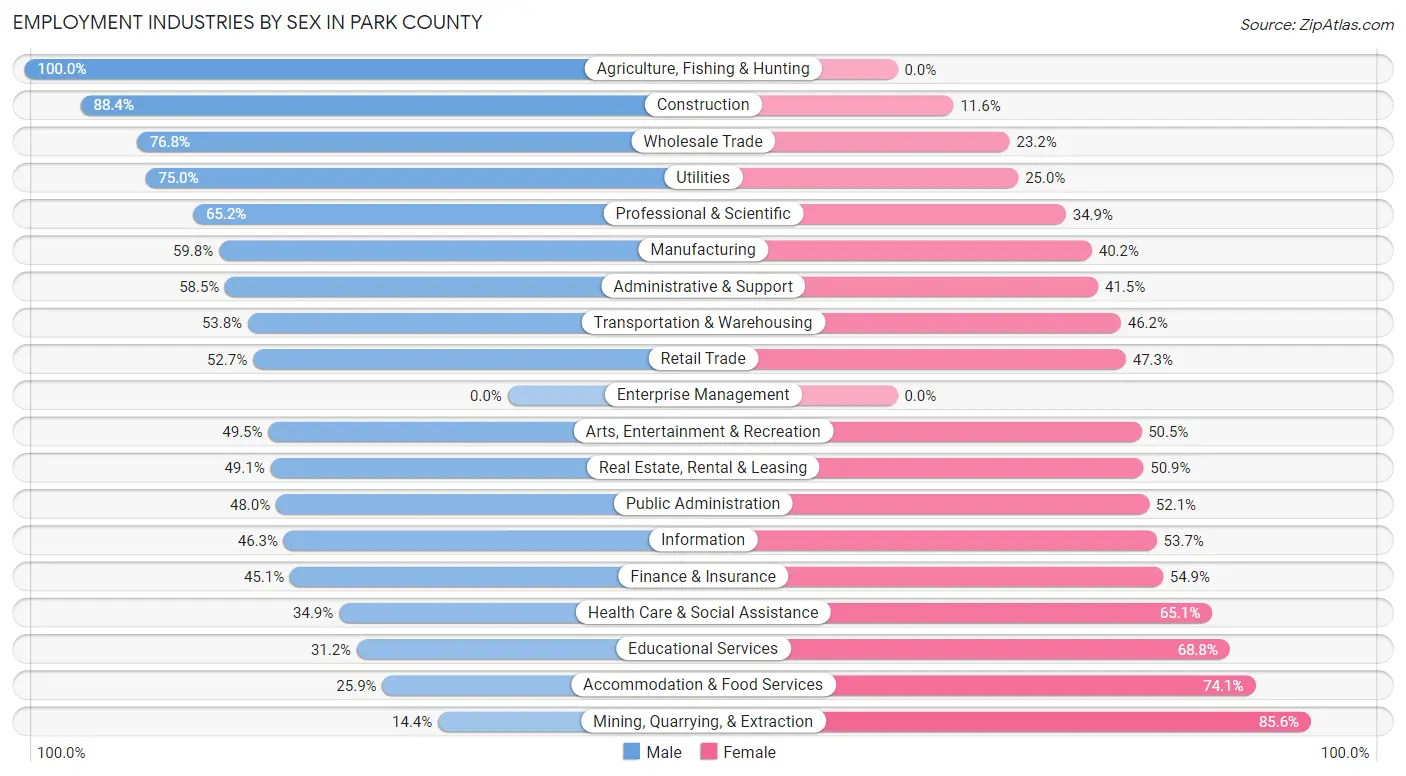
Employment Industries by Sex in Park County
The Park County industries that see more men than women are Agriculture, Fishing & Hunting (100.0%), Construction (88.4%), and Wholesale Trade (76.8%), whereas the industries that tend to have a higher number of women are Mining, Quarrying, & Extraction (85.6%), Accommodation & Food Services (74.1%), and Educational Services (68.8%).
| Industry | Male | Female |
| Agriculture, Fishing & Hunting | 97 (100.0%) | 0 (0.0%) |
| Mining, Quarrying, & Extraction | 17 (14.4%) | 101 (85.6%) |
| Construction | 960 (88.4%) | 126 (11.6%) |
| Manufacturing | 349 (59.8%) | 235 (40.2%) |
| Wholesale Trade | 225 (76.8%) | 68 (23.2%) |
| Retail Trade | 483 (52.7%) | 433 (47.3%) |
| Transportation & Warehousing | 164 (53.8%) | 141 (46.2%) |
| Utilities | 81 (75.0%) | 27 (25.0%) |
| Information | 38 (46.3%) | 44 (53.7%) |
| Finance & Insurance | 178 (45.1%) | 217 (54.9%) |
| Real Estate, Rental & Leasing | 83 (49.1%) | 86 (50.9%) |
| Professional & Scientific | 574 (65.1%) | 307 (34.8%) |
| Enterprise Management | 0 (0.0%) | 0 (0.0%) |
| Administrative & Support | 169 (58.5%) | 120 (41.5%) |
| Educational Services | 211 (31.2%) | 465 (68.8%) |
| Health Care & Social Assistance | 208 (34.9%) | 388 (65.1%) |
| Arts, Entertainment & Recreation | 108 (49.5%) | 110 (50.5%) |
| Accommodation & Food Services | 145 (25.9%) | 414 (74.1%) |
| Public Administration | 292 (47.9%) | 317 (52.0%) |
| Total | 4,648 (53.7%) | 4,003 (46.3%) |
Education in Park County
School Enrollment in Park County
The most common levels of schooling among the 2,427 students in Park County are middle school (813 | 33.5%), high school (643 | 26.5%), and elementary school (443 | 18.2%).
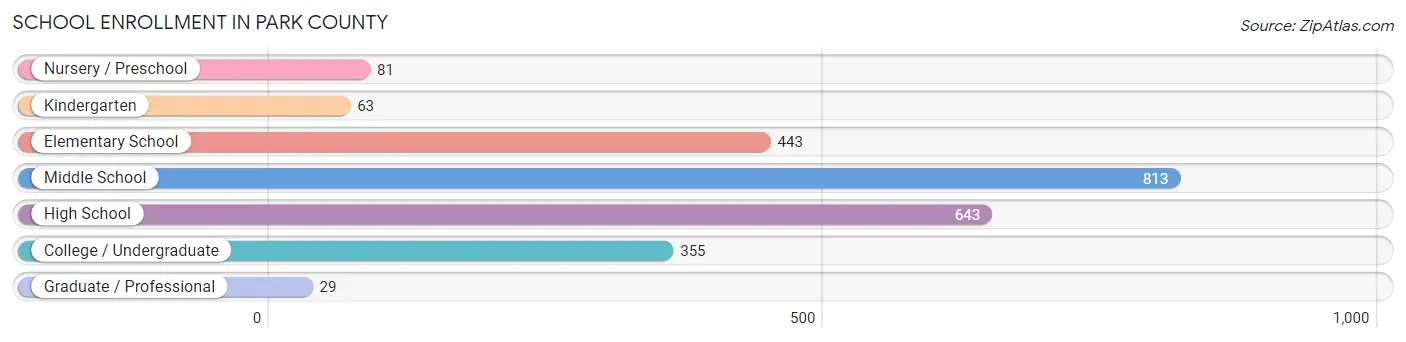
| School Level | # Students | % Students |
| Nursery / Preschool | 81 | 3.3% |
| Kindergarten | 63 | 2.6% |
| Elementary School | 443 | 18.2% |
| Middle School | 813 | 33.5% |
| High School | 643 | 26.5% |
| College / Undergraduate | 355 | 14.6% |
| Graduate / Professional | 29 | 1.2% |
| Total | 2,427 | 100.0% |
School Enrollment by Age by Funding Source in Park County
Out of a total of 2,427 students who are enrolled in schools in Park County, 269 (11.1%) attend a private institution, while the remaining 2,158 (88.9%) are enrolled in public schools. The age group of 35 years and over has the highest likelihood of being enrolled in private schools, with 23 (27.4% in the age bracket) enrolled. Conversely, the age group of 3 to 4 year olds has the lowest likelihood of being enrolled in a private school, with 55 (100.0% in the age bracket) attending a public institution.
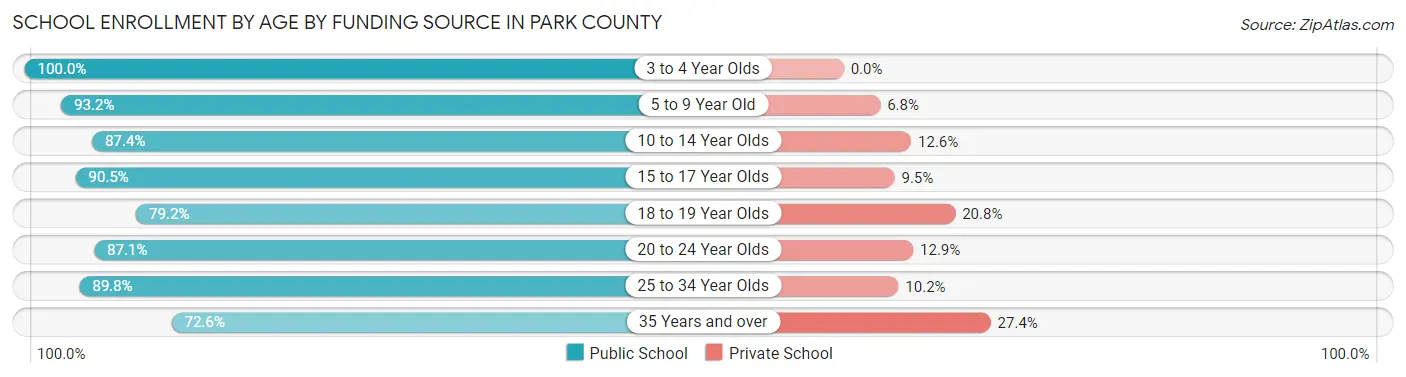
| Age Bracket | Public School | Private School |
| 3 to 4 Year Olds | 55 (100.0%) | 0 (0.0%) |
| 5 to 9 Year Old | 466 (93.2%) | 34 (6.8%) |
| 10 to 14 Year Olds | 773 (87.4%) | 111 (12.6%) |
| 15 to 17 Year Olds | 497 (90.5%) | 52 (9.5%) |
| 18 to 19 Year Olds | 61 (79.2%) | 16 (20.8%) |
| 20 to 24 Year Olds | 148 (87.1%) | 22 (12.9%) |
| 25 to 34 Year Olds | 97 (89.8%) | 11 (10.2%) |
| 35 Years and over | 61 (72.6%) | 23 (27.4%) |
| Total | 2,158 (88.9%) | 269 (11.1%) |
Educational Attainment by Field of Study in Park County
Business (1,021 | 18.5%), social sciences (497 | 9.0%), education (497 | 9.0%), psychology (483 | 8.7%), and bio, nature & agricultural (474 | 8.6%) are the most common fields of study among 5,530 individuals in Park County who have obtained a bachelor's degree or higher.
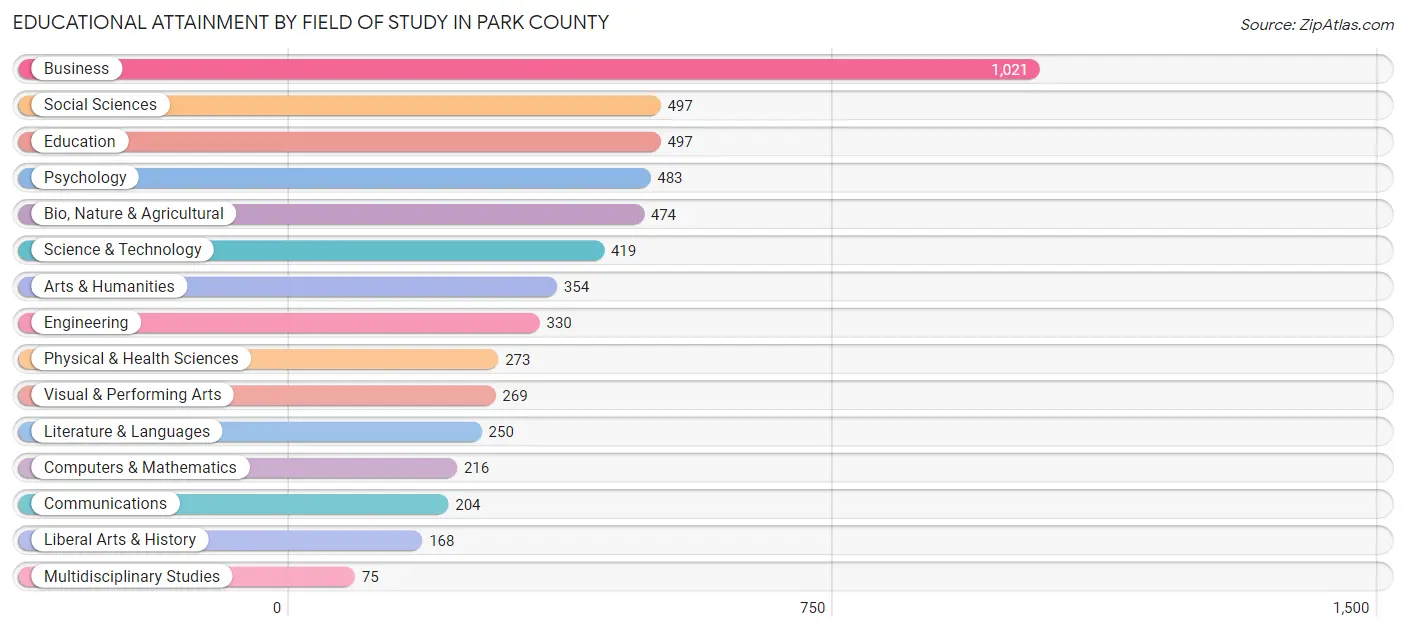
| Field of Study | # Graduates | % Graduates |
| Computers & Mathematics | 216 | 3.9% |
| Bio, Nature & Agricultural | 474 | 8.6% |
| Physical & Health Sciences | 273 | 4.9% |
| Psychology | 483 | 8.7% |
| Social Sciences | 497 | 9.0% |
| Engineering | 330 | 6.0% |
| Multidisciplinary Studies | 75 | 1.4% |
| Science & Technology | 419 | 7.6% |
| Business | 1,021 | 18.5% |
| Education | 497 | 9.0% |
| Literature & Languages | 250 | 4.5% |
| Liberal Arts & History | 168 | 3.0% |
| Visual & Performing Arts | 269 | 4.9% |
| Communications | 204 | 3.7% |
| Arts & Humanities | 354 | 6.4% |
| Total | 5,530 | 100.0% |
Transportation & Commute in Park County
Vehicle Availability by Sex in Park County
The most prevalent vehicle ownership categories in Park County are males with 2 vehicles (1,995, accounting for 43.3%) and females with 2 vehicles (1,314, making up 50.3%).
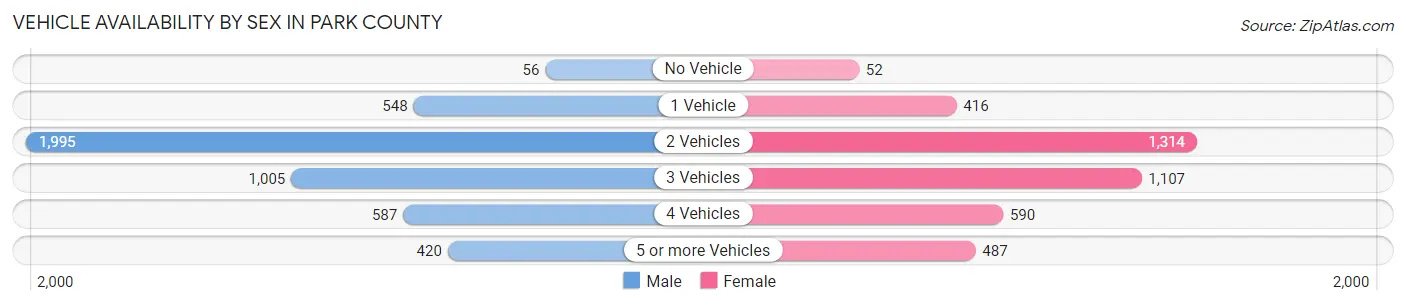
| Vehicles Available | Male | Female |
| No Vehicle | 56 (1.2%) | 52 (1.3%) |
| 1 Vehicle | 548 (11.9%) | 416 (10.5%) |
| 2 Vehicles | 1,995 (43.3%) | 1,314 (33.1%) |
| 3 Vehicles | 1,005 (21.8%) | 1,107 (27.9%) |
| 4 Vehicles | 587 (12.7%) | 590 (14.9%) |
| 5 or more Vehicles | 420 (9.1%) | 487 (12.3%) |
| Total | 4,611 (100.0%) | 3,966 (100.0%) |
Commute Time in Park County
The most frequently occuring commute durations in Park County are 45 to 59 minutes (1,453 commuters, 21.2%), 60 to 89 minutes (1,391 commuters, 20.3%), and 20 to 24 minutes (717 commuters, 10.4%).
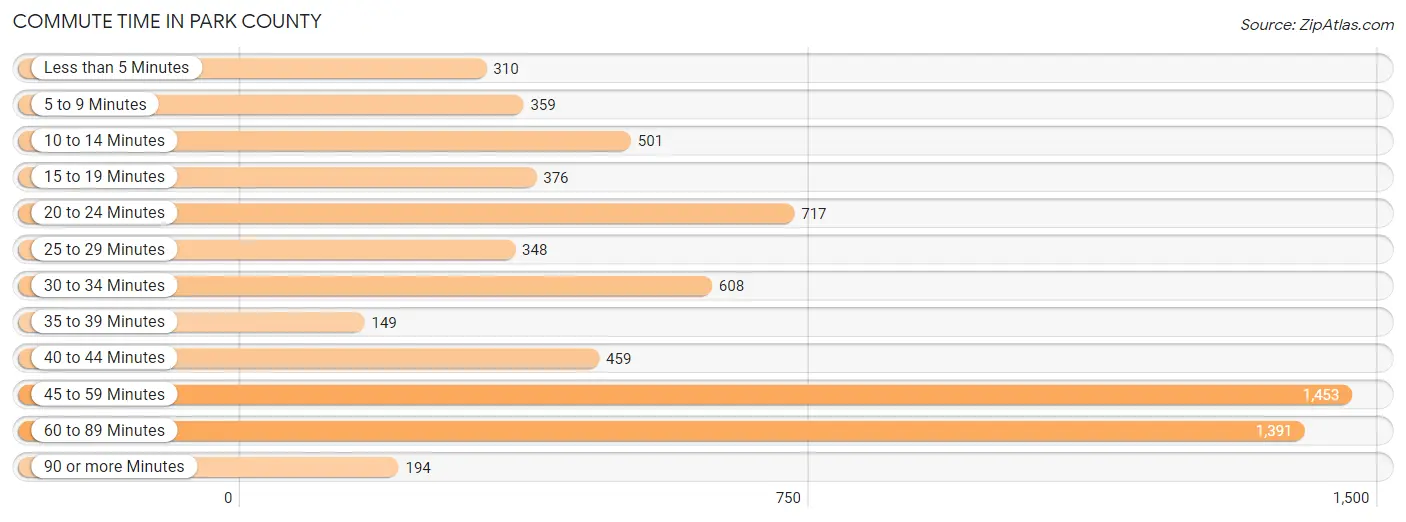
| Commute Time | # Commuters | % Commuters |
| Less than 5 Minutes | 310 | 4.5% |
| 5 to 9 Minutes | 359 | 5.2% |
| 10 to 14 Minutes | 501 | 7.3% |
| 15 to 19 Minutes | 376 | 5.5% |
| 20 to 24 Minutes | 717 | 10.4% |
| 25 to 29 Minutes | 348 | 5.1% |
| 30 to 34 Minutes | 608 | 8.9% |
| 35 to 39 Minutes | 149 | 2.2% |
| 40 to 44 Minutes | 459 | 6.7% |
| 45 to 59 Minutes | 1,453 | 21.2% |
| 60 to 89 Minutes | 1,391 | 20.3% |
| 90 or more Minutes | 194 | 2.8% |
Commute Time by Sex in Park County
The most common commute times in Park County are 60 to 89 minutes (964 commuters, 26.0%) for males and 45 to 59 minutes (730 commuters, 23.2%) for females.
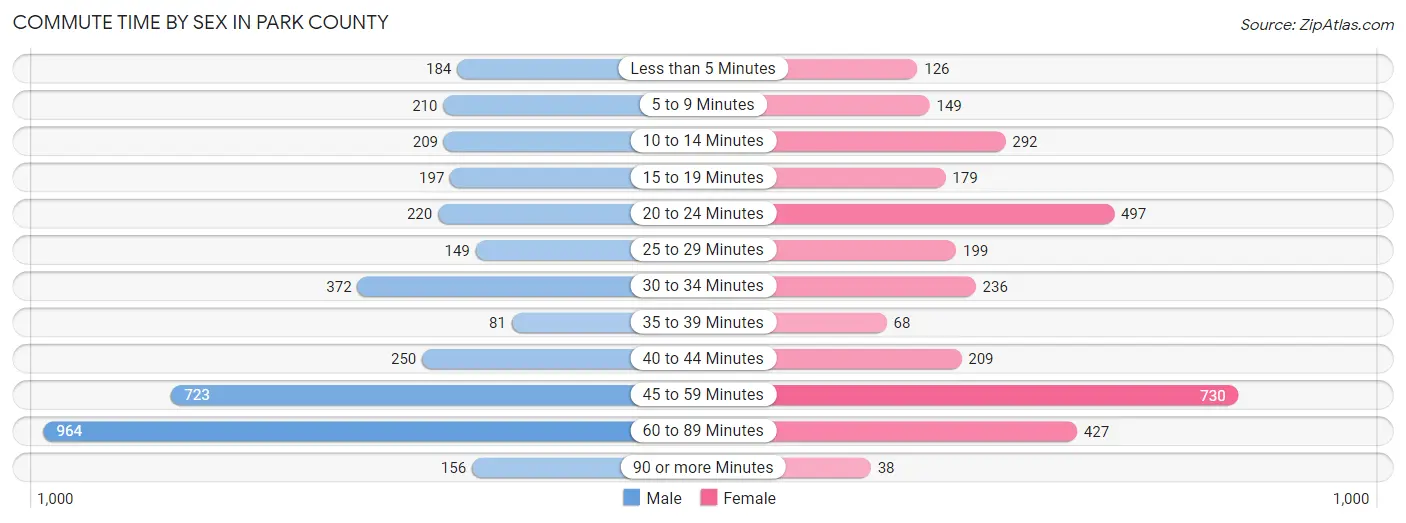
| Commute Time | Male | Female |
| Less than 5 Minutes | 184 (5.0%) | 126 (4.0%) |
| 5 to 9 Minutes | 210 (5.7%) | 149 (4.7%) |
| 10 to 14 Minutes | 209 (5.6%) | 292 (9.3%) |
| 15 to 19 Minutes | 197 (5.3%) | 179 (5.7%) |
| 20 to 24 Minutes | 220 (5.9%) | 497 (15.8%) |
| 25 to 29 Minutes | 149 (4.0%) | 199 (6.3%) |
| 30 to 34 Minutes | 372 (10.0%) | 236 (7.5%) |
| 35 to 39 Minutes | 81 (2.2%) | 68 (2.2%) |
| 40 to 44 Minutes | 250 (6.7%) | 209 (6.6%) |
| 45 to 59 Minutes | 723 (19.5%) | 730 (23.2%) |
| 60 to 89 Minutes | 964 (26.0%) | 427 (13.6%) |
| 90 or more Minutes | 156 (4.2%) | 38 (1.2%) |
Time of Departure to Work by Sex in Park County
The most frequent times of departure to work in Park County are 6:30 AM to 6:59 AM (669, 18.0%) for males and 7:00 AM to 7:29 AM (534, 17.0%) for females.
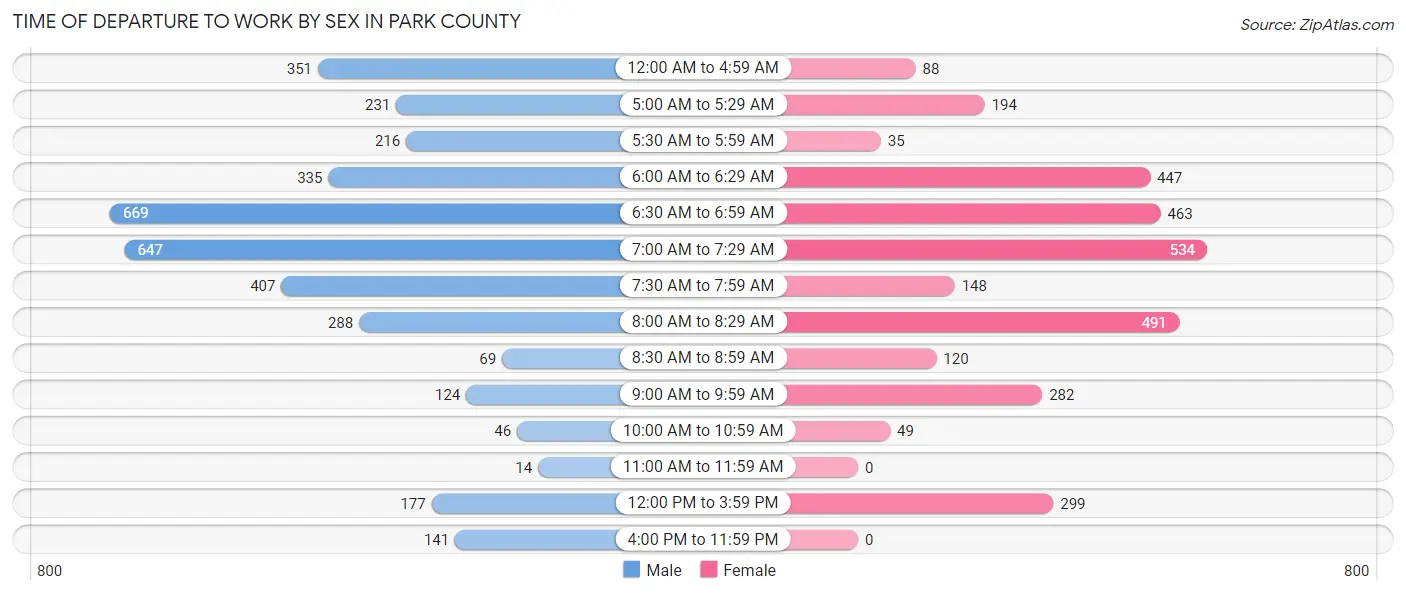
| Time of Departure | Male | Female |
| 12:00 AM to 4:59 AM | 351 (9.5%) | 88 (2.8%) |
| 5:00 AM to 5:29 AM | 231 (6.2%) | 194 (6.2%) |
| 5:30 AM to 5:59 AM | 216 (5.8%) | 35 (1.1%) |
| 6:00 AM to 6:29 AM | 335 (9.0%) | 447 (14.2%) |
| 6:30 AM to 6:59 AM | 669 (18.0%) | 463 (14.7%) |
| 7:00 AM to 7:29 AM | 647 (17.4%) | 534 (17.0%) |
| 7:30 AM to 7:59 AM | 407 (11.0%) | 148 (4.7%) |
| 8:00 AM to 8:29 AM | 288 (7.7%) | 491 (15.6%) |
| 8:30 AM to 8:59 AM | 69 (1.9%) | 120 (3.8%) |
| 9:00 AM to 9:59 AM | 124 (3.3%) | 282 (8.9%) |
| 10:00 AM to 10:59 AM | 46 (1.2%) | 49 (1.6%) |
| 11:00 AM to 11:59 AM | 14 (0.4%) | 0 (0.0%) |
| 12:00 PM to 3:59 PM | 177 (4.8%) | 299 (9.5%) |
| 4:00 PM to 11:59 PM | 141 (3.8%) | 0 (0.0%) |
| Total | 3,715 (100.0%) | 3,150 (100.0%) |
Housing Occupancy in Park County
Occupancy by Ownership in Park County
Of the total 7,688 dwellings in Park County, owner-occupied units account for 6,863 (89.3%), while renter-occupied units make up 825 (10.7%).
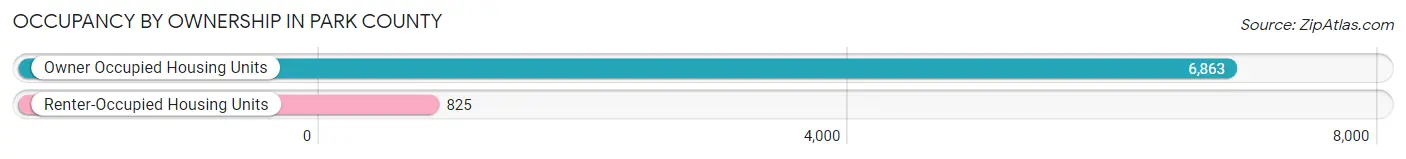
| Occupancy | # Housing Units | % Housing Units |
| Owner Occupied Housing Units | 6,863 | 89.3% |
| Renter-Occupied Housing Units | 825 | 10.7% |
| Total Occupied Housing Units | 7,688 | 100.0% |
Occupancy by Household Size in Park County
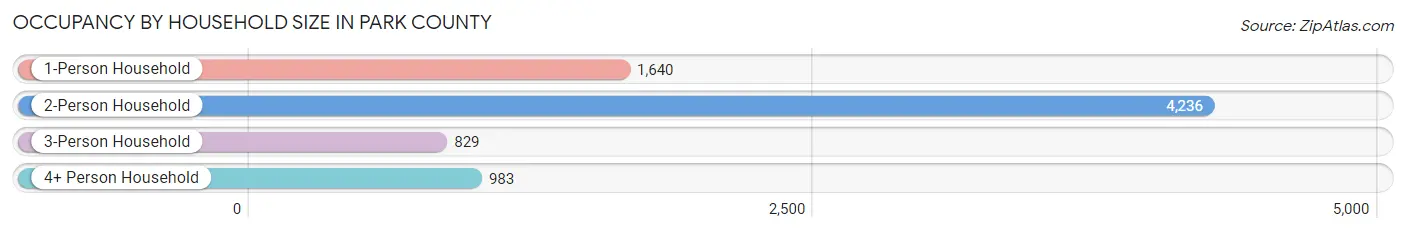
| Household Size | # Housing Units | % Housing Units |
| 1-Person Household | 1,640 | 21.3% |
| 2-Person Household | 4,236 | 55.1% |
| 3-Person Household | 829 | 10.8% |
| 4+ Person Household | 983 | 12.8% |
| Total Housing Units | 7,688 | 100.0% |
Occupancy by Ownership by Household Size in Park County
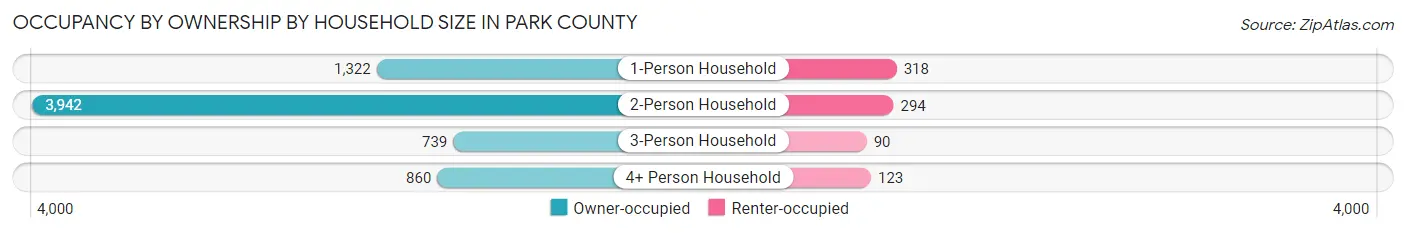
| Household Size | Owner-occupied | Renter-occupied |
| 1-Person Household | 1,322 (80.6%) | 318 (19.4%) |
| 2-Person Household | 3,942 (93.1%) | 294 (6.9%) |
| 3-Person Household | 739 (89.1%) | 90 (10.9%) |
| 4+ Person Household | 860 (87.5%) | 123 (12.5%) |
| Total Housing Units | 6,863 (89.3%) | 825 (10.7%) |
Occupancy by Educational Attainment in Park County
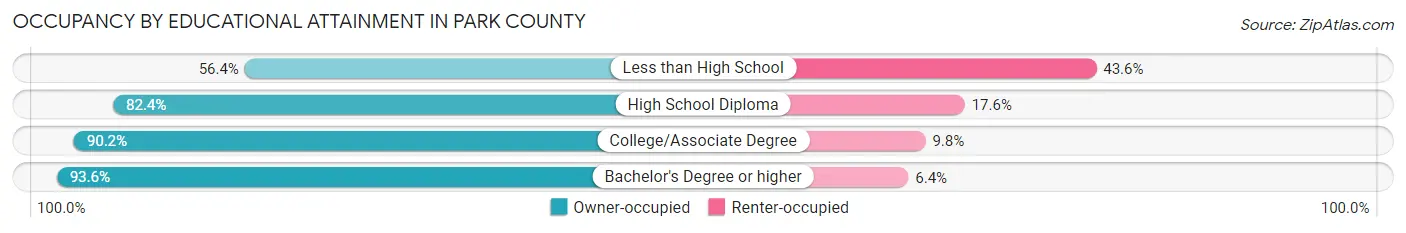
| Household Size | Owner-occupied | Renter-occupied |
| Less than High School | 62 (56.4%) | 48 (43.6%) |
| High School Diploma | 1,460 (82.4%) | 311 (17.6%) |
| College/Associate Degree | 2,540 (90.2%) | 275 (9.8%) |
| Bachelor's Degree or higher | 2,801 (93.6%) | 191 (6.4%) |
Occupancy by Age of Householder in Park County
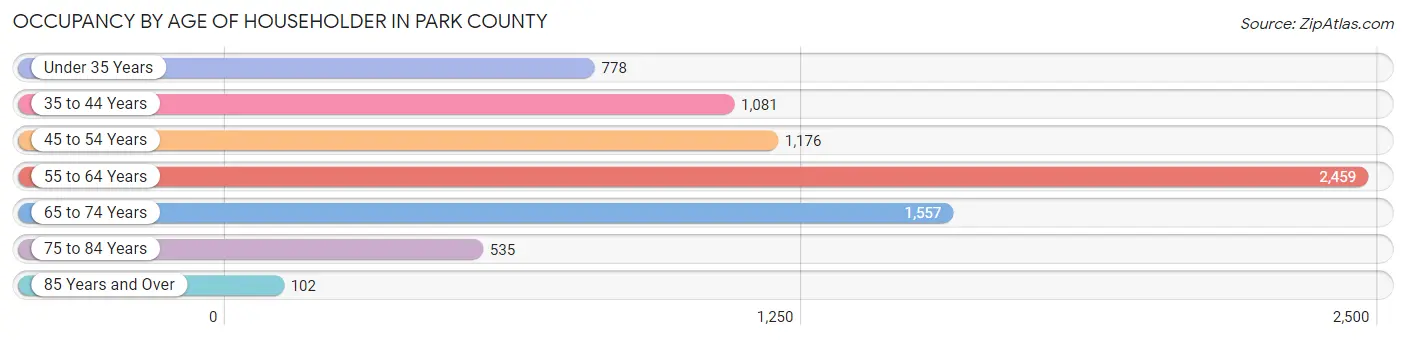
| Age Bracket | # Households | % Households |
| Under 35 Years | 778 | 10.1% |
| 35 to 44 Years | 1,081 | 14.1% |
| 45 to 54 Years | 1,176 | 15.3% |
| 55 to 64 Years | 2,459 | 32.0% |
| 65 to 74 Years | 1,557 | 20.3% |
| 75 to 84 Years | 535 | 7.0% |
| 85 Years and Over | 102 | 1.3% |
| Total | 7,688 | 100.0% |
Housing Finances in Park County
Median Income by Occupancy in Park County
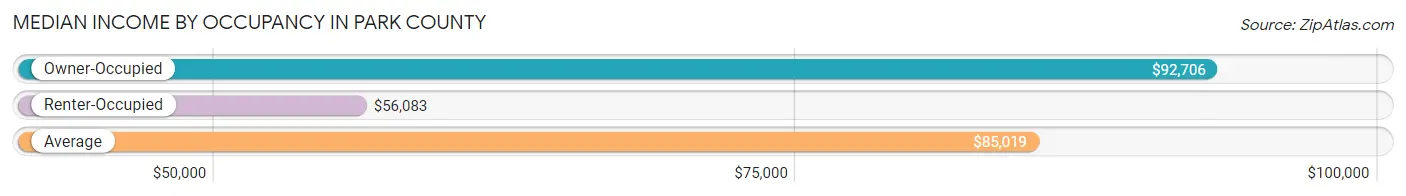
| Occupancy Type | # Households | Median Income |
| Owner-Occupied | 6,863 (89.3%) | $92,706 |
| Renter-Occupied | 825 (10.7%) | $56,083 |
| Average | 7,688 (100.0%) | $85,019 |
Occupancy by Householder Income Bracket in Park County
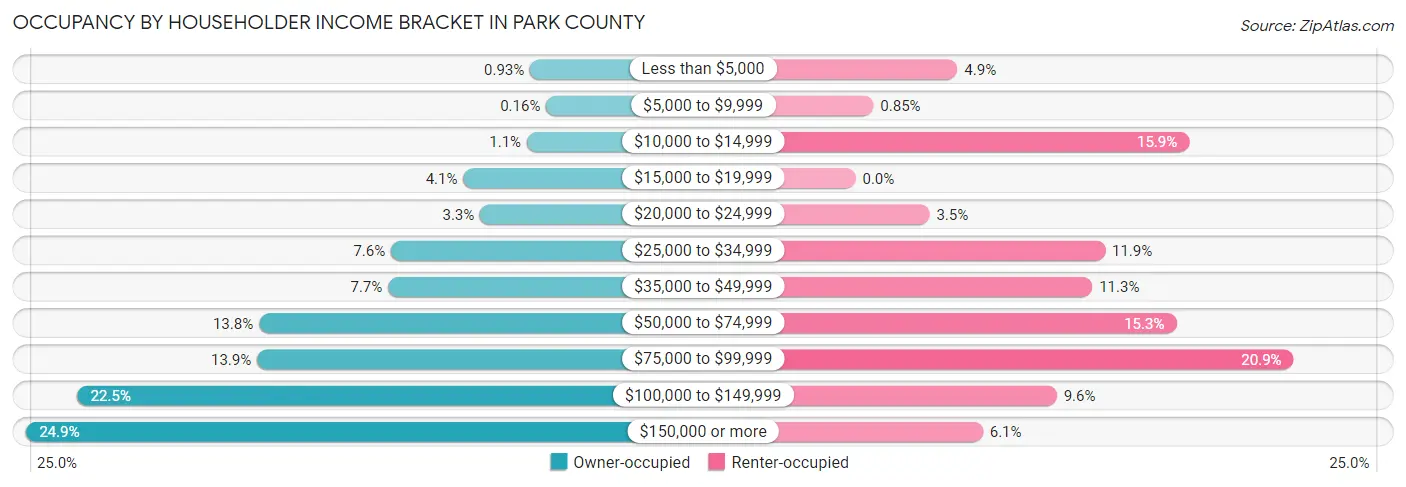
| Income Bracket | Owner-occupied | Renter-occupied |
| Less than $5,000 | 64 (0.9%) | 40 (4.9%) |
| $5,000 to $9,999 | 11 (0.2%) | 7 (0.9%) |
| $10,000 to $14,999 | 74 (1.1%) | 131 (15.9%) |
| $15,000 to $19,999 | 282 (4.1%) | 0 (0.0%) |
| $20,000 to $24,999 | 227 (3.3%) | 29 (3.5%) |
| $25,000 to $34,999 | 518 (7.5%) | 98 (11.9%) |
| $35,000 to $49,999 | 528 (7.7%) | 93 (11.3%) |
| $50,000 to $74,999 | 950 (13.8%) | 126 (15.3%) |
| $75,000 to $99,999 | 956 (13.9%) | 172 (20.8%) |
| $100,000 to $149,999 | 1,543 (22.5%) | 79 (9.6%) |
| $150,000 or more | 1,710 (24.9%) | 50 (6.1%) |
| Total | 6,863 (100.0%) | 825 (100.0%) |
Monthly Housing Cost Tiers in Park County
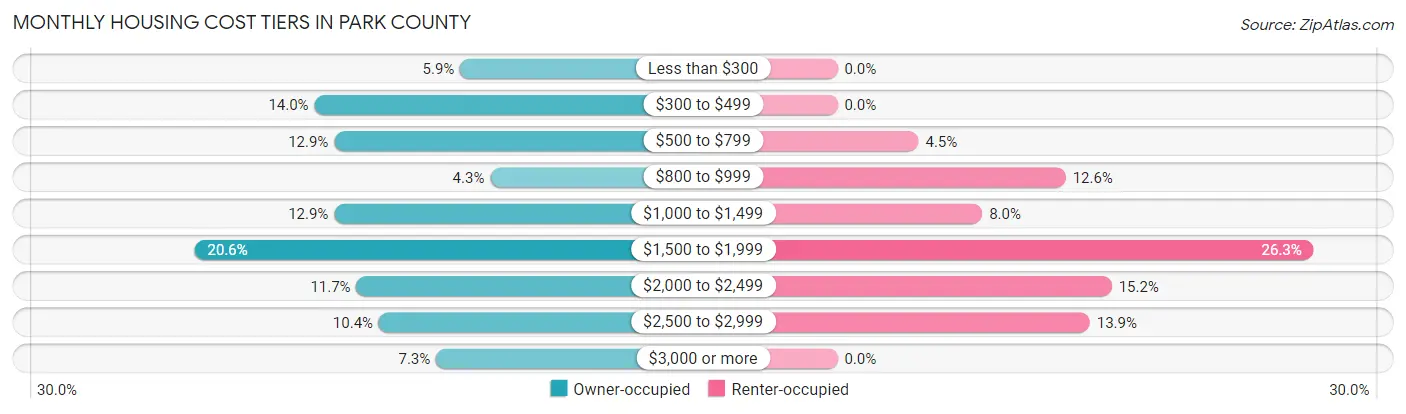
| Monthly Cost | Owner-occupied | Renter-occupied |
| Less than $300 | 408 (5.9%) | 0 (0.0%) |
| $300 to $499 | 960 (14.0%) | 0 (0.0%) |
| $500 to $799 | 885 (12.9%) | 37 (4.5%) |
| $800 to $999 | 294 (4.3%) | 104 (12.6%) |
| $1,000 to $1,499 | 885 (12.9%) | 66 (8.0%) |
| $1,500 to $1,999 | 1,415 (20.6%) | 217 (26.3%) |
| $2,000 to $2,499 | 801 (11.7%) | 125 (15.1%) |
| $2,500 to $2,999 | 716 (10.4%) | 115 (13.9%) |
| $3,000 or more | 499 (7.3%) | 0 (0.0%) |
| Total | 6,863 (100.0%) | 825 (100.0%) |
Physical Housing Characteristics in Park County
Housing Structures in Park County
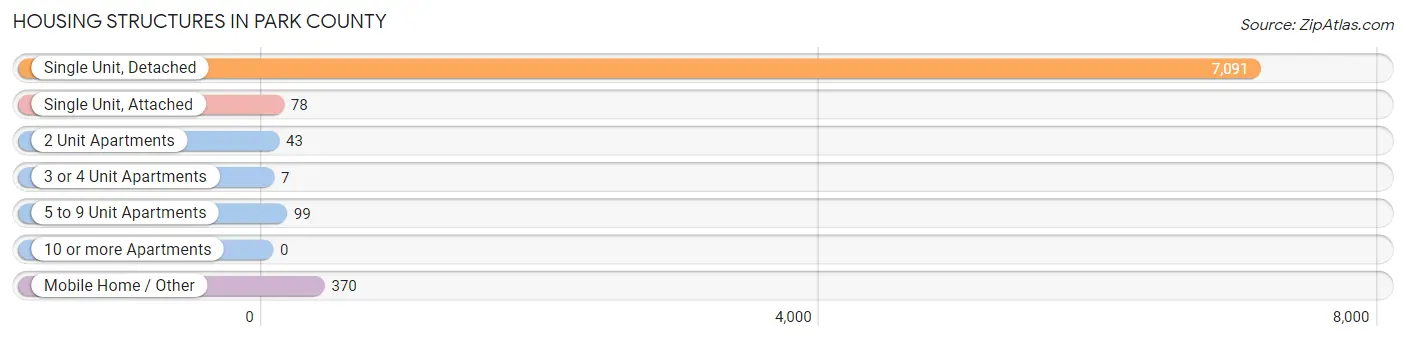
| Structure Type | # Housing Units | % Housing Units |
| Single Unit, Detached | 7,091 | 92.2% |
| Single Unit, Attached | 78 | 1.0% |
| 2 Unit Apartments | 43 | 0.6% |
| 3 or 4 Unit Apartments | 7 | 0.1% |
| 5 to 9 Unit Apartments | 99 | 1.3% |
| 10 or more Apartments | 0 | 0.0% |
| Mobile Home / Other | 370 | 4.8% |
| Total | 7,688 | 100.0% |
Housing Structures by Occupancy in Park County
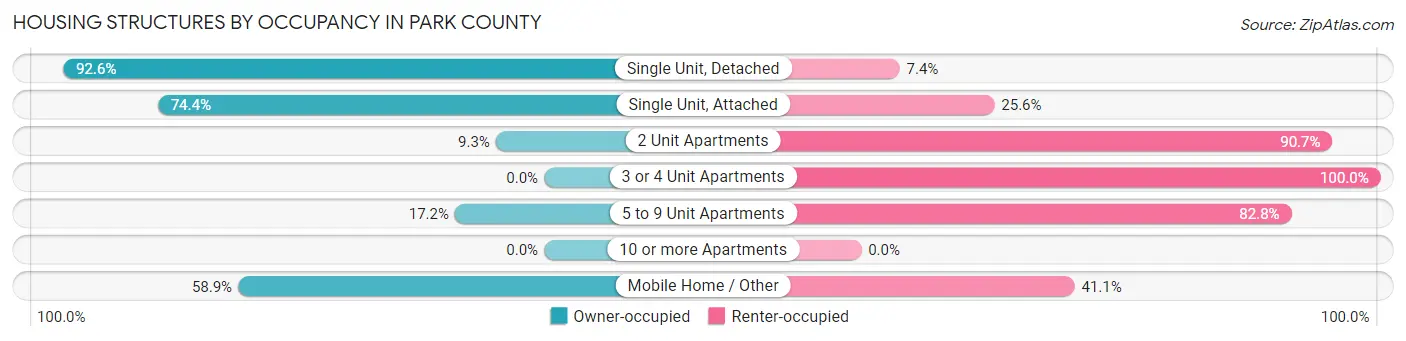
| Structure Type | Owner-occupied | Renter-occupied |
| Single Unit, Detached | 6,566 (92.6%) | 525 (7.4%) |
| Single Unit, Attached | 58 (74.4%) | 20 (25.6%) |
| 2 Unit Apartments | 4 (9.3%) | 39 (90.7%) |
| 3 or 4 Unit Apartments | 0 (0.0%) | 7 (100.0%) |
| 5 to 9 Unit Apartments | 17 (17.2%) | 82 (82.8%) |
| 10 or more Apartments | 0 (0.0%) | 0 (0.0%) |
| Mobile Home / Other | 218 (58.9%) | 152 (41.1%) |
| Total | 6,863 (89.3%) | 825 (10.7%) |
Housing Structures by Number of Rooms in Park County
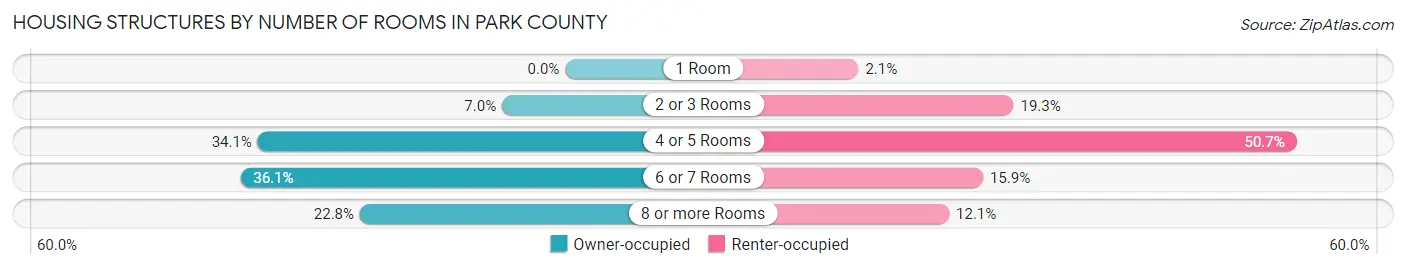
| Number of Rooms | Owner-occupied | Renter-occupied |
| 1 Room | 0 (0.0%) | 17 (2.1%) |
| 2 or 3 Rooms | 482 (7.0%) | 159 (19.3%) |
| 4 or 5 Rooms | 2,342 (34.1%) | 418 (50.7%) |
| 6 or 7 Rooms | 2,475 (36.1%) | 131 (15.9%) |
| 8 or more Rooms | 1,564 (22.8%) | 100 (12.1%) |
| Total | 6,863 (100.0%) | 825 (100.0%) |
Housing Structure by Heating Type in Park County
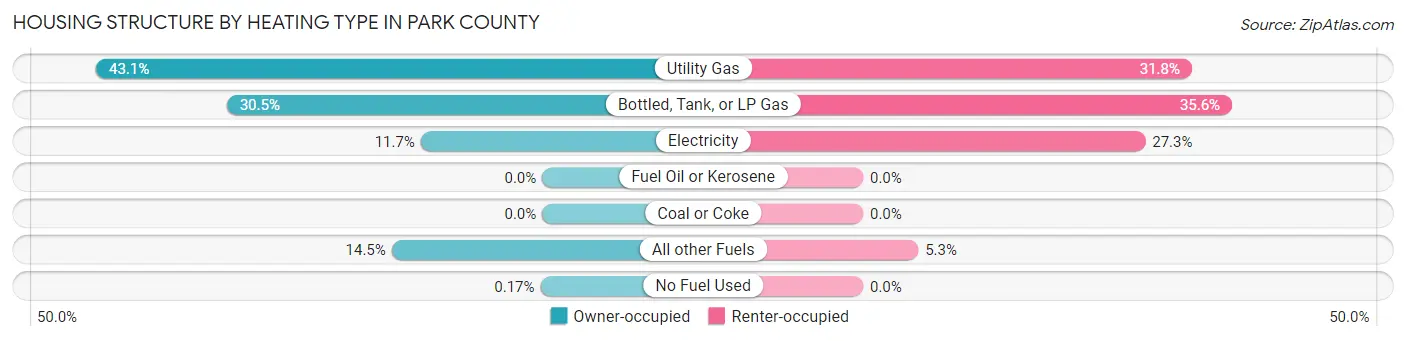
| Heating Type | Owner-occupied | Renter-occupied |
| Utility Gas | 2,957 (43.1%) | 262 (31.8%) |
| Bottled, Tank, or LP Gas | 2,091 (30.5%) | 294 (35.6%) |
| Electricity | 805 (11.7%) | 225 (27.3%) |
| Fuel Oil or Kerosene | 0 (0.0%) | 0 (0.0%) |
| Coal or Coke | 0 (0.0%) | 0 (0.0%) |
| All other Fuels | 998 (14.5%) | 44 (5.3%) |
| No Fuel Used | 12 (0.2%) | 0 (0.0%) |
| Total | 6,863 (100.0%) | 825 (100.0%) |
Household Vehicle Usage in Park County
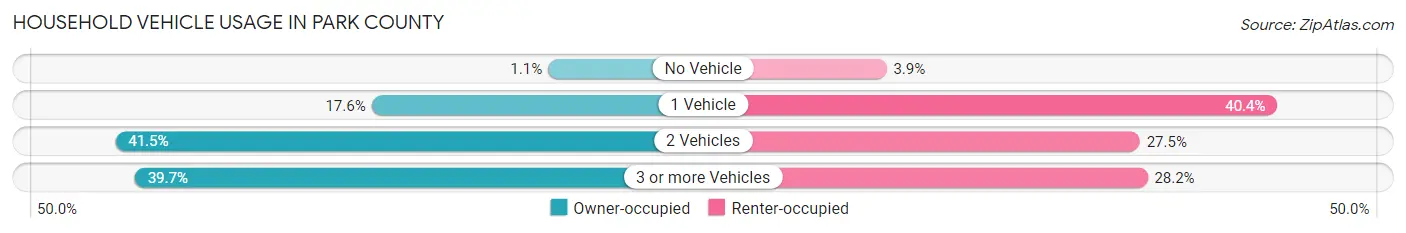
| Vehicles per Household | Owner-occupied | Renter-occupied |
| No Vehicle | 78 (1.1%) | 32 (3.9%) |
| 1 Vehicle | 1,209 (17.6%) | 333 (40.4%) |
| 2 Vehicles | 2,850 (41.5%) | 227 (27.5%) |
| 3 or more Vehicles | 2,726 (39.7%) | 233 (28.2%) |
| Total | 6,863 (100.0%) | 825 (100.0%) |
Real Estate & Mortgages in Park County
Real Estate and Mortgage Overview in Park County
| Characteristic | Without Mortgage | With Mortgage |
| Housing Units | 2,358 | 4,505 |
| Median Property Value | $420,200 | $474,000 |
| Median Household Income | $69,952 | $1,349 |
| Monthly Housing Costs | $476 | $499 |
| Real Estate Taxes | $1,417 | $35 |
Property Value by Mortgage Status in Park County
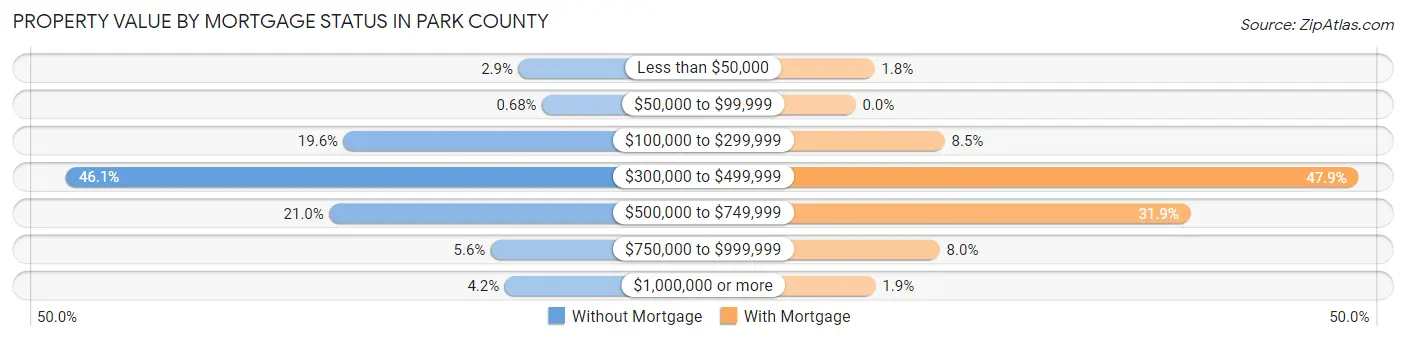
| Property Value | Without Mortgage | With Mortgage |
| Less than $50,000 | 69 (2.9%) | 81 (1.8%) |
| $50,000 to $99,999 | 16 (0.7%) | 0 (0.0%) |
| $100,000 to $299,999 | 462 (19.6%) | 382 (8.5%) |
| $300,000 to $499,999 | 1,086 (46.1%) | 2,158 (47.9%) |
| $500,000 to $749,999 | 494 (20.9%) | 1,438 (31.9%) |
| $750,000 to $999,999 | 131 (5.6%) | 361 (8.0%) |
| $1,000,000 or more | 100 (4.2%) | 85 (1.9%) |
| Total | 2,358 (100.0%) | 4,505 (100.0%) |
Household Income by Mortgage Status in Park County
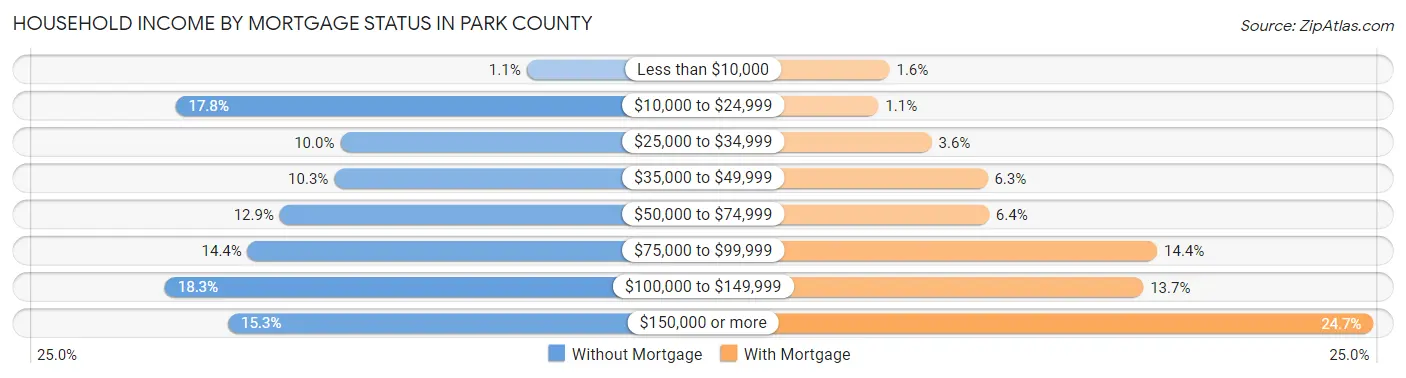
| Household Income | Without Mortgage | With Mortgage |
| Less than $10,000 | 26 (1.1%) | 73 (1.6%) |
| $10,000 to $24,999 | 420 (17.8%) | 49 (1.1%) |
| $25,000 to $34,999 | 235 (10.0%) | 163 (3.6%) |
| $35,000 to $49,999 | 242 (10.3%) | 283 (6.3%) |
| $50,000 to $74,999 | 303 (12.9%) | 286 (6.4%) |
| $75,000 to $99,999 | 339 (14.4%) | 647 (14.4%) |
| $100,000 to $149,999 | 432 (18.3%) | 617 (13.7%) |
| $150,000 or more | 361 (15.3%) | 1,111 (24.7%) |
| Total | 2,358 (100.0%) | 4,505 (100.0%) |
Property Value to Household Income Ratio in Park County
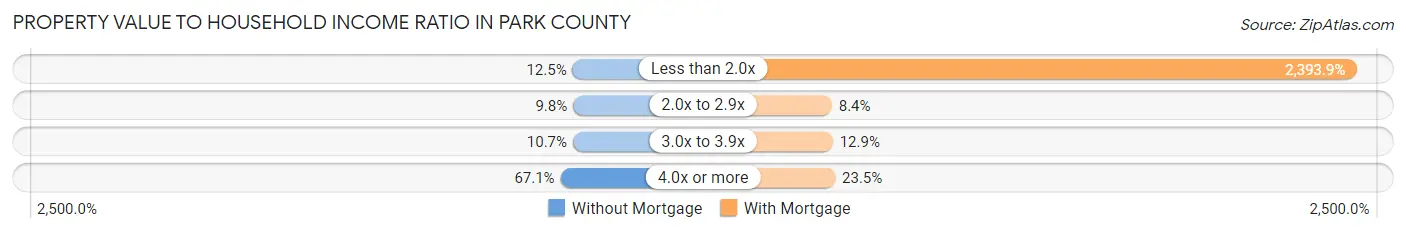
| Value-to-Income Ratio | Without Mortgage | With Mortgage |
| Less than 2.0x | 294 (12.5%) | 107,844 (2,393.9%) |
| 2.0x to 2.9x | 230 (9.8%) | 377 (8.4%) |
| 3.0x to 3.9x | 253 (10.7%) | 579 (12.9%) |
| 4.0x or more | 1,581 (67.0%) | 1,057 (23.5%) |
| Total | 2,358 (100.0%) | 4,505 (100.0%) |
Real Estate Taxes by Mortgage Status in Park County
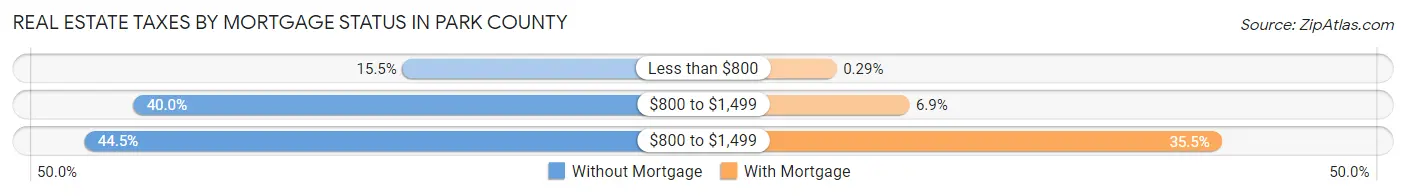
| Property Taxes | Without Mortgage | With Mortgage |
| Less than $800 | 365 (15.5%) | 13 (0.3%) |
| $800 to $1,499 | 944 (40.0%) | 312 (6.9%) |
| $800 to $1,499 | 1,049 (44.5%) | 1,599 (35.5%) |
| Total | 2,358 (100.0%) | 4,505 (100.0%) |
Health & Disability in Park County
Health Insurance Coverage by Age in Park County
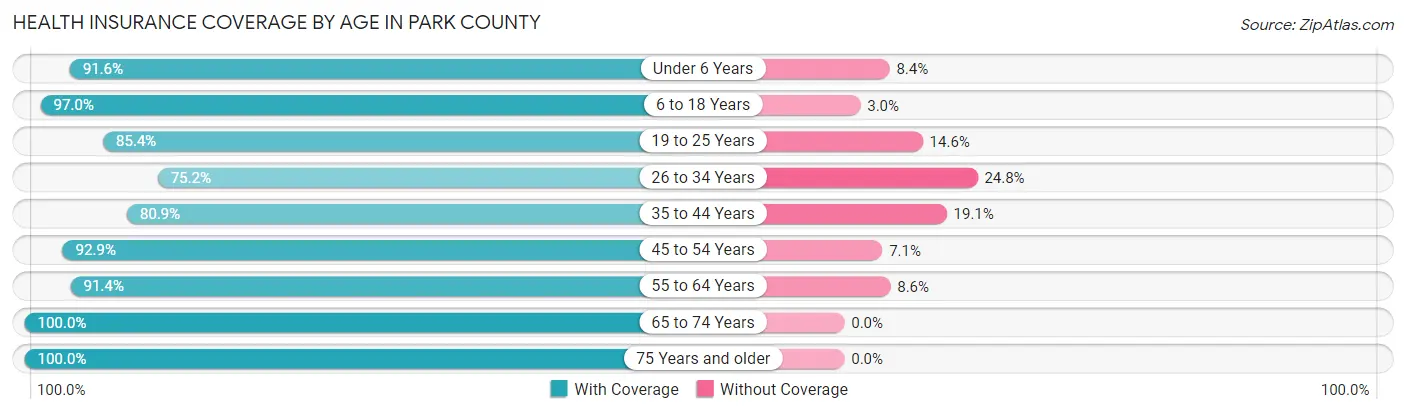
| Age Bracket | With Coverage | Without Coverage |
| Under 6 Years | 641 (91.6%) | 59 (8.4%) |
| 6 to 18 Years | 1,989 (97.0%) | 61 (3.0%) |
| 19 to 25 Years | 672 (85.4%) | 115 (14.6%) |
| 26 to 34 Years | 1,120 (75.2%) | 370 (24.8%) |
| 35 to 44 Years | 1,849 (80.9%) | 436 (19.1%) |
| 45 to 54 Years | 2,390 (92.9%) | 182 (7.1%) |
| 55 to 64 Years | 3,432 (91.4%) | 322 (8.6%) |
| 65 to 74 Years | 2,813 (100.0%) | 0 (0.0%) |
| 75 Years and older | 1,050 (100.0%) | 0 (0.0%) |
| Total | 15,956 (91.2%) | 1,545 (8.8%) |
Health Insurance Coverage by Citizenship Status in Park County
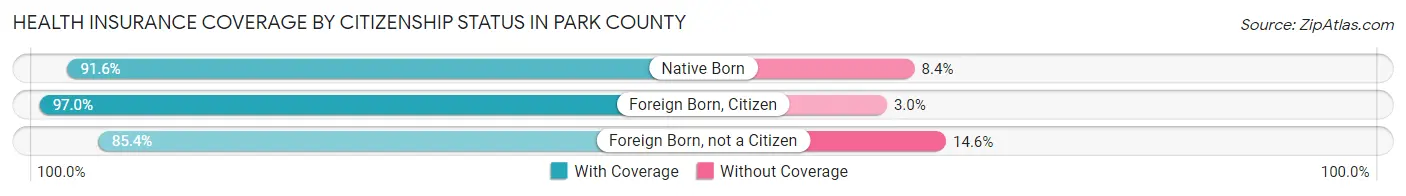
| Citizenship Status | With Coverage | Without Coverage |
| Native Born | 641 (91.6%) | 59 (8.4%) |
| Foreign Born, Citizen | 1,989 (97.0%) | 61 (3.0%) |
| Foreign Born, not a Citizen | 672 (85.4%) | 115 (14.6%) |
Health Insurance Coverage by Household Income in Park County
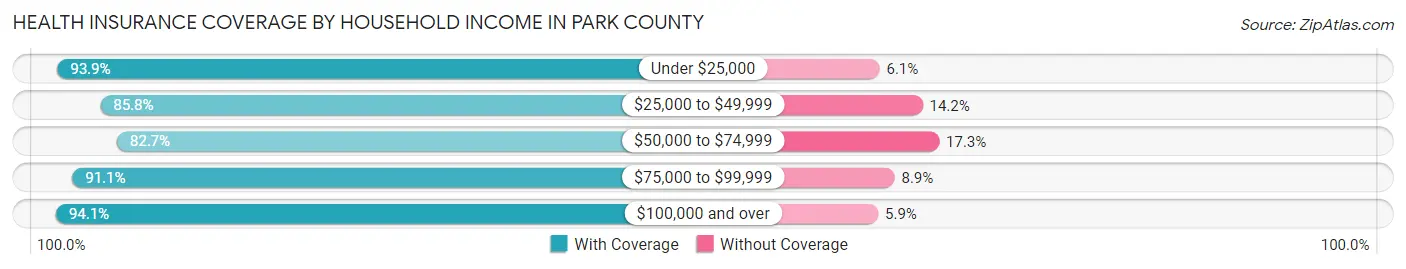
| Household Income | With Coverage | Without Coverage |
| Under $25,000 | 1,422 (93.9%) | 93 (6.1%) |
| $25,000 to $49,999 | 1,808 (85.8%) | 299 (14.2%) |
| $50,000 to $74,999 | 1,918 (82.7%) | 401 (17.3%) |
| $75,000 to $99,999 | 2,221 (91.1%) | 218 (8.9%) |
| $100,000 and over | 8,556 (94.1%) | 534 (5.9%) |
Public vs Private Health Insurance Coverage by Age in Park County
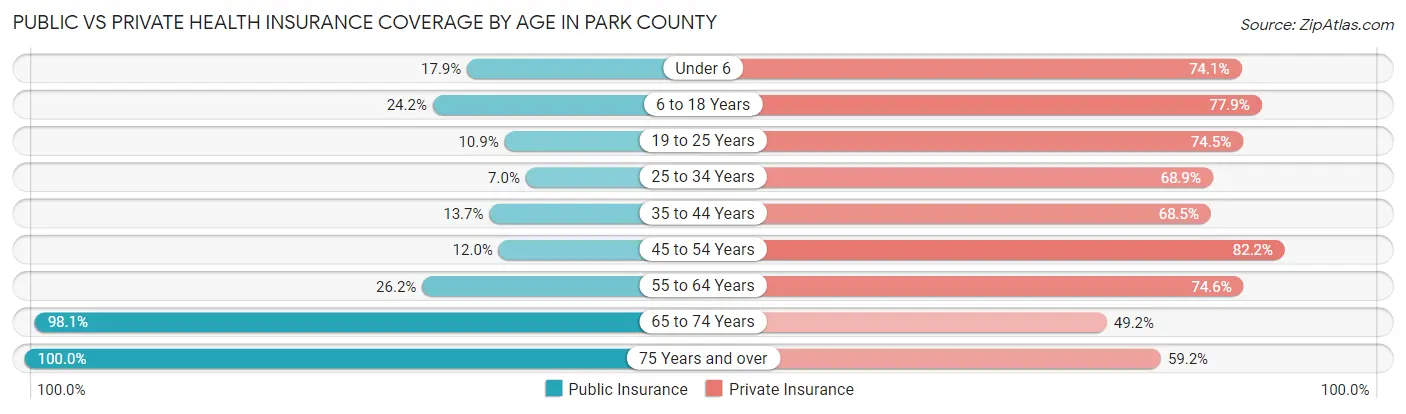
| Age Bracket | Public Insurance | Private Insurance |
| Under 6 | 125 (17.9%) | 519 (74.1%) |
| 6 to 18 Years | 497 (24.2%) | 1,597 (77.9%) |
| 19 to 25 Years | 86 (10.9%) | 586 (74.5%) |
| 25 to 34 Years | 104 (7.0%) | 1,026 (68.9%) |
| 35 to 44 Years | 314 (13.7%) | 1,565 (68.5%) |
| 45 to 54 Years | 309 (12.0%) | 2,115 (82.2%) |
| 55 to 64 Years | 984 (26.2%) | 2,799 (74.6%) |
| 65 to 74 Years | 2,760 (98.1%) | 1,384 (49.2%) |
| 75 Years and over | 1,050 (100.0%) | 622 (59.2%) |
| Total | 6,229 (35.6%) | 12,213 (69.8%) |
Disability Status by Sex by Age in Park County
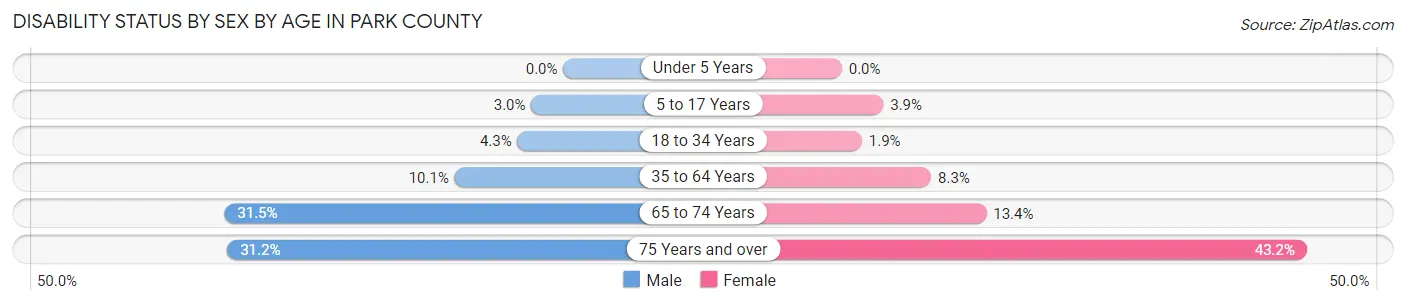
| Age Bracket | Male | Female |
| Under 5 Years | 0 (0.0%) | 0 (0.0%) |
| 5 to 17 Years | 32 (3.0%) | 36 (3.8%) |
| 18 to 34 Years | 57 (4.3%) | 20 (1.9%) |
| 35 to 64 Years | 456 (10.1%) | 339 (8.3%) |
| 65 to 74 Years | 486 (31.5%) | 170 (13.4%) |
| 75 Years and over | 175 (31.2%) | 211 (43.1%) |
Disability Class by Sex by Age in Park County
Disability Class: Hearing Difficulty
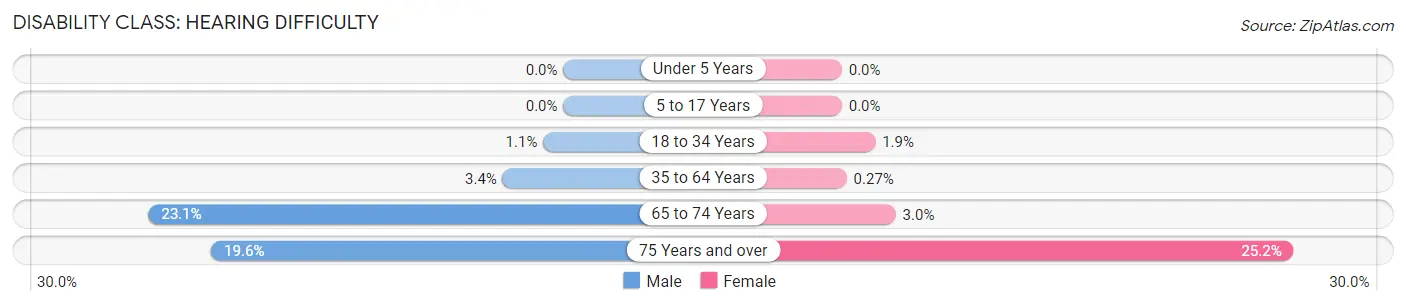
| Age Bracket | Male | Female |
| Under 5 Years | 0 (0.0%) | 0 (0.0%) |
| 5 to 17 Years | 0 (0.0%) | 0 (0.0%) |
| 18 to 34 Years | 15 (1.1%) | 20 (1.9%) |
| 35 to 64 Years | 153 (3.4%) | 11 (0.3%) |
| 65 to 74 Years | 357 (23.1%) | 38 (3.0%) |
| 75 Years and over | 110 (19.6%) | 123 (25.2%) |
Disability Class: Vision Difficulty
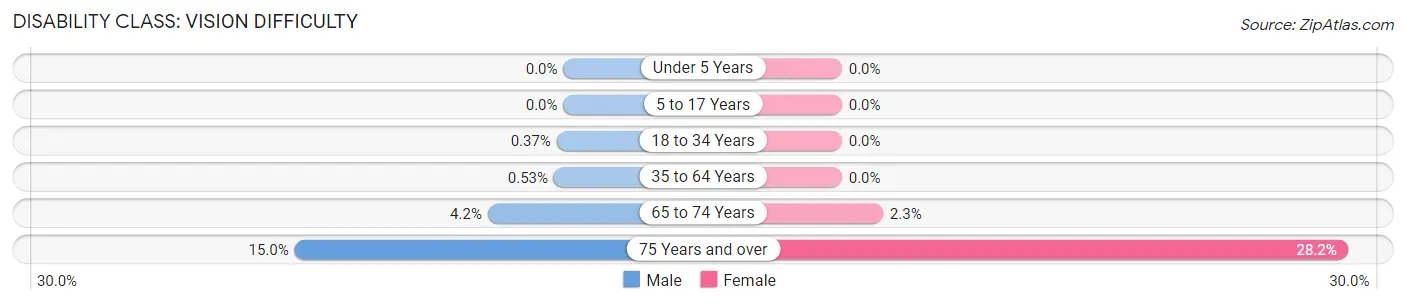
| Age Bracket | Male | Female |
| Under 5 Years | 0 (0.0%) | 0 (0.0%) |
| 5 to 17 Years | 0 (0.0%) | 0 (0.0%) |
| 18 to 34 Years | 5 (0.4%) | 0 (0.0%) |
| 35 to 64 Years | 24 (0.5%) | 0 (0.0%) |
| 65 to 74 Years | 65 (4.2%) | 29 (2.3%) |
| 75 Years and over | 84 (15.0%) | 138 (28.2%) |
Disability Class: Cognitive Difficulty
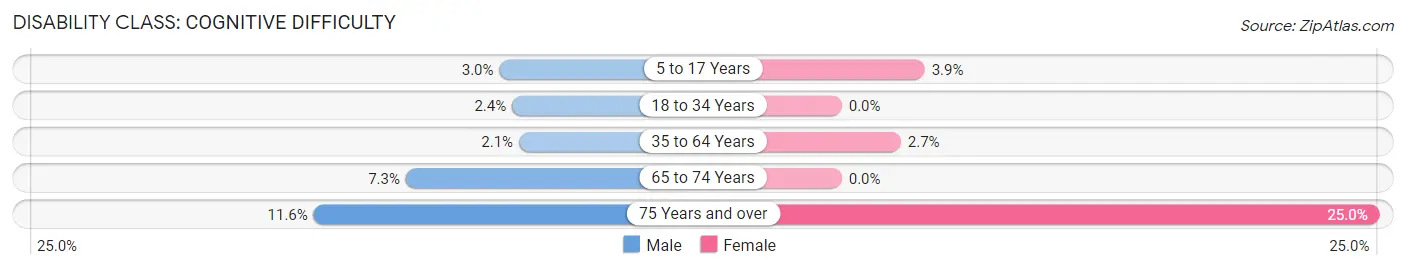
| Age Bracket | Male | Female |
| 5 to 17 Years | 32 (3.0%) | 36 (3.8%) |
| 18 to 34 Years | 32 (2.4%) | 0 (0.0%) |
| 35 to 64 Years | 93 (2.1%) | 112 (2.7%) |
| 65 to 74 Years | 113 (7.3%) | 0 (0.0%) |
| 75 Years and over | 65 (11.6%) | 122 (24.9%) |
Disability Class: Ambulatory Difficulty
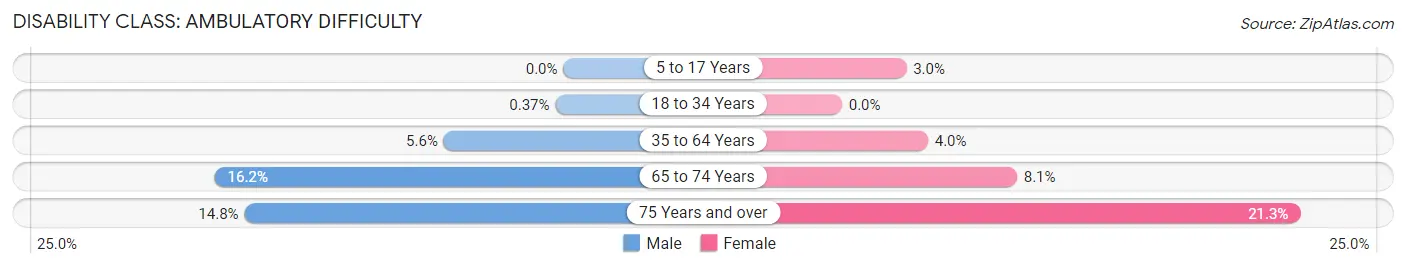
| Age Bracket | Male | Female |
| 5 to 17 Years | 0 (0.0%) | 28 (3.0%) |
| 18 to 34 Years | 5 (0.4%) | 0 (0.0%) |
| 35 to 64 Years | 251 (5.6%) | 163 (4.0%) |
| 65 to 74 Years | 250 (16.2%) | 103 (8.1%) |
| 75 Years and over | 83 (14.8%) | 104 (21.3%) |
Disability Class: Self-Care Difficulty
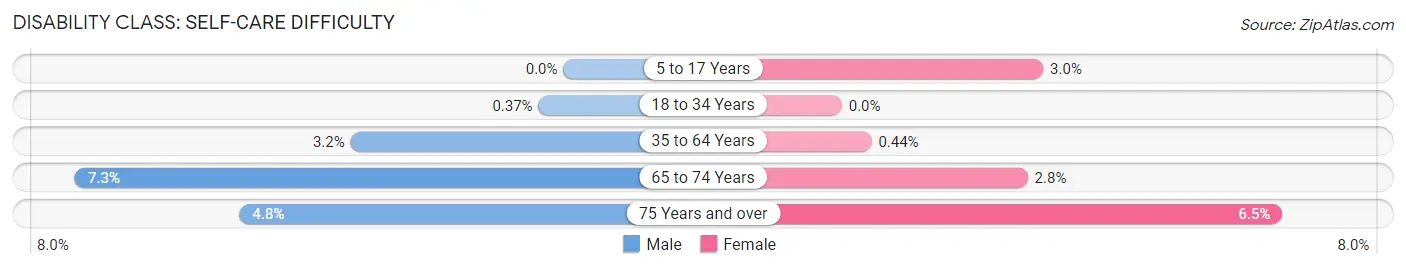
| Age Bracket | Male | Female |
| 5 to 17 Years | 0 (0.0%) | 28 (3.0%) |
| 18 to 34 Years | 5 (0.4%) | 0 (0.0%) |
| 35 to 64 Years | 143 (3.2%) | 18 (0.4%) |
| 65 to 74 Years | 112 (7.2%) | 35 (2.8%) |
| 75 Years and over | 27 (4.8%) | 32 (6.5%) |
Technology Access in Park County
Computing Device Access in Park County
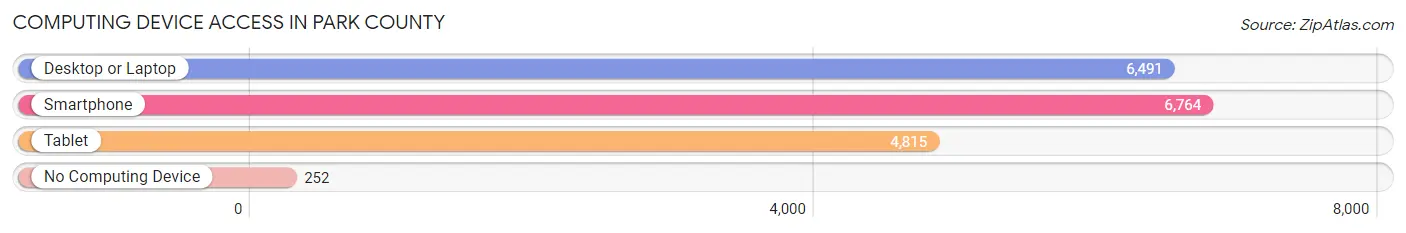
| Device Type | # Households | % Households |
| Desktop or Laptop | 6,491 | 84.4% |
| Smartphone | 6,764 | 88.0% |
| Tablet | 4,815 | 62.6% |
| No Computing Device | 252 | 3.3% |
| Total | 7,688 | 100.0% |
Internet Access in Park County
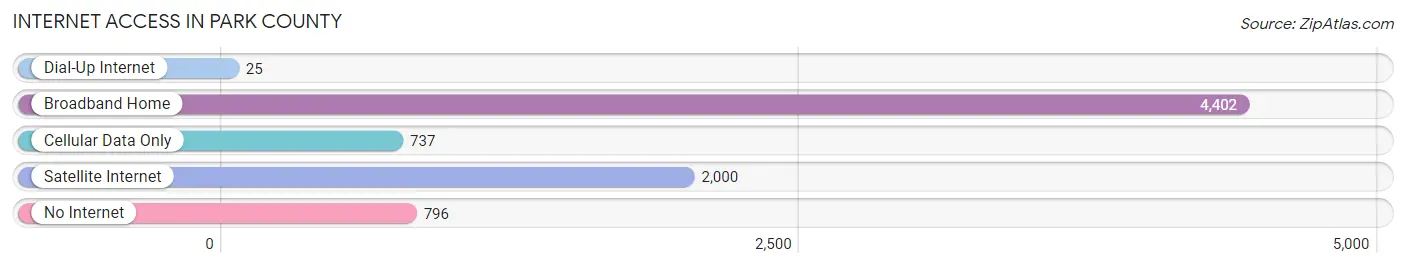
| Internet Type | # Households | % Households |
| Dial-Up Internet | 25 | 0.3% |
| Broadband Home | 4,402 | 57.3% |
| Cellular Data Only | 737 | 9.6% |
| Satellite Internet | 2,000 | 26.0% |
| No Internet | 796 | 10.3% |
| Total | 7,688 | 100.0% |
Park County Summary
Park County is located in the central Rocky Mountains of Colorado, and is one of the 64 counties in the state. It is bordered by Clear Creek County to the north, Jefferson County to the east, Teller County to the south, and Summit County to the west. Park County covers an area of 2,211 square miles, and is home to an estimated population of 16,917 people as of 2019.
Geography
Park County is located in the central Rocky Mountains of Colorado, and is one of the 64 counties in the state. It is bordered by Clear Creek County to the north, Jefferson County to the east, Teller County to the south, and Summit County to the west. Park County covers an area of 2,211 square miles, and is home to an estimated population of 16,917 people as of 2019.
The county is divided into two distinct regions: the Front Range and the Park Range. The Front Range is located in the eastern part of the county and is characterized by rolling hills and grasslands. The Park Range is located in the western part of the county and is characterized by rugged mountains and forests. The highest point in Park County is Mount Evans, which stands at 14,265 feet above sea level.
The county is home to several rivers and streams, including the South Platte River, the Arkansas River, and the North Fork of the South Platte River. The county also contains several reservoirs, including Antero Reservoir, Eleven Mile Reservoir, and Spinney Mountain Reservoir.
History
Park County was established in 1861 as one of the original 17 counties in the Colorado Territory. The county was named after the nearby Rocky Mountain National Park, which was established in 1915.
The county was originally inhabited by the Ute and Arapaho tribes, who were later displaced by settlers in the late 19th century. The county was primarily used for ranching and mining, and the town of Fairplay was established in 1859.
The county experienced a population boom in the late 19th and early 20th centuries, as settlers moved to the area to take advantage of the mining and ranching opportunities. The county also experienced a surge in tourism in the late 20th century, as visitors flocked to the area to take advantage of the nearby Rocky Mountain National Park.
Economy
Park County’s economy is largely based on tourism, ranching, and mining. The county is home to several ski resorts, including Breckenridge Ski Resort and Keystone Ski Resort. The county is also home to several ranches, which produce beef, lamb, and other livestock.
The county is also home to several mining operations, which produce gold, silver, and other minerals. The county is also home to several manufacturing operations, which produce furniture, clothing, and other goods.
Demographics
As of 2019, Park County had an estimated population of 16,917 people. The population is largely white (90.3%), with small percentages of Hispanic (4.2%), African American (1.2%), and Native American (0.7%) populations.
The median household income in Park County is $60,945, and the median home value is $323,400. The county has a poverty rate of 8.3%, and the unemployment rate is 3.2%.
Conclusion
Park County is located in the central Rocky Mountains of Colorado, and is one of the 64 counties in the state. It is bordered by Clear Creek County to the north, Jefferson County to the east, Teller County to the south, and Summit County to the west. Park County covers an area of 2,211 square miles, and is home to an estimated population of 16,917 people as of 2019. The county’s economy is largely based on tourism, ranching, and mining, and the population is largely white. Park County is a beautiful and diverse area of Colorado, and is a great place to live and visit.
Common Questions
What is the Total Population of Park County?
Total Population of Park County is 17,597.
What is the Total Male Population of Park County?
Total Male Population of Park County is 9,422.
What is the Total Female Population of Park County?
Total Female Population of Park County is 8,175.
What is the Ratio of Males per 100 Females in Park County?
There are 115.25 Males per 100 Females in Park County.
What is the Ratio of Females per 100 Males in Park County?
There are 86.77 Females per 100 Males in Park County.
What is the Median Population Age in Park County?
Median Population Age in Park County is 51.3 Years.
What is the Average Family Size in Park County
Average Family Size in Park County is 2.6 People.
What is the Average Household Size in Park County
Average Household Size in Park County is 2.3 People.
What is Per Capita Income in Park County?
Per Capita income in Park County is $48,221.
What is the Median Family Income in Park County?
Median Family Income in Park County is $107,599.
What is the Median Household income in Park County?
Median Household Income in Park County is $85,019.
What is Income or Wage Gap in Park County?
Income or Wage Gap in Park County is 16.4%.
Women in Park County earn 83.6 cents for every dollar earned by a man.
What is Inequality or Gini Index in Park County?
Inequality or Gini Index in Park County is 0.41.
How Large is the Labor Force in Park County?
There are 8,993 People in the Labor Forcein in Park County.
What is the Percentage of People in the Labor Force in Park County?
58.8% of People are in the Labor Force in Park County.
What is the Unemployment Rate in Park County?
Unemployment Rate in Park County is 3.9%.