Otero County, CO
Otero County Map
Otero County Overview
18,580
TOTAL POPULATION
9,409
MALE POPULATION
9,171
FEMALE POPULATION
102.60
MALES / 100 FEMALES
97.47
FEMALES / 100 MALES
40.5
MEDIAN AGE
3.0
AVG FAMILY SIZE
2.4
AVG HOUSEHOLD SIZE
$25,789
PER CAPITA INCOME
$62,013
AVG FAMILY INCOME
$47,500
AVG HOUSEHOLD INCOME
24.3%
WAGE / INCOME GAP [ % ]
75.7¢/ $1
WAGE / INCOME GAP [ $ ]
$11,190
FAMILY INCOME DEFICIT
0.43
INEQUALITY / GINI INDEX
7,613
LABOR FORCE [ PEOPLE ]
51.6%
PERCENT IN LABOR FORCE
5.9%
UNEMPLOYMENT RATE
Otero County Area Codes
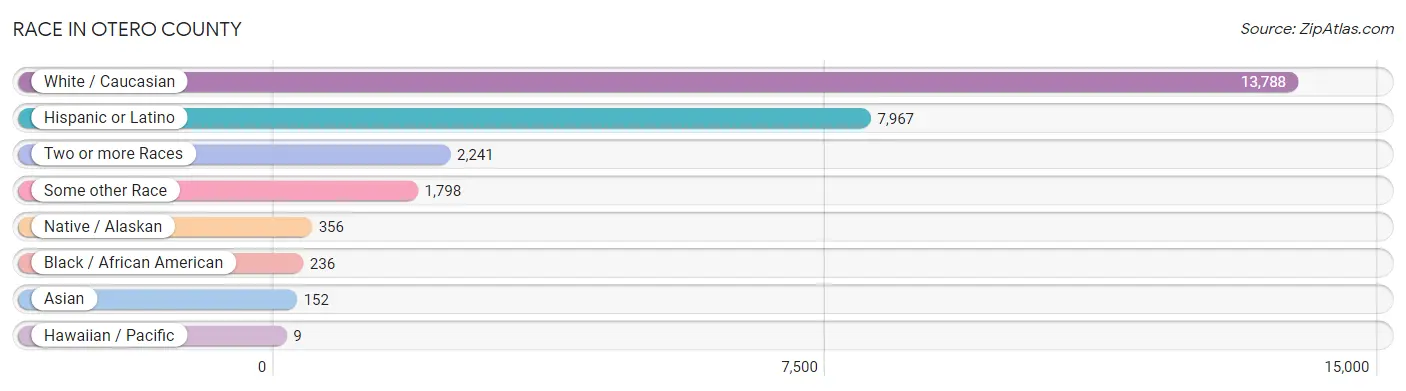
Race in Otero County
The most populous races in Otero County are White / Caucasian (13,788 | 74.2%), Hispanic or Latino (7,967 | 42.9%), and Two or more Races (2,241 | 12.1%).
| Race | # Population | % Population |
| Asian | 152 | 0.8% |
| Black / African American | 236 | 1.3% |
| Hawaiian / Pacific | 9 | 0.1% |
| Hispanic or Latino | 7,967 | 42.9% |
| Native / Alaskan | 356 | 1.9% |
| White / Caucasian | 13,788 | 74.2% |
| Two or more Races | 2,241 | 12.1% |
| Some other Race | 1,798 | 9.7% |
| Total | 18,580 | 100.0% |
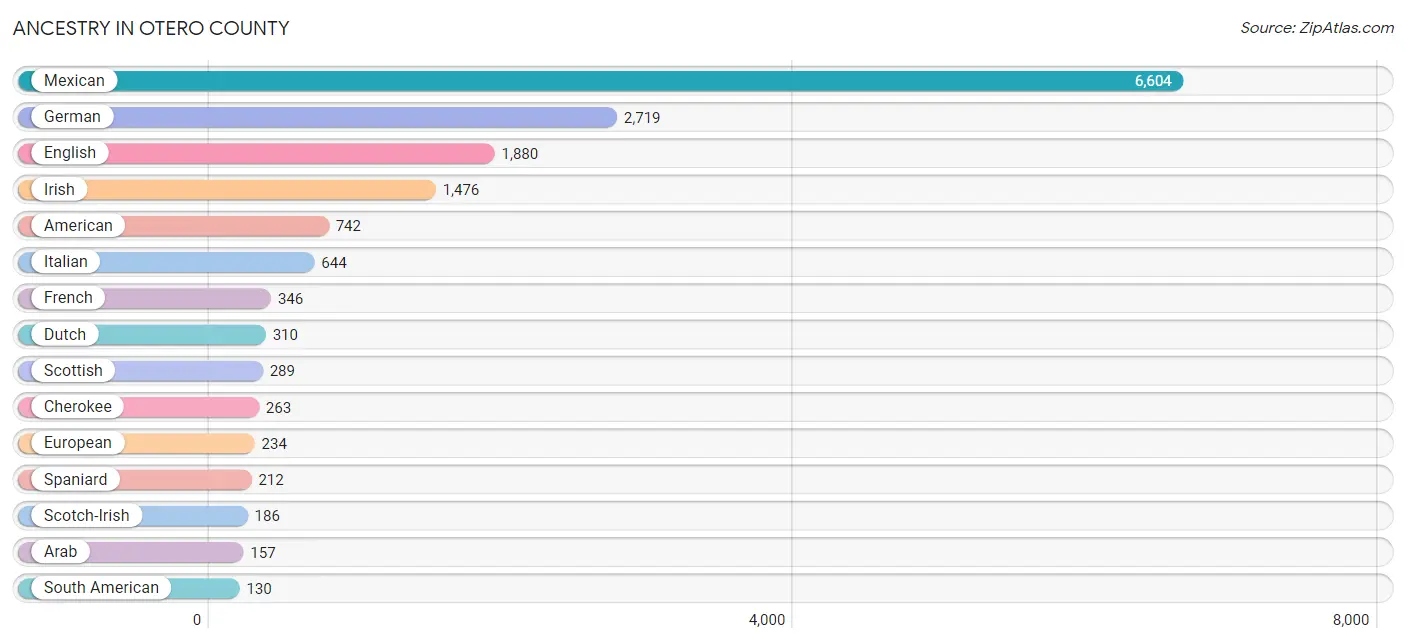
Ancestry in Otero County
The most populous ancestries reported in Otero County are Mexican (6,604 | 35.5%), German (2,719 | 14.6%), English (1,880 | 10.1%), Irish (1,476 | 7.9%), and American (742 | 4.0%), together accounting for 72.2% of all Otero County residents.
| Ancestry | # Population | % Population |
| African | 11 | 0.1% |
| Alsatian | 2 | 0.0% |
| American | 742 | 4.0% |
| Apache | 1 | 0.0% |
| Arab | 157 | 0.8% |
| Arapaho | 21 | 0.1% |
| Austrian | 10 | 0.1% |
| Basque | 6 | 0.0% |
| Bhutanese | 14 | 0.1% |
| Blackfeet | 4 | 0.0% |
| British | 98 | 0.5% |
| Burmese | 46 | 0.3% |
| Cajun | 17 | 0.1% |
| Canadian | 3 | 0.0% |
| Celtic | 26 | 0.1% |
| Central American | 27 | 0.2% |
| Central American Indian | 1 | 0.0% |
| Cherokee | 263 | 1.4% |
| Chickasaw | 11 | 0.1% |
| Costa Rican | 27 | 0.2% |
| Creek | 2 | 0.0% |
| Crow | 2 | 0.0% |
| Cuban | 4 | 0.0% |
| Czech | 70 | 0.4% |
| Czechoslovakian | 33 | 0.2% |
| Danish | 105 | 0.6% |
| Dutch | 310 | 1.7% |
| Eastern European | 19 | 0.1% |
| Ecuadorian | 105 | 0.6% |
| English | 1,880 | 10.1% |
| European | 234 | 1.3% |
| Finnish | 41 | 0.2% |
| French | 346 | 1.9% |
| French Canadian | 44 | 0.2% |
| German | 2,719 | 14.6% |
| Greek | 23 | 0.1% |
| Hungarian | 8 | 0.0% |
| Indian (Asian) | 4 | 0.0% |
| Irish | 1,476 | 7.9% |
| Iroquois | 11 | 0.1% |
| Italian | 644 | 3.5% |
| Korean | 63 | 0.3% |
| Latvian | 5 | 0.0% |
| Lebanese | 67 | 0.4% |
| Lithuanian | 3 | 0.0% |
| Mexican | 6,604 | 35.5% |
| Mexican American Indian | 27 | 0.2% |
| Native Hawaiian | 3 | 0.0% |
| Navajo | 60 | 0.3% |
| Northern European | 79 | 0.4% |
| Norwegian | 91 | 0.5% |
| Peruvian | 20 | 0.1% |
| Polish | 35 | 0.2% |
| Potawatomi | 13 | 0.1% |
| Pueblo | 1 | 0.0% |
| Puerto Rican | 14 | 0.1% |
| Russian | 5 | 0.0% |
| Scandinavian | 74 | 0.4% |
| Scotch-Irish | 186 | 1.0% |
| Scottish | 289 | 1.6% |
| Sioux | 15 | 0.1% |
| Slavic | 9 | 0.1% |
| South American | 130 | 0.7% |
| Spaniard | 212 | 1.1% |
| Spanish | 130 | 0.7% |
| Spanish American | 17 | 0.1% |
| Sri Lankan | 62 | 0.3% |
| Subsaharan African | 22 | 0.1% |
| Swedish | 126 | 0.7% |
| Swiss | 65 | 0.4% |
| Thai | 8 | 0.0% |
| Ukrainian | 2 | 0.0% |
| Venezuelan | 5 | 0.0% |
| Welsh | 75 | 0.4% |
| Yugoslavian | 1 | 0.0% | View All 75 Rows |
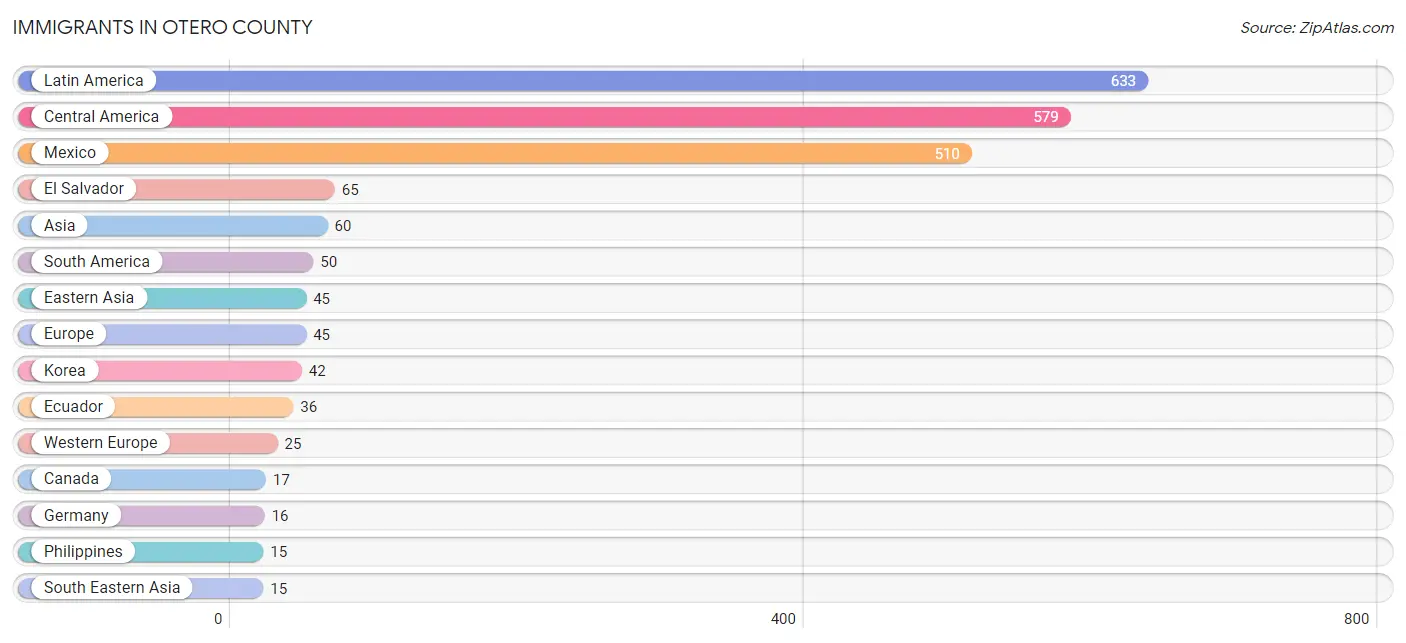
Immigrants in Otero County
The most numerous immigrant groups reported in Otero County came from Latin America (633 | 3.4%), Central America (579 | 3.1%), Mexico (510 | 2.7%), El Salvador (65 | 0.4%), and Asia (60 | 0.3%), together accounting for 9.9% of all Otero County residents.
| Immigration Origin | # Population | % Population |
| Africa | 11 | 0.1% |
| Asia | 60 | 0.3% |
| Cameroon | 11 | 0.1% |
| Canada | 17 | 0.1% |
| Caribbean | 4 | 0.0% |
| Central America | 579 | 3.1% |
| China | 3 | 0.0% |
| Eastern Asia | 45 | 0.2% |
| Eastern Europe | 5 | 0.0% |
| Ecuador | 36 | 0.2% |
| El Salvador | 65 | 0.4% |
| Europe | 45 | 0.2% |
| Germany | 16 | 0.1% |
| Guatemala | 4 | 0.0% |
| Italy | 10 | 0.1% |
| Korea | 42 | 0.2% |
| Latin America | 633 | 3.4% |
| Mexico | 510 | 2.7% |
| Middle Africa | 11 | 0.1% |
| Northern Europe | 5 | 0.0% |
| Peru | 9 | 0.1% |
| Philippines | 15 | 0.1% |
| Russia | 5 | 0.0% |
| South America | 50 | 0.3% |
| South Eastern Asia | 15 | 0.1% |
| Southern Europe | 10 | 0.1% |
| Switzerland | 9 | 0.1% |
| Venezuela | 5 | 0.0% |
| Western Europe | 25 | 0.1% | View All 29 Rows |
Sex and Age in Otero County
Sex and Age in Otero County
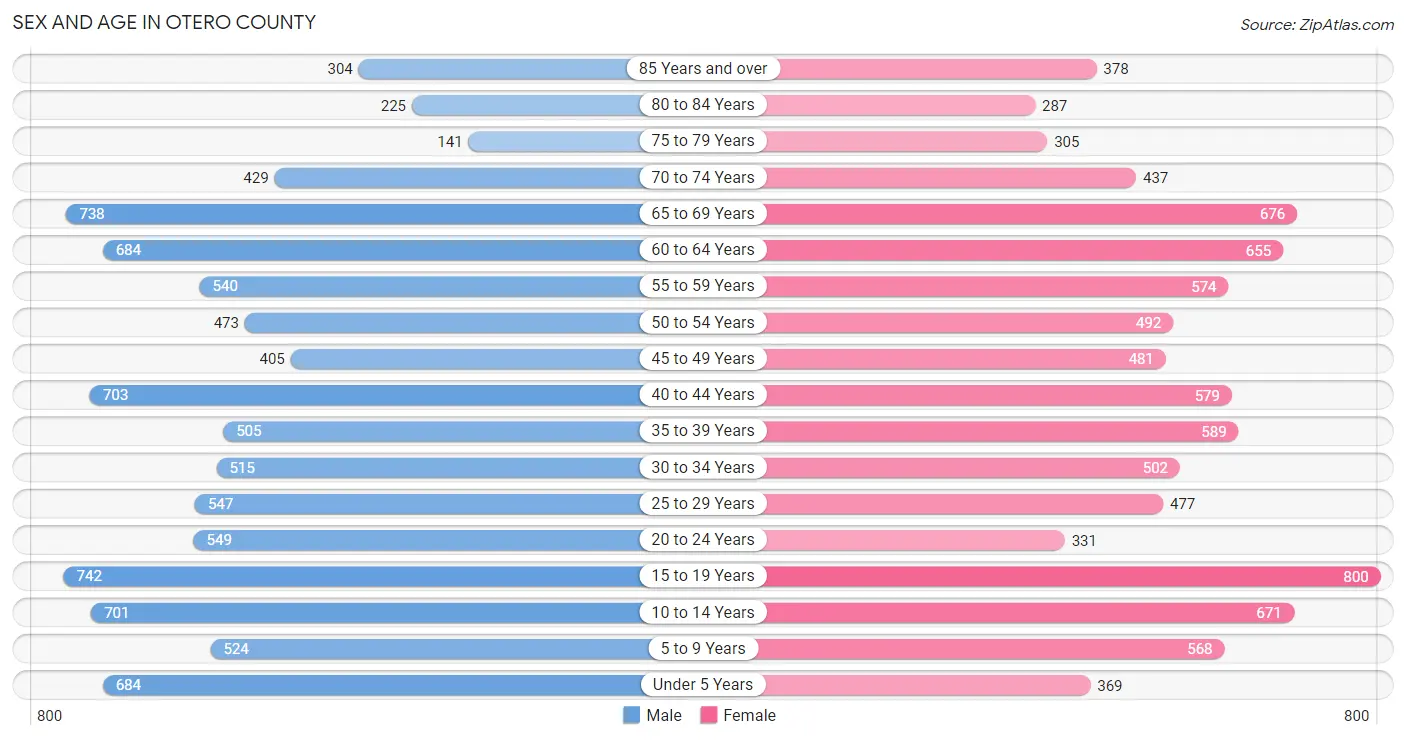
The most populous age groups in Otero County are 15 to 19 Years (742 | 7.9%) for men and 15 to 19 Years (800 | 8.7%) for women.
| Age Bracket | Male | Female |
| Under 5 Years | 684 (7.3%) | 369 (4.0%) |
| 5 to 9 Years | 524 (5.6%) | 568 (6.2%) |
| 10 to 14 Years | 701 (7.4%) | 671 (7.3%) |
| 15 to 19 Years | 742 (7.9%) | 800 (8.7%) |
| 20 to 24 Years | 549 (5.8%) | 331 (3.6%) |
| 25 to 29 Years | 547 (5.8%) | 477 (5.2%) |
| 30 to 34 Years | 515 (5.5%) | 502 (5.5%) |
| 35 to 39 Years | 505 (5.4%) | 589 (6.4%) |
| 40 to 44 Years | 703 (7.5%) | 579 (6.3%) |
| 45 to 49 Years | 405 (4.3%) | 481 (5.2%) |
| 50 to 54 Years | 473 (5.0%) | 492 (5.4%) |
| 55 to 59 Years | 540 (5.7%) | 574 (6.3%) |
| 60 to 64 Years | 684 (7.3%) | 655 (7.1%) |
| 65 to 69 Years | 738 (7.8%) | 676 (7.4%) |
| 70 to 74 Years | 429 (4.6%) | 437 (4.8%) |
| 75 to 79 Years | 141 (1.5%) | 305 (3.3%) |
| 80 to 84 Years | 225 (2.4%) | 287 (3.1%) |
| 85 Years and over | 304 (3.2%) | 378 (4.1%) |
| Total | 9,409 (100.0%) | 9,171 (100.0%) |
Families and Households in Otero County
Median Family Size in Otero County
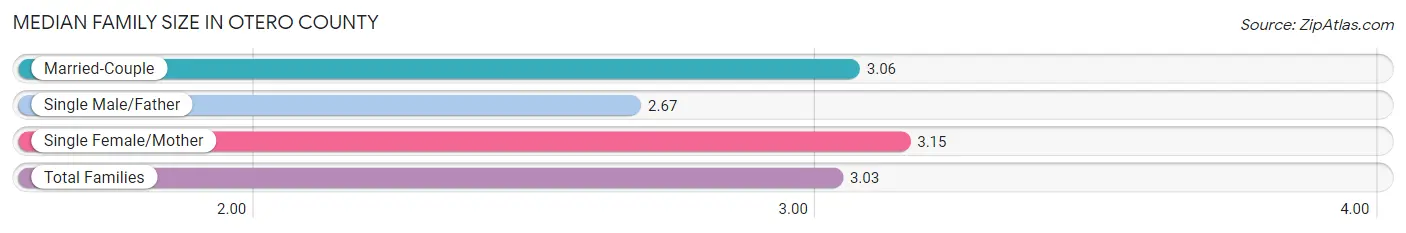
The median family size in Otero County is 3.03 persons per family, with single female/mother families (896 | 19.0%) accounting for the largest median family size of 3.15 persons per family. On the other hand, single male/father families (529 | 11.2%) represent the smallest median family size with 2.67 persons per family.
| Family Type | # Families | Family Size |
| Married-Couple | 3,294 (69.8%) | 3.06 |
| Single Male/Father | 529 (11.2%) | 2.67 |
| Single Female/Mother | 896 (19.0%) | 3.15 |
| Total Families | 4,719 (100.0%) | 3.03 |
Median Household Size in Otero County
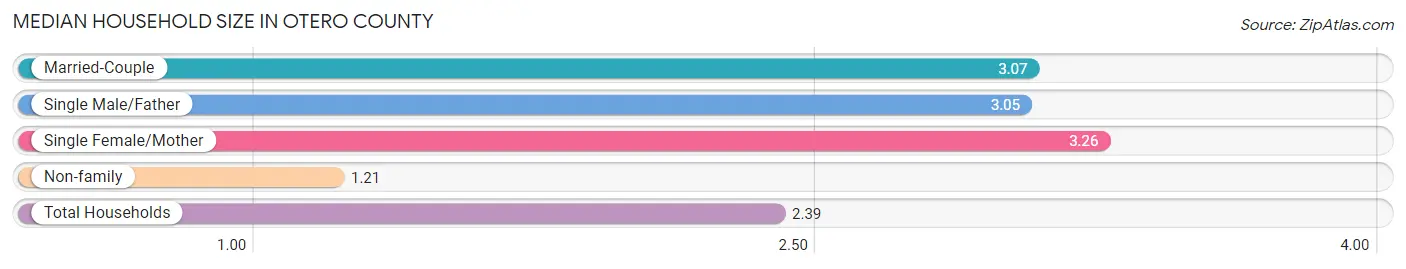
The median household size in Otero County is 2.39 persons per household, with single female/mother households (896 | 11.8%) accounting for the largest median household size of 3.26 persons per household. non-family households (2,875 | 37.9%) represent the smallest median household size with 1.21 persons per household.
| Household Type | # Households | Household Size |
| Married-Couple | 3,294 (43.4%) | 3.07 |
| Single Male/Father | 529 (7.0%) | 3.05 |
| Single Female/Mother | 896 (11.8%) | 3.26 |
| Non-family | 2,875 (37.9%) | 1.21 |
| Total Households | 7,594 (100.0%) | 2.39 |
Household Size by Marriage Status in Otero County
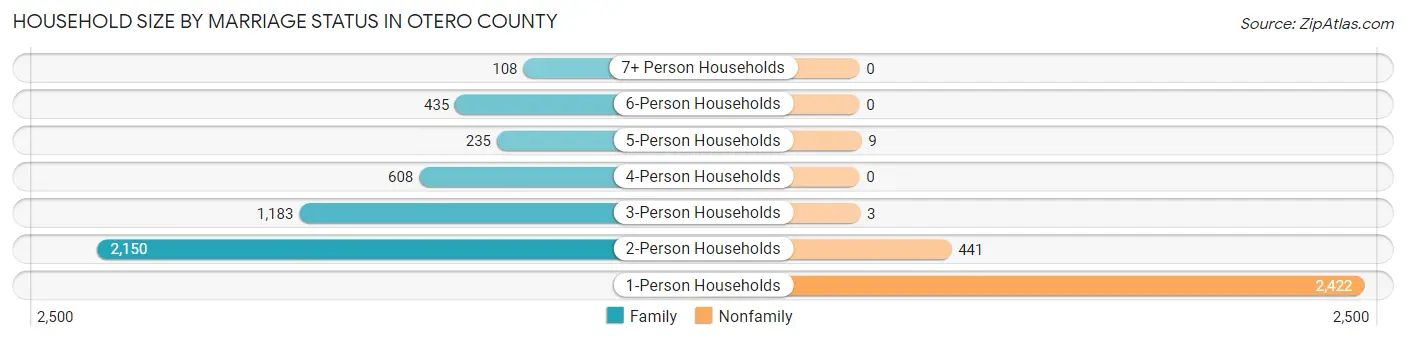
Out of a total of 7,594 households in Otero County, 4,719 (62.1%) are family households, while 2,875 (37.9%) are nonfamily households. The most numerous type of family households are 2-person households, comprising 2,150, and the most common type of nonfamily households are 1-person households, comprising 2,422.
| Household Size | Family Households | Nonfamily Households |
| 1-Person Households | - | 2,422 (31.9%) |
| 2-Person Households | 2,150 (28.3%) | 441 (5.8%) |
| 3-Person Households | 1,183 (15.6%) | 3 (0.0%) |
| 4-Person Households | 608 (8.0%) | 0 (0.0%) |
| 5-Person Households | 235 (3.1%) | 9 (0.1%) |
| 6-Person Households | 435 (5.7%) | 0 (0.0%) |
| 7+ Person Households | 108 (1.4%) | 0 (0.0%) |
| Total | 4,719 (62.1%) | 2,875 (37.9%) |
Female Fertility in Otero County
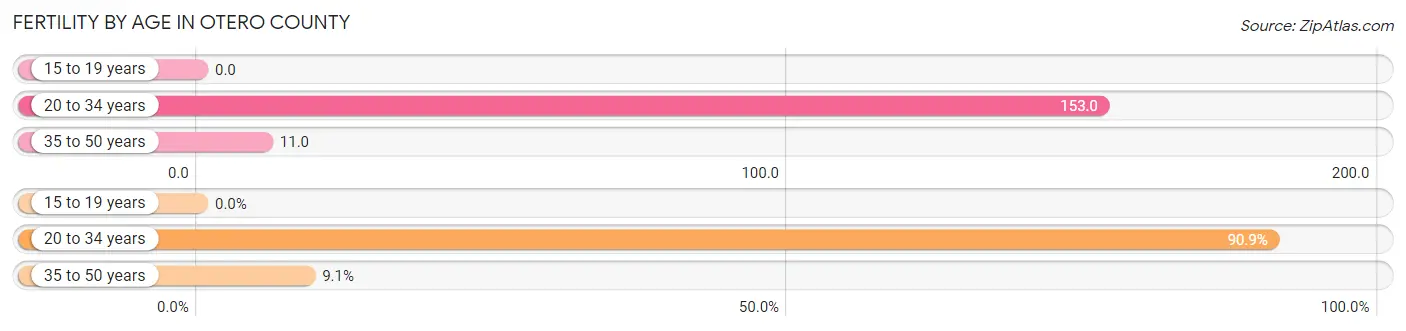
Fertility by Age in Otero County
Average fertility rate in Otero County is 57.0 births per 1,000 women. Women in the age bracket of 20 to 34 years have the highest fertility rate with 153.0 births per 1,000 women. Women in the age bracket of 20 to 34 years acount for 90.9% of all women with births.
| Age Bracket | Women with Births | Births / 1,000 Women |
| 15 to 19 years | 0 (0.0%) | 0.0 |
| 20 to 34 years | 200 (90.9%) | 153.0 |
| 35 to 50 years | 20 (9.1%) | 11.0 |
| Total | 220 (100.0%) | 57.0 |
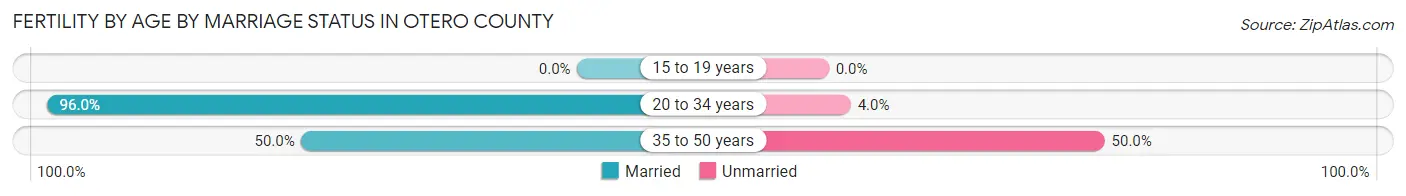
Fertility by Age by Marriage Status in Otero County
91.8% of women with births (220) in Otero County are married. The highest percentage of unmarried women with births falls into 35 to 50 years age bracket with 50.0% of them unmarried at the time of birth, while the lowest percentage of unmarried women with births belong to 20 to 34 years age bracket with 4.0% of them unmarried.
| Age Bracket | Married | Unmarried |
| 15 to 19 years | 0 (0.0%) | 0 (0.0%) |
| 20 to 34 years | 192 (96.0%) | 8 (4.0%) |
| 35 to 50 years | 10 (50.0%) | 10 (50.0%) |
| Total | 202 (91.8%) | 18 (8.2%) |
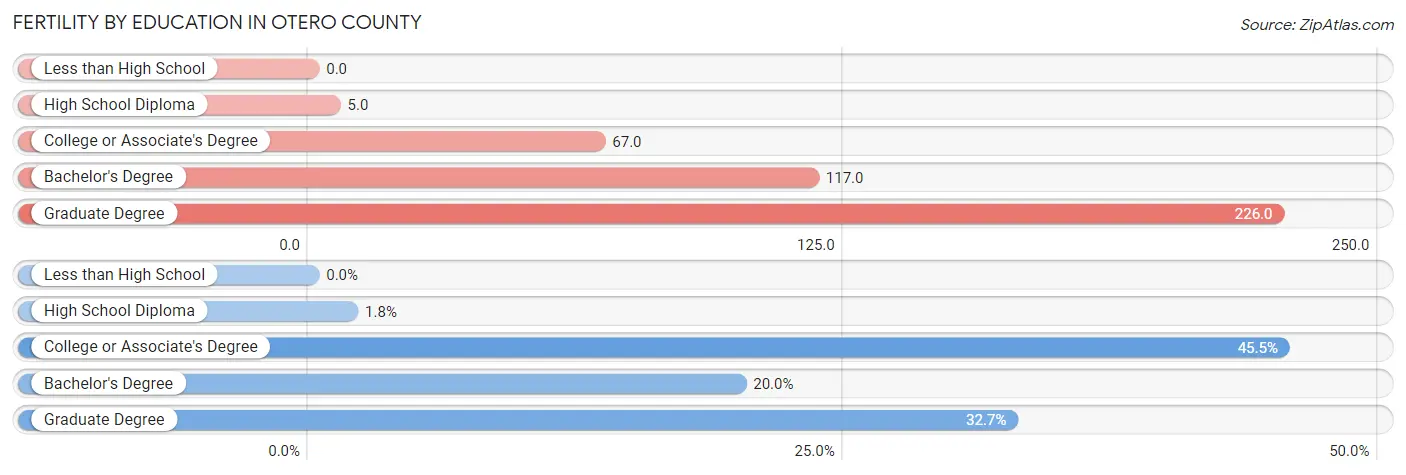
Fertility by Education in Otero County
| Educational Attainment | Women with Births | Births / 1,000 Women |
| Less than High School | 0 (0.0%) | 0.0 |
| High School Diploma | 4 (1.8%) | 5.0 |
| College or Associate's Degree | 100 (45.5%) | 67.0 |
| Bachelor's Degree | 44 (20.0%) | 117.0 |
| Graduate Degree | 72 (32.7%) | 226.0 |
| Total | 220 (100.0%) | 57.0 |
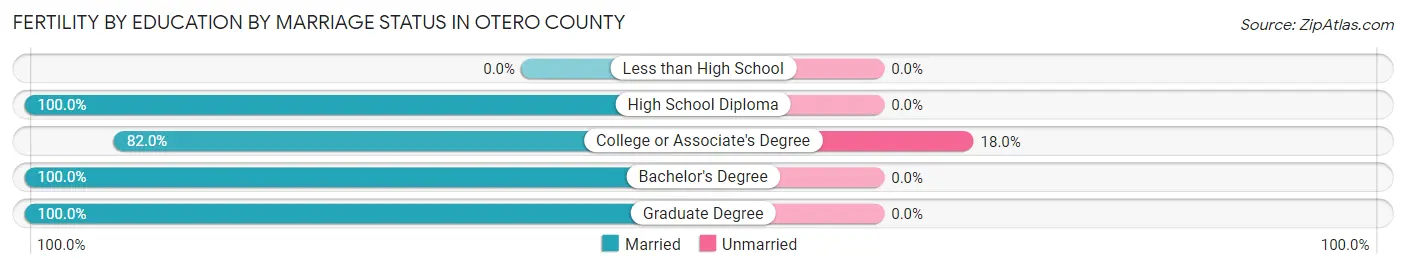
Fertility by Education by Marriage Status in Otero County
8.2% of women with births in Otero County are unmarried. Women with the educational attainment of high school diploma are most likely to be married with 100.0% of them married at childbirth, while women with the educational attainment of college or associate's degree are least likely to be married with 18.0% of them unmarried at childbirth.
| Educational Attainment | Married | Unmarried |
| Less than High School | 0 (0.0%) | 0 (0.0%) |
| High School Diploma | 4 (100.0%) | 0 (0.0%) |
| College or Associate's Degree | 82 (82.0%) | 18 (18.0%) |
| Bachelor's Degree | 44 (100.0%) | 0 (0.0%) |
| Graduate Degree | 72 (100.0%) | 0 (0.0%) |
| Total | 202 (91.8%) | 18 (8.2%) |
Income in Otero County
Income Overview in Otero County
Per Capita Income in Otero County is $25,789, while median incomes of families and households are $62,013 and $47,500 respectively.
| Characteristic | Number | Measure |
| Per Capita Income | 18,580 | $25,789 |
| Median Family Income | 4,719 | $62,013 |
| Mean Family Income | 4,719 | $74,024 |
| Median Household Income | 7,594 | $47,500 |
| Mean Household Income | 7,594 | $61,974 |
| Income Deficit | 4,719 | $11,190 |
| Wage / Income Gap (%) | 18,580 | 24.32% |
| Wage / Income Gap ($) | 18,580 | 75.68¢ per $1 |
| Gini / Inequality Index | 18,580 | 0.43 |
Earnings by Sex in Otero County
Average Earnings in Otero County are $33,006, $37,102 for men and $28,077 for women, a difference of 24.3%.
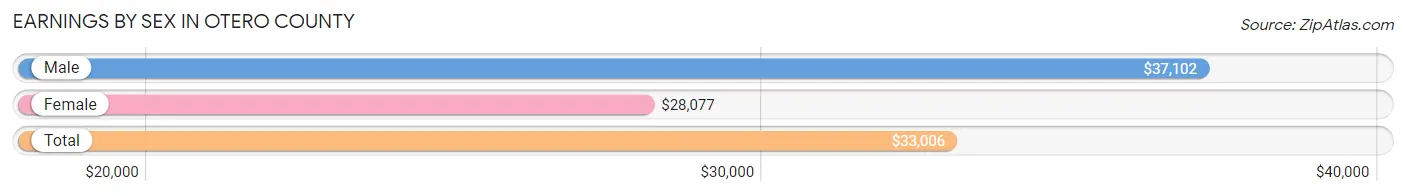
| Sex | Number | Average Earnings |
| Male | 4,310 (52.4%) | $37,102 |
| Female | 3,916 (47.6%) | $28,077 |
| Total | 8,226 (100.0%) | $33,006 |
Earnings by Sex by Income Bracket in Otero County
The most common earnings brackets in Otero County are $30,000 to $34,999 for men (556 | 12.9%) and $2,499 or less for women (460 | 11.7%).
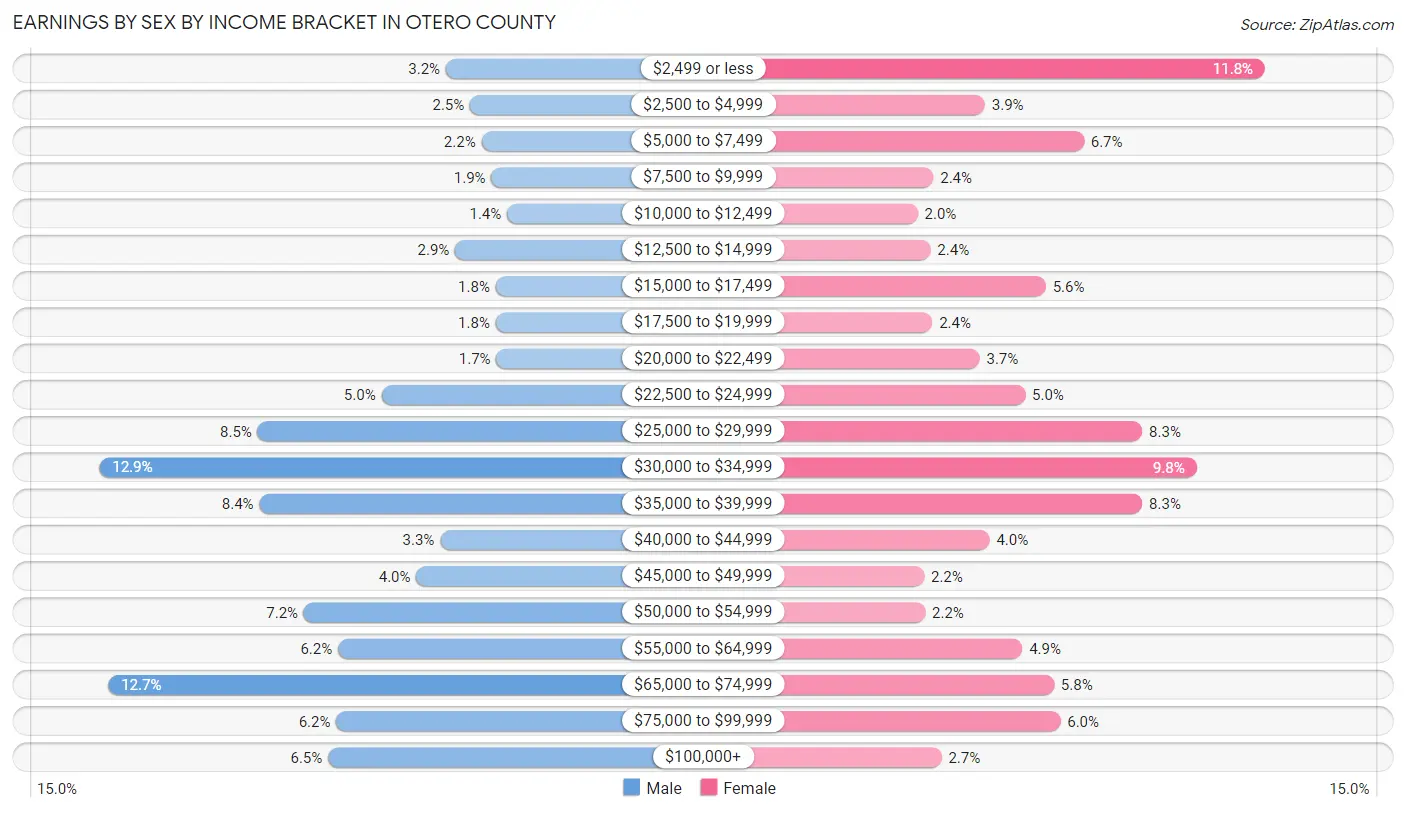
| Income | Male | Female |
| $2,499 or less | 136 (3.2%) | 460 (11.7%) |
| $2,500 to $4,999 | 107 (2.5%) | 152 (3.9%) |
| $5,000 to $7,499 | 93 (2.2%) | 261 (6.7%) |
| $7,500 to $9,999 | 81 (1.9%) | 95 (2.4%) |
| $10,000 to $12,499 | 62 (1.4%) | 78 (2.0%) |
| $12,500 to $14,999 | 125 (2.9%) | 92 (2.4%) |
| $15,000 to $17,499 | 76 (1.8%) | 219 (5.6%) |
| $17,500 to $19,999 | 76 (1.8%) | 94 (2.4%) |
| $20,000 to $22,499 | 75 (1.7%) | 146 (3.7%) |
| $22,500 to $24,999 | 214 (5.0%) | 196 (5.0%) |
| $25,000 to $29,999 | 364 (8.5%) | 325 (8.3%) |
| $30,000 to $34,999 | 556 (12.9%) | 385 (9.8%) |
| $35,000 to $39,999 | 362 (8.4%) | 325 (8.3%) |
| $40,000 to $44,999 | 143 (3.3%) | 157 (4.0%) |
| $45,000 to $49,999 | 172 (4.0%) | 85 (2.2%) |
| $50,000 to $54,999 | 308 (7.1%) | 86 (2.2%) |
| $55,000 to $64,999 | 267 (6.2%) | 193 (4.9%) |
| $65,000 to $74,999 | 545 (12.7%) | 228 (5.8%) |
| $75,000 to $99,999 | 269 (6.2%) | 235 (6.0%) |
| $100,000+ | 279 (6.5%) | 104 (2.7%) |
| Total | 4,310 (100.0%) | 3,916 (100.0%) |
Earnings by Sex by Educational Attainment in Otero County
Average earnings in Otero County are $40,609 for men and $30,291 for women, a difference of 25.4%. Men with an educational attainment of graduate degree enjoy the highest average annual earnings of $63,657, while those with less than high school education earn the least with $32,850. Women with an educational attainment of graduate degree earn the most with the average annual earnings of $68,337, while those with less than high school education have the smallest earnings of $16,379.
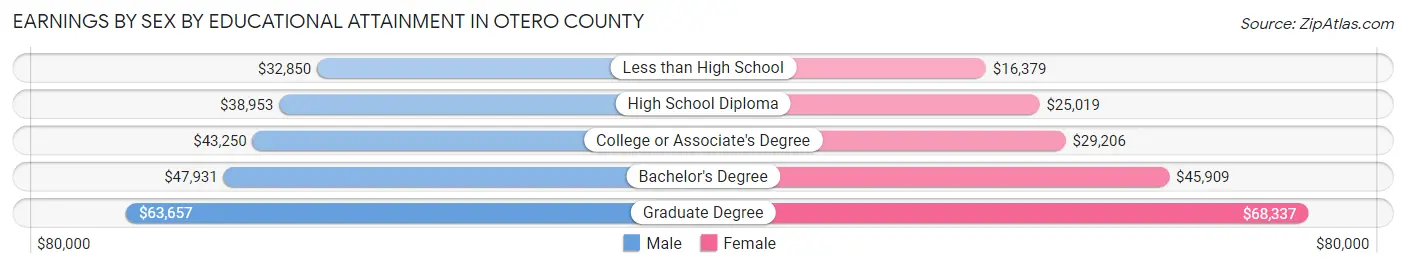
| Educational Attainment | Male Income | Female Income |
| Less than High School | $32,850 | $16,379 |
| High School Diploma | $38,953 | $25,019 |
| College or Associate's Degree | $43,250 | $29,206 |
| Bachelor's Degree | $47,931 | $45,909 |
| Graduate Degree | $63,657 | $68,337 |
| Total | $40,609 | $30,291 |
Family Income in Otero County
Family Income Brackets in Otero County
According to the Otero County family income data, there are 1,128 families falling into the $50,000 to $74,999 income range, which is the most common income bracket and makes up 23.9% of all families. Conversely, the $10,000 to $14,999 income bracket is the least frequent group with only 47 families (1.0%) belonging to this category.
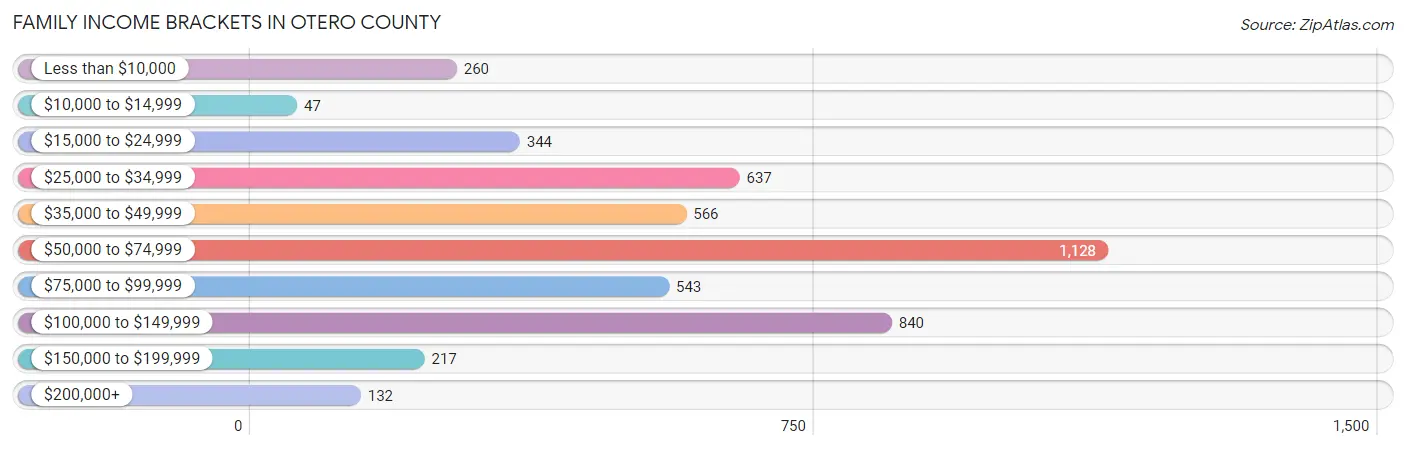
| Income Bracket | # Families | % Families |
| Less than $10,000 | 260 | 5.5% |
| $10,000 to $14,999 | 47 | 1.0% |
| $15,000 to $24,999 | 344 | 7.3% |
| $25,000 to $34,999 | 637 | 13.5% |
| $35,000 to $49,999 | 566 | 12.0% |
| $50,000 to $74,999 | 1,128 | 23.9% |
| $75,000 to $99,999 | 543 | 11.5% |
| $100,000 to $149,999 | 840 | 17.8% |
| $150,000 to $199,999 | 217 | 4.6% |
| $200,000+ | 132 | 2.8% |
Family Income by Famaliy Size in Otero County
2-person families (2,333 | 49.4%) account for the highest median family income in Otero County with $70,405 per family, while 2-person families (2,333 | 49.4%) have the highest median income of $35,202 per family member.
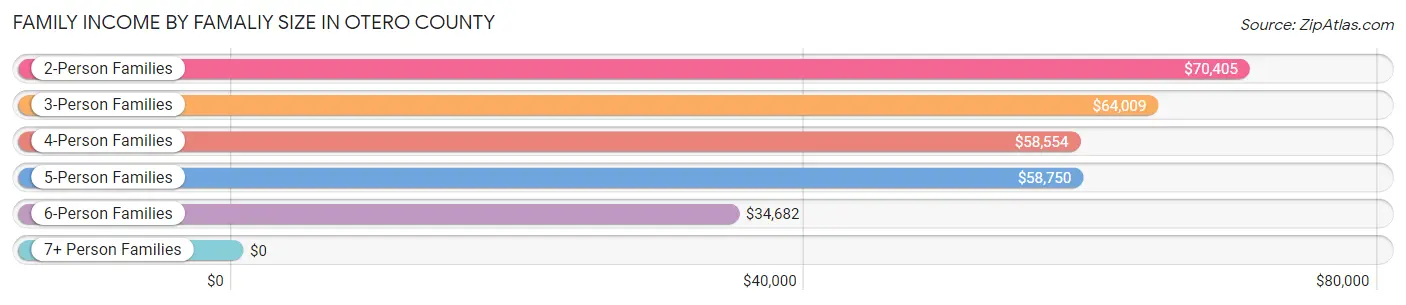
| Income Bracket | # Families | Median Income |
| 2-Person Families | 2,333 (49.4%) | $70,405 |
| 3-Person Families | 1,017 (21.5%) | $64,009 |
| 4-Person Families | 659 (14.0%) | $58,554 |
| 5-Person Families | 238 (5.0%) | $58,750 |
| 6-Person Families | 404 (8.6%) | $34,682 |
| 7+ Person Families | 68 (1.4%) | $0 |
| Total | 4,719 (100.0%) | $62,013 |
Family Income by Number of Earners in Otero County
The median family income in Otero County is $62,013, with families comprising 3+ earners (345) having the highest median family income of $132,708, while families with 1 earner (1,598) have the lowest median family income of $40,690, accounting for 7.3% and 33.9% of families, respectively.
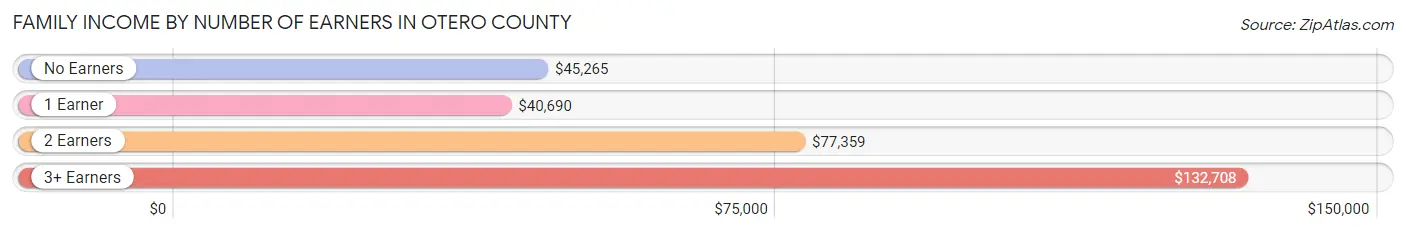
| Number of Earners | # Families | Median Income |
| No Earners | 1,085 (23.0%) | $45,265 |
| 1 Earner | 1,598 (33.9%) | $40,690 |
| 2 Earners | 1,691 (35.8%) | $77,359 |
| 3+ Earners | 345 (7.3%) | $132,708 |
| Total | 4,719 (100.0%) | $62,013 |
Household Income in Otero County
Household Income Brackets in Otero County
With 1,564 households falling in the category, the $50,000 to $74,999 income range is the most frequent in Otero County, accounting for 20.6% of all households. In contrast, only 137 households (1.8%) fall into the $200,000+ income bracket, making it the least populous group.
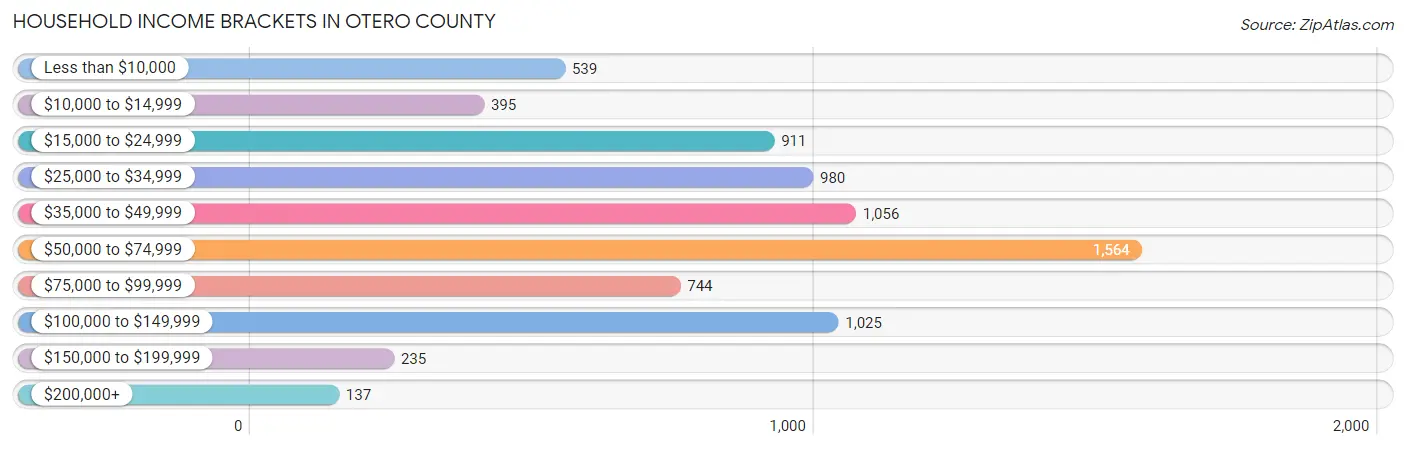
| Income Bracket | # Households | % Households |
| Less than $10,000 | 539 | 7.1% |
| $10,000 to $14,999 | 395 | 5.2% |
| $15,000 to $24,999 | 911 | 12.0% |
| $25,000 to $34,999 | 980 | 12.9% |
| $35,000 to $49,999 | 1,056 | 13.9% |
| $50,000 to $74,999 | 1,564 | 20.6% |
| $75,000 to $99,999 | 744 | 9.8% |
| $100,000 to $149,999 | 1,025 | 13.5% |
| $150,000 to $199,999 | 235 | 3.1% |
| $200,000+ | 137 | 1.8% |
Household Income by Householder Age in Otero County
The median household income in Otero County is $47,500, with the highest median household income of $59,081 found in the 45 to 64 years age bracket for the primary householder. A total of 2,631 households (34.6%) fall into this category. Meanwhile, the 15 to 24 years age bracket for the primary householder has the lowest median household income of $25,784, with 248 households (3.3%) in this group.
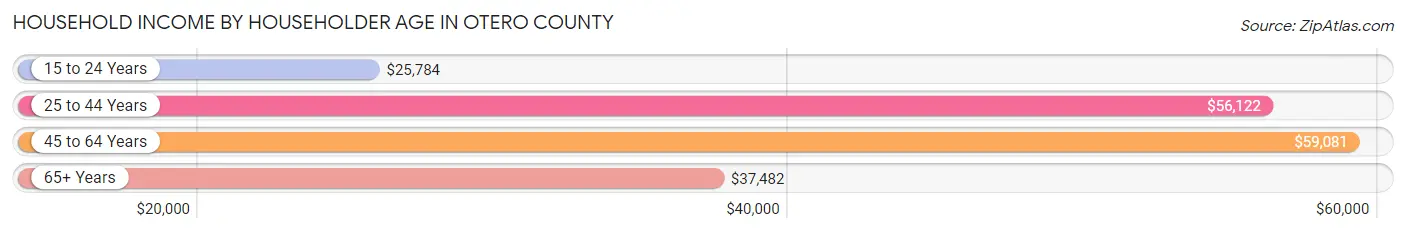
| Income Bracket | # Households | Median Income |
| 15 to 24 Years | 248 (3.3%) | $25,784 |
| 25 to 44 Years | 2,173 (28.6%) | $56,122 |
| 45 to 64 Years | 2,631 (34.6%) | $59,081 |
| 65+ Years | 2,542 (33.5%) | $37,482 |
| Total | 7,594 (100.0%) | $47,500 |
Poverty in Otero County
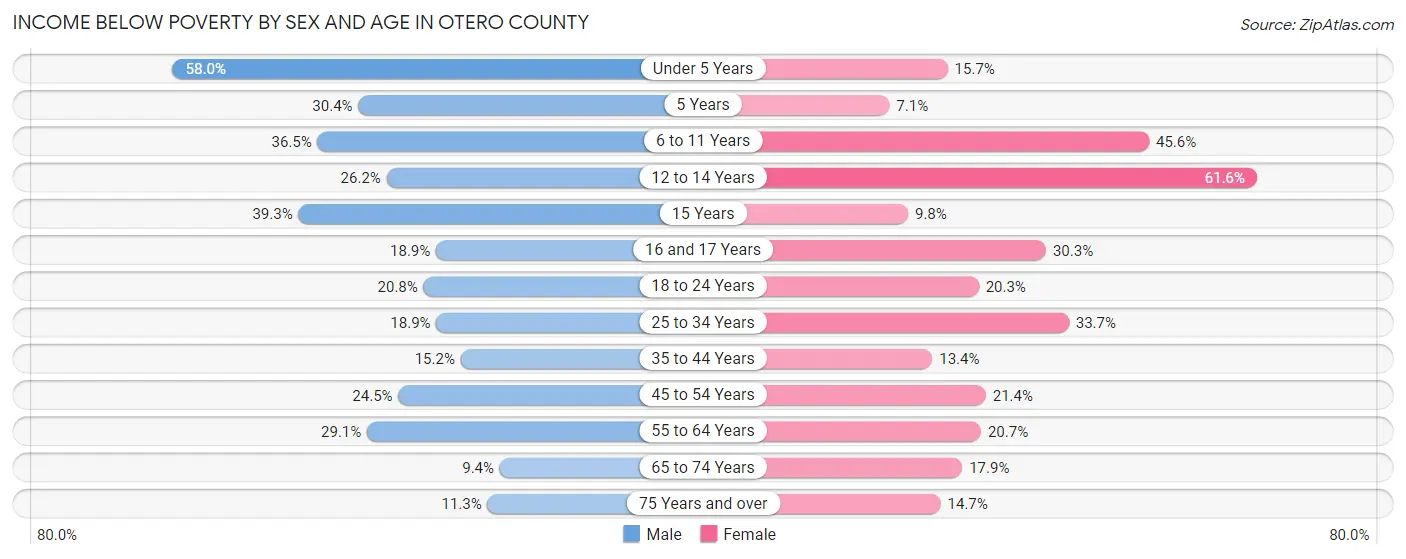
Income Below Poverty by Sex and Age in Otero County
With 23.8% poverty level for males and 24.2% for females among the residents of Otero County, under 5 year old males and 12 to 14 year old females are the most vulnerable to poverty, with 391 males (58.0%) and 273 females (61.6%) in their respective age groups living below the poverty level.
| Age Bracket | Male | Female |
| Under 5 Years | 391 (58.0%) | 58 (15.7%) |
| 5 Years | 42 (30.4%) | 7 (7.1%) |
| 6 to 11 Years | 231 (36.5%) | 318 (45.6%) |
| 12 to 14 Years | 111 (26.2%) | 273 (61.6%) |
| 15 Years | 94 (39.3%) | 6 (9.8%) |
| 16 and 17 Years | 34 (18.9%) | 94 (30.3%) |
| 18 to 24 Years | 150 (20.7%) | 134 (20.3%) |
| 25 to 34 Years | 200 (18.9%) | 330 (33.7%) |
| 35 to 44 Years | 184 (15.2%) | 157 (13.4%) |
| 45 to 54 Years | 215 (24.5%) | 208 (21.4%) |
| 55 to 64 Years | 354 (29.1%) | 254 (20.7%) |
| 65 to 74 Years | 110 (9.4%) | 196 (17.9%) |
| 75 Years and over | 74 (11.3%) | 125 (14.7%) |
| Total | 2,190 (23.8%) | 2,160 (24.2%) |
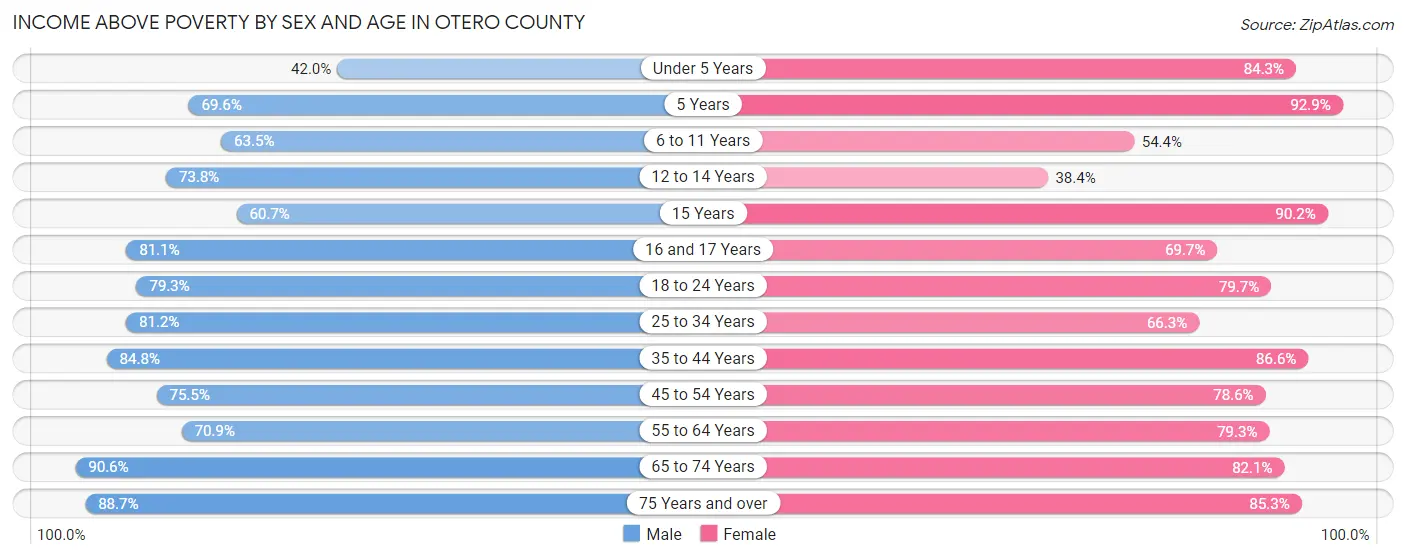
Income Above Poverty by Sex and Age in Otero County
According to the poverty statistics in Otero County, males aged 65 to 74 years and females aged 5 years are the age groups that are most secure financially, with 90.6% of males and 92.9% of females in these age groups living above the poverty line.
| Age Bracket | Male | Female |
| Under 5 Years | 283 (42.0%) | 311 (84.3%) |
| 5 Years | 96 (69.6%) | 92 (92.9%) |
| 6 to 11 Years | 402 (63.5%) | 379 (54.4%) |
| 12 to 14 Years | 312 (73.8%) | 170 (38.4%) |
| 15 Years | 145 (60.7%) | 55 (90.2%) |
| 16 and 17 Years | 146 (81.1%) | 216 (69.7%) |
| 18 to 24 Years | 573 (79.2%) | 525 (79.7%) |
| 25 to 34 Years | 861 (81.1%) | 649 (66.3%) |
| 35 to 44 Years | 1,023 (84.8%) | 1,011 (86.6%) |
| 45 to 54 Years | 663 (75.5%) | 765 (78.6%) |
| 55 to 64 Years | 861 (70.9%) | 975 (79.3%) |
| 65 to 74 Years | 1,057 (90.6%) | 900 (82.1%) |
| 75 Years and over | 583 (88.7%) | 727 (85.3%) |
| Total | 7,005 (76.2%) | 6,775 (75.8%) |
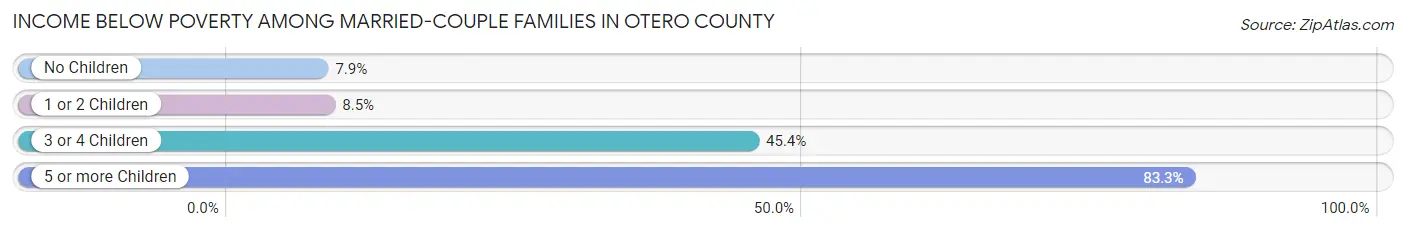
Income Below Poverty Among Married-Couple Families in Otero County
The poverty statistics for married-couple families in Otero County show that 14.1% or 464 of the total 3,294 families live below the poverty line. Families with 5 or more children have the highest poverty rate of 83.3%, comprising of 55 families. On the other hand, families with no children have the lowest poverty rate of 7.9%, which includes 153 families.
| Children | Above Poverty | Below Poverty |
| No Children | 1,791 (92.1%) | 153 (7.9%) |
| 1 or 2 Children | 810 (91.5%) | 75 (8.5%) |
| 3 or 4 Children | 218 (54.6%) | 181 (45.4%) |
| 5 or more Children | 11 (16.7%) | 55 (83.3%) |
| Total | 2,830 (85.9%) | 464 (14.1%) |
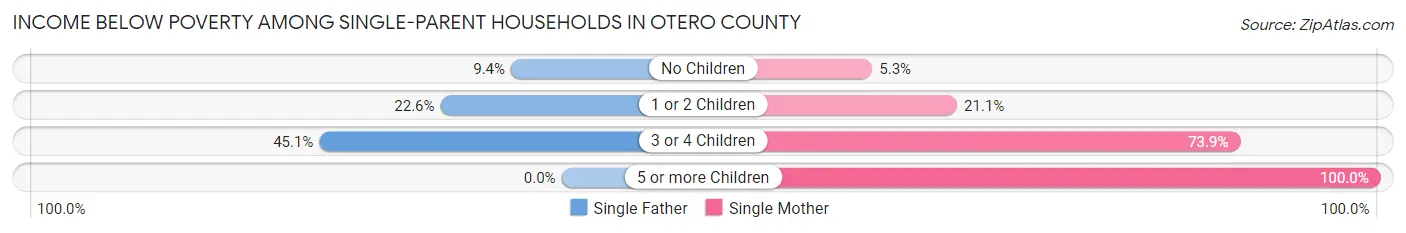
Income Below Poverty Among Single-Parent Households in Otero County
According to the poverty data in Otero County, 20.0% or 106 single-father households and 26.1% or 234 single-mother households are living below the poverty line. Among single-father households, those with 3 or 4 children have the highest poverty rate, with 51 households (45.1%) experiencing poverty. Likewise, among single-mother households, those with 5 or more children have the highest poverty rate, with 33 households (100.0%) falling below the poverty line.
| Children | Single Father | Single Mother |
| No Children | 25 (9.4%) | 21 (5.3%) |
| 1 or 2 Children | 30 (22.6%) | 67 (21.1%) |
| 3 or 4 Children | 51 (45.1%) | 113 (73.9%) |
| 5 or more Children | 0 (0.0%) | 33 (100.0%) |
| Total | 106 (20.0%) | 234 (26.1%) |
Income Below Poverty Among Married-Couple vs Single-Parent Households in Otero County
The poverty data for Otero County shows that 464 of the married-couple family households (14.1%) and 340 of the single-parent households (23.9%) are living below the poverty level. Within the married-couple family households, those with 5 or more children have the highest poverty rate, with 55 households (83.3%) falling below the poverty line. Among the single-parent households, those with 5 or more children have the highest poverty rate, with 33 household (64.7%) living below poverty.
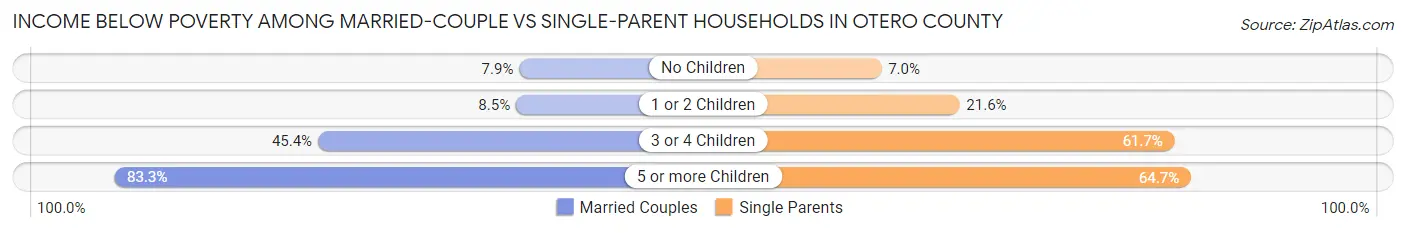
| Children | Married-Couple Families | Single-Parent Households |
| No Children | 153 (7.9%) | 46 (7.0%) |
| 1 or 2 Children | 75 (8.5%) | 97 (21.6%) |
| 3 or 4 Children | 181 (45.4%) | 164 (61.7%) |
| 5 or more Children | 55 (83.3%) | 33 (64.7%) |
| Total | 464 (14.1%) | 340 (23.9%) |
Employment Characteristics in Otero County
Employment by Class of Employer in Otero County
Among the 7,033 employed individuals in Otero County, private company employees (3,836 | 54.5%), local government employees (1,083 | 15.4%), and not-for-profit organizations (643 | 9.1%) make up the most common classes of employment.
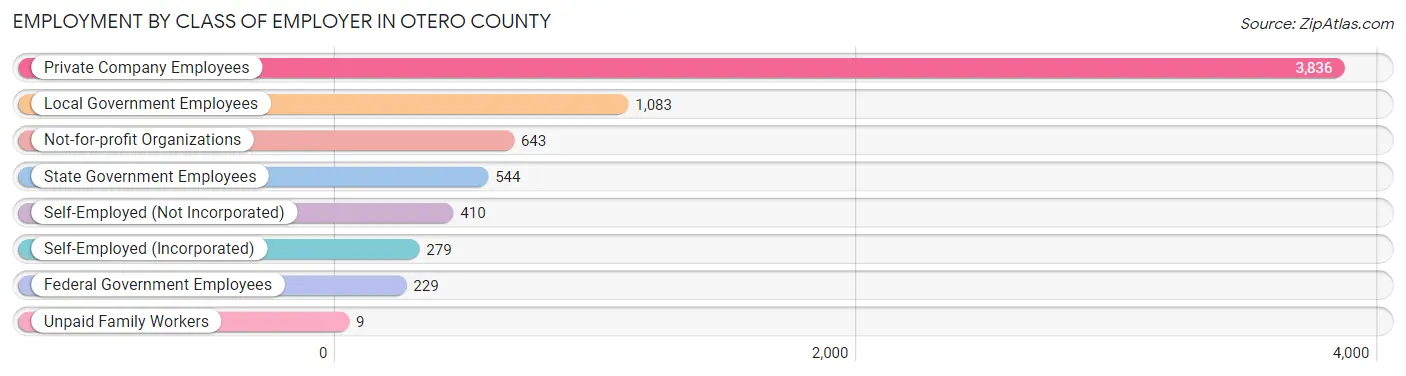
| Employer Class | # Employees | % Employees |
| Private Company Employees | 3,836 | 54.5% |
| Self-Employed (Incorporated) | 279 | 4.0% |
| Self-Employed (Not Incorporated) | 410 | 5.8% |
| Not-for-profit Organizations | 643 | 9.1% |
| Local Government Employees | 1,083 | 15.4% |
| State Government Employees | 544 | 7.7% |
| Federal Government Employees | 229 | 3.3% |
| Unpaid Family Workers | 9 | 0.1% |
| Total | 7,033 | 100.0% |
Employment Status by Age in Otero County
According to the labor force statistics for Otero County, out of the total population over 16 years of age (14,754), 51.6% or 7,613 individuals are in the labor force, with 5.9% or 449 of them unemployed. The age group with the highest labor force participation rate is 25 to 29 years, with 86.3% or 884 individuals in the labor force. Within the labor force, the 16 to 19 years age range has the highest percentage of unemployed individuals, with 21.9% or 42 of them being unemployed.
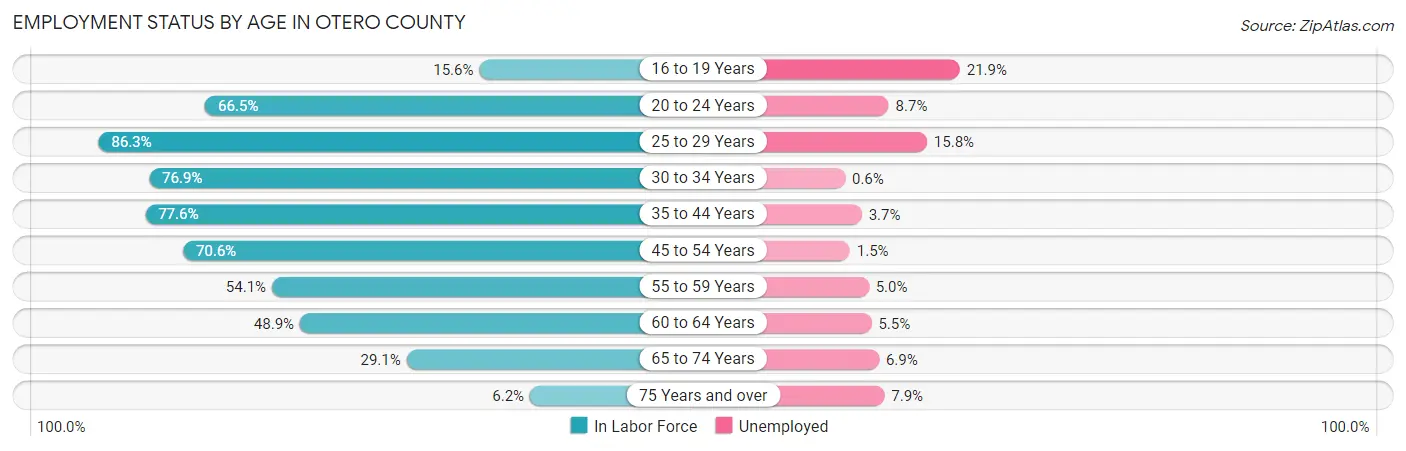
| Age Bracket | In Labor Force | Unemployed |
| 16 to 19 Years | 192 (15.6%) | 42 (21.9%) |
| 20 to 24 Years | 585 (66.5%) | 51 (8.7%) |
| 25 to 29 Years | 884 (86.3%) | 140 (15.8%) |
| 30 to 34 Years | 782 (76.9%) | 5 (0.6%) |
| 35 to 44 Years | 1,844 (77.6%) | 68 (3.7%) |
| 45 to 54 Years | 1,307 (70.6%) | 20 (1.5%) |
| 55 to 59 Years | 603 (54.1%) | 30 (5.0%) |
| 60 to 64 Years | 655 (48.9%) | 36 (5.5%) |
| 65 to 74 Years | 663 (29.1%) | 46 (6.9%) |
| 75 Years and over | 102 (6.2%) | 8 (7.9%) |
| Total | 7,613 (51.6%) | 449 (5.9%) |
Employment Status by Educational Attainment in Otero County
According to labor force statistics for Otero County, 69.7% of individuals (6,079) out of the total population between 25 and 64 years of age (8,721) are in the labor force, with 4.9% or 298 of them being unemployed. The group with the highest labor force participation rate are those with the educational attainment of bachelor's degree or higher, with 76.5% or 1,182 individuals in the labor force. Within the labor force, individuals with less than high school education have the highest percentage of unemployment, with 21.3% or 134 of them being unemployed.
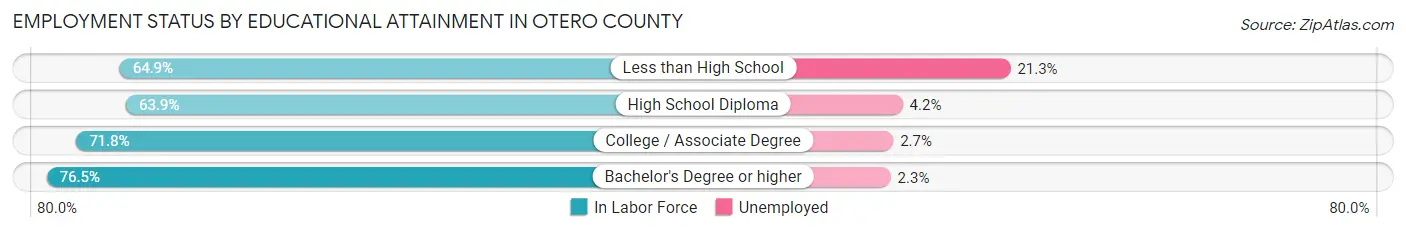
| Educational Attainment | In Labor Force | Unemployed |
| Less than High School | 628 (64.9%) | 206 (21.3%) |
| High School Diploma | 1,574 (63.9%) | 103 (4.2%) |
| College / Associate Degree | 2,689 (71.8%) | 101 (2.7%) |
| Bachelor's Degree or higher | 1,182 (76.5%) | 36 (2.3%) |
| Total | 6,079 (69.7%) | 427 (4.9%) |
Employment Occupations by Sex in Otero County
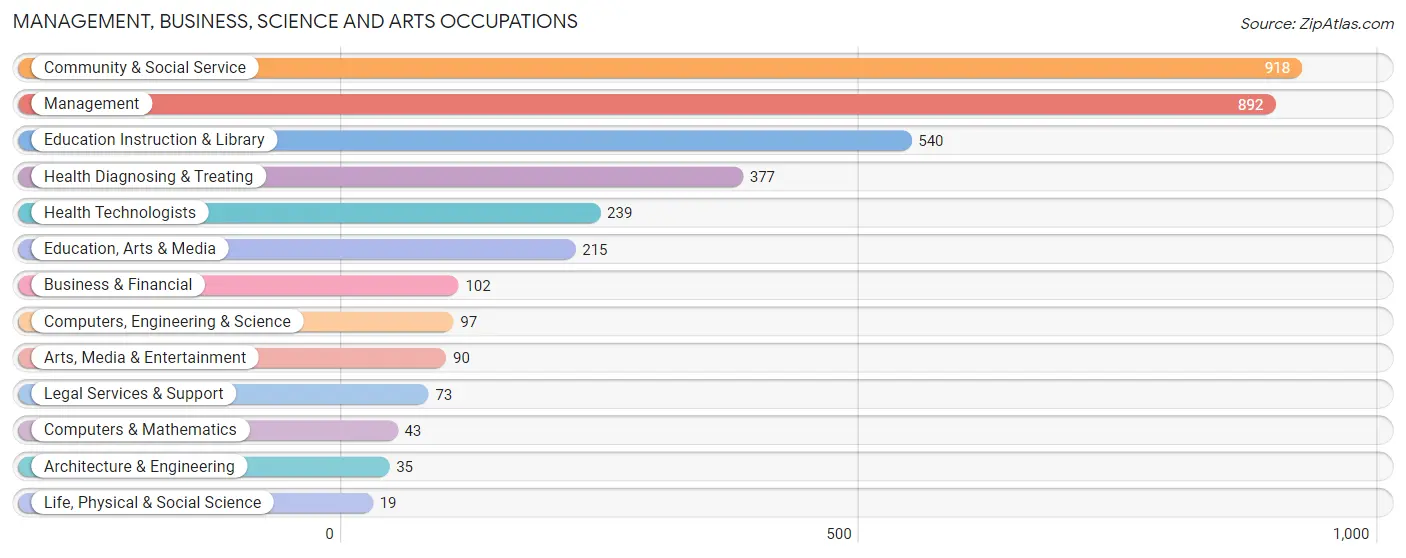
Management, Business, Science and Arts Occupations
The most common Management, Business, Science and Arts occupations in Otero County are Community & Social Service (918 | 12.8%), Management (892 | 12.4%), Education Instruction & Library (540 | 7.5%), Health Diagnosing & Treating (377 | 5.3%), and Health Technologists (239 | 3.3%).
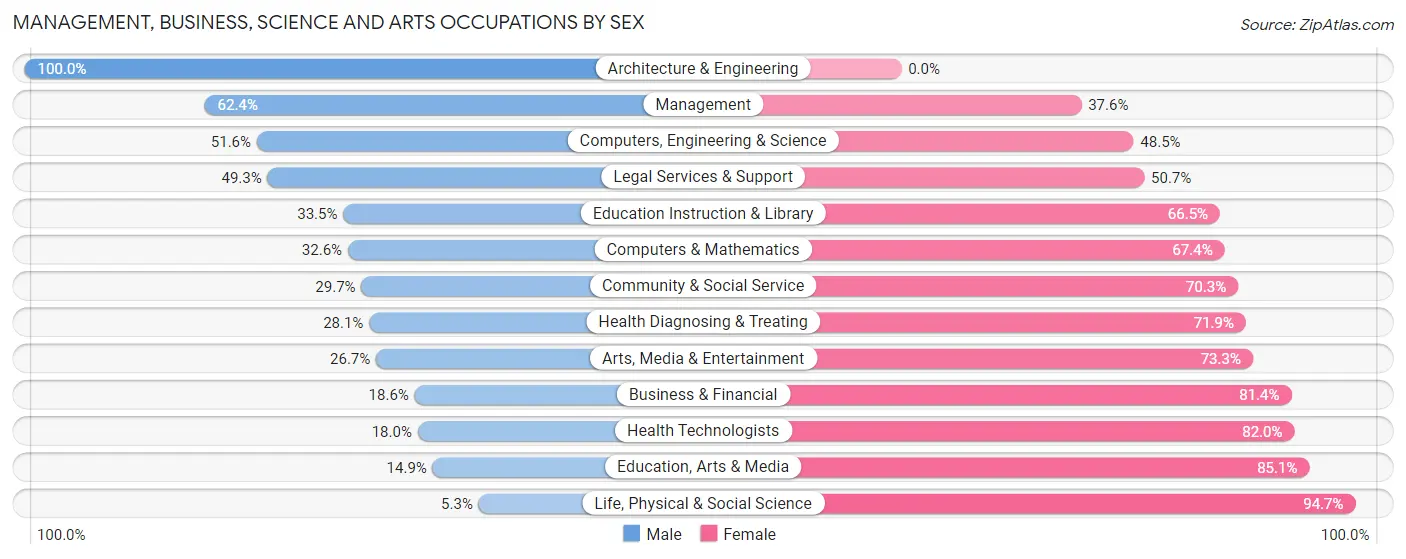
Management, Business, Science and Arts Occupations by Sex
Within the Management, Business, Science and Arts occupations in Otero County, the most male-oriented occupations are Architecture & Engineering (100.0%), Management (62.4%), and Computers, Engineering & Science (51.5%), while the most female-oriented occupations are Life, Physical & Social Science (94.7%), Education, Arts & Media (85.1%), and Health Technologists (82.0%).
| Occupation | Male | Female |
| Management | 557 (62.4%) | 335 (37.6%) |
| Business & Financial | 19 (18.6%) | 83 (81.4%) |
| Computers, Engineering & Science | 50 (51.5%) | 47 (48.4%) |
| Computers & Mathematics | 14 (32.6%) | 29 (67.4%) |
| Architecture & Engineering | 35 (100.0%) | 0 (0.0%) |
| Life, Physical & Social Science | 1 (5.3%) | 18 (94.7%) |
| Community & Social Service | 273 (29.7%) | 645 (70.3%) |
| Education, Arts & Media | 32 (14.9%) | 183 (85.1%) |
| Legal Services & Support | 36 (49.3%) | 37 (50.7%) |
| Education Instruction & Library | 181 (33.5%) | 359 (66.5%) |
| Arts, Media & Entertainment | 24 (26.7%) | 66 (73.3%) |
| Health Diagnosing & Treating | 106 (28.1%) | 271 (71.9%) |
| Health Technologists | 43 (18.0%) | 196 (82.0%) |
| Total (Category) | 1,005 (42.1%) | 1,381 (57.9%) |
| Total (Overall) | 3,879 (54.1%) | 3,290 (45.9%) |
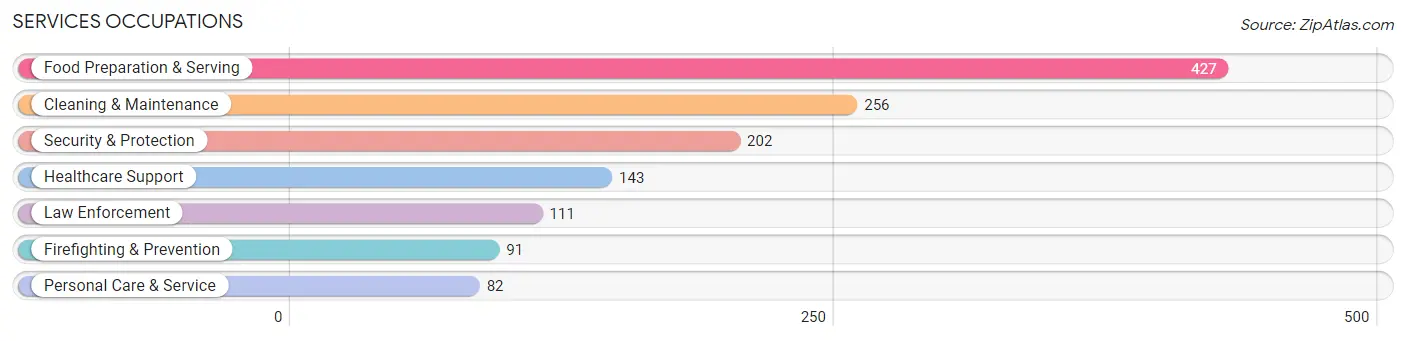
Services Occupations
The most common Services occupations in Otero County are Food Preparation & Serving (427 | 6.0%), Cleaning & Maintenance (256 | 3.6%), Security & Protection (202 | 2.8%), Healthcare Support (143 | 2.0%), and Law Enforcement (111 | 1.5%).
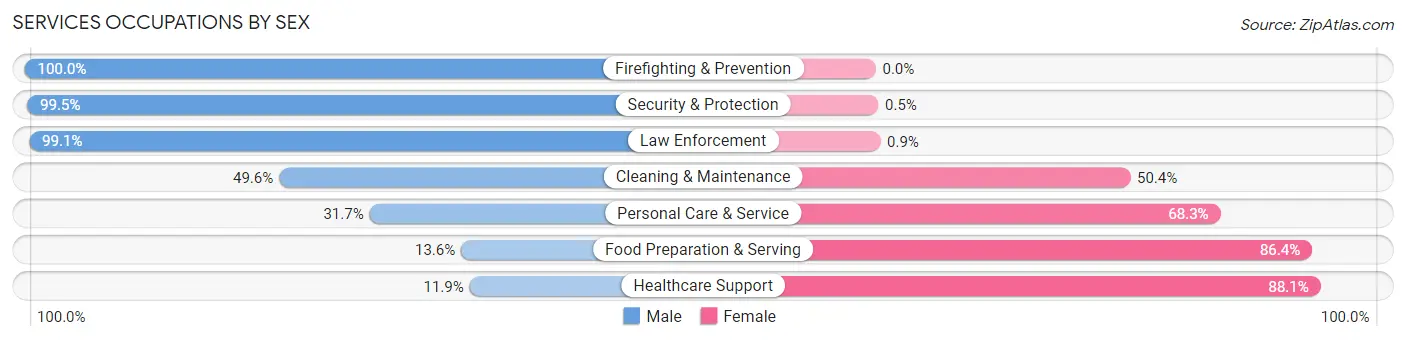
Services Occupations by Sex
Within the Services occupations in Otero County, the most male-oriented occupations are Firefighting & Prevention (100.0%), Security & Protection (99.5%), and Law Enforcement (99.1%), while the most female-oriented occupations are Healthcare Support (88.1%), Food Preparation & Serving (86.4%), and Personal Care & Service (68.3%).
| Occupation | Male | Female |
| Healthcare Support | 17 (11.9%) | 126 (88.1%) |
| Security & Protection | 201 (99.5%) | 1 (0.5%) |
| Firefighting & Prevention | 91 (100.0%) | 0 (0.0%) |
| Law Enforcement | 110 (99.1%) | 1 (0.9%) |
| Food Preparation & Serving | 58 (13.6%) | 369 (86.4%) |
| Cleaning & Maintenance | 127 (49.6%) | 129 (50.4%) |
| Personal Care & Service | 26 (31.7%) | 56 (68.3%) |
| Total (Category) | 429 (38.7%) | 681 (61.4%) |
| Total (Overall) | 3,879 (54.1%) | 3,290 (45.9%) |
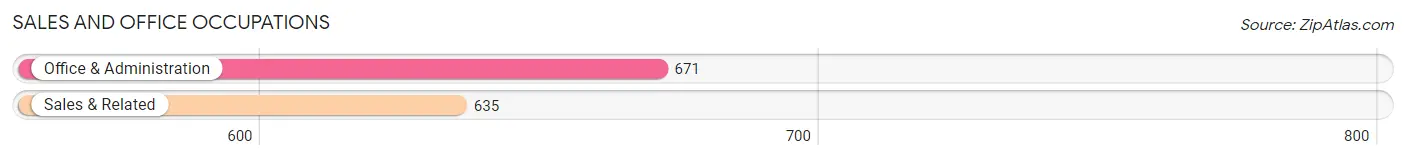
Sales and Office Occupations
The most common Sales and Office occupations in Otero County are Office & Administration (671 | 9.4%), and Sales & Related (635 | 8.9%).
Sales and Office Occupations by Sex
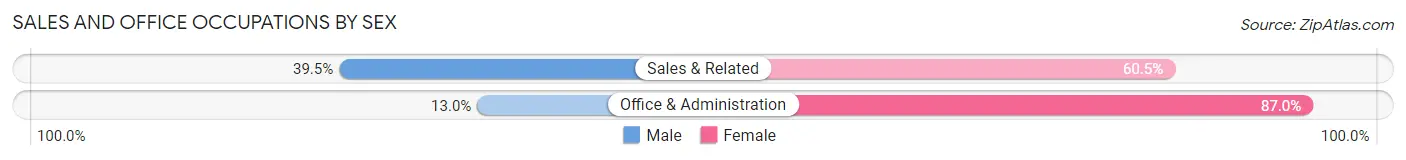
| Occupation | Male | Female |
| Sales & Related | 251 (39.5%) | 384 (60.5%) |
| Office & Administration | 87 (13.0%) | 584 (87.0%) |
| Total (Category) | 338 (25.9%) | 968 (74.1%) |
| Total (Overall) | 3,879 (54.1%) | 3,290 (45.9%) |
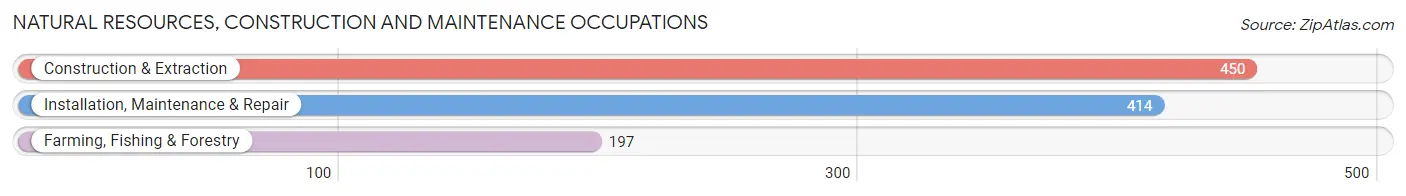
Natural Resources, Construction and Maintenance Occupations
The most common Natural Resources, Construction and Maintenance occupations in Otero County are Construction & Extraction (450 | 6.3%), Installation, Maintenance & Repair (414 | 5.8%), and Farming, Fishing & Forestry (197 | 2.8%).
Natural Resources, Construction and Maintenance Occupations by Sex
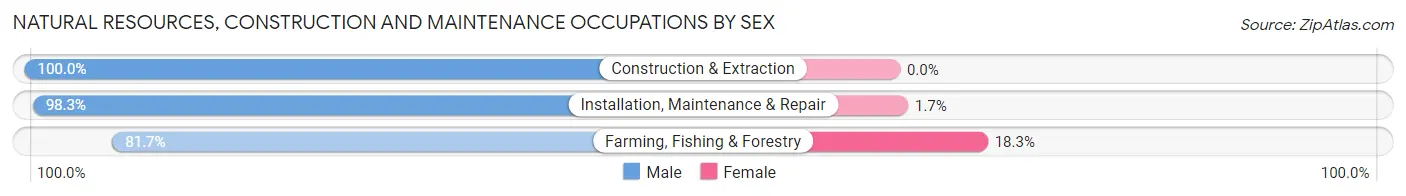
| Occupation | Male | Female |
| Farming, Fishing & Forestry | 161 (81.7%) | 36 (18.3%) |
| Construction & Extraction | 450 (100.0%) | 0 (0.0%) |
| Installation, Maintenance & Repair | 407 (98.3%) | 7 (1.7%) |
| Total (Category) | 1,018 (96.0%) | 43 (4.1%) |
| Total (Overall) | 3,879 (54.1%) | 3,290 (45.9%) |
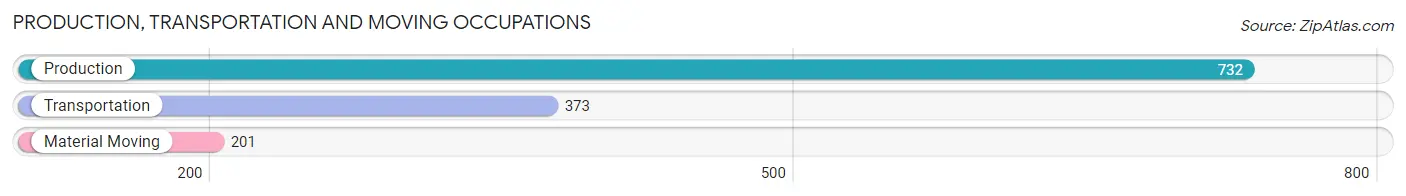
Production, Transportation and Moving Occupations
The most common Production, Transportation and Moving occupations in Otero County are Production (732 | 10.2%), Transportation (373 | 5.2%), and Material Moving (201 | 2.8%).
Production, Transportation and Moving Occupations by Sex
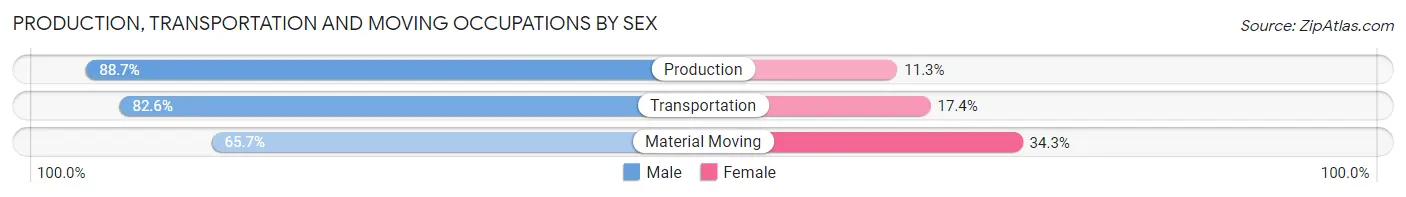
| Occupation | Male | Female |
| Production | 649 (88.7%) | 83 (11.3%) |
| Transportation | 308 (82.6%) | 65 (17.4%) |
| Material Moving | 132 (65.7%) | 69 (34.3%) |
| Total (Category) | 1,089 (83.4%) | 217 (16.6%) |
| Total (Overall) | 3,879 (54.1%) | 3,290 (45.9%) |
Employment Industries by Sex in Otero County
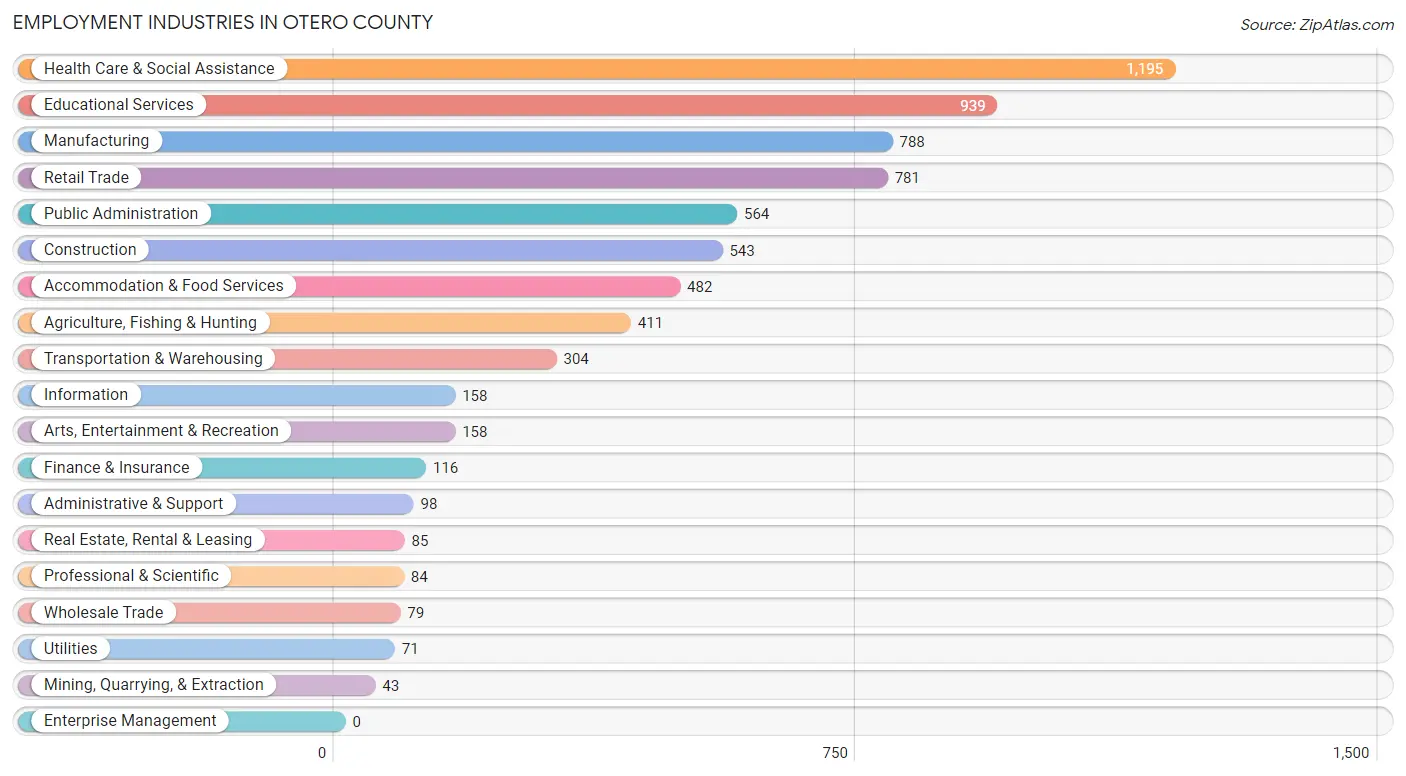
Employment Industries in Otero County
The major employment industries in Otero County include Health Care & Social Assistance (1,195 | 16.7%), Educational Services (939 | 13.1%), Manufacturing (788 | 11.0%), Retail Trade (781 | 10.9%), and Public Administration (564 | 7.9%).
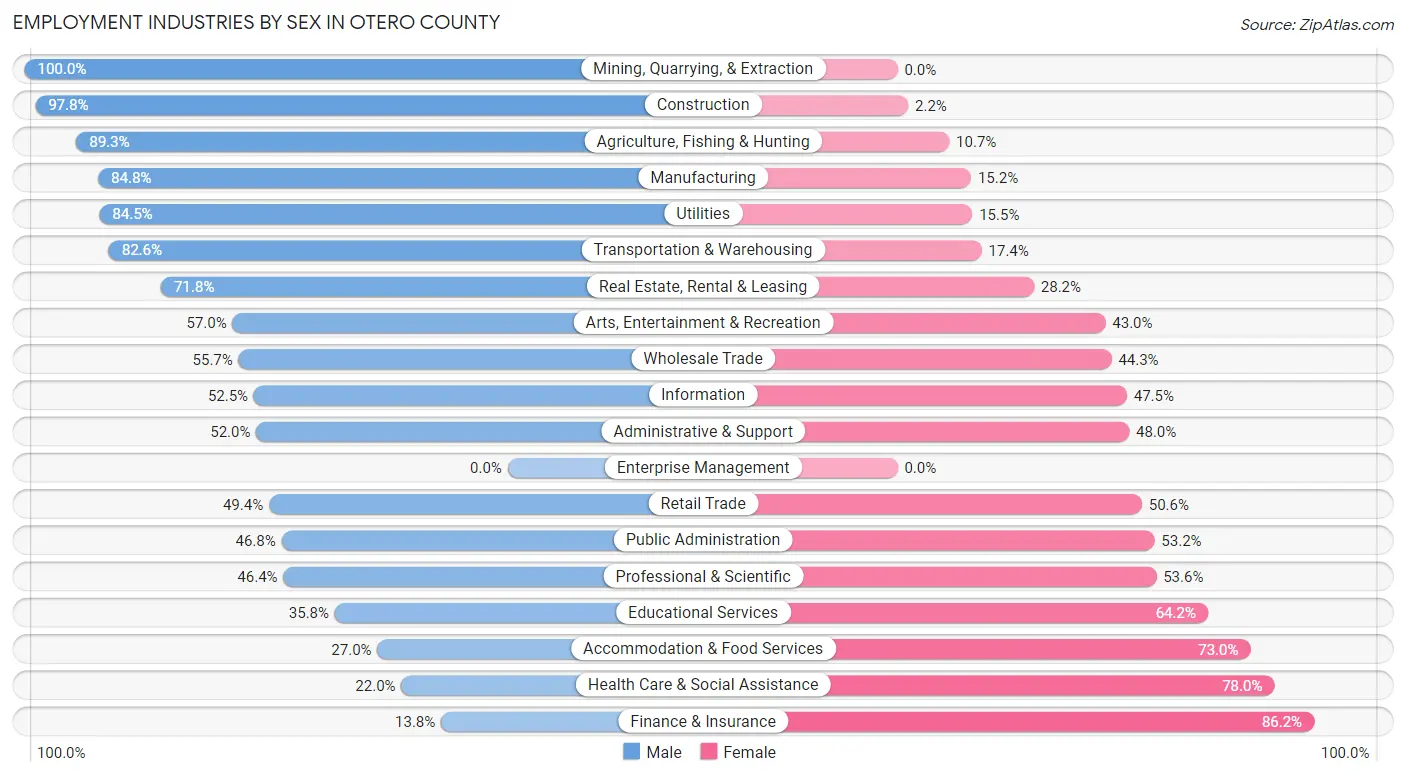
Employment Industries by Sex in Otero County
The Otero County industries that see more men than women are Mining, Quarrying, & Extraction (100.0%), Construction (97.8%), and Agriculture, Fishing & Hunting (89.3%), whereas the industries that tend to have a higher number of women are Finance & Insurance (86.2%), Health Care & Social Assistance (78.0%), and Accommodation & Food Services (73.0%).
| Industry | Male | Female |
| Agriculture, Fishing & Hunting | 367 (89.3%) | 44 (10.7%) |
| Mining, Quarrying, & Extraction | 43 (100.0%) | 0 (0.0%) |
| Construction | 531 (97.8%) | 12 (2.2%) |
| Manufacturing | 668 (84.8%) | 120 (15.2%) |
| Wholesale Trade | 44 (55.7%) | 35 (44.3%) |
| Retail Trade | 386 (49.4%) | 395 (50.6%) |
| Transportation & Warehousing | 251 (82.6%) | 53 (17.4%) |
| Utilities | 60 (84.5%) | 11 (15.5%) |
| Information | 83 (52.5%) | 75 (47.5%) |
| Finance & Insurance | 16 (13.8%) | 100 (86.2%) |
| Real Estate, Rental & Leasing | 61 (71.8%) | 24 (28.2%) |
| Professional & Scientific | 39 (46.4%) | 45 (53.6%) |
| Enterprise Management | 0 (0.0%) | 0 (0.0%) |
| Administrative & Support | 51 (52.0%) | 47 (48.0%) |
| Educational Services | 336 (35.8%) | 603 (64.2%) |
| Health Care & Social Assistance | 263 (22.0%) | 932 (78.0%) |
| Arts, Entertainment & Recreation | 90 (57.0%) | 68 (43.0%) |
| Accommodation & Food Services | 130 (27.0%) | 352 (73.0%) |
| Public Administration | 264 (46.8%) | 300 (53.2%) |
| Total | 3,879 (54.1%) | 3,290 (45.9%) |
Education in Otero County
School Enrollment in Otero County
The most common levels of schooling among the 4,564 students in Otero County are middle school (1,216 | 26.6%), high school (1,067 | 23.4%), and college / undergraduate (856 | 18.8%).
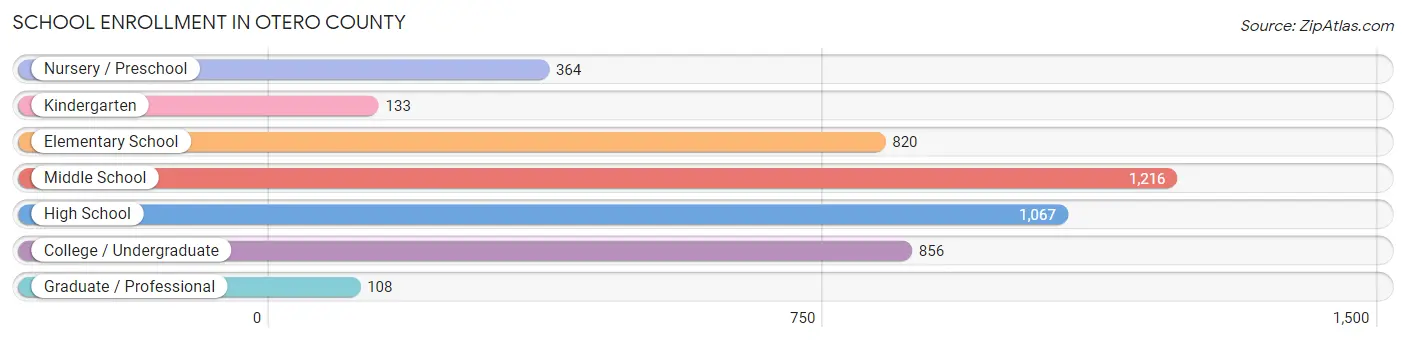
| School Level | # Students | % Students |
| Nursery / Preschool | 364 | 8.0% |
| Kindergarten | 133 | 2.9% |
| Elementary School | 820 | 18.0% |
| Middle School | 1,216 | 26.6% |
| High School | 1,067 | 23.4% |
| College / Undergraduate | 856 | 18.8% |
| Graduate / Professional | 108 | 2.4% |
| Total | 4,564 | 100.0% |
School Enrollment by Age by Funding Source in Otero County
Out of a total of 4,564 students who are enrolled in schools in Otero County, 475 (10.4%) attend a private institution, while the remaining 4,089 (89.6%) are enrolled in public schools. The age group of 18 to 19 year olds has the highest likelihood of being enrolled in private schools, with 139 (26.0% in the age bracket) enrolled. Conversely, the age group of 25 to 34 year olds has the lowest likelihood of being enrolled in a private school, with 133 (100.0% in the age bracket) attending a public institution.
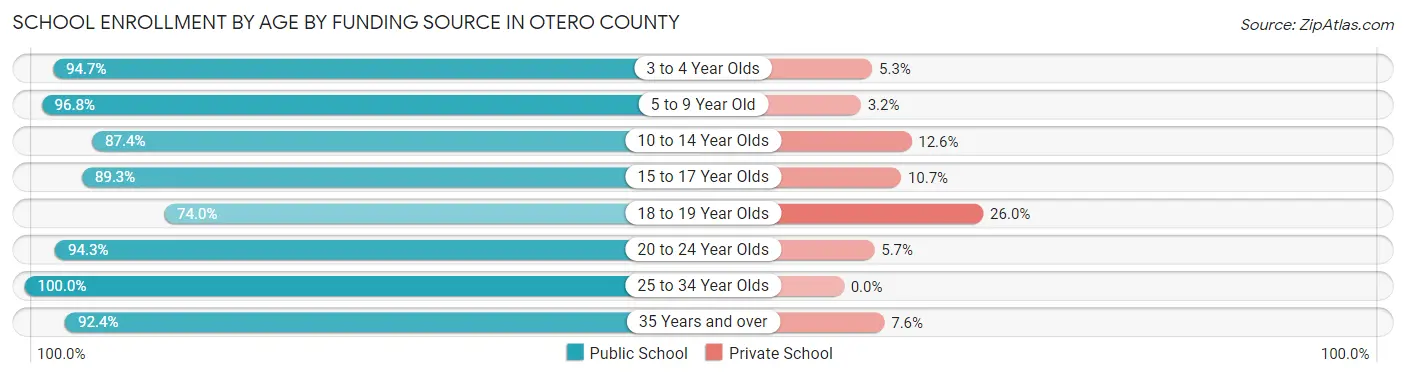
| Age Bracket | Public School | Private School |
| 3 to 4 Year Olds | 286 (94.7%) | 16 (5.3%) |
| 5 to 9 Year Old | 945 (96.8%) | 31 (3.2%) |
| 10 to 14 Year Olds | 1,180 (87.4%) | 170 (12.6%) |
| 15 to 17 Year Olds | 728 (89.3%) | 87 (10.7%) |
| 18 to 19 Year Olds | 396 (74.0%) | 139 (26.0%) |
| 20 to 24 Year Olds | 215 (94.3%) | 13 (5.7%) |
| 25 to 34 Year Olds | 133 (100.0%) | 0 (0.0%) |
| 35 Years and over | 208 (92.4%) | 17 (7.6%) |
| Total | 4,089 (89.6%) | 475 (10.4%) |
Educational Attainment by Field of Study in Otero County
Education (544 | 21.3%), business (400 | 15.6%), arts & humanities (260 | 10.2%), science & technology (259 | 10.1%), and bio, nature & agricultural (209 | 8.2%) are the most common fields of study among 2,557 individuals in Otero County who have obtained a bachelor's degree or higher.
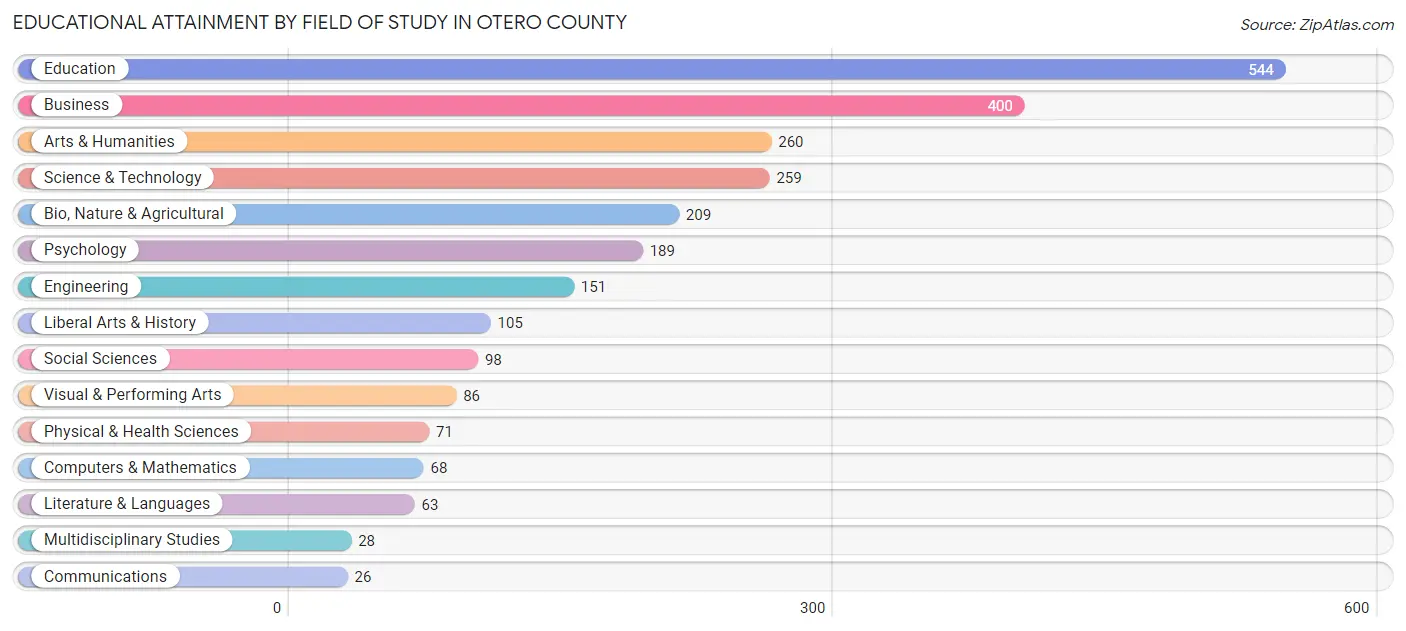
| Field of Study | # Graduates | % Graduates |
| Computers & Mathematics | 68 | 2.7% |
| Bio, Nature & Agricultural | 209 | 8.2% |
| Physical & Health Sciences | 71 | 2.8% |
| Psychology | 189 | 7.4% |
| Social Sciences | 98 | 3.8% |
| Engineering | 151 | 5.9% |
| Multidisciplinary Studies | 28 | 1.1% |
| Science & Technology | 259 | 10.1% |
| Business | 400 | 15.6% |
| Education | 544 | 21.3% |
| Literature & Languages | 63 | 2.5% |
| Liberal Arts & History | 105 | 4.1% |
| Visual & Performing Arts | 86 | 3.4% |
| Communications | 26 | 1.0% |
| Arts & Humanities | 260 | 10.2% |
| Total | 2,557 | 100.0% |
Transportation & Commute in Otero County
Vehicle Availability by Sex in Otero County
The most prevalent vehicle ownership categories in Otero County are males with 2 vehicles (1,157, accounting for 30.6%) and females with 2 vehicles (787, making up 36.1%).
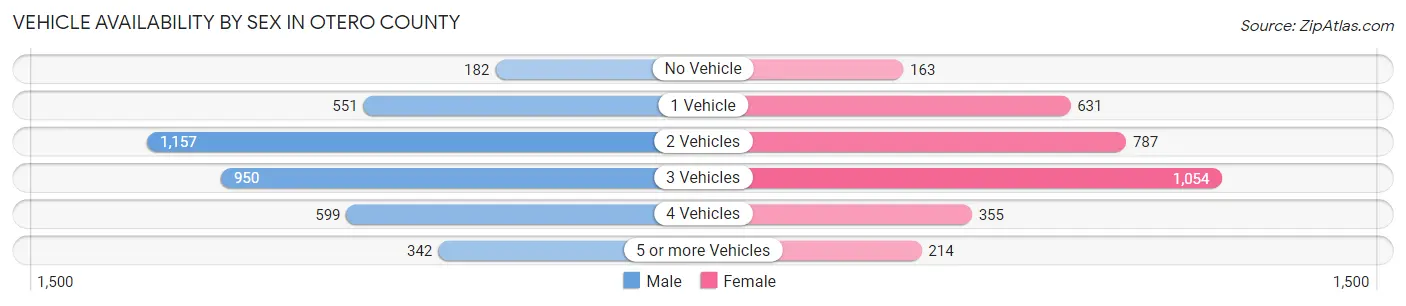
| Vehicles Available | Male | Female |
| No Vehicle | 182 (4.8%) | 163 (5.1%) |
| 1 Vehicle | 551 (14.6%) | 631 (19.7%) |
| 2 Vehicles | 1,157 (30.6%) | 787 (24.6%) |
| 3 Vehicles | 950 (25.1%) | 1,054 (32.9%) |
| 4 Vehicles | 599 (15.8%) | 355 (11.1%) |
| 5 or more Vehicles | 342 (9.0%) | 214 (6.7%) |
| Total | 3,781 (100.0%) | 3,204 (100.0%) |
Commute Time in Otero County
The most frequently occuring commute durations in Otero County are 5 to 9 minutes (1,914 commuters, 28.3%), 10 to 14 minutes (1,096 commuters, 16.2%), and less than 5 minutes (798 commuters, 11.8%).
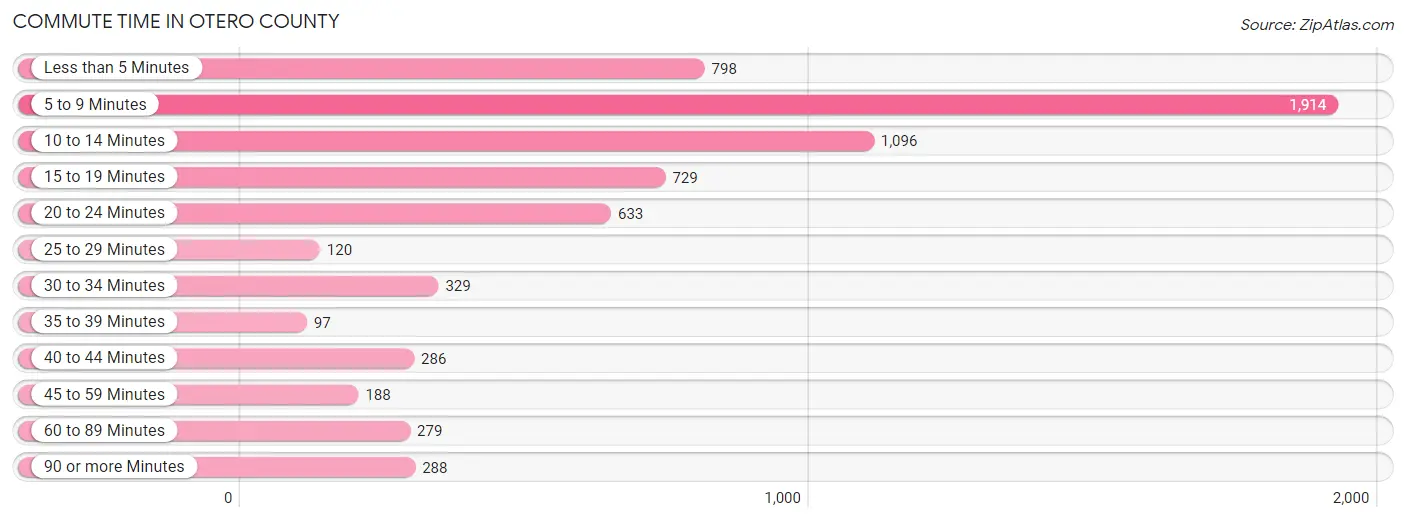
| Commute Time | # Commuters | % Commuters |
| Less than 5 Minutes | 798 | 11.8% |
| 5 to 9 Minutes | 1,914 | 28.3% |
| 10 to 14 Minutes | 1,096 | 16.2% |
| 15 to 19 Minutes | 729 | 10.8% |
| 20 to 24 Minutes | 633 | 9.4% |
| 25 to 29 Minutes | 120 | 1.8% |
| 30 to 34 Minutes | 329 | 4.9% |
| 35 to 39 Minutes | 97 | 1.4% |
| 40 to 44 Minutes | 286 | 4.2% |
| 45 to 59 Minutes | 188 | 2.8% |
| 60 to 89 Minutes | 279 | 4.1% |
| 90 or more Minutes | 288 | 4.3% |
Commute Time by Sex in Otero County
The most common commute times in Otero County are 5 to 9 minutes (1,136 commuters, 31.2%) for males and 5 to 9 minutes (778 commuters, 24.9%) for females.
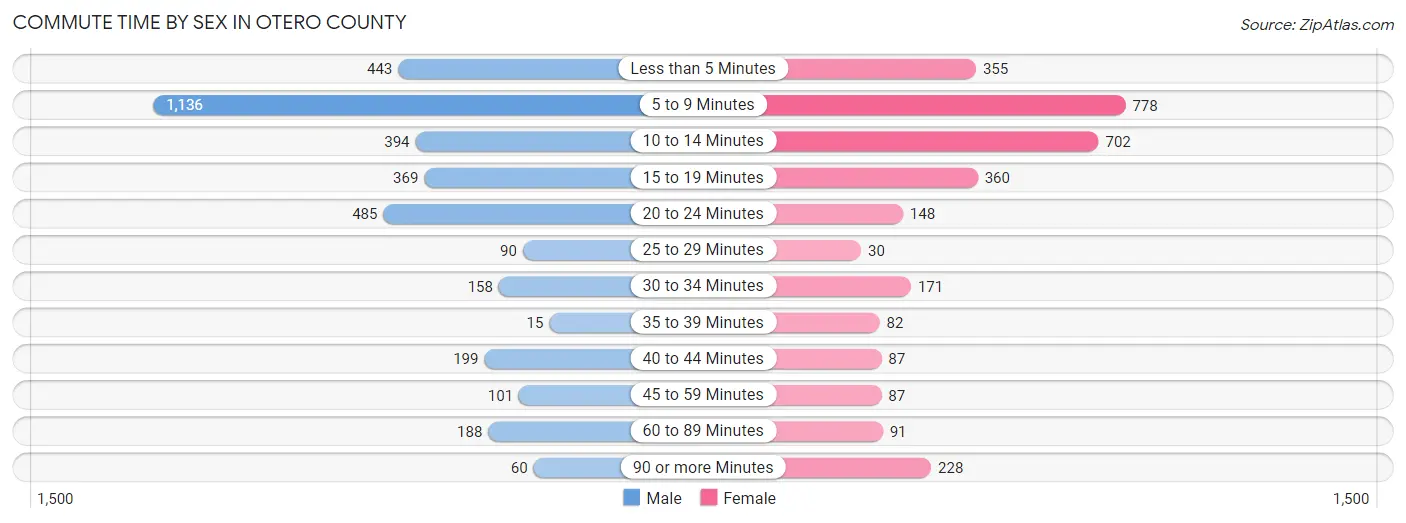
| Commute Time | Male | Female |
| Less than 5 Minutes | 443 (12.2%) | 355 (11.4%) |
| 5 to 9 Minutes | 1,136 (31.2%) | 778 (24.9%) |
| 10 to 14 Minutes | 394 (10.8%) | 702 (22.5%) |
| 15 to 19 Minutes | 369 (10.1%) | 360 (11.5%) |
| 20 to 24 Minutes | 485 (13.3%) | 148 (4.8%) |
| 25 to 29 Minutes | 90 (2.5%) | 30 (1.0%) |
| 30 to 34 Minutes | 158 (4.3%) | 171 (5.5%) |
| 35 to 39 Minutes | 15 (0.4%) | 82 (2.6%) |
| 40 to 44 Minutes | 199 (5.5%) | 87 (2.8%) |
| 45 to 59 Minutes | 101 (2.8%) | 87 (2.8%) |
| 60 to 89 Minutes | 188 (5.2%) | 91 (2.9%) |
| 90 or more Minutes | 60 (1.7%) | 228 (7.3%) |
Time of Departure to Work by Sex in Otero County
The most frequent times of departure to work in Otero County are 6:30 AM to 6:59 AM (743, 20.4%) for males and 7:30 AM to 7:59 AM (670, 21.5%) for females.
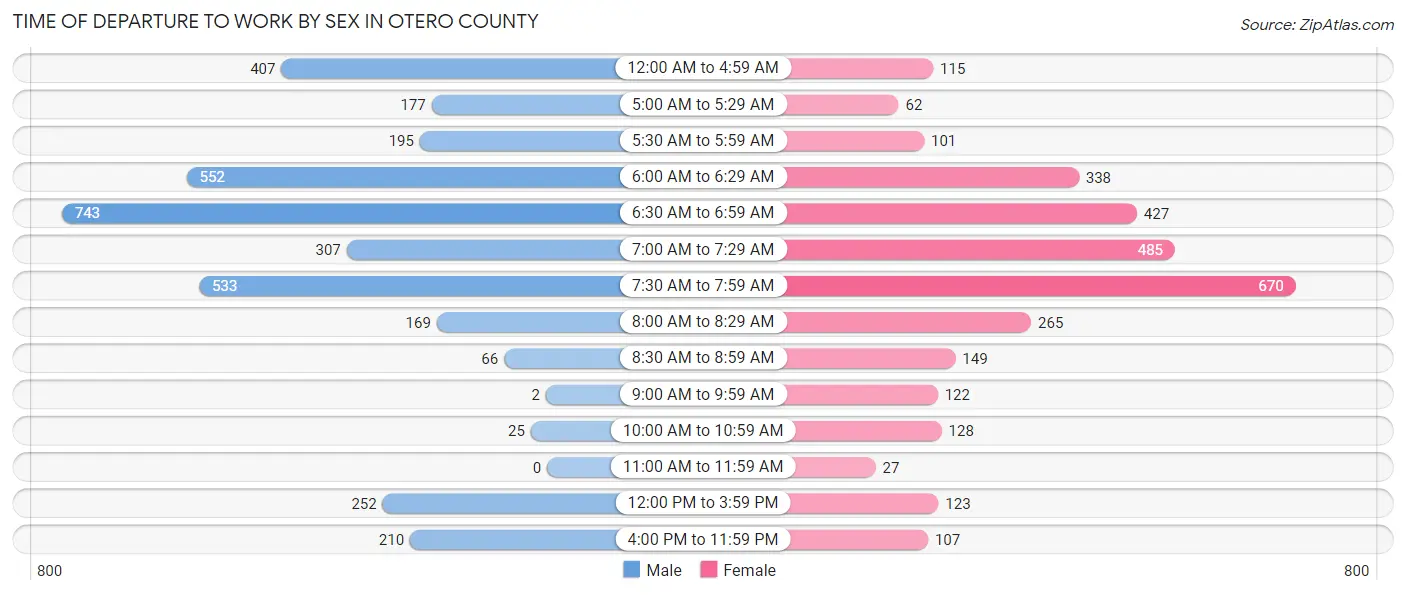
| Time of Departure | Male | Female |
| 12:00 AM to 4:59 AM | 407 (11.2%) | 115 (3.7%) |
| 5:00 AM to 5:29 AM | 177 (4.9%) | 62 (2.0%) |
| 5:30 AM to 5:59 AM | 195 (5.4%) | 101 (3.2%) |
| 6:00 AM to 6:29 AM | 552 (15.2%) | 338 (10.8%) |
| 6:30 AM to 6:59 AM | 743 (20.4%) | 427 (13.7%) |
| 7:00 AM to 7:29 AM | 307 (8.4%) | 485 (15.5%) |
| 7:30 AM to 7:59 AM | 533 (14.6%) | 670 (21.5%) |
| 8:00 AM to 8:29 AM | 169 (4.6%) | 265 (8.5%) |
| 8:30 AM to 8:59 AM | 66 (1.8%) | 149 (4.8%) |
| 9:00 AM to 9:59 AM | 2 (0.1%) | 122 (3.9%) |
| 10:00 AM to 10:59 AM | 25 (0.7%) | 128 (4.1%) |
| 11:00 AM to 11:59 AM | 0 (0.0%) | 27 (0.9%) |
| 12:00 PM to 3:59 PM | 252 (6.9%) | 123 (3.9%) |
| 4:00 PM to 11:59 PM | 210 (5.8%) | 107 (3.4%) |
| Total | 3,638 (100.0%) | 3,119 (100.0%) |
Housing Occupancy in Otero County
Occupancy by Ownership in Otero County
Of the total 7,594 dwellings in Otero County, owner-occupied units account for 5,282 (69.6%), while renter-occupied units make up 2,312 (30.4%).
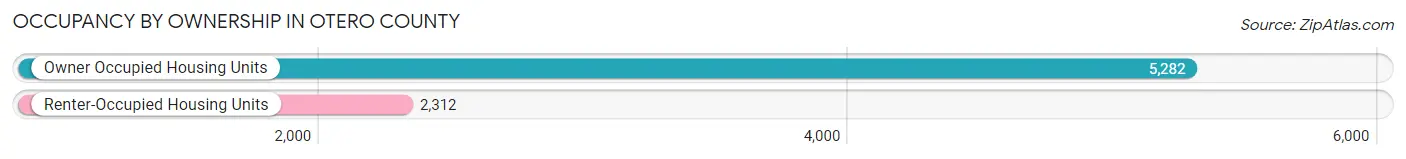
| Occupancy | # Housing Units | % Housing Units |
| Owner Occupied Housing Units | 5,282 | 69.6% |
| Renter-Occupied Housing Units | 2,312 | 30.4% |
| Total Occupied Housing Units | 7,594 | 100.0% |
Occupancy by Household Size in Otero County
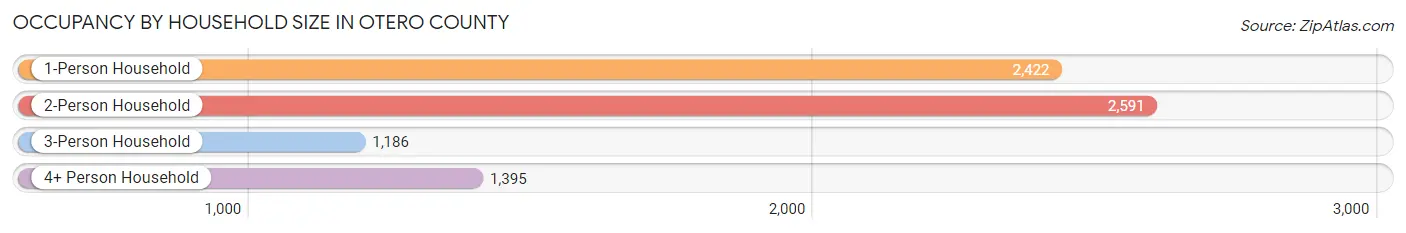
| Household Size | # Housing Units | % Housing Units |
| 1-Person Household | 2,422 | 31.9% |
| 2-Person Household | 2,591 | 34.1% |
| 3-Person Household | 1,186 | 15.6% |
| 4+ Person Household | 1,395 | 18.4% |
| Total Housing Units | 7,594 | 100.0% |
Occupancy by Ownership by Household Size in Otero County

| Household Size | Owner-occupied | Renter-occupied |
| 1-Person Household | 1,685 (69.6%) | 737 (30.4%) |
| 2-Person Household | 1,850 (71.4%) | 741 (28.6%) |
| 3-Person Household | 977 (82.4%) | 209 (17.6%) |
| 4+ Person Household | 770 (55.2%) | 625 (44.8%) |
| Total Housing Units | 5,282 (69.6%) | 2,312 (30.4%) |
Occupancy by Educational Attainment in Otero County
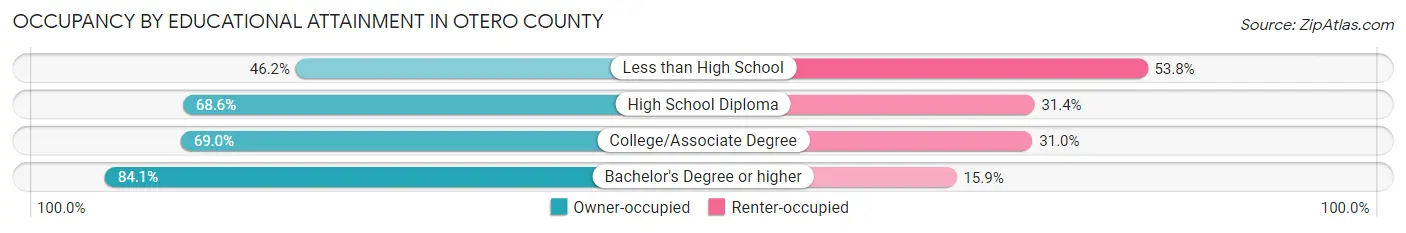
| Household Size | Owner-occupied | Renter-occupied |
| Less than High School | 367 (46.2%) | 427 (53.8%) |
| High School Diploma | 1,651 (68.6%) | 755 (31.4%) |
| College/Associate Degree | 1,975 (69.0%) | 886 (31.0%) |
| Bachelor's Degree or higher | 1,289 (84.1%) | 244 (15.9%) |
Occupancy by Age of Householder in Otero County
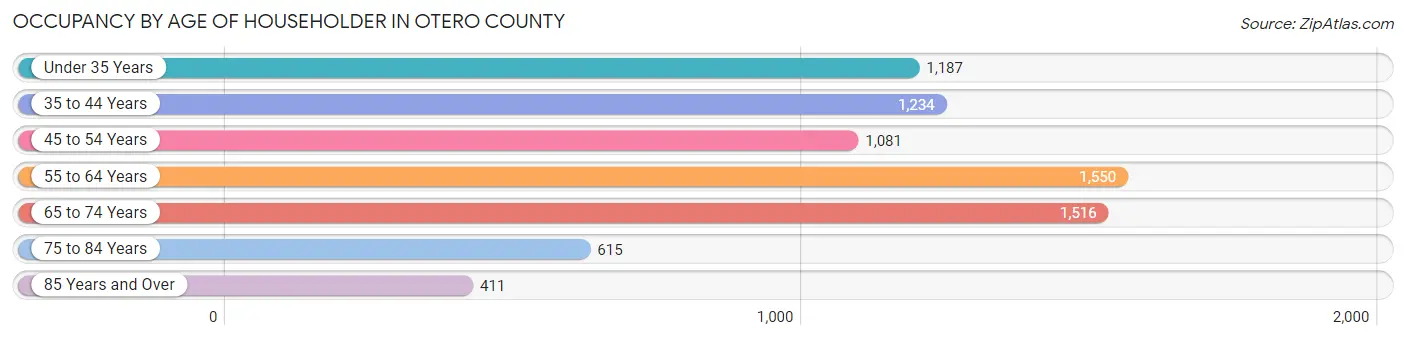
| Age Bracket | # Households | % Households |
| Under 35 Years | 1,187 | 15.6% |
| 35 to 44 Years | 1,234 | 16.3% |
| 45 to 54 Years | 1,081 | 14.2% |
| 55 to 64 Years | 1,550 | 20.4% |
| 65 to 74 Years | 1,516 | 20.0% |
| 75 to 84 Years | 615 | 8.1% |
| 85 Years and Over | 411 | 5.4% |
| Total | 7,594 | 100.0% |
Housing Finances in Otero County
Median Income by Occupancy in Otero County
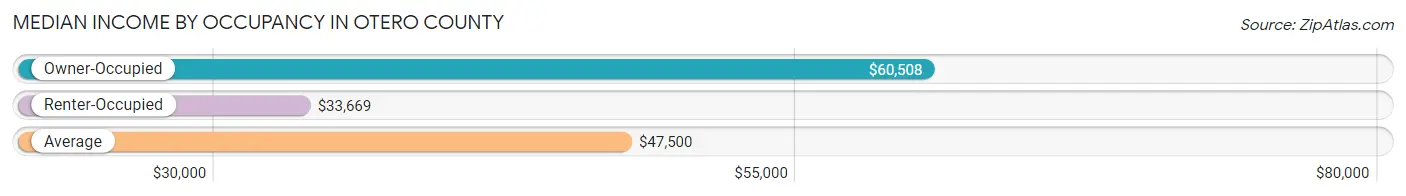
| Occupancy Type | # Households | Median Income |
| Owner-Occupied | 5,282 (69.6%) | $60,508 |
| Renter-Occupied | 2,312 (30.4%) | $33,669 |
| Average | 7,594 (100.0%) | $47,500 |
Occupancy by Householder Income Bracket in Otero County
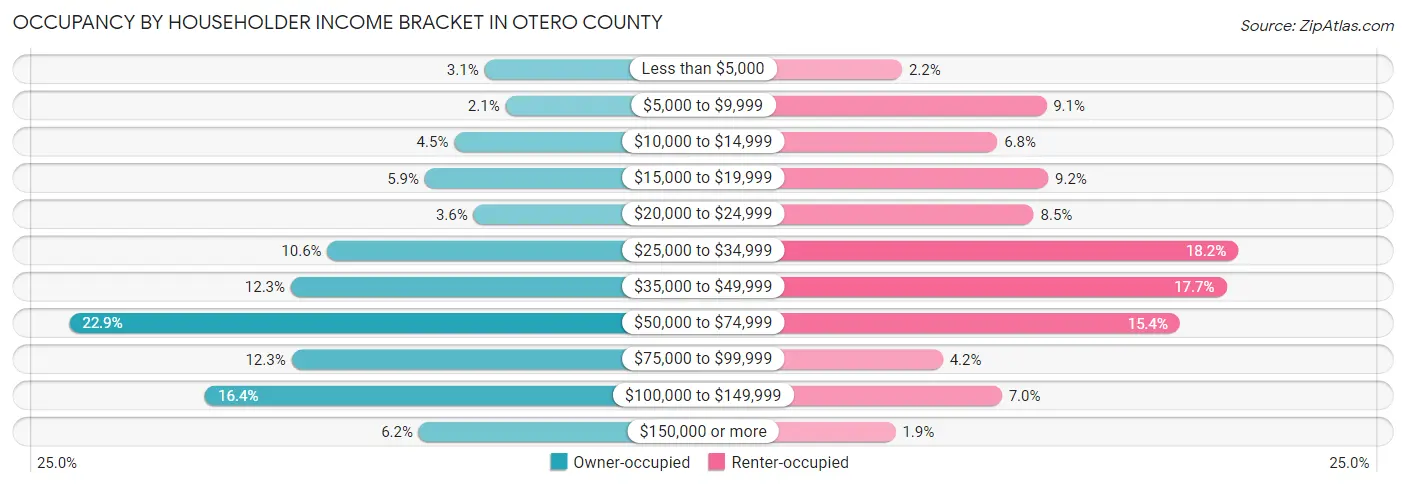
| Income Bracket | Owner-occupied | Renter-occupied |
| Less than $5,000 | 164 (3.1%) | 51 (2.2%) |
| $5,000 to $9,999 | 111 (2.1%) | 210 (9.1%) |
| $10,000 to $14,999 | 240 (4.5%) | 156 (6.8%) |
| $15,000 to $19,999 | 314 (5.9%) | 212 (9.2%) |
| $20,000 to $24,999 | 191 (3.6%) | 196 (8.5%) |
| $25,000 to $34,999 | 559 (10.6%) | 421 (18.2%) |
| $35,000 to $49,999 | 651 (12.3%) | 408 (17.6%) |
| $50,000 to $74,999 | 1,208 (22.9%) | 357 (15.4%) |
| $75,000 to $99,999 | 649 (12.3%) | 96 (4.2%) |
| $100,000 to $149,999 | 866 (16.4%) | 161 (7.0%) |
| $150,000 or more | 329 (6.2%) | 44 (1.9%) |
| Total | 5,282 (100.0%) | 2,312 (100.0%) |
Monthly Housing Cost Tiers in Otero County
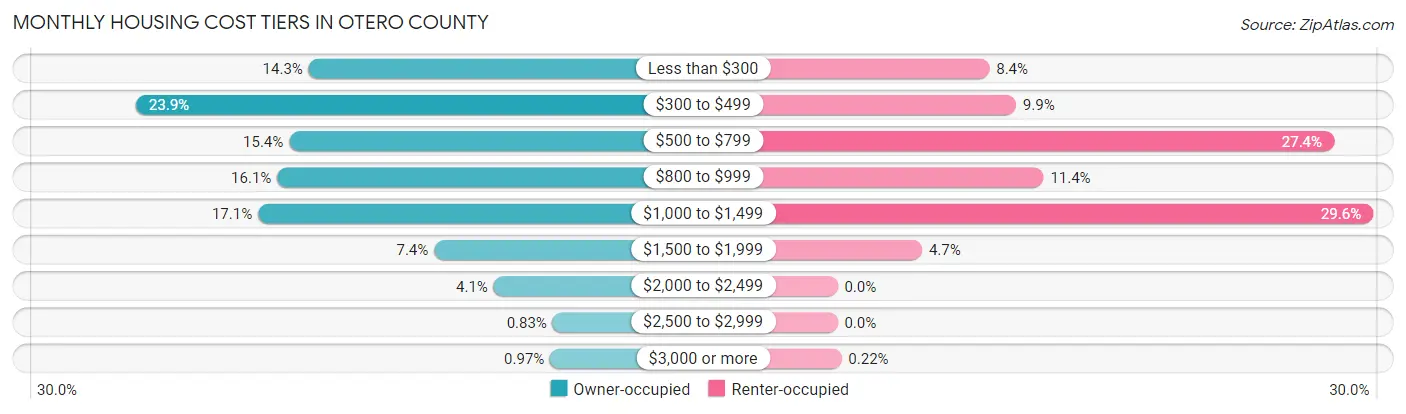
| Monthly Cost | Owner-occupied | Renter-occupied |
| Less than $300 | 756 (14.3%) | 194 (8.4%) |
| $300 to $499 | 1,260 (23.8%) | 228 (9.9%) |
| $500 to $799 | 813 (15.4%) | 634 (27.4%) |
| $800 to $999 | 848 (16.1%) | 263 (11.4%) |
| $1,000 to $1,499 | 904 (17.1%) | 684 (29.6%) |
| $1,500 to $1,999 | 390 (7.4%) | 108 (4.7%) |
| $2,000 to $2,499 | 216 (4.1%) | 0 (0.0%) |
| $2,500 to $2,999 | 44 (0.8%) | 0 (0.0%) |
| $3,000 or more | 51 (1.0%) | 5 (0.2%) |
| Total | 5,282 (100.0%) | 2,312 (100.0%) |
Physical Housing Characteristics in Otero County
Housing Structures in Otero County
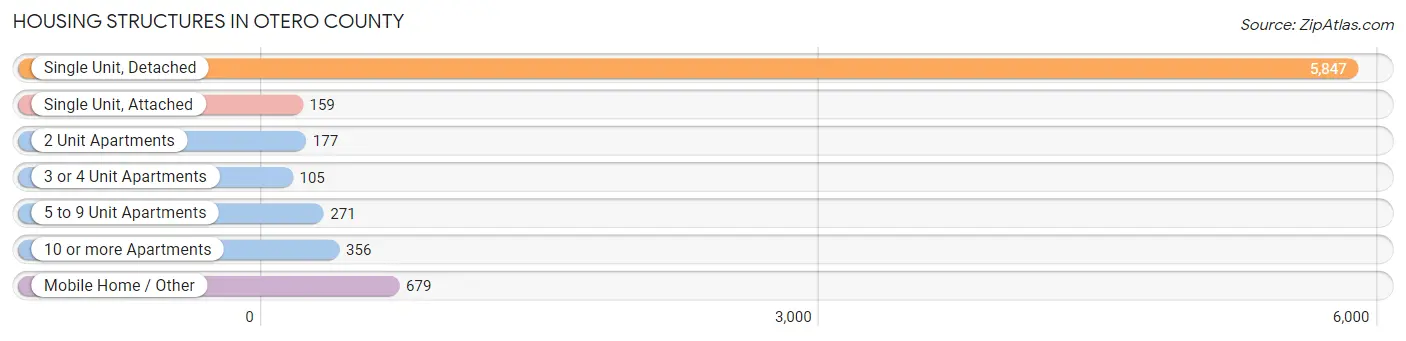
| Structure Type | # Housing Units | % Housing Units |
| Single Unit, Detached | 5,847 | 77.0% |
| Single Unit, Attached | 159 | 2.1% |
| 2 Unit Apartments | 177 | 2.3% |
| 3 or 4 Unit Apartments | 105 | 1.4% |
| 5 to 9 Unit Apartments | 271 | 3.6% |
| 10 or more Apartments | 356 | 4.7% |
| Mobile Home / Other | 679 | 8.9% |
| Total | 7,594 | 100.0% |
Housing Structures by Occupancy in Otero County
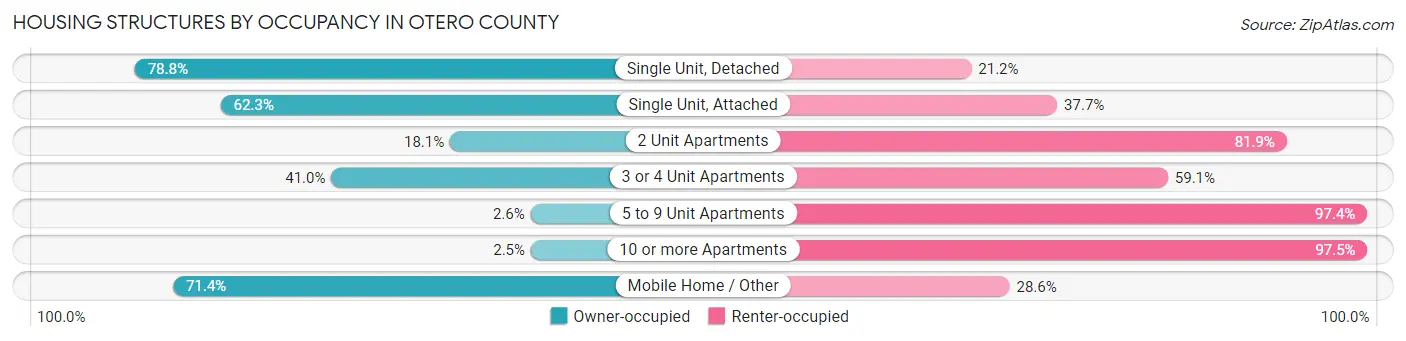
| Structure Type | Owner-occupied | Renter-occupied |
| Single Unit, Detached | 4,607 (78.8%) | 1,240 (21.2%) |
| Single Unit, Attached | 99 (62.3%) | 60 (37.7%) |
| 2 Unit Apartments | 32 (18.1%) | 145 (81.9%) |
| 3 or 4 Unit Apartments | 43 (40.9%) | 62 (59.1%) |
| 5 to 9 Unit Apartments | 7 (2.6%) | 264 (97.4%) |
| 10 or more Apartments | 9 (2.5%) | 347 (97.5%) |
| Mobile Home / Other | 485 (71.4%) | 194 (28.6%) |
| Total | 5,282 (69.6%) | 2,312 (30.4%) |
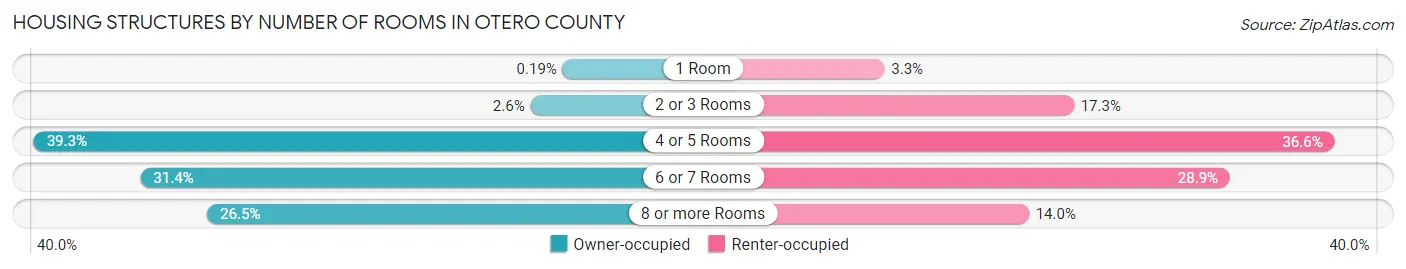
Housing Structures by Number of Rooms in Otero County
| Number of Rooms | Owner-occupied | Renter-occupied |
| 1 Room | 10 (0.2%) | 76 (3.3%) |
| 2 or 3 Rooms | 136 (2.6%) | 400 (17.3%) |
| 4 or 5 Rooms | 2,077 (39.3%) | 846 (36.6%) |
| 6 or 7 Rooms | 1,660 (31.4%) | 667 (28.8%) |
| 8 or more Rooms | 1,399 (26.5%) | 323 (14.0%) |
| Total | 5,282 (100.0%) | 2,312 (100.0%) |
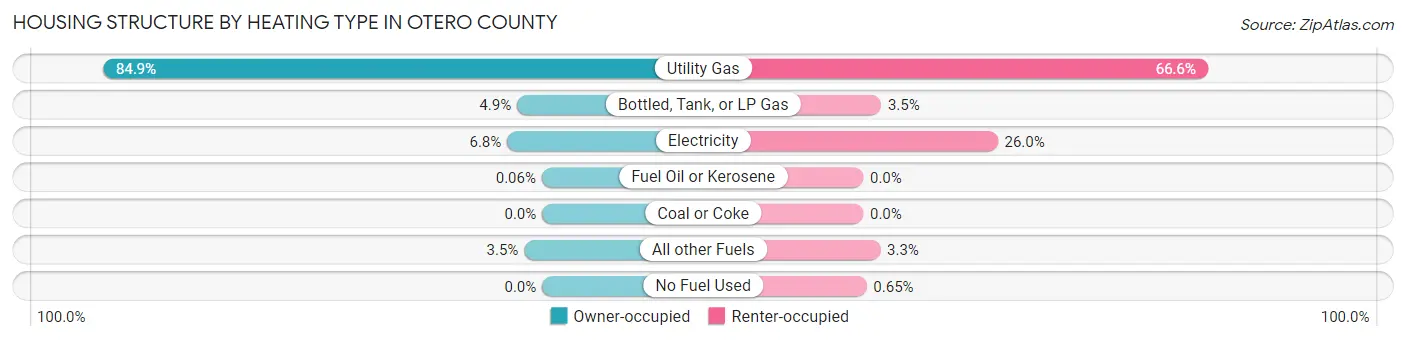
Housing Structure by Heating Type in Otero County
| Heating Type | Owner-occupied | Renter-occupied |
| Utility Gas | 4,483 (84.9%) | 1,540 (66.6%) |
| Bottled, Tank, or LP Gas | 256 (4.9%) | 80 (3.5%) |
| Electricity | 357 (6.8%) | 601 (26.0%) |
| Fuel Oil or Kerosene | 3 (0.1%) | 0 (0.0%) |
| Coal or Coke | 0 (0.0%) | 0 (0.0%) |
| All other Fuels | 183 (3.5%) | 76 (3.3%) |
| No Fuel Used | 0 (0.0%) | 15 (0.6%) |
| Total | 5,282 (100.0%) | 2,312 (100.0%) |
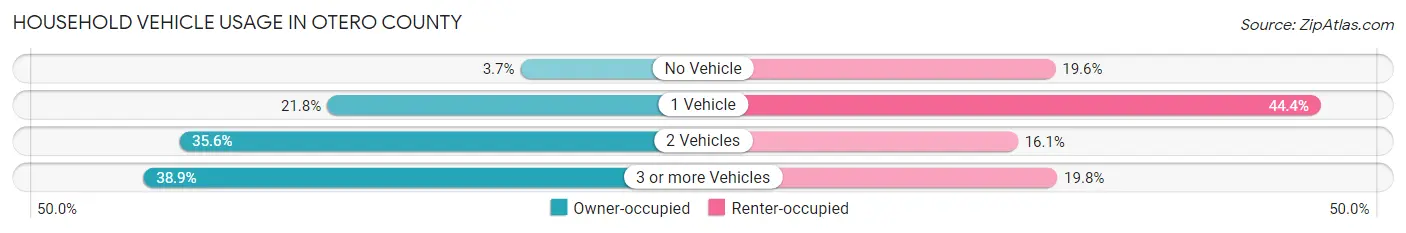
Household Vehicle Usage in Otero County
| Vehicles per Household | Owner-occupied | Renter-occupied |
| No Vehicle | 197 (3.7%) | 454 (19.6%) |
| 1 Vehicle | 1,150 (21.8%) | 1,027 (44.4%) |
| 2 Vehicles | 1,879 (35.6%) | 373 (16.1%) |
| 3 or more Vehicles | 2,056 (38.9%) | 458 (19.8%) |
| Total | 5,282 (100.0%) | 2,312 (100.0%) |
Real Estate & Mortgages in Otero County
Real Estate and Mortgage Overview in Otero County
| Characteristic | Without Mortgage | With Mortgage |
| Housing Units | 2,647 | 2,635 |
| Median Property Value | $107,800 | $159,000 |
| Median Household Income | $46,436 | $186 |
| Monthly Housing Costs | $386 | $51 |
| Real Estate Taxes | $388 | $41 |
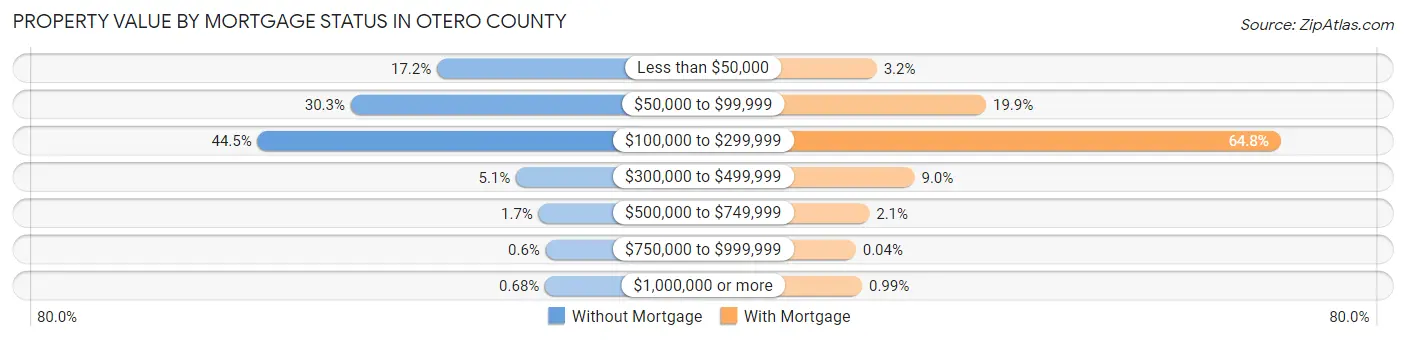
Property Value by Mortgage Status in Otero County
| Property Value | Without Mortgage | With Mortgage |
| Less than $50,000 | 454 (17.2%) | 85 (3.2%) |
| $50,000 to $99,999 | 802 (30.3%) | 524 (19.9%) |
| $100,000 to $299,999 | 1,178 (44.5%) | 1,707 (64.8%) |
| $300,000 to $499,999 | 135 (5.1%) | 237 (9.0%) |
| $500,000 to $749,999 | 44 (1.7%) | 55 (2.1%) |
| $750,000 to $999,999 | 16 (0.6%) | 1 (0.0%) |
| $1,000,000 or more | 18 (0.7%) | 26 (1.0%) |
| Total | 2,647 (100.0%) | 2,635 (100.0%) |
Household Income by Mortgage Status in Otero County
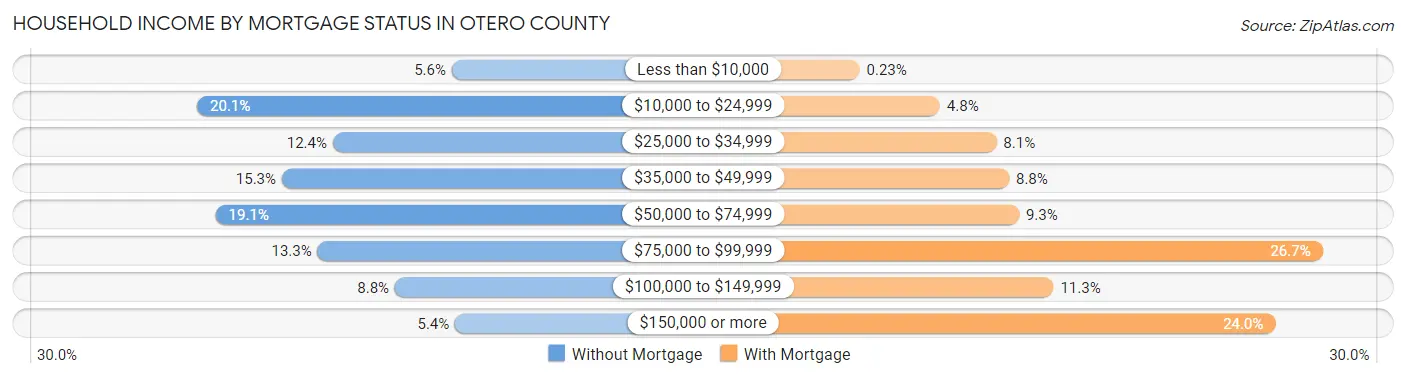
| Household Income | Without Mortgage | With Mortgage |
| Less than $10,000 | 148 (5.6%) | 6 (0.2%) |
| $10,000 to $24,999 | 533 (20.1%) | 127 (4.8%) |
| $25,000 to $34,999 | 328 (12.4%) | 212 (8.1%) |
| $35,000 to $49,999 | 405 (15.3%) | 231 (8.8%) |
| $50,000 to $74,999 | 505 (19.1%) | 246 (9.3%) |
| $75,000 to $99,999 | 351 (13.3%) | 703 (26.7%) |
| $100,000 to $149,999 | 234 (8.8%) | 298 (11.3%) |
| $150,000 or more | 143 (5.4%) | 632 (24.0%) |
| Total | 2,647 (100.0%) | 2,635 (100.0%) |
Property Value to Household Income Ratio in Otero County
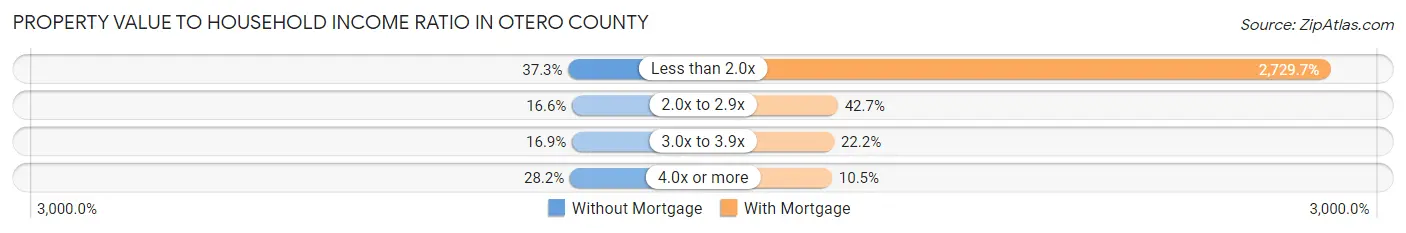
| Value-to-Income Ratio | Without Mortgage | With Mortgage |
| Less than 2.0x | 986 (37.2%) | 71,927 (2,729.7%) |
| 2.0x to 2.9x | 439 (16.6%) | 1,124 (42.7%) |
| 3.0x to 3.9x | 446 (16.9%) | 586 (22.2%) |
| 4.0x or more | 747 (28.2%) | 276 (10.5%) |
| Total | 2,647 (100.0%) | 2,635 (100.0%) |
Real Estate Taxes by Mortgage Status in Otero County
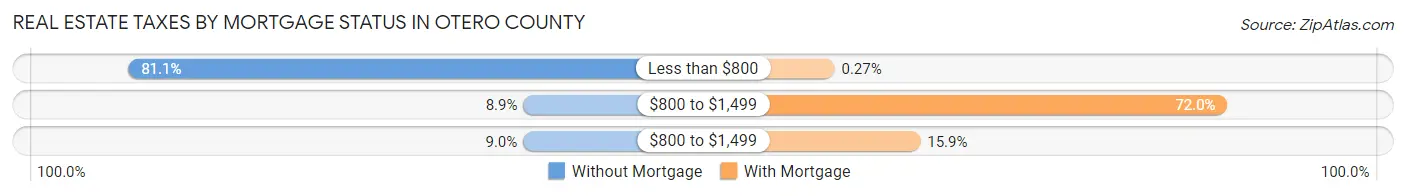
| Property Taxes | Without Mortgage | With Mortgage |
| Less than $800 | 2,146 (81.1%) | 7 (0.3%) |
| $800 to $1,499 | 236 (8.9%) | 1,898 (72.0%) |
| $800 to $1,499 | 237 (8.9%) | 420 (15.9%) |
| Total | 2,647 (100.0%) | 2,635 (100.0%) |
Health & Disability in Otero County
Health Insurance Coverage by Age in Otero County
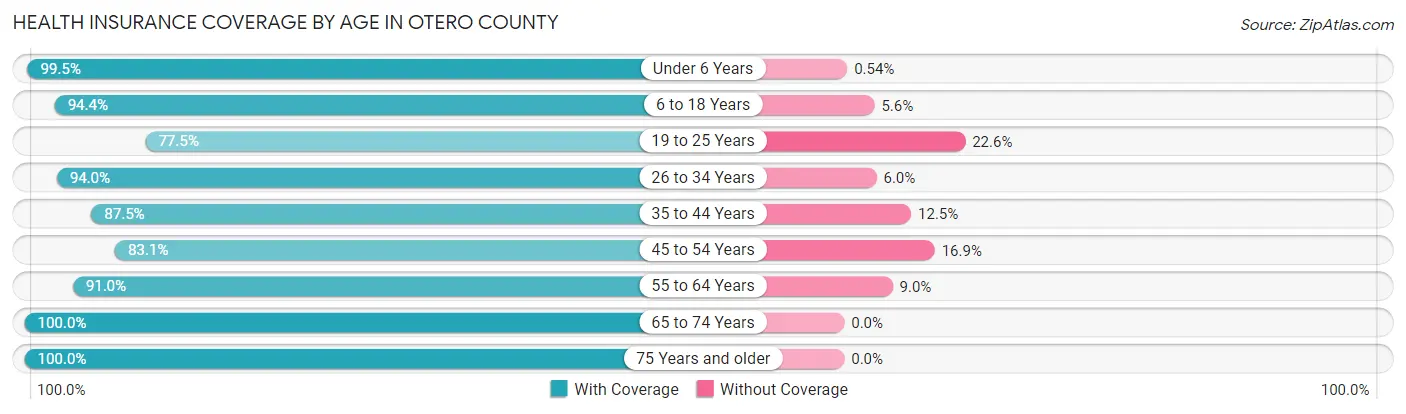
| Age Bracket | With Coverage | Without Coverage |
| Under 6 Years | 1,283 (99.5%) | 7 (0.5%) |
| 6 to 18 Years | 3,233 (94.4%) | 193 (5.6%) |
| 19 to 25 Years | 1,130 (77.4%) | 329 (22.6%) |
| 26 to 34 Years | 1,672 (94.0%) | 107 (6.0%) |
| 35 to 44 Years | 2,079 (87.5%) | 296 (12.5%) |
| 45 to 54 Years | 1,539 (83.1%) | 312 (16.9%) |
| 55 to 64 Years | 2,224 (91.0%) | 220 (9.0%) |
| 65 to 74 Years | 2,263 (100.0%) | 0 (0.0%) |
| 75 Years and older | 1,509 (100.0%) | 0 (0.0%) |
| Total | 16,932 (92.0%) | 1,464 (8.0%) |
Health Insurance Coverage by Citizenship Status in Otero County
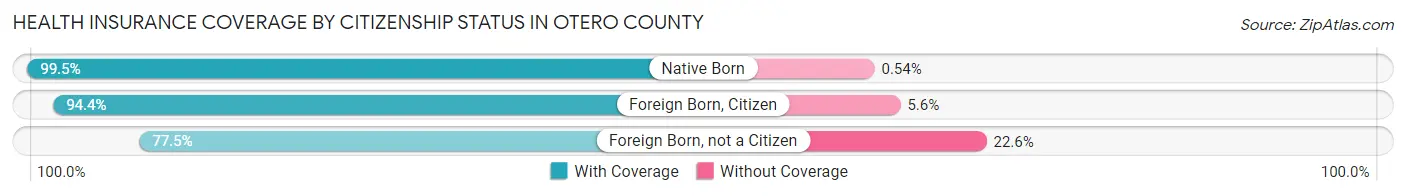
| Citizenship Status | With Coverage | Without Coverage |
| Native Born | 1,283 (99.5%) | 7 (0.5%) |
| Foreign Born, Citizen | 3,233 (94.4%) | 193 (5.6%) |
| Foreign Born, not a Citizen | 1,130 (77.4%) | 329 (22.6%) |
Health Insurance Coverage by Household Income in Otero County
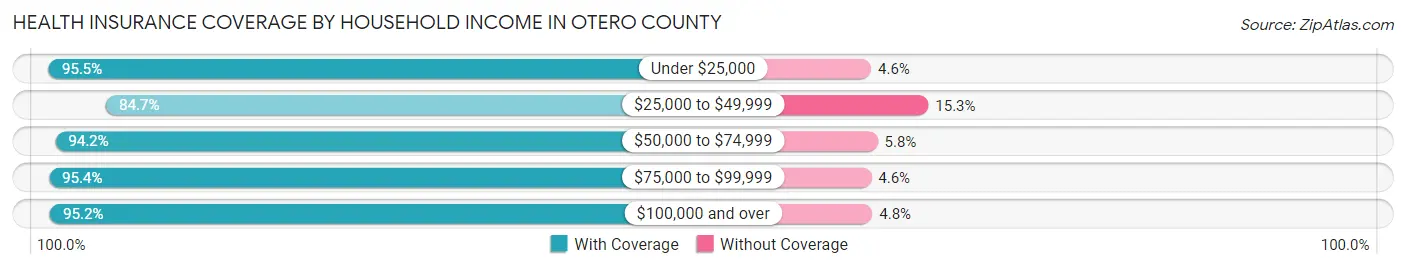
| Household Income | With Coverage | Without Coverage |
| Under $25,000 | 3,191 (95.5%) | 152 (4.5%) |
| $25,000 to $49,999 | 4,502 (84.7%) | 812 (15.3%) |
| $50,000 to $74,999 | 3,183 (94.2%) | 195 (5.8%) |
| $75,000 to $99,999 | 1,494 (95.4%) | 72 (4.6%) |
| $100,000 and over | 4,296 (95.2%) | 216 (4.8%) |
Public vs Private Health Insurance Coverage by Age in Otero County
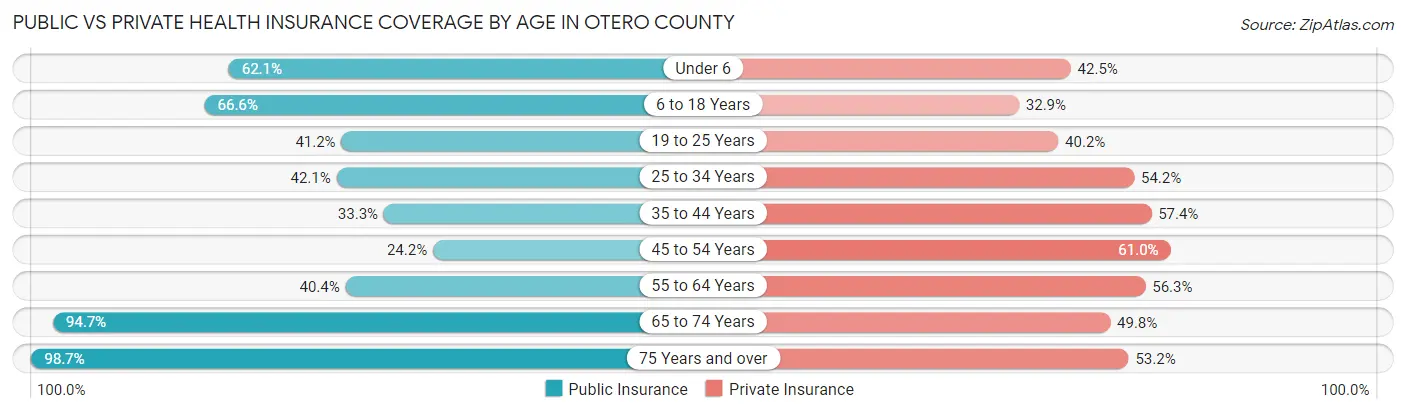
| Age Bracket | Public Insurance | Private Insurance |
| Under 6 | 801 (62.1%) | 548 (42.5%) |
| 6 to 18 Years | 2,281 (66.6%) | 1,126 (32.9%) |
| 19 to 25 Years | 601 (41.2%) | 586 (40.2%) |
| 25 to 34 Years | 749 (42.1%) | 965 (54.2%) |
| 35 to 44 Years | 791 (33.3%) | 1,364 (57.4%) |
| 45 to 54 Years | 448 (24.2%) | 1,129 (61.0%) |
| 55 to 64 Years | 988 (40.4%) | 1,377 (56.3%) |
| 65 to 74 Years | 2,144 (94.7%) | 1,127 (49.8%) |
| 75 Years and over | 1,490 (98.7%) | 803 (53.2%) |
| Total | 10,293 (55.9%) | 9,025 (49.1%) |
Disability Status by Sex by Age in Otero County
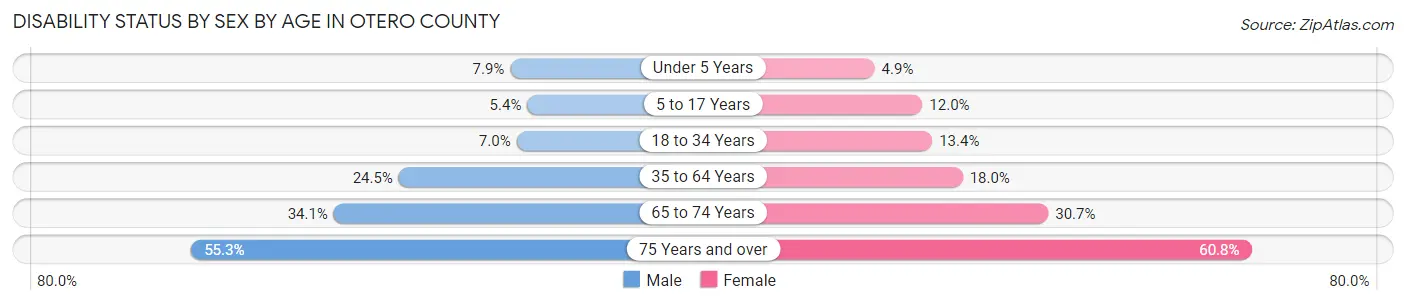
| Age Bracket | Male | Female |
| Under 5 Years | 54 (7.9%) | 18 (4.9%) |
| 5 to 17 Years | 88 (5.4%) | 194 (12.0%) |
| 18 to 34 Years | 133 (7.0%) | 232 (13.4%) |
| 35 to 64 Years | 807 (24.4%) | 605 (17.9%) |
| 65 to 74 Years | 398 (34.1%) | 336 (30.7%) |
| 75 Years and over | 363 (55.2%) | 518 (60.8%) |
Disability Class by Sex by Age in Otero County
Disability Class: Hearing Difficulty
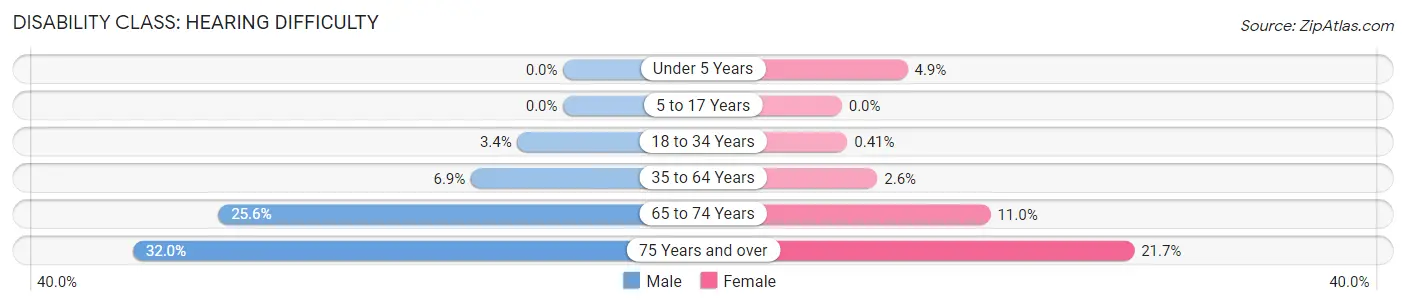
| Age Bracket | Male | Female |
| Under 5 Years | 0 (0.0%) | 18 (4.9%) |
| 5 to 17 Years | 0 (0.0%) | 0 (0.0%) |
| 18 to 34 Years | 65 (3.4%) | 7 (0.4%) |
| 35 to 64 Years | 226 (6.9%) | 89 (2.6%) |
| 65 to 74 Years | 299 (25.6%) | 121 (11.0%) |
| 75 Years and over | 210 (32.0%) | 185 (21.7%) |
Disability Class: Vision Difficulty
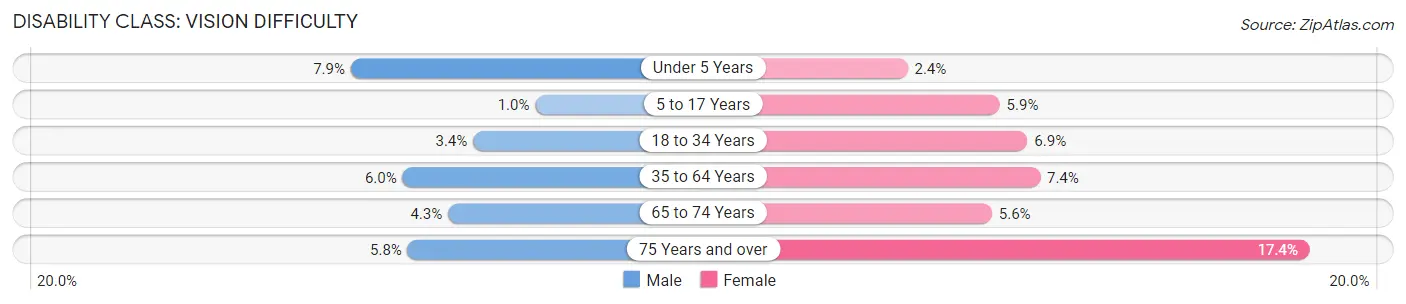
| Age Bracket | Male | Female |
| Under 5 Years | 54 (7.9%) | 9 (2.4%) |
| 5 to 17 Years | 17 (1.0%) | 95 (5.9%) |
| 18 to 34 Years | 64 (3.4%) | 119 (6.9%) |
| 35 to 64 Years | 197 (6.0%) | 248 (7.4%) |
| 65 to 74 Years | 50 (4.3%) | 61 (5.6%) |
| 75 Years and over | 38 (5.8%) | 148 (17.4%) |
Disability Class: Cognitive Difficulty
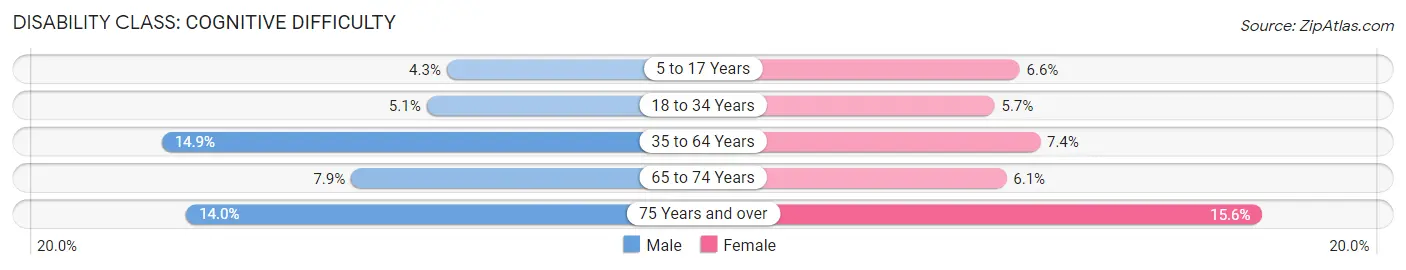
| Age Bracket | Male | Female |
| 5 to 17 Years | 71 (4.3%) | 107 (6.6%) |
| 18 to 34 Years | 97 (5.1%) | 98 (5.7%) |
| 35 to 64 Years | 492 (14.9%) | 248 (7.4%) |
| 65 to 74 Years | 92 (7.9%) | 67 (6.1%) |
| 75 Years and over | 92 (14.0%) | 133 (15.6%) |
Disability Class: Ambulatory Difficulty
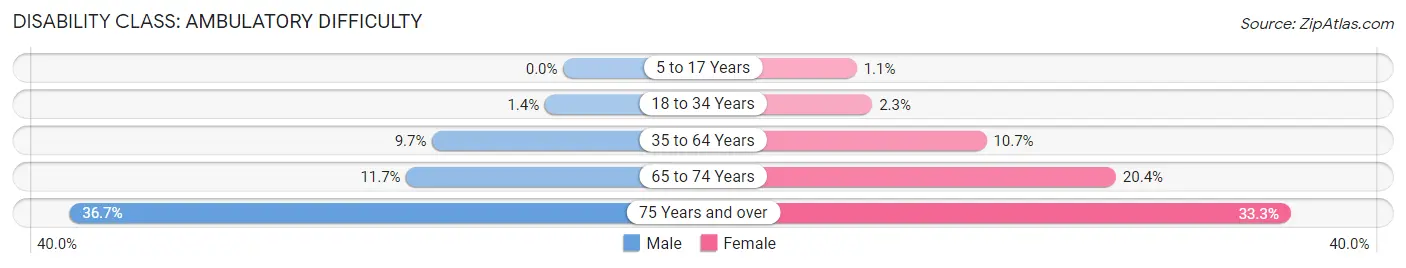
| Age Bracket | Male | Female |
| 5 to 17 Years | 0 (0.0%) | 18 (1.1%) |
| 18 to 34 Years | 26 (1.4%) | 39 (2.3%) |
| 35 to 64 Years | 321 (9.7%) | 362 (10.7%) |
| 65 to 74 Years | 136 (11.7%) | 223 (20.3%) |
| 75 Years and over | 241 (36.7%) | 284 (33.3%) |
Disability Class: Self-Care Difficulty
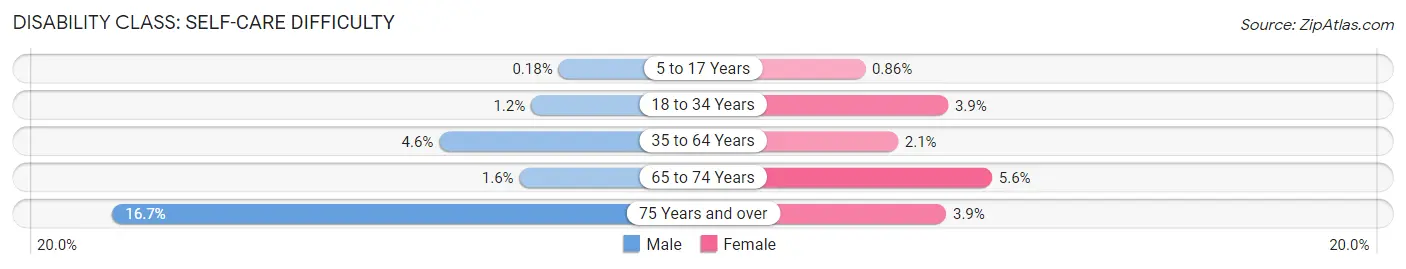
| Age Bracket | Male | Female |
| 5 to 17 Years | 3 (0.2%) | 14 (0.9%) |
| 18 to 34 Years | 23 (1.2%) | 68 (3.9%) |
| 35 to 64 Years | 152 (4.6%) | 70 (2.1%) |
| 65 to 74 Years | 19 (1.6%) | 61 (5.6%) |
| 75 Years and over | 110 (16.7%) | 33 (3.9%) |
Technology Access in Otero County
Computing Device Access in Otero County
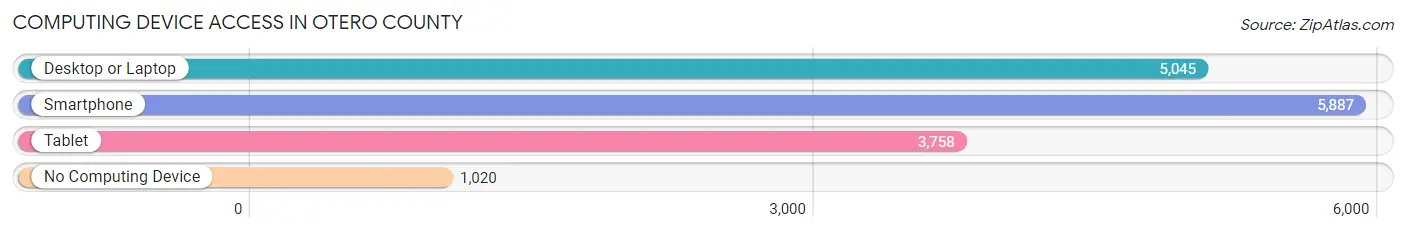
| Device Type | # Households | % Households |
| Desktop or Laptop | 5,045 | 66.4% |
| Smartphone | 5,887 | 77.5% |
| Tablet | 3,758 | 49.5% |
| No Computing Device | 1,020 | 13.4% |
| Total | 7,594 | 100.0% |
Internet Access in Otero County
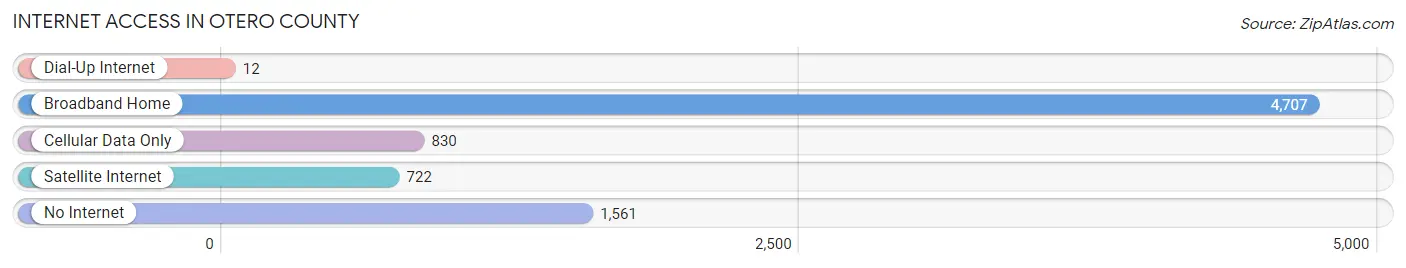
| Internet Type | # Households | % Households |
| Dial-Up Internet | 12 | 0.2% |
| Broadband Home | 4,707 | 62.0% |
| Cellular Data Only | 830 | 10.9% |
| Satellite Internet | 722 | 9.5% |
| No Internet | 1,561 | 20.6% |
| Total | 7,594 | 100.0% |
Otero County Summary
Otero County is located in the southeastern corner of Colorado, and is bordered by Kansas to the east and New Mexico to the south. The county seat is La Junta, and the county is named after Miguel Antonio Otero, a prominent 19th century politician from New Mexico. Otero County covers an area of 2,370 square miles, and has a population of approximately 15,000 people.
Geography
Otero County is located in the southeastern corner of Colorado, and is bordered by Kansas to the east and New Mexico to the south. The county is located in the High Plains region of the state, and is characterized by flat to rolling terrain. The county is drained by the Arkansas River, which flows through the county from north to south. The county is also home to several small lakes, including John Martin Reservoir, which is located in the northern part of the county.
The climate of Otero County is semi-arid, with hot summers and cold winters. The average annual precipitation is approximately 16 inches, with most of the precipitation occurring in the spring and summer months.
History
The area that is now Otero County was originally inhabited by the Apache and Ute Native American tribes. The first Europeans to settle in the area were Spanish explorers, who arrived in the late 1700s. The area was part of the New Mexico Territory until 1861, when it became part of the Colorado Territory.
In 1887, Otero County was established as one of the original 17 counties in Colorado. The county was named after Miguel Antonio Otero, a prominent 19th century politician from New Mexico. The county seat was originally located in the town of La Junta, which was established in 1887.
Economy
The economy of Otero County is largely based on agriculture and ranching. The county is home to several large farms and ranches, which produce a variety of crops, including wheat, corn, and hay. The county is also home to several large cattle ranches, which produce beef and dairy products.
In addition to agriculture, Otero County is home to several small businesses, including retail stores, restaurants, and service providers. The county is also home to several manufacturing companies, which produce a variety of products, including furniture, clothing, and electronics.
Demographics
As of the 2010 census, Otero County had a population of 15,000 people. The racial makeup of the county was 87.3% White, 0.7% African American, 0.7% Native American, 0.3% Asian, 0.1% Pacific Islander, 9.3% from other races, and 1.9% from two or more races. Hispanic or Latino of any race were 24.3% of the population.
The median household income in Otero County was $37,000, and the median family income was $44,000. The per capita income was $18,000. Approximately 16.3% of the population was below the poverty line.
Common Questions
What is the Total Population of Otero County?
Total Population of Otero County is 18,580.
What is the Total Male Population of Otero County?
Total Male Population of Otero County is 9,409.
What is the Total Female Population of Otero County?
Total Female Population of Otero County is 9,171.
What is the Ratio of Males per 100 Females in Otero County?
There are 102.60 Males per 100 Females in Otero County.
What is the Ratio of Females per 100 Males in Otero County?
There are 97.47 Females per 100 Males in Otero County.
What is the Median Population Age in Otero County?
Median Population Age in Otero County is 40.5 Years.
What is the Average Family Size in Otero County
Average Family Size in Otero County is 3.0 People.
What is the Average Household Size in Otero County
Average Household Size in Otero County is 2.4 People.
What is Per Capita Income in Otero County?
Per Capita income in Otero County is $25,789.
What is the Median Family Income in Otero County?
Median Family Income in Otero County is $62,013.
What is the Median Household income in Otero County?
Median Household Income in Otero County is $47,500.
What is Income or Wage Gap in Otero County?
Income or Wage Gap in Otero County is 24.3%.
Women in Otero County earn 75.7 cents for every dollar earned by a man.
What is Family Income Deficit in Otero County?
Family Income Deficit in Otero County is $11,190.
Families that are below poverty line in Otero County earn $11,190 less on average than the poverty threshold level.
What is Inequality or Gini Index in Otero County?
Inequality or Gini Index in Otero County is 0.43.
How Large is the Labor Force in Otero County?
There are 7,613 People in the Labor Forcein in Otero County.
What is the Percentage of People in the Labor Force in Otero County?
51.6% of People are in the Labor Force in Otero County.
What is the Unemployment Rate in Otero County?
Unemployment Rate in Otero County is 5.9%.