Morgan County, CO
Morgan County Map
Morgan County Overview
29,045
TOTAL POPULATION
15,015
MALE POPULATION
14,030
FEMALE POPULATION
107.02
MALES / 100 FEMALES
93.44
FEMALES / 100 MALES
36.9
MEDIAN AGE
3.2
AVG FAMILY SIZE
2.6
AVG HOUSEHOLD SIZE
$30,422
PER CAPITA INCOME
$81,066
AVG FAMILY INCOME
$70,471
AVG HOUSEHOLD INCOME
40.4%
WAGE / INCOME GAP [ % ]
59.6¢/ $1
WAGE / INCOME GAP [ $ ]
$11,070
FAMILY INCOME DEFICIT
0.41
INEQUALITY / GINI INDEX
14,330
LABOR FORCE [ PEOPLE ]
64.4%
PERCENT IN LABOR FORCE
3.7%
UNEMPLOYMENT RATE
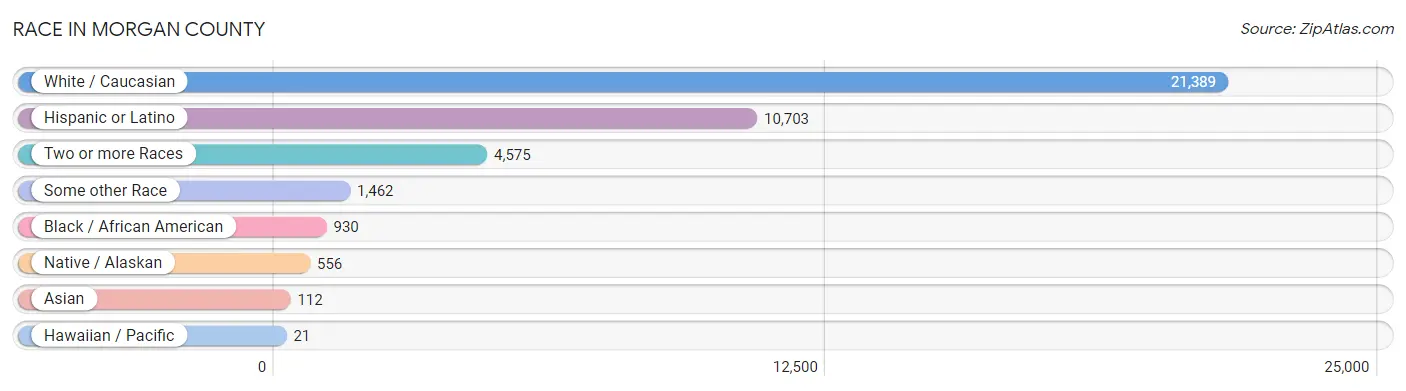
Race in Morgan County
The most populous races in Morgan County are White / Caucasian (21,389 | 73.6%), Hispanic or Latino (10,703 | 36.8%), and Two or more Races (4,575 | 15.8%).
| Race | # Population | % Population |
| Asian | 112 | 0.4% |
| Black / African American | 930 | 3.2% |
| Hawaiian / Pacific | 21 | 0.1% |
| Hispanic or Latino | 10,703 | 36.8% |
| Native / Alaskan | 556 | 1.9% |
| White / Caucasian | 21,389 | 73.6% |
| Two or more Races | 4,575 | 15.8% |
| Some other Race | 1,462 | 5.0% |
| Total | 29,045 | 100.0% |
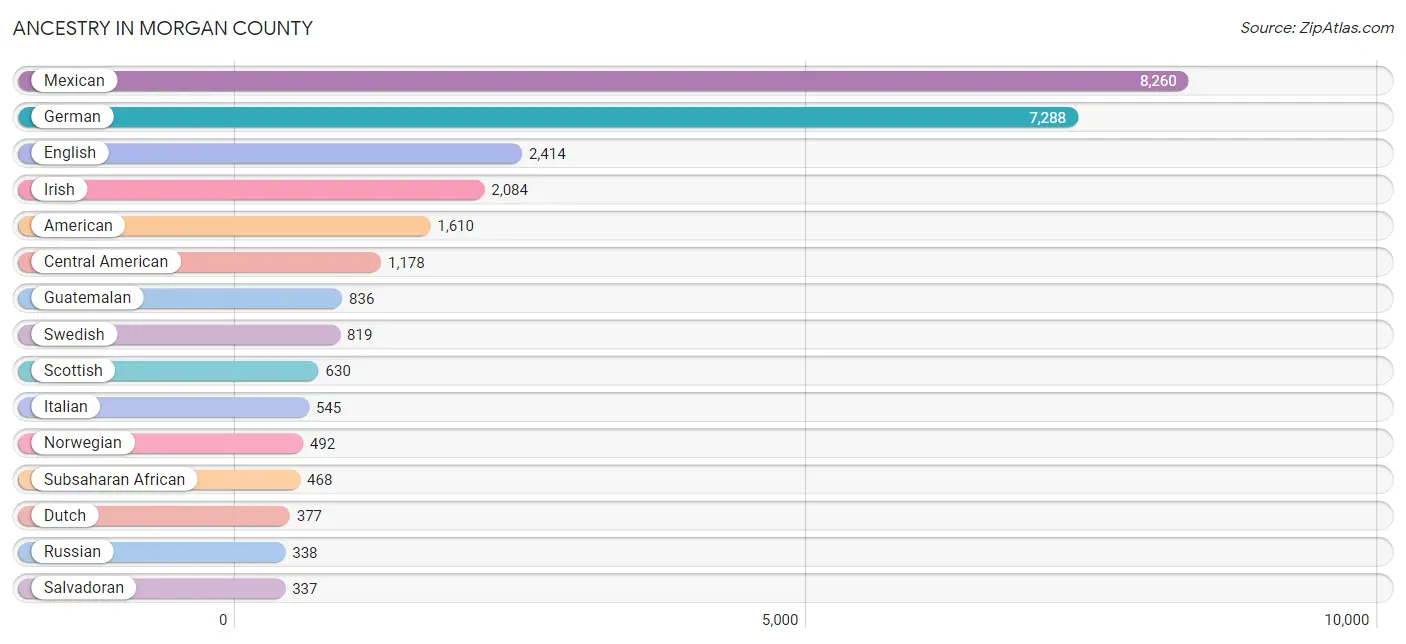
Ancestry in Morgan County
The most populous ancestries reported in Morgan County are Mexican (8,260 | 28.4%), German (7,288 | 25.1%), English (2,414 | 8.3%), Irish (2,084 | 7.2%), and American (1,610 | 5.5%), together accounting for 74.6% of all Morgan County residents.
| Ancestry | # Population | % Population |
| African | 256 | 0.9% |
| American | 1,610 | 5.5% |
| Apache | 57 | 0.2% |
| Arab | 10 | 0.0% |
| Arapaho | 11 | 0.0% |
| Austrian | 10 | 0.0% |
| Belgian | 33 | 0.1% |
| Bhutanese | 89 | 0.3% |
| Blackfeet | 32 | 0.1% |
| British | 42 | 0.1% |
| Burmese | 5 | 0.0% |
| Canadian | 13 | 0.0% |
| Central American | 1,178 | 4.1% |
| Central American Indian | 310 | 1.1% |
| Cherokee | 37 | 0.1% |
| Choctaw | 15 | 0.1% |
| Colombian | 21 | 0.1% |
| Cuban | 12 | 0.0% |
| Czech | 82 | 0.3% |
| Czechoslovakian | 22 | 0.1% |
| Danish | 256 | 0.9% |
| Delaware | 2 | 0.0% |
| Dominican | 33 | 0.1% |
| Dutch | 377 | 1.3% |
| Eastern European | 32 | 0.1% |
| Ecuadorian | 79 | 0.3% |
| Egyptian | 2 | 0.0% |
| English | 2,414 | 8.3% |
| Ethiopian | 43 | 0.2% |
| European | 299 | 1.0% |
| Finnish | 5 | 0.0% |
| French | 335 | 1.1% |
| French Canadian | 56 | 0.2% |
| German | 7,288 | 25.1% |
| Greek | 98 | 0.3% |
| Guamanian / Chamorro | 21 | 0.1% |
| Guatemalan | 836 | 2.9% |
| Hopi | 2 | 0.0% |
| Hungarian | 59 | 0.2% |
| Indian (Asian) | 78 | 0.3% |
| Iranian | 5 | 0.0% |
| Irish | 2,084 | 7.2% |
| Italian | 545 | 1.9% |
| Korean | 84 | 0.3% |
| Lebanese | 8 | 0.0% |
| Luxembourger | 5 | 0.0% |
| Mexican | 8,260 | 28.4% |
| Mexican American Indian | 16 | 0.1% |
| Navajo | 157 | 0.5% |
| Nicaraguan | 5 | 0.0% |
| Nigerian | 2 | 0.0% |
| Northern European | 34 | 0.1% |
| Norwegian | 492 | 1.7% |
| Pennsylvania German | 10 | 0.0% |
| Peruvian | 55 | 0.2% |
| Polish | 140 | 0.5% |
| Portuguese | 8 | 0.0% |
| Puerto Rican | 107 | 0.4% |
| Puget Sound Salish | 10 | 0.0% |
| Russian | 338 | 1.2% |
| Salvadoran | 337 | 1.2% |
| Scandinavian | 29 | 0.1% |
| Scotch-Irish | 331 | 1.1% |
| Scottish | 630 | 2.2% |
| Seminole | 6 | 0.0% |
| Shoshone | 3 | 0.0% |
| Sioux | 55 | 0.2% |
| Slovak | 17 | 0.1% |
| Slovene | 3 | 0.0% |
| Somali | 167 | 0.6% |
| South American | 155 | 0.5% |
| South American Indian | 12 | 0.0% |
| Spaniard | 83 | 0.3% |
| Spanish | 33 | 0.1% |
| Spanish American | 23 | 0.1% |
| Spanish American Indian | 23 | 0.1% |
| Sri Lankan | 3 | 0.0% |
| Subsaharan African | 468 | 1.6% |
| Swedish | 819 | 2.8% |
| Swiss | 35 | 0.1% |
| Thai | 51 | 0.2% |
| Ukrainian | 3 | 0.0% |
| Welsh | 28 | 0.1% |
| Yugoslavian | 18 | 0.1% | View All 84 Rows |
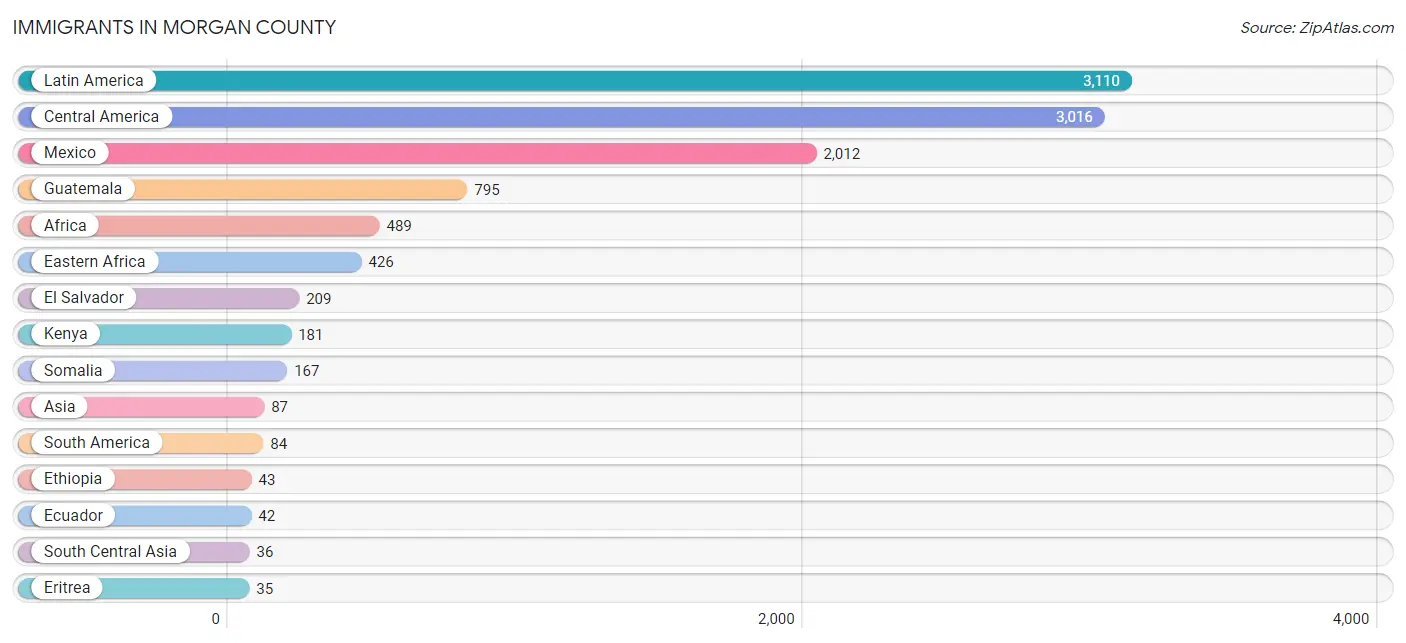
Immigrants in Morgan County
The most numerous immigrant groups reported in Morgan County came from Latin America (3,110 | 10.7%), Central America (3,016 | 10.4%), Mexico (2,012 | 6.9%), Guatemala (795 | 2.7%), and Africa (489 | 1.7%), together accounting for 32.4% of all Morgan County residents.
| Immigration Origin | # Population | % Population |
| Africa | 489 | 1.7% |
| Asia | 87 | 0.3% |
| Austria | 6 | 0.0% |
| Bosnia and Herzegovina | 5 | 0.0% |
| Canada | 11 | 0.0% |
| Caribbean | 10 | 0.0% |
| Central America | 3,016 | 10.4% |
| China | 13 | 0.0% |
| Colombia | 16 | 0.1% |
| Dominican Republic | 10 | 0.0% |
| Eastern Africa | 426 | 1.5% |
| Eastern Asia | 17 | 0.1% |
| Eastern Europe | 8 | 0.0% |
| Ecuador | 42 | 0.1% |
| Egypt | 2 | 0.0% |
| El Salvador | 209 | 0.7% |
| Eritrea | 35 | 0.1% |
| Ethiopia | 43 | 0.2% |
| Europe | 19 | 0.1% |
| Guatemala | 795 | 2.7% |
| India | 31 | 0.1% |
| Iran | 5 | 0.0% |
| Japan | 4 | 0.0% |
| Kenya | 181 | 0.6% |
| Latin America | 3,110 | 10.7% |
| Mexico | 2,012 | 6.9% |
| Northern Africa | 2 | 0.0% |
| Northern Europe | 5 | 0.0% |
| Norway | 2 | 0.0% |
| Peru | 26 | 0.1% |
| Philippines | 34 | 0.1% |
| Scotland | 3 | 0.0% |
| Somalia | 167 | 0.6% |
| South America | 84 | 0.3% |
| South Central Asia | 36 | 0.1% |
| South Eastern Asia | 34 | 0.1% |
| Ukraine | 3 | 0.0% |
| Western Europe | 6 | 0.0% | View All 38 Rows |
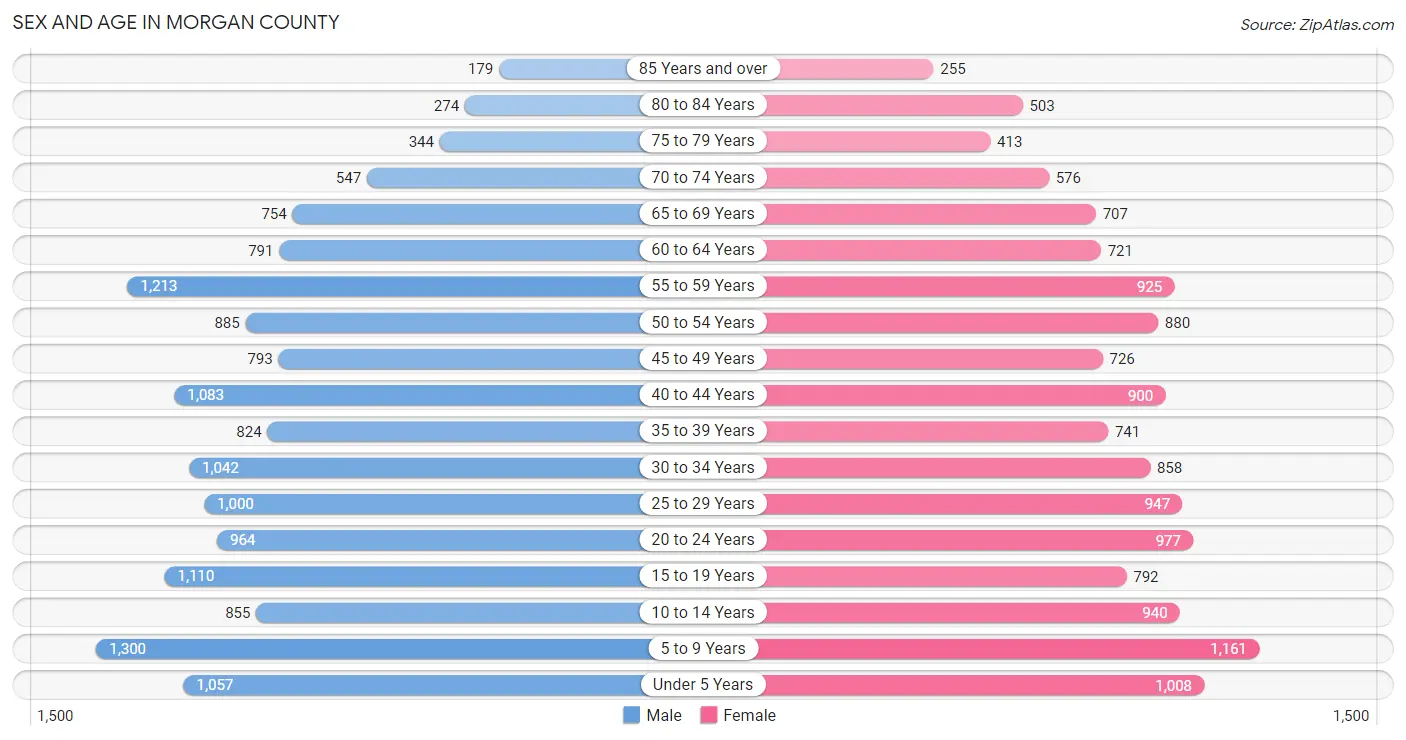
Sex and Age in Morgan County
Sex and Age in Morgan County
The most populous age groups in Morgan County are 5 to 9 Years (1,300 | 8.7%) for men and 5 to 9 Years (1,161 | 8.3%) for women.
| Age Bracket | Male | Female |
| Under 5 Years | 1,057 (7.0%) | 1,008 (7.2%) |
| 5 to 9 Years | 1,300 (8.7%) | 1,161 (8.3%) |
| 10 to 14 Years | 855 (5.7%) | 940 (6.7%) |
| 15 to 19 Years | 1,110 (7.4%) | 792 (5.7%) |
| 20 to 24 Years | 964 (6.4%) | 977 (7.0%) |
| 25 to 29 Years | 1,000 (6.7%) | 947 (6.8%) |
| 30 to 34 Years | 1,042 (6.9%) | 858 (6.1%) |
| 35 to 39 Years | 824 (5.5%) | 741 (5.3%) |
| 40 to 44 Years | 1,083 (7.2%) | 900 (6.4%) |
| 45 to 49 Years | 793 (5.3%) | 726 (5.2%) |
| 50 to 54 Years | 885 (5.9%) | 880 (6.3%) |
| 55 to 59 Years | 1,213 (8.1%) | 925 (6.6%) |
| 60 to 64 Years | 791 (5.3%) | 721 (5.1%) |
| 65 to 69 Years | 754 (5.0%) | 707 (5.0%) |
| 70 to 74 Years | 547 (3.6%) | 576 (4.1%) |
| 75 to 79 Years | 344 (2.3%) | 413 (2.9%) |
| 80 to 84 Years | 274 (1.8%) | 503 (3.6%) |
| 85 Years and over | 179 (1.2%) | 255 (1.8%) |
| Total | 15,015 (100.0%) | 14,030 (100.0%) |
Families and Households in Morgan County
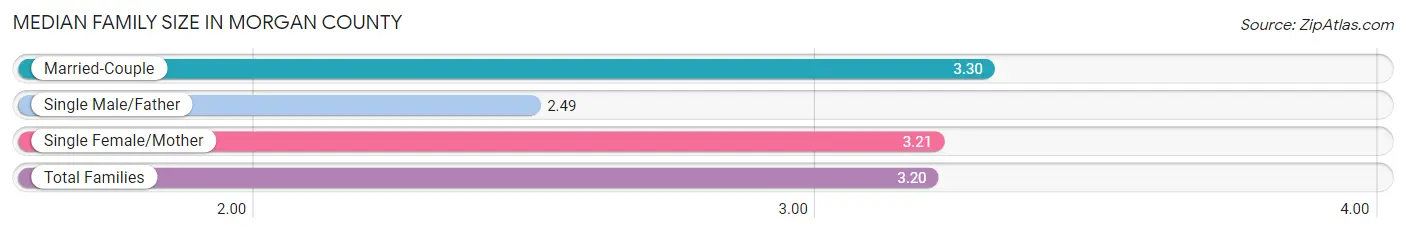
Median Family Size in Morgan County
The median family size in Morgan County is 3.20 persons per family, with married-couple families (5,678 | 76.0%) accounting for the largest median family size of 3.3 persons per family. On the other hand, single male/father families (819 | 11.0%) represent the smallest median family size with 2.49 persons per family.
| Family Type | # Families | Family Size |
| Married-Couple | 5,678 (76.0%) | 3.30 |
| Single Male/Father | 819 (11.0%) | 2.49 |
| Single Female/Mother | 973 (13.0%) | 3.21 |
| Total Families | 7,470 (100.0%) | 3.20 |
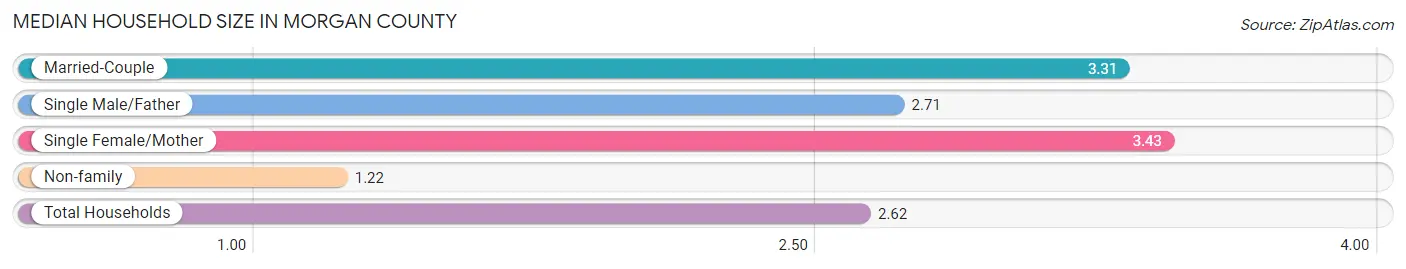
Median Household Size in Morgan County
The median household size in Morgan County is 2.62 persons per household, with single female/mother households (973 | 8.9%) accounting for the largest median household size of 3.43 persons per household. non-family households (3,402 | 31.3%) represent the smallest median household size with 1.22 persons per household.
| Household Type | # Households | Household Size |
| Married-Couple | 5,678 (52.2%) | 3.31 |
| Single Male/Father | 819 (7.5%) | 2.71 |
| Single Female/Mother | 973 (8.9%) | 3.43 |
| Non-family | 3,402 (31.3%) | 1.22 |
| Total Households | 10,872 (100.0%) | 2.62 |
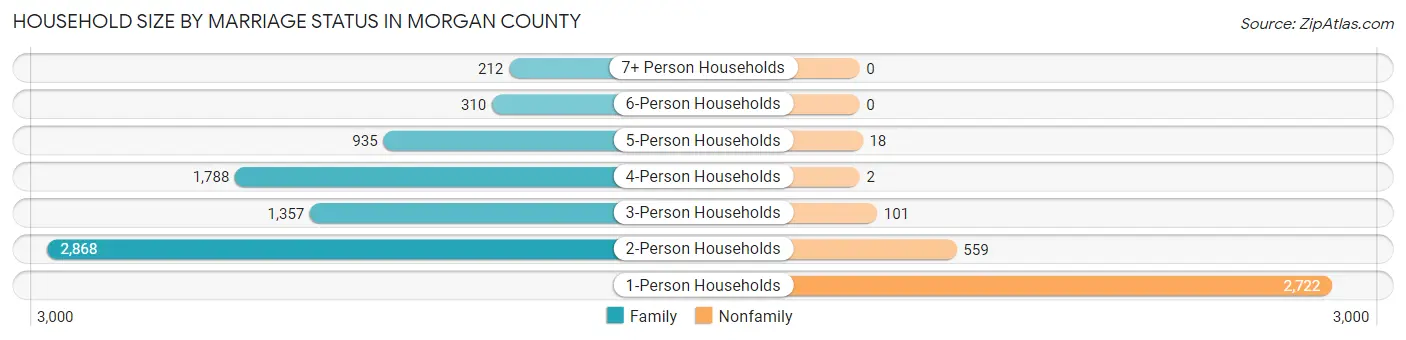
Household Size by Marriage Status in Morgan County
Out of a total of 10,872 households in Morgan County, 7,470 (68.7%) are family households, while 3,402 (31.3%) are nonfamily households. The most numerous type of family households are 2-person households, comprising 2,868, and the most common type of nonfamily households are 1-person households, comprising 2,722.
| Household Size | Family Households | Nonfamily Households |
| 1-Person Households | - | 2,722 (25.0%) |
| 2-Person Households | 2,868 (26.4%) | 559 (5.1%) |
| 3-Person Households | 1,357 (12.5%) | 101 (0.9%) |
| 4-Person Households | 1,788 (16.5%) | 2 (0.0%) |
| 5-Person Households | 935 (8.6%) | 18 (0.2%) |
| 6-Person Households | 310 (2.9%) | 0 (0.0%) |
| 7+ Person Households | 212 (1.9%) | 0 (0.0%) |
| Total | 7,470 (68.7%) | 3,402 (31.3%) |
Female Fertility in Morgan County
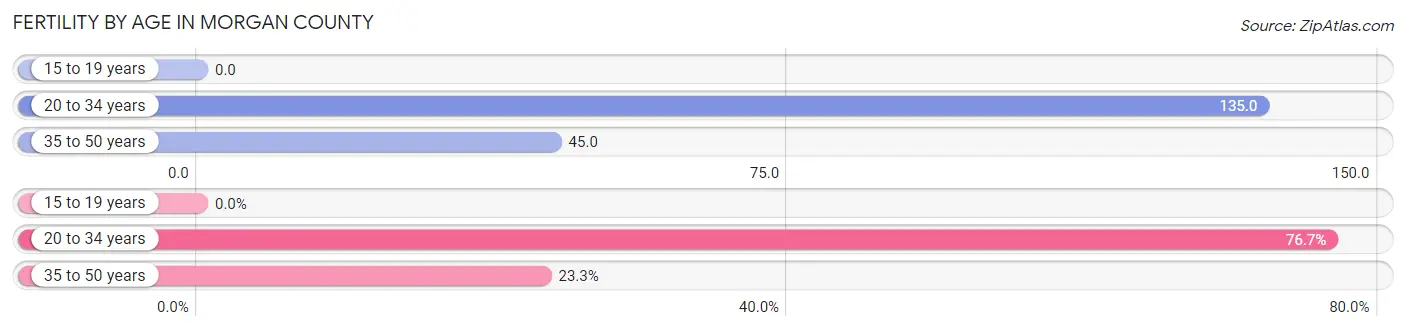
Fertility by Age in Morgan County
Average fertility rate in Morgan County is 80.0 births per 1,000 women. Women in the age bracket of 20 to 34 years have the highest fertility rate with 135.0 births per 1,000 women. Women in the age bracket of 20 to 34 years acount for 76.7% of all women with births.
| Age Bracket | Women with Births | Births / 1,000 Women |
| 15 to 19 years | 0 (0.0%) | 0.0 |
| 20 to 34 years | 375 (76.7%) | 135.0 |
| 35 to 50 years | 114 (23.3%) | 45.0 |
| Total | 489 (100.0%) | 80.0 |
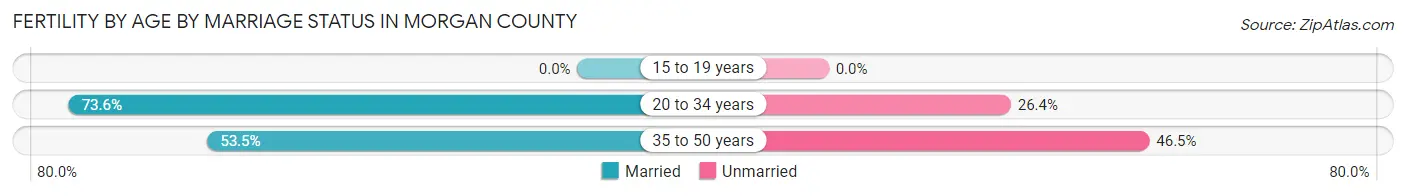
Fertility by Age by Marriage Status in Morgan County
68.9% of women with births (489) in Morgan County are married. The highest percentage of unmarried women with births falls into 35 to 50 years age bracket with 46.5% of them unmarried at the time of birth, while the lowest percentage of unmarried women with births belong to 20 to 34 years age bracket with 26.4% of them unmarried.
| Age Bracket | Married | Unmarried |
| 15 to 19 years | 0 (0.0%) | 0 (0.0%) |
| 20 to 34 years | 276 (73.6%) | 99 (26.4%) |
| 35 to 50 years | 61 (53.5%) | 53 (46.5%) |
| Total | 337 (68.9%) | 152 (31.1%) |
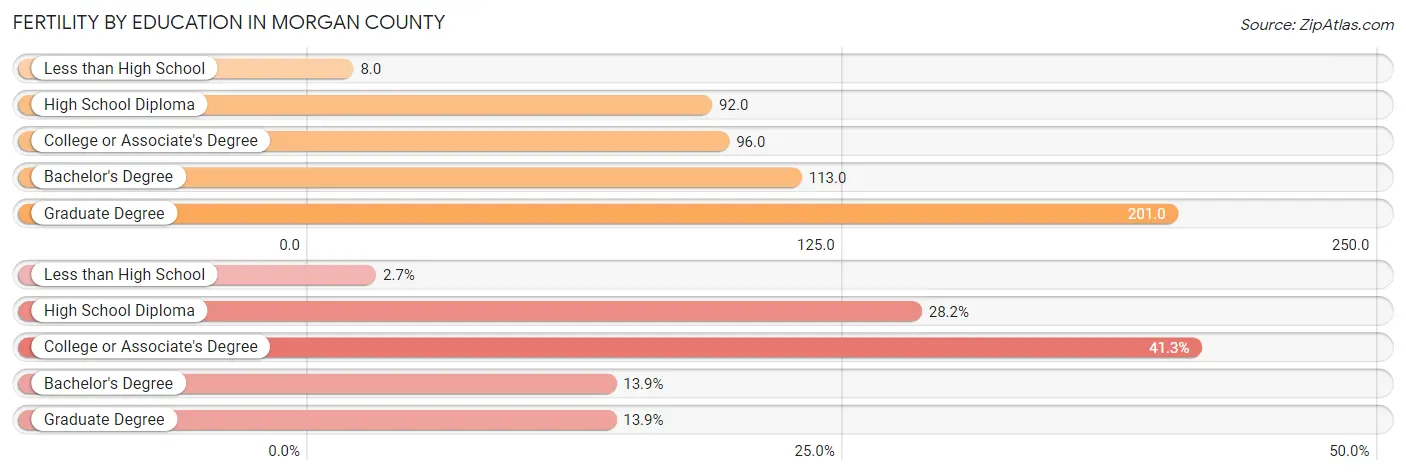
Fertility by Education in Morgan County
Average fertility rate in Morgan County is 80.0 births per 1,000 women. Women with the education attainment of graduate degree have the highest fertility rate of 201.0 births per 1,000 women, while women with the education attainment of less than high school have the lowest fertility at 8.0 births per 1,000 women. Women with the education attainment of college or associate's degree represent 41.3% of all women with births.
| Educational Attainment | Women with Births | Births / 1,000 Women |
| Less than High School | 13 (2.7%) | 8.0 |
| High School Diploma | 138 (28.2%) | 92.0 |
| College or Associate's Degree | 202 (41.3%) | 96.0 |
| Bachelor's Degree | 68 (13.9%) | 113.0 |
| Graduate Degree | 68 (13.9%) | 201.0 |
| Total | 489 (100.0%) | 80.0 |
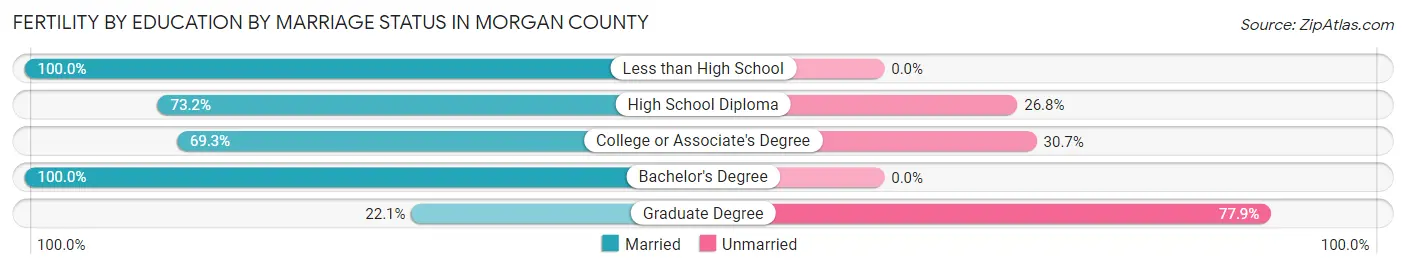
Fertility by Education by Marriage Status in Morgan County
31.1% of women with births in Morgan County are unmarried. Women with the educational attainment of less than high school are most likely to be married with 100.0% of them married at childbirth, while women with the educational attainment of graduate degree are least likely to be married with 77.9% of them unmarried at childbirth.
| Educational Attainment | Married | Unmarried |
| Less than High School | 13 (100.0%) | 0 (0.0%) |
| High School Diploma | 101 (73.2%) | 37 (26.8%) |
| College or Associate's Degree | 140 (69.3%) | 62 (30.7%) |
| Bachelor's Degree | 68 (100.0%) | 0 (0.0%) |
| Graduate Degree | 15 (22.1%) | 53 (77.9%) |
| Total | 337 (68.9%) | 152 (31.1%) |
Income in Morgan County
Income Overview in Morgan County
Per Capita Income in Morgan County is $30,422, while median incomes of families and households are $81,066 and $70,471 respectively.
| Characteristic | Number | Measure |
| Per Capita Income | 29,045 | $30,422 |
| Median Family Income | 7,470 | $81,066 |
| Mean Family Income | 7,470 | $93,854 |
| Median Household Income | 10,872 | $70,471 |
| Mean Household Income | 10,872 | $80,351 |
| Income Deficit | 7,470 | $11,070 |
| Wage / Income Gap (%) | 29,045 | 40.37% |
| Wage / Income Gap ($) | 29,045 | 59.63¢ per $1 |
| Gini / Inequality Index | 29,045 | 0.41 |
Earnings by Sex in Morgan County
Average Earnings in Morgan County are $40,418, $47,396 for men and $28,263 for women, a difference of 40.4%.
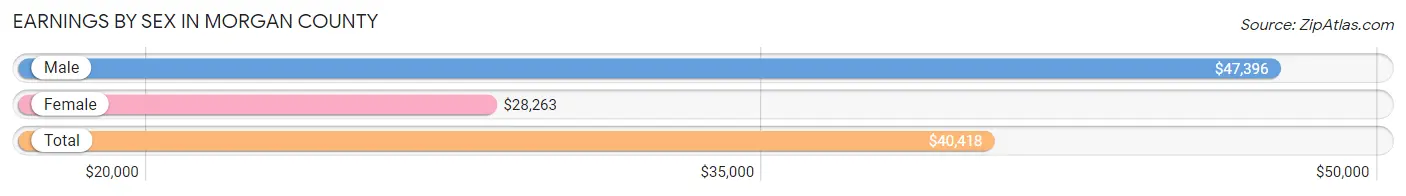
| Sex | Number | Average Earnings |
| Male | 8,956 (58.9%) | $47,396 |
| Female | 6,263 (41.1%) | $28,263 |
| Total | 15,219 (100.0%) | $40,418 |
Earnings by Sex by Income Bracket in Morgan County
The most common earnings brackets in Morgan County are $75,000 to $99,999 for men (1,088 | 12.1%) and $25,000 to $29,999 for women (643 | 10.3%).
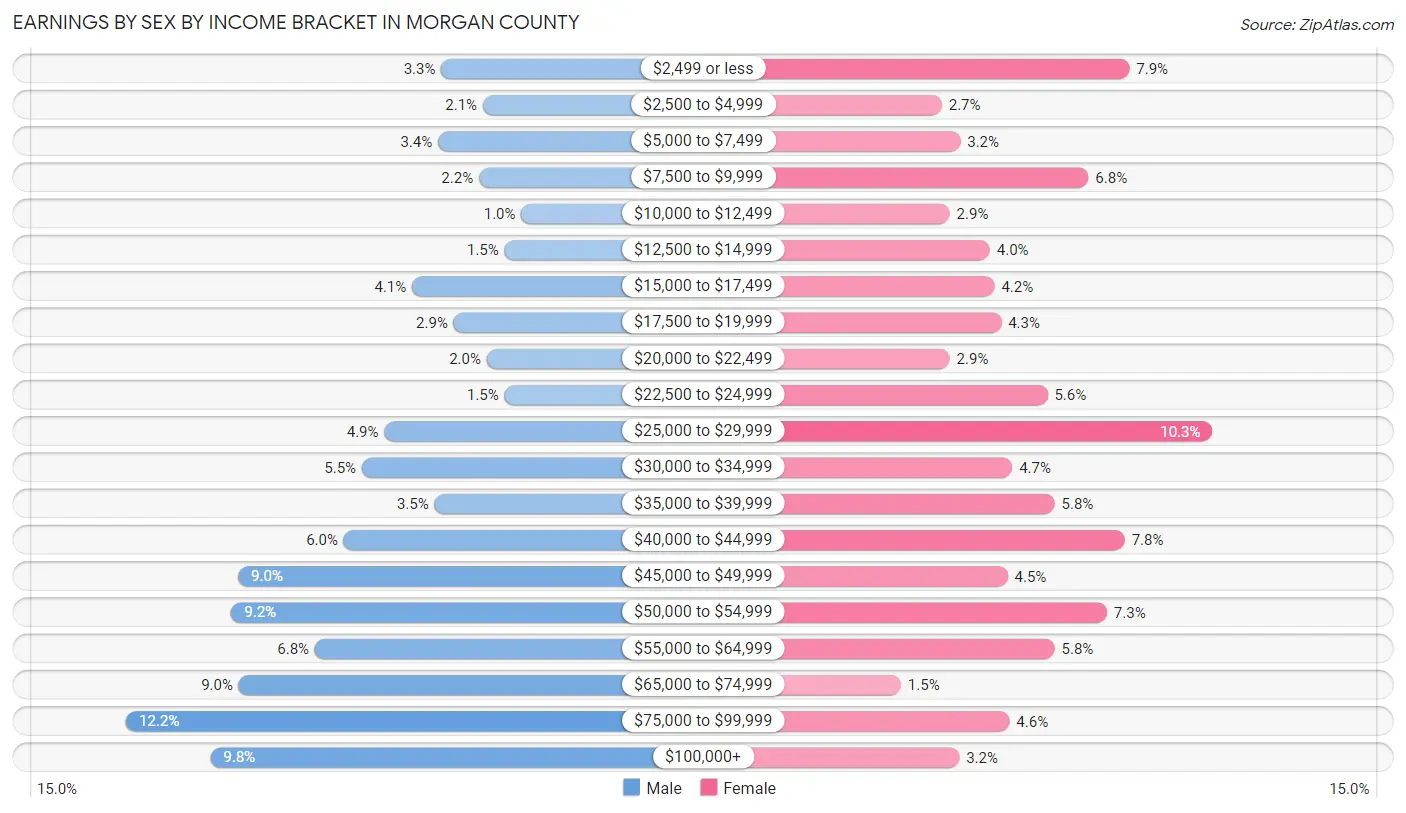
| Income | Male | Female |
| $2,499 or less | 295 (3.3%) | 497 (7.9%) |
| $2,500 to $4,999 | 190 (2.1%) | 167 (2.7%) |
| $5,000 to $7,499 | 303 (3.4%) | 200 (3.2%) |
| $7,500 to $9,999 | 200 (2.2%) | 425 (6.8%) |
| $10,000 to $12,499 | 93 (1.0%) | 181 (2.9%) |
| $12,500 to $14,999 | 135 (1.5%) | 252 (4.0%) |
| $15,000 to $17,499 | 368 (4.1%) | 260 (4.2%) |
| $17,500 to $19,999 | 263 (2.9%) | 272 (4.3%) |
| $20,000 to $22,499 | 180 (2.0%) | 181 (2.9%) |
| $22,500 to $24,999 | 135 (1.5%) | 353 (5.6%) |
| $25,000 to $29,999 | 438 (4.9%) | 643 (10.3%) |
| $30,000 to $34,999 | 494 (5.5%) | 291 (4.6%) |
| $35,000 to $39,999 | 312 (3.5%) | 366 (5.8%) |
| $40,000 to $44,999 | 540 (6.0%) | 489 (7.8%) |
| $45,000 to $49,999 | 806 (9.0%) | 283 (4.5%) |
| $50,000 to $54,999 | 823 (9.2%) | 458 (7.3%) |
| $55,000 to $64,999 | 613 (6.8%) | 366 (5.8%) |
| $65,000 to $74,999 | 804 (9.0%) | 95 (1.5%) |
| $75,000 to $99,999 | 1,088 (12.1%) | 286 (4.6%) |
| $100,000+ | 876 (9.8%) | 198 (3.2%) |
| Total | 8,956 (100.0%) | 6,263 (100.0%) |
Earnings by Sex by Educational Attainment in Morgan County
Average earnings in Morgan County are $52,700 for men and $30,938 for women, a difference of 41.3%. Men with an educational attainment of graduate degree enjoy the highest average annual earnings of $70,900, while those with less than high school education earn the least with $44,479. Women with an educational attainment of graduate degree earn the most with the average annual earnings of $55,667, while those with high school diploma education have the smallest earnings of $25,532.
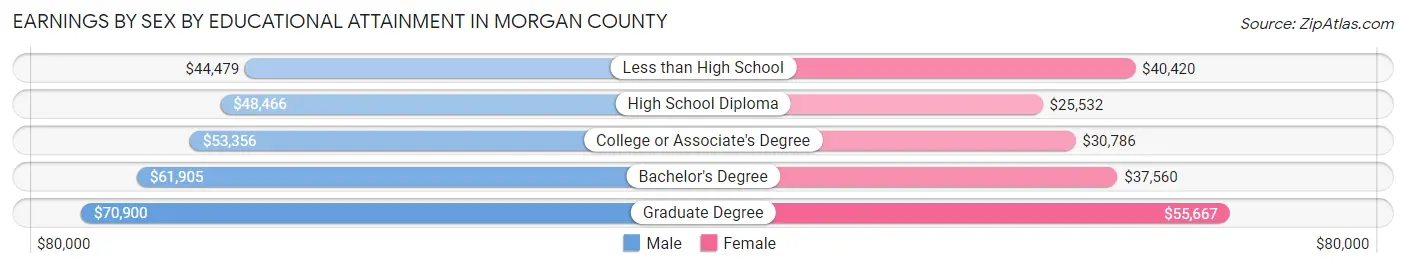
| Educational Attainment | Male Income | Female Income |
| Less than High School | $44,479 | $40,420 |
| High School Diploma | $48,466 | $25,532 |
| College or Associate's Degree | $53,356 | $30,786 |
| Bachelor's Degree | $61,905 | $37,560 |
| Graduate Degree | $70,900 | $55,667 |
| Total | $52,700 | $30,938 |
Family Income in Morgan County
Family Income Brackets in Morgan County
According to the Morgan County family income data, there are 1,621 families falling into the $50,000 to $74,999 income range, which is the most common income bracket and makes up 21.7% of all families. Conversely, the $10,000 to $14,999 income bracket is the least frequent group with only 120 families (1.6%) belonging to this category.
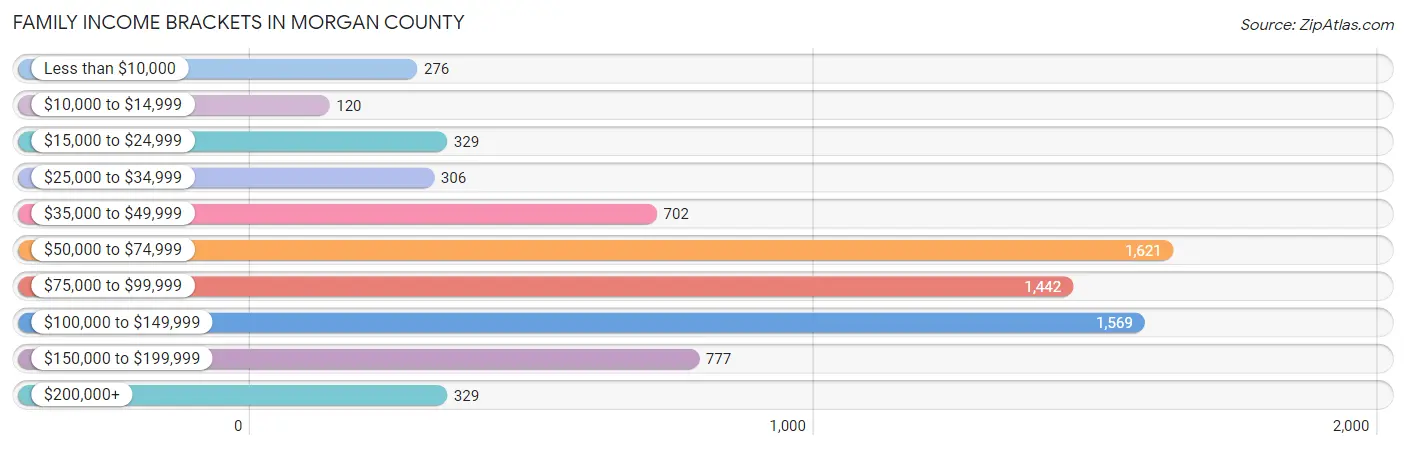
| Income Bracket | # Families | % Families |
| Less than $10,000 | 276 | 3.7% |
| $10,000 to $14,999 | 120 | 1.6% |
| $15,000 to $24,999 | 329 | 4.4% |
| $25,000 to $34,999 | 306 | 4.1% |
| $35,000 to $49,999 | 702 | 9.4% |
| $50,000 to $74,999 | 1,621 | 21.7% |
| $75,000 to $99,999 | 1,442 | 19.3% |
| $100,000 to $149,999 | 1,569 | 21.0% |
| $150,000 to $199,999 | 777 | 10.4% |
| $200,000+ | 329 | 4.4% |
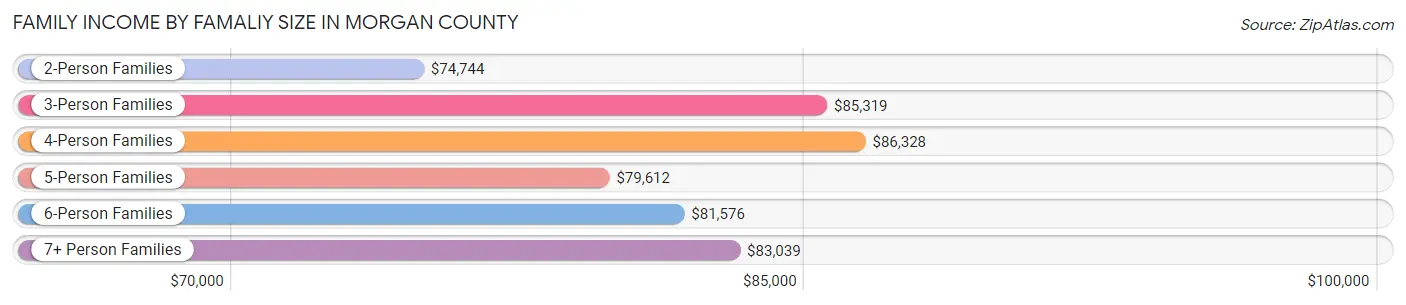
Family Income by Famaliy Size in Morgan County
4-person families (1,627 | 21.8%) account for the highest median family income in Morgan County with $86,328 per family, while 2-person families (2,998 | 40.1%) have the highest median income of $37,372 per family member.
| Income Bracket | # Families | Median Income |
| 2-Person Families | 2,998 (40.1%) | $74,744 |
| 3-Person Families | 1,465 (19.6%) | $85,319 |
| 4-Person Families | 1,627 (21.8%) | $86,328 |
| 5-Person Families | 858 (11.5%) | $79,612 |
| 6-Person Families | 319 (4.3%) | $81,576 |
| 7+ Person Families | 203 (2.7%) | $83,039 |
| Total | 7,470 (100.0%) | $81,066 |
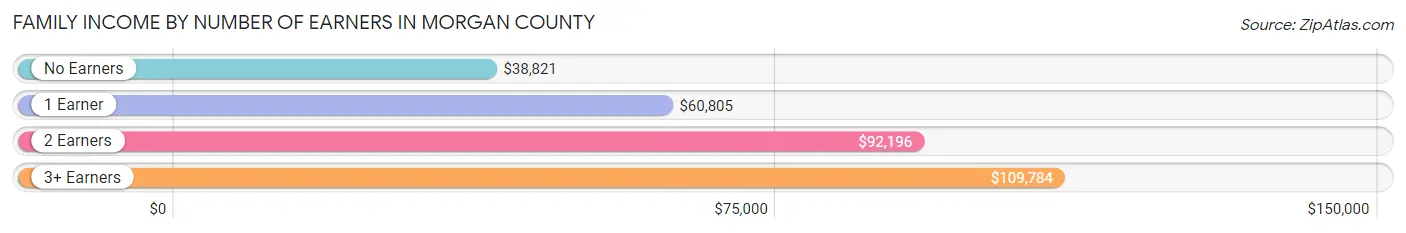
Family Income by Number of Earners in Morgan County
The median family income in Morgan County is $81,066, with families comprising 3+ earners (1,207) having the highest median family income of $109,784, while families with no earners (849) have the lowest median family income of $38,821, accounting for 16.2% and 11.4% of families, respectively.
| Number of Earners | # Families | Median Income |
| No Earners | 849 (11.4%) | $38,821 |
| 1 Earner | 2,292 (30.7%) | $60,805 |
| 2 Earners | 3,122 (41.8%) | $92,196 |
| 3+ Earners | 1,207 (16.2%) | $109,784 |
| Total | 7,470 (100.0%) | $81,066 |
Household Income in Morgan County
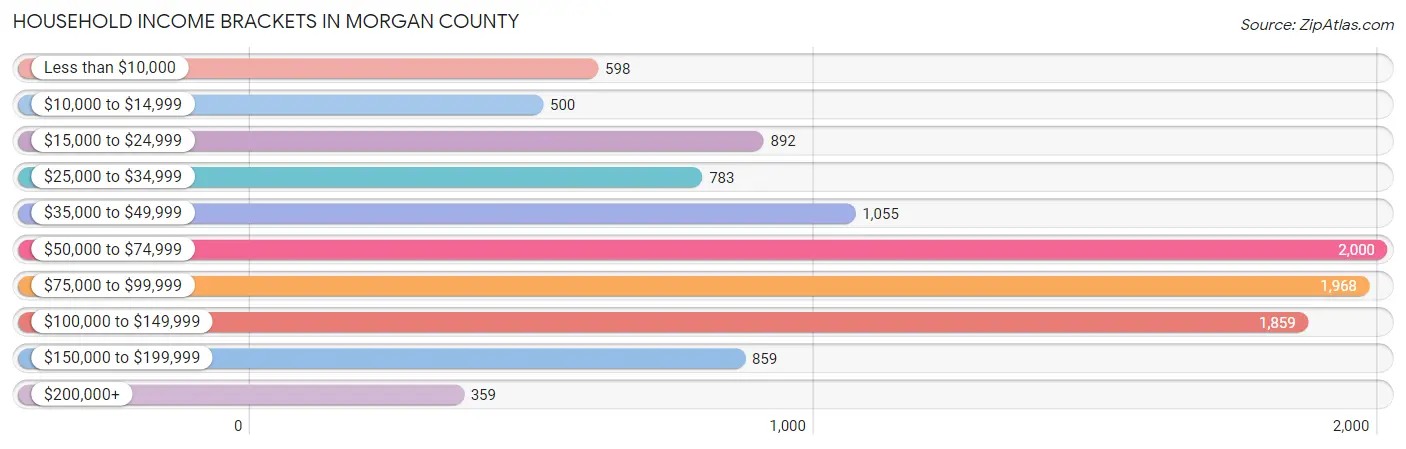
Household Income Brackets in Morgan County
With 2,000 households falling in the category, the $50,000 to $74,999 income range is the most frequent in Morgan County, accounting for 18.4% of all households. In contrast, only 359 households (3.3%) fall into the $200,000+ income bracket, making it the least populous group.
| Income Bracket | # Households | % Households |
| Less than $10,000 | 598 | 5.5% |
| $10,000 to $14,999 | 500 | 4.6% |
| $15,000 to $24,999 | 892 | 8.2% |
| $25,000 to $34,999 | 783 | 7.2% |
| $35,000 to $49,999 | 1,055 | 9.7% |
| $50,000 to $74,999 | 2,000 | 18.4% |
| $75,000 to $99,999 | 1,968 | 18.1% |
| $100,000 to $149,999 | 1,859 | 17.1% |
| $150,000 to $199,999 | 859 | 7.9% |
| $200,000+ | 359 | 3.3% |
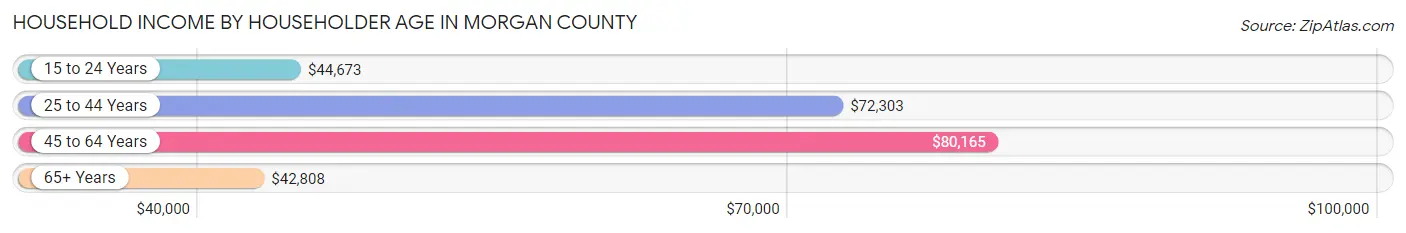
Household Income by Householder Age in Morgan County
The median household income in Morgan County is $70,471, with the highest median household income of $80,165 found in the 45 to 64 years age bracket for the primary householder. A total of 3,673 households (33.8%) fall into this category. Meanwhile, the 65+ years age bracket for the primary householder has the lowest median household income of $42,808, with 2,967 households (27.3%) in this group.
| Income Bracket | # Households | Median Income |
| 15 to 24 Years | 535 (4.9%) | $44,673 |
| 25 to 44 Years | 3,697 (34.0%) | $72,303 |
| 45 to 64 Years | 3,673 (33.8%) | $80,165 |
| 65+ Years | 2,967 (27.3%) | $42,808 |
| Total | 10,872 (100.0%) | $70,471 |
Poverty in Morgan County
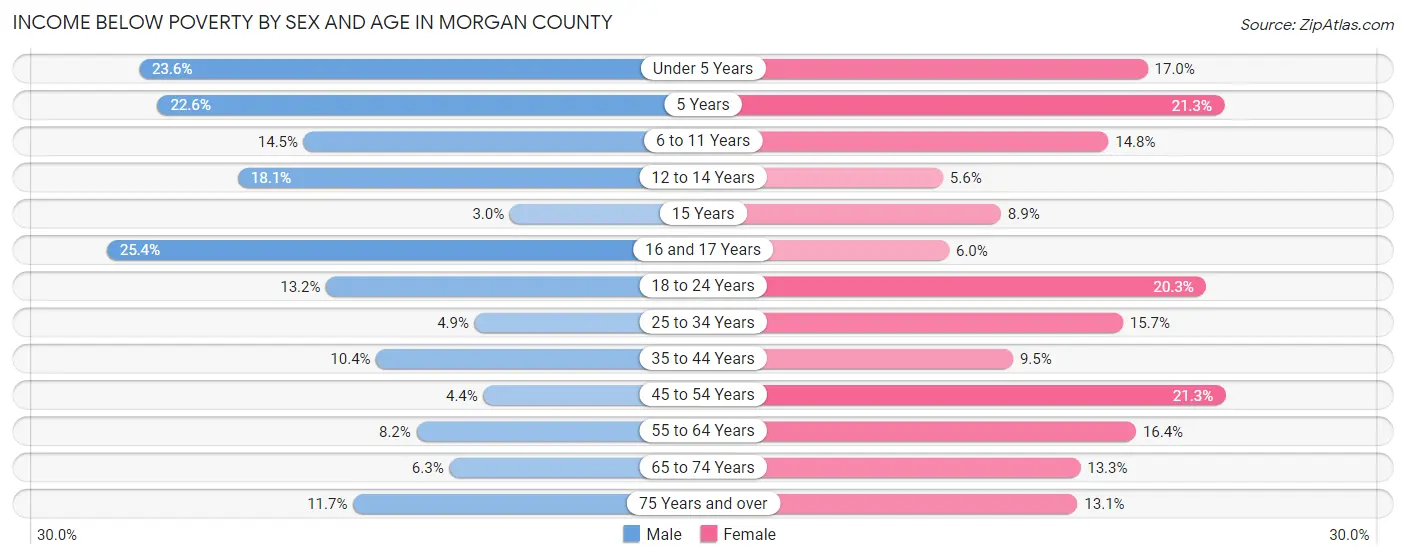
Income Below Poverty by Sex and Age in Morgan County
With 10.7% poverty level for males and 15.1% for females among the residents of Morgan County, 16 and 17 year old males and 45 to 54 year old females are the most vulnerable to poverty, with 105 males (25.4%) and 337 females (21.3%) in their respective age groups living below the poverty level.
| Age Bracket | Male | Female |
| Under 5 Years | 238 (23.6%) | 171 (17.0%) |
| 5 Years | 33 (22.6%) | 57 (21.3%) |
| 6 to 11 Years | 220 (14.4%) | 206 (14.8%) |
| 12 to 14 Years | 87 (18.1%) | 24 (5.6%) |
| 15 Years | 7 (3.0%) | 21 (8.9%) |
| 16 and 17 Years | 105 (25.4%) | 19 (6.0%) |
| 18 to 24 Years | 187 (13.2%) | 246 (20.3%) |
| 25 to 34 Years | 99 (4.9%) | 281 (15.7%) |
| 35 to 44 Years | 196 (10.4%) | 154 (9.5%) |
| 45 to 54 Years | 74 (4.4%) | 337 (21.3%) |
| 55 to 64 Years | 162 (8.2%) | 267 (16.4%) |
| 65 to 74 Years | 80 (6.3%) | 161 (13.3%) |
| 75 Years and over | 88 (11.7%) | 142 (13.1%) |
| Total | 1,576 (10.7%) | 2,086 (15.1%) |
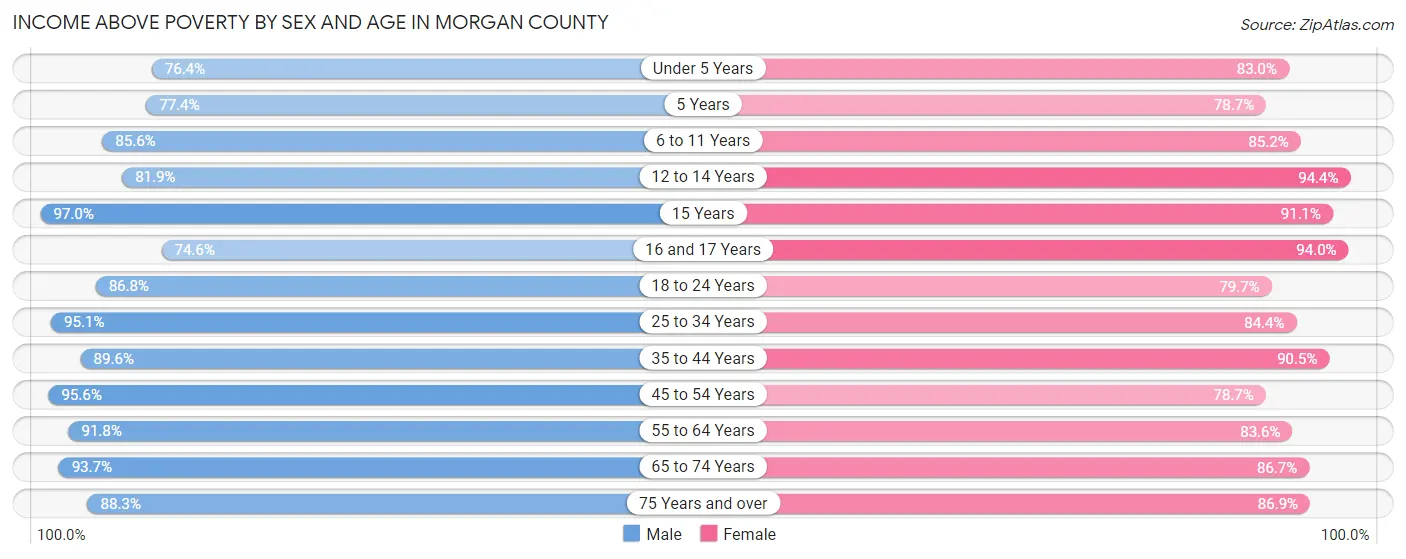
Income Above Poverty by Sex and Age in Morgan County
According to the poverty statistics in Morgan County, males aged 15 years and females aged 12 to 14 years are the age groups that are most secure financially, with 97.0% of males and 94.4% of females in these age groups living above the poverty line.
| Age Bracket | Male | Female |
| Under 5 Years | 769 (76.4%) | 833 (83.0%) |
| 5 Years | 113 (77.4%) | 211 (78.7%) |
| 6 to 11 Years | 1,303 (85.6%) | 1,182 (85.2%) |
| 12 to 14 Years | 393 (81.9%) | 402 (94.4%) |
| 15 Years | 229 (97.0%) | 216 (91.1%) |
| 16 and 17 Years | 308 (74.6%) | 299 (94.0%) |
| 18 to 24 Years | 1,230 (86.8%) | 968 (79.7%) |
| 25 to 34 Years | 1,911 (95.1%) | 1,515 (84.4%) |
| 35 to 44 Years | 1,686 (89.6%) | 1,462 (90.5%) |
| 45 to 54 Years | 1,591 (95.6%) | 1,242 (78.7%) |
| 55 to 64 Years | 1,821 (91.8%) | 1,363 (83.6%) |
| 65 to 74 Years | 1,181 (93.7%) | 1,051 (86.7%) |
| 75 Years and over | 664 (88.3%) | 940 (86.9%) |
| Total | 13,199 (89.3%) | 11,684 (84.9%) |
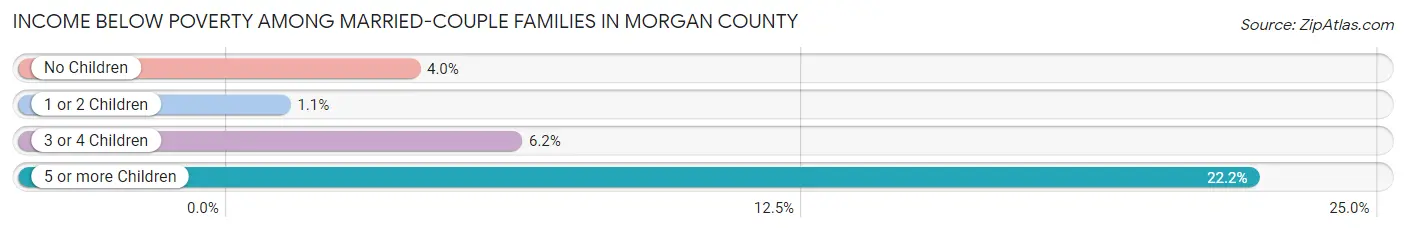
Income Below Poverty Among Married-Couple Families in Morgan County
The poverty statistics for married-couple families in Morgan County show that 3.5% or 196 of the total 5,678 families live below the poverty line. Families with 5 or more children have the highest poverty rate of 22.2%, comprising of 16 families. On the other hand, families with 1 or 2 children have the lowest poverty rate of 1.1%, which includes 24 families.
| Children | Above Poverty | Below Poverty |
| No Children | 2,598 (96.0%) | 107 (4.0%) |
| 1 or 2 Children | 2,084 (98.9%) | 24 (1.1%) |
| 3 or 4 Children | 744 (93.8%) | 49 (6.2%) |
| 5 or more Children | 56 (77.8%) | 16 (22.2%) |
| Total | 5,482 (96.6%) | 196 (3.5%) |
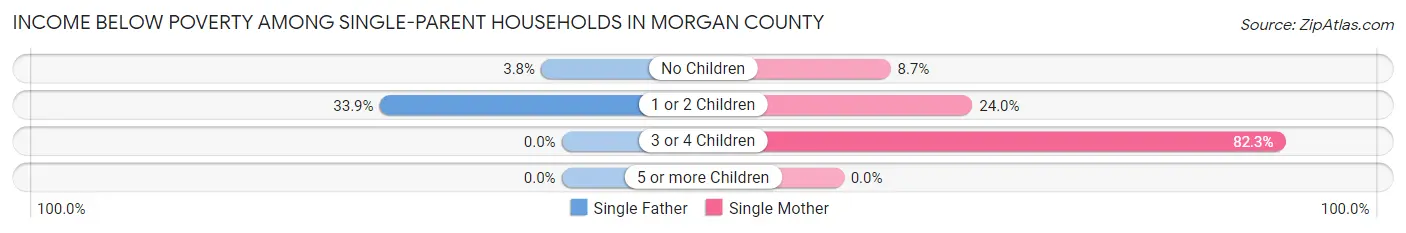
Income Below Poverty Among Single-Parent Households in Morgan County
According to the poverty data in Morgan County, 20.5% or 168 single-father households and 34.1% or 332 single-mother households are living below the poverty line. Among single-father households, those with 1 or 2 children have the highest poverty rate, with 154 households (33.9%) experiencing poverty. Likewise, among single-mother households, those with 3 or 4 children have the highest poverty rate, with 190 households (82.3%) falling below the poverty line.
| Children | Single Father | Single Mother |
| No Children | 14 (3.8%) | 20 (8.7%) |
| 1 or 2 Children | 154 (33.9%) | 122 (24.0%) |
| 3 or 4 Children | 0 (0.0%) | 190 (82.3%) |
| 5 or more Children | 0 (0.0%) | 0 (0.0%) |
| Total | 168 (20.5%) | 332 (34.1%) |
Income Below Poverty Among Married-Couple vs Single-Parent Households in Morgan County
The poverty data for Morgan County shows that 196 of the married-couple family households (3.5%) and 500 of the single-parent households (27.9%) are living below the poverty level. Within the married-couple family households, those with 5 or more children have the highest poverty rate, with 16 households (22.2%) falling below the poverty line. Among the single-parent households, those with 3 or 4 children have the highest poverty rate, with 190 household (82.3%) living below poverty.
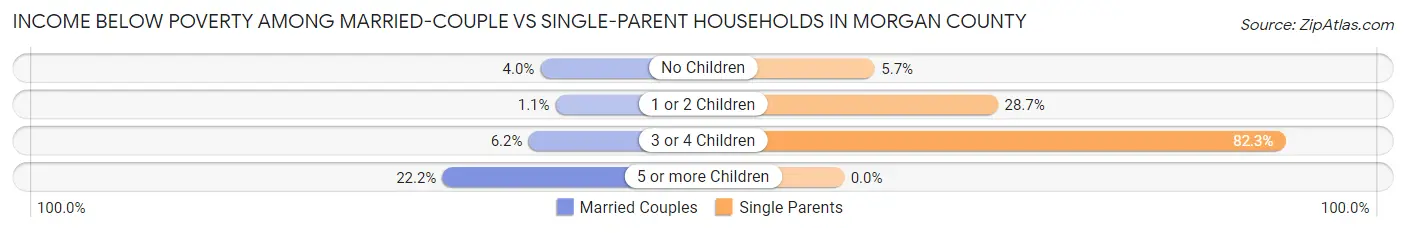
| Children | Married-Couple Families | Single-Parent Households |
| No Children | 107 (4.0%) | 34 (5.7%) |
| 1 or 2 Children | 24 (1.1%) | 276 (28.7%) |
| 3 or 4 Children | 49 (6.2%) | 190 (82.3%) |
| 5 or more Children | 16 (22.2%) | 0 (0.0%) |
| Total | 196 (3.5%) | 500 (27.9%) |
Employment Characteristics in Morgan County
Employment by Class of Employer in Morgan County
Among the 13,360 employed individuals in Morgan County, private company employees (8,963 | 67.1%), local government employees (1,300 | 9.7%), and self-employed (not incorporated) (1,108 | 8.3%) make up the most common classes of employment.
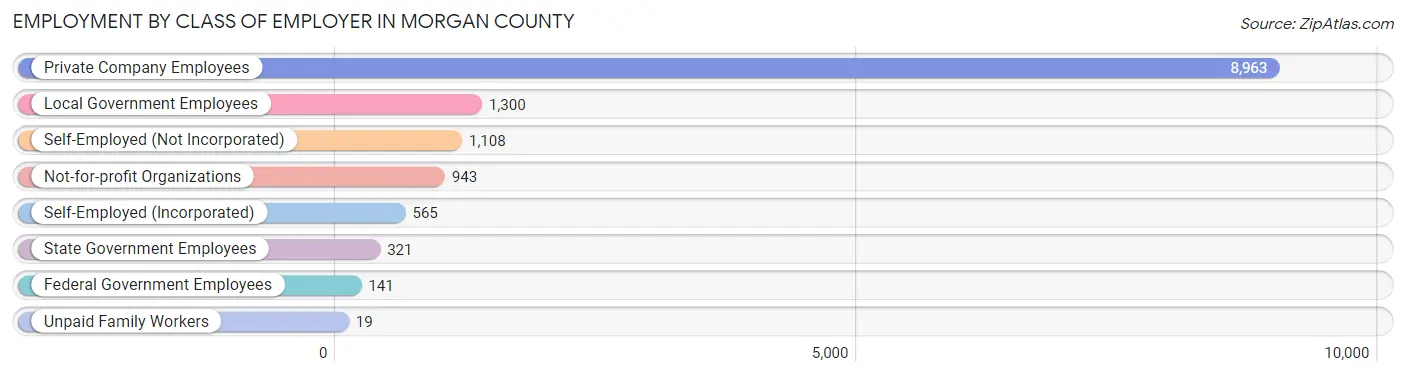
| Employer Class | # Employees | % Employees |
| Private Company Employees | 8,963 | 67.1% |
| Self-Employed (Incorporated) | 565 | 4.2% |
| Self-Employed (Not Incorporated) | 1,108 | 8.3% |
| Not-for-profit Organizations | 943 | 7.1% |
| Local Government Employees | 1,300 | 9.7% |
| State Government Employees | 321 | 2.4% |
| Federal Government Employees | 141 | 1.1% |
| Unpaid Family Workers | 19 | 0.1% |
| Total | 13,360 | 100.0% |
Employment Status by Age in Morgan County
According to the labor force statistics for Morgan County, out of the total population over 16 years of age (22,251), 64.4% or 14,330 individuals are in the labor force, with 3.7% or 530 of them unemployed. The age group with the highest labor force participation rate is 30 to 34 years, with 87.8% or 1,668 individuals in the labor force. Within the labor force, the 20 to 24 years age range has the highest percentage of unemployed individuals, with 7.8% or 130 of them being unemployed.
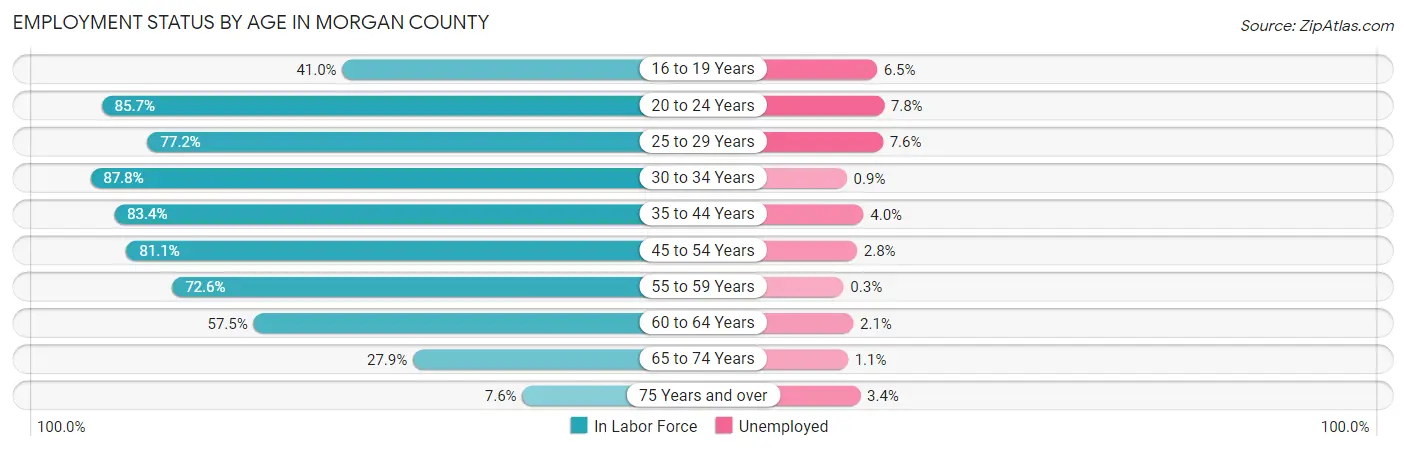
| Age Bracket | In Labor Force | Unemployed |
| 16 to 19 Years | 586 (41.0%) | 38 (6.5%) |
| 20 to 24 Years | 1,663 (85.7%) | 130 (7.8%) |
| 25 to 29 Years | 1,503 (77.2%) | 114 (7.6%) |
| 30 to 34 Years | 1,668 (87.8%) | 15 (0.9%) |
| 35 to 44 Years | 2,959 (83.4%) | 118 (4.0%) |
| 45 to 54 Years | 2,663 (81.1%) | 75 (2.8%) |
| 55 to 59 Years | 1,552 (72.6%) | 5 (0.3%) |
| 60 to 64 Years | 869 (57.5%) | 18 (2.1%) |
| 65 to 74 Years | 721 (27.9%) | 8 (1.1%) |
| 75 Years and over | 150 (7.6%) | 5 (3.4%) |
| Total | 14,330 (64.4%) | 530 (3.7%) |
Employment Status by Educational Attainment in Morgan County
According to labor force statistics for Morgan County, 78.3% of individuals (11,220) out of the total population between 25 and 64 years of age (14,329) are in the labor force, with 3.1% or 348 of them being unemployed. The group with the highest labor force participation rate are those with the educational attainment of bachelor's degree or higher, with 87.3% or 2,225 individuals in the labor force. Within the labor force, individuals with college / associate degree education have the highest percentage of unemployment, with 3.7% or 137 of them being unemployed.
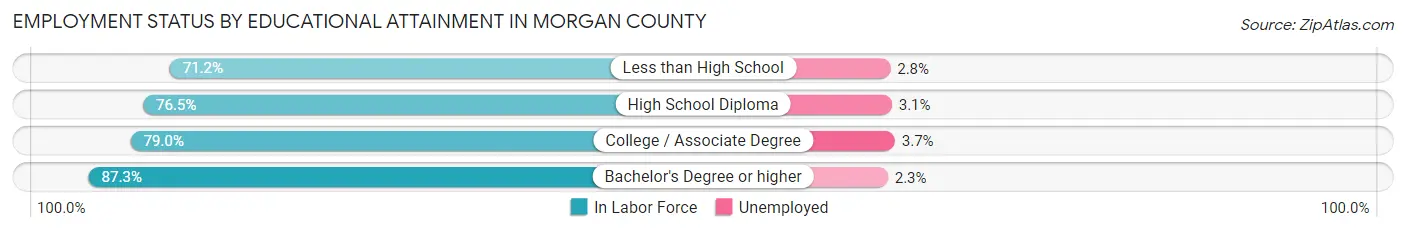
| Educational Attainment | In Labor Force | Unemployed |
| Less than High School | 1,822 (71.2%) | 72 (2.8%) |
| High School Diploma | 3,459 (76.5%) | 140 (3.1%) |
| College / Associate Degree | 3,712 (79.0%) | 174 (3.7%) |
| Bachelor's Degree or higher | 2,225 (87.3%) | 59 (2.3%) |
| Total | 11,220 (78.3%) | 444 (3.1%) |
Employment Occupations by Sex in Morgan County
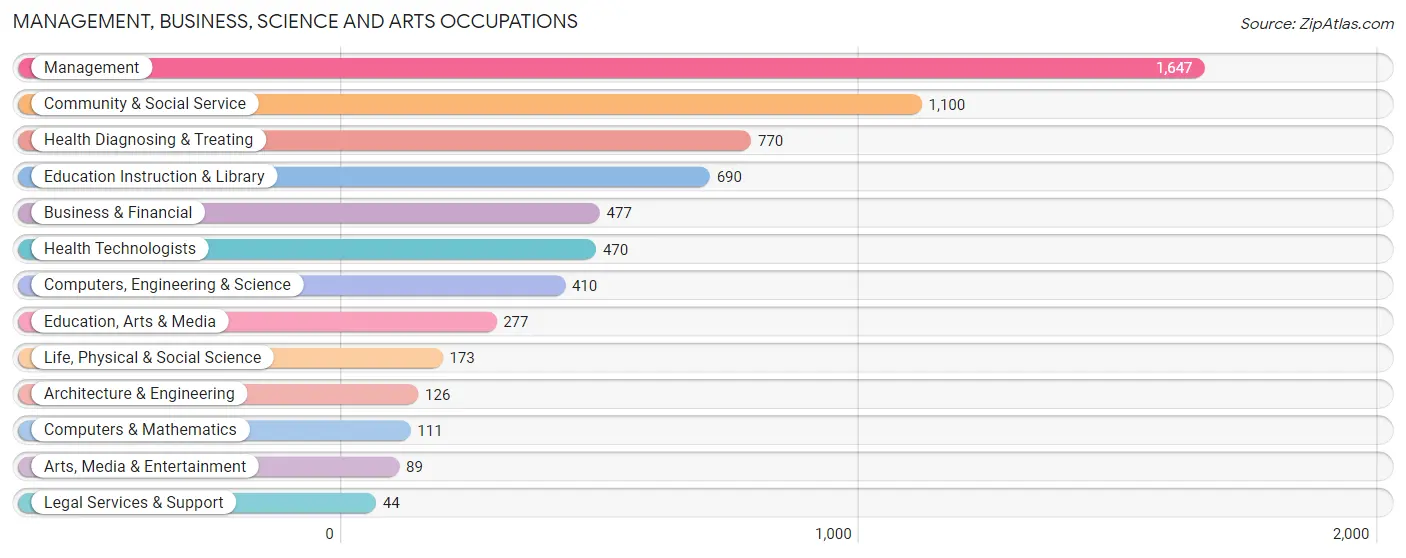
Management, Business, Science and Arts Occupations
The most common Management, Business, Science and Arts occupations in Morgan County are Management (1,647 | 11.9%), Community & Social Service (1,100 | 8.0%), Health Diagnosing & Treating (770 | 5.6%), Education Instruction & Library (690 | 5.0%), and Business & Financial (477 | 3.5%).
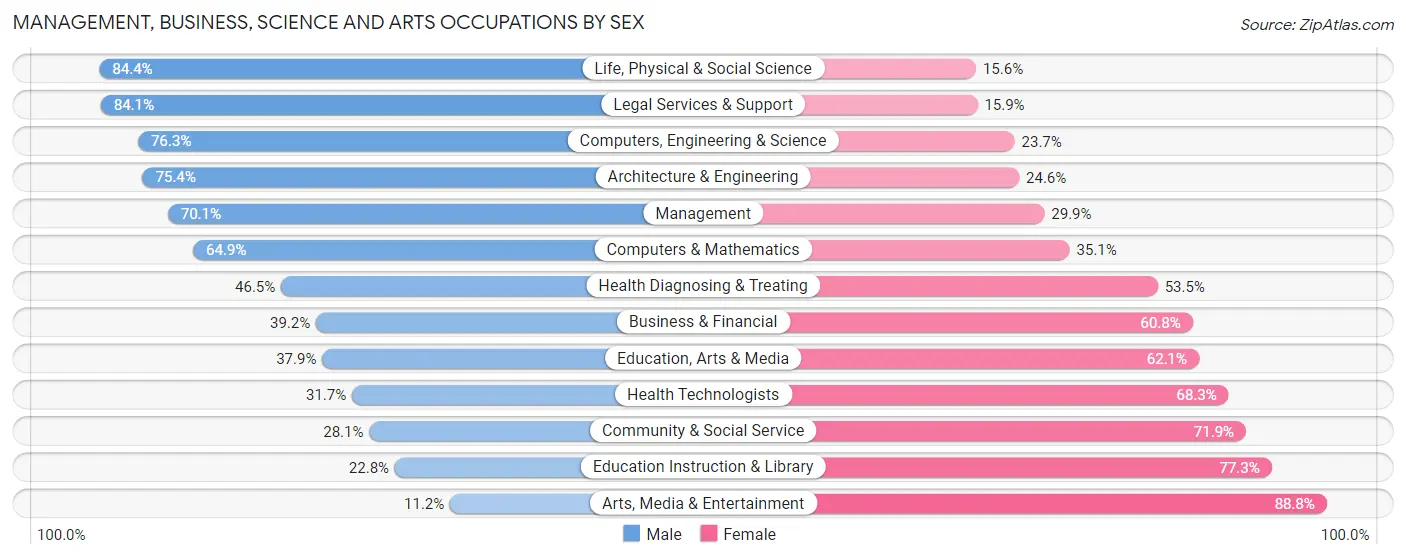
Management, Business, Science and Arts Occupations by Sex
Within the Management, Business, Science and Arts occupations in Morgan County, the most male-oriented occupations are Life, Physical & Social Science (84.4%), Legal Services & Support (84.1%), and Computers, Engineering & Science (76.3%), while the most female-oriented occupations are Arts, Media & Entertainment (88.8%), Education Instruction & Library (77.2%), and Community & Social Service (71.9%).
| Occupation | Male | Female |
| Management | 1,155 (70.1%) | 492 (29.9%) |
| Business & Financial | 187 (39.2%) | 290 (60.8%) |
| Computers, Engineering & Science | 313 (76.3%) | 97 (23.7%) |
| Computers & Mathematics | 72 (64.9%) | 39 (35.1%) |
| Architecture & Engineering | 95 (75.4%) | 31 (24.6%) |
| Life, Physical & Social Science | 146 (84.4%) | 27 (15.6%) |
| Community & Social Service | 309 (28.1%) | 791 (71.9%) |
| Education, Arts & Media | 105 (37.9%) | 172 (62.1%) |
| Legal Services & Support | 37 (84.1%) | 7 (15.9%) |
| Education Instruction & Library | 157 (22.8%) | 533 (77.2%) |
| Arts, Media & Entertainment | 10 (11.2%) | 79 (88.8%) |
| Health Diagnosing & Treating | 358 (46.5%) | 412 (53.5%) |
| Health Technologists | 149 (31.7%) | 321 (68.3%) |
| Total (Category) | 2,322 (52.7%) | 2,082 (47.3%) |
| Total (Overall) | 8,241 (59.7%) | 5,569 (40.3%) |
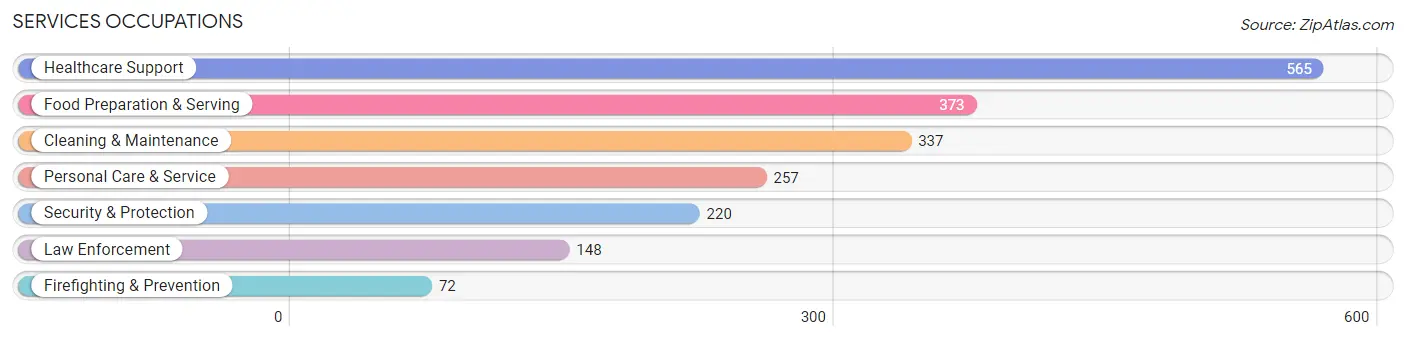
Services Occupations
The most common Services occupations in Morgan County are Healthcare Support (565 | 4.1%), Food Preparation & Serving (373 | 2.7%), Cleaning & Maintenance (337 | 2.4%), Personal Care & Service (257 | 1.9%), and Security & Protection (220 | 1.6%).
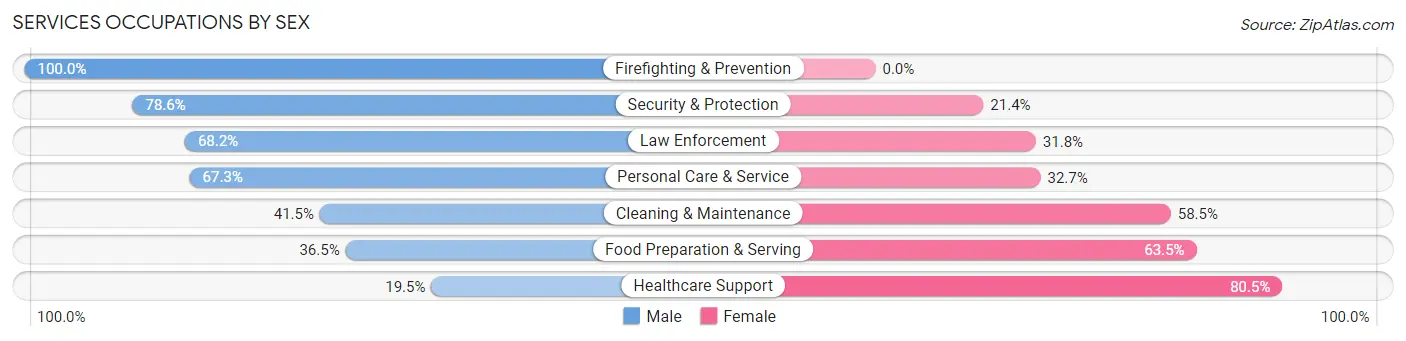
Services Occupations by Sex
Within the Services occupations in Morgan County, the most male-oriented occupations are Firefighting & Prevention (100.0%), Security & Protection (78.6%), and Law Enforcement (68.2%), while the most female-oriented occupations are Healthcare Support (80.5%), Food Preparation & Serving (63.5%), and Cleaning & Maintenance (58.5%).
| Occupation | Male | Female |
| Healthcare Support | 110 (19.5%) | 455 (80.5%) |
| Security & Protection | 173 (78.6%) | 47 (21.4%) |
| Firefighting & Prevention | 72 (100.0%) | 0 (0.0%) |
| Law Enforcement | 101 (68.2%) | 47 (31.8%) |
| Food Preparation & Serving | 136 (36.5%) | 237 (63.5%) |
| Cleaning & Maintenance | 140 (41.5%) | 197 (58.5%) |
| Personal Care & Service | 173 (67.3%) | 84 (32.7%) |
| Total (Category) | 732 (41.8%) | 1,020 (58.2%) |
| Total (Overall) | 8,241 (59.7%) | 5,569 (40.3%) |
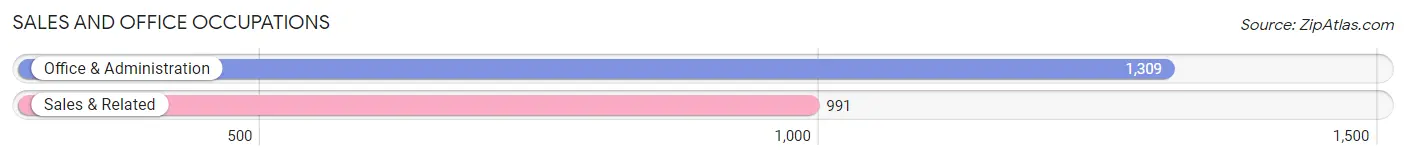
Sales and Office Occupations
The most common Sales and Office occupations in Morgan County are Office & Administration (1,309 | 9.5%), and Sales & Related (991 | 7.2%).
Sales and Office Occupations by Sex
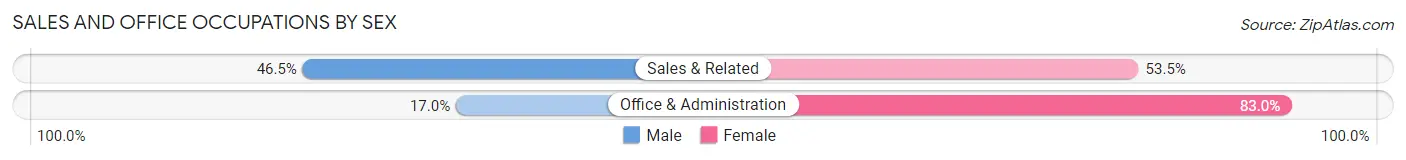
| Occupation | Male | Female |
| Sales & Related | 461 (46.5%) | 530 (53.5%) |
| Office & Administration | 223 (17.0%) | 1,086 (83.0%) |
| Total (Category) | 684 (29.7%) | 1,616 (70.3%) |
| Total (Overall) | 8,241 (59.7%) | 5,569 (40.3%) |
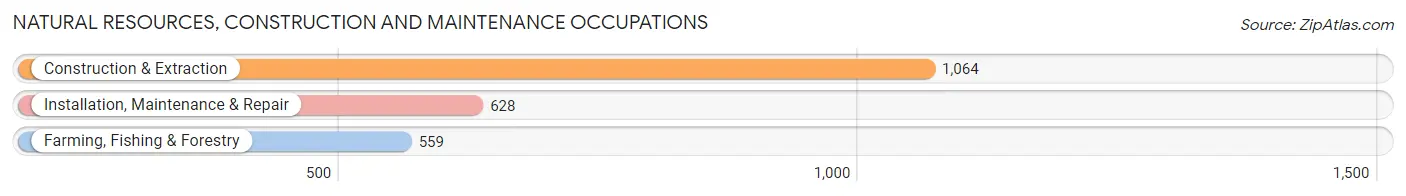
Natural Resources, Construction and Maintenance Occupations
The most common Natural Resources, Construction and Maintenance occupations in Morgan County are Construction & Extraction (1,064 | 7.7%), Installation, Maintenance & Repair (628 | 4.5%), and Farming, Fishing & Forestry (559 | 4.1%).
Natural Resources, Construction and Maintenance Occupations by Sex
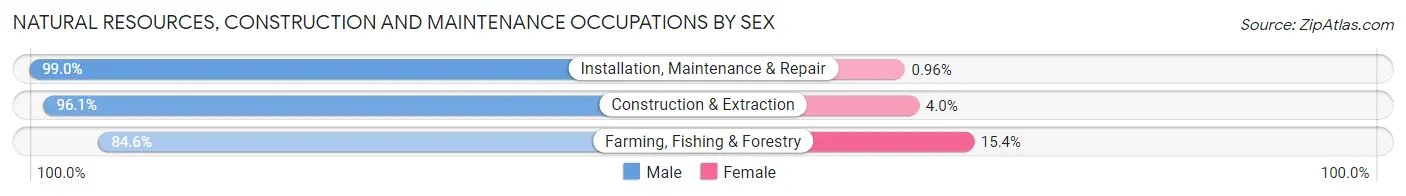
| Occupation | Male | Female |
| Farming, Fishing & Forestry | 473 (84.6%) | 86 (15.4%) |
| Construction & Extraction | 1,022 (96.1%) | 42 (4.0%) |
| Installation, Maintenance & Repair | 622 (99.0%) | 6 (1.0%) |
| Total (Category) | 2,117 (94.1%) | 134 (5.9%) |
| Total (Overall) | 8,241 (59.7%) | 5,569 (40.3%) |
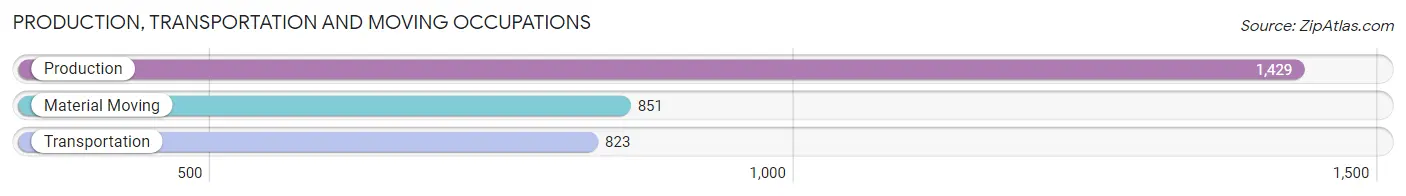
Production, Transportation and Moving Occupations
The most common Production, Transportation and Moving occupations in Morgan County are Production (1,429 | 10.3%), Material Moving (851 | 6.2%), and Transportation (823 | 6.0%).
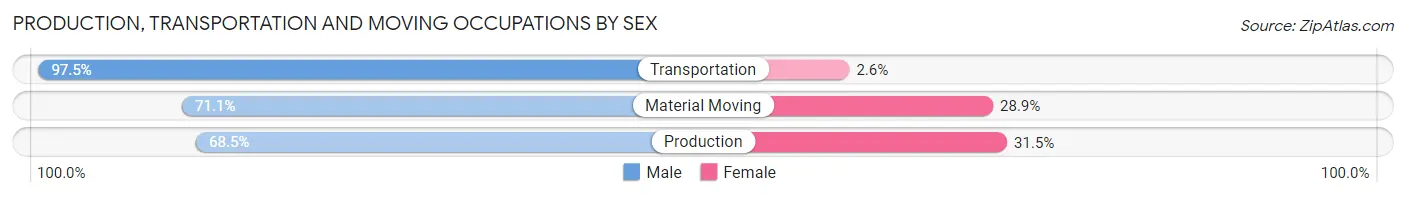
Production, Transportation and Moving Occupations by Sex
| Occupation | Male | Female |
| Production | 979 (68.5%) | 450 (31.5%) |
| Transportation | 802 (97.5%) | 21 (2.5%) |
| Material Moving | 605 (71.1%) | 246 (28.9%) |
| Total (Category) | 2,386 (76.9%) | 717 (23.1%) |
| Total (Overall) | 8,241 (59.7%) | 5,569 (40.3%) |
Employment Industries by Sex in Morgan County
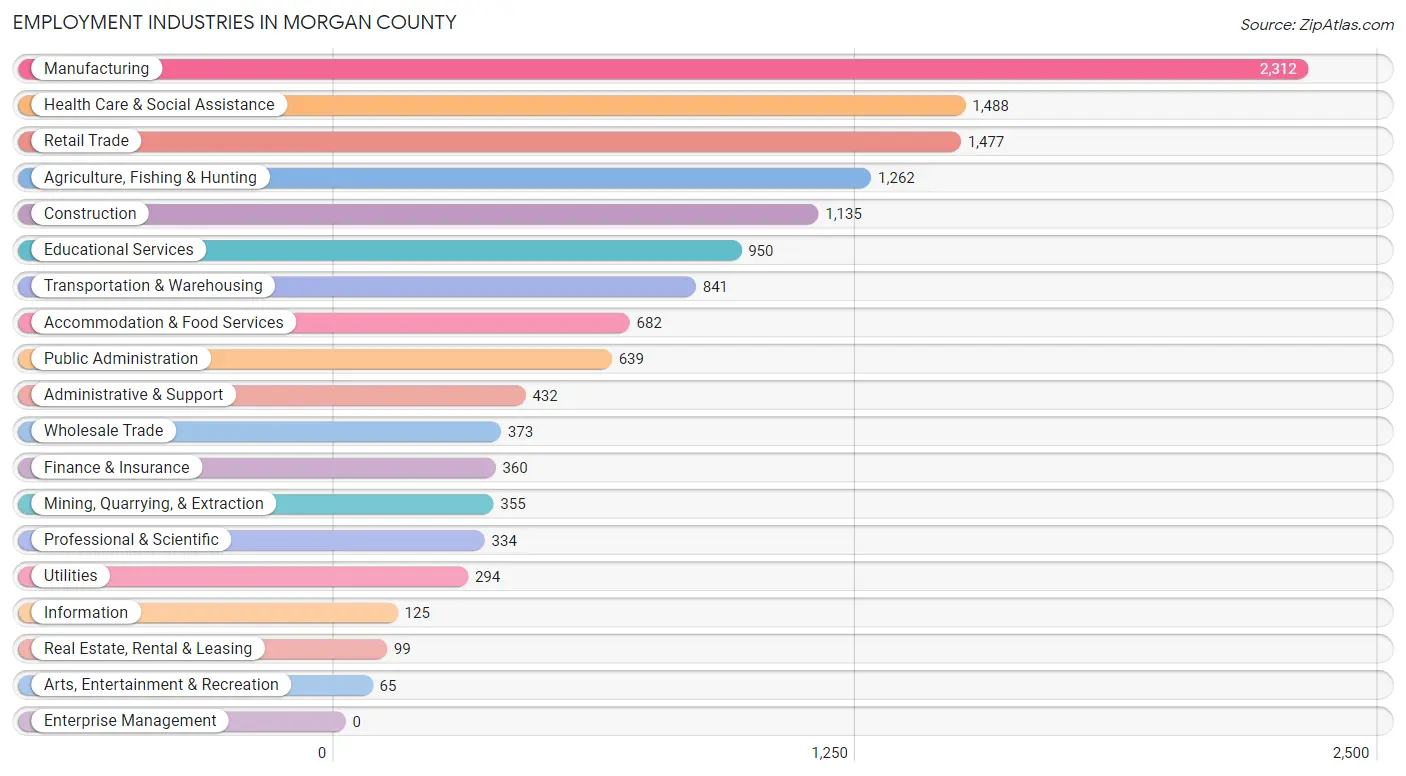
Employment Industries in Morgan County
The major employment industries in Morgan County include Manufacturing (2,312 | 16.7%), Health Care & Social Assistance (1,488 | 10.8%), Retail Trade (1,477 | 10.7%), Agriculture, Fishing & Hunting (1,262 | 9.1%), and Construction (1,135 | 8.2%).
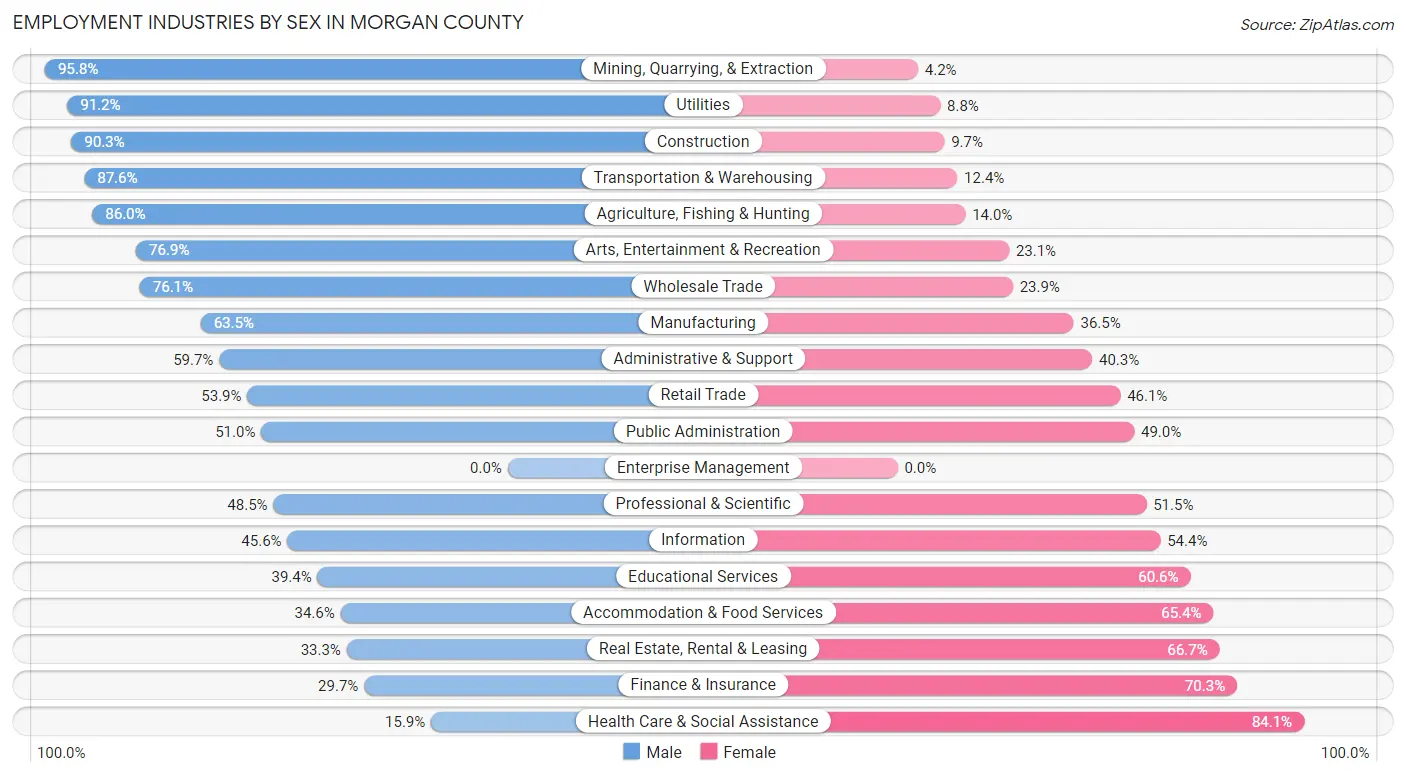
Employment Industries by Sex in Morgan County
The Morgan County industries that see more men than women are Mining, Quarrying, & Extraction (95.8%), Utilities (91.2%), and Construction (90.3%), whereas the industries that tend to have a higher number of women are Health Care & Social Assistance (84.1%), Finance & Insurance (70.3%), and Real Estate, Rental & Leasing (66.7%).
| Industry | Male | Female |
| Agriculture, Fishing & Hunting | 1,085 (86.0%) | 177 (14.0%) |
| Mining, Quarrying, & Extraction | 340 (95.8%) | 15 (4.2%) |
| Construction | 1,025 (90.3%) | 110 (9.7%) |
| Manufacturing | 1,469 (63.5%) | 843 (36.5%) |
| Wholesale Trade | 284 (76.1%) | 89 (23.9%) |
| Retail Trade | 796 (53.9%) | 681 (46.1%) |
| Transportation & Warehousing | 737 (87.6%) | 104 (12.4%) |
| Utilities | 268 (91.2%) | 26 (8.8%) |
| Information | 57 (45.6%) | 68 (54.4%) |
| Finance & Insurance | 107 (29.7%) | 253 (70.3%) |
| Real Estate, Rental & Leasing | 33 (33.3%) | 66 (66.7%) |
| Professional & Scientific | 162 (48.5%) | 172 (51.5%) |
| Enterprise Management | 0 (0.0%) | 0 (0.0%) |
| Administrative & Support | 258 (59.7%) | 174 (40.3%) |
| Educational Services | 374 (39.4%) | 576 (60.6%) |
| Health Care & Social Assistance | 236 (15.9%) | 1,252 (84.1%) |
| Arts, Entertainment & Recreation | 50 (76.9%) | 15 (23.1%) |
| Accommodation & Food Services | 236 (34.6%) | 446 (65.4%) |
| Public Administration | 326 (51.0%) | 313 (49.0%) |
| Total | 8,241 (59.7%) | 5,569 (40.3%) |
Education in Morgan County
School Enrollment in Morgan County
The most common levels of schooling among the 6,621 students in Morgan County are elementary school (2,194 | 33.1%), high school (1,494 | 22.6%), and middle school (1,224 | 18.5%).
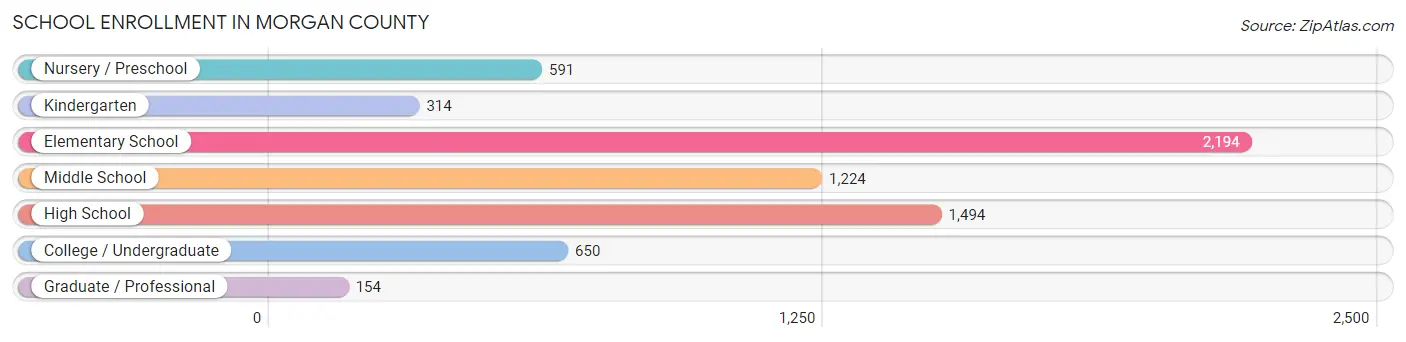
| School Level | # Students | % Students |
| Nursery / Preschool | 591 | 8.9% |
| Kindergarten | 314 | 4.7% |
| Elementary School | 2,194 | 33.1% |
| Middle School | 1,224 | 18.5% |
| High School | 1,494 | 22.6% |
| College / Undergraduate | 650 | 9.8% |
| Graduate / Professional | 154 | 2.3% |
| Total | 6,621 | 100.0% |
School Enrollment by Age by Funding Source in Morgan County
Out of a total of 6,621 students who are enrolled in schools in Morgan County, 881 (13.3%) attend a private institution, while the remaining 5,740 (86.7%) are enrolled in public schools. The age group of 25 to 34 year olds has the highest likelihood of being enrolled in private schools, with 107 (42.0% in the age bracket) enrolled. Conversely, the age group of 15 to 17 year olds has the lowest likelihood of being enrolled in a private school, with 1,171 (97.8% in the age bracket) attending a public institution.
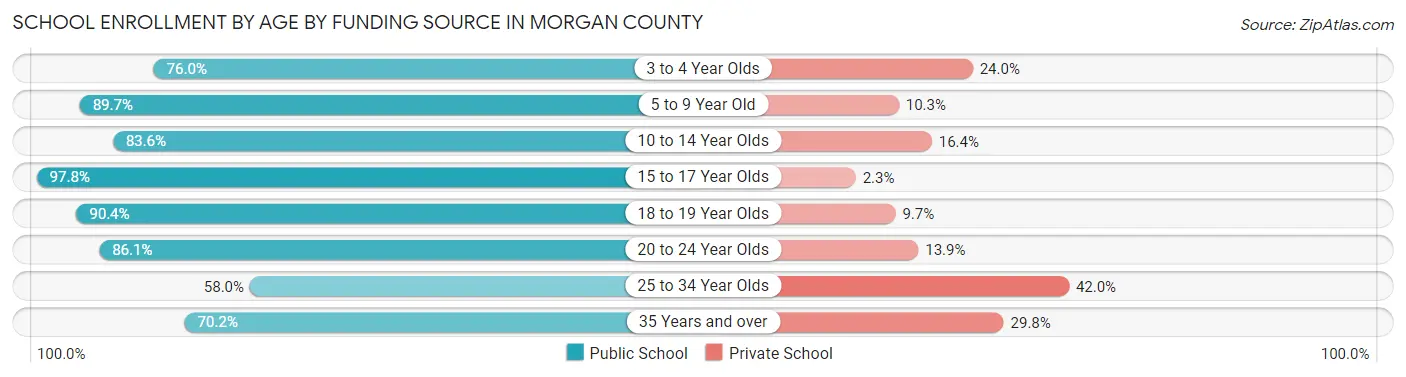
| Age Bracket | Public School | Private School |
| 3 to 4 Year Olds | 278 (76.0%) | 88 (24.0%) |
| 5 to 9 Year Old | 2,026 (89.7%) | 232 (10.3%) |
| 10 to 14 Year Olds | 1,497 (83.6%) | 294 (16.4%) |
| 15 to 17 Year Olds | 1,171 (97.8%) | 27 (2.2%) |
| 18 to 19 Year Olds | 234 (90.3%) | 25 (9.7%) |
| 20 to 24 Year Olds | 223 (86.1%) | 36 (13.9%) |
| 25 to 34 Year Olds | 148 (58.0%) | 107 (42.0%) |
| 35 Years and over | 165 (70.2%) | 70 (29.8%) |
| Total | 5,740 (86.7%) | 881 (13.3%) |
Educational Attainment by Field of Study in Morgan County
Education (758 | 21.0%), business (674 | 18.7%), bio, nature & agricultural (424 | 11.7%), science & technology (409 | 11.3%), and psychology (299 | 8.3%) are the most common fields of study among 3,608 individuals in Morgan County who have obtained a bachelor's degree or higher.
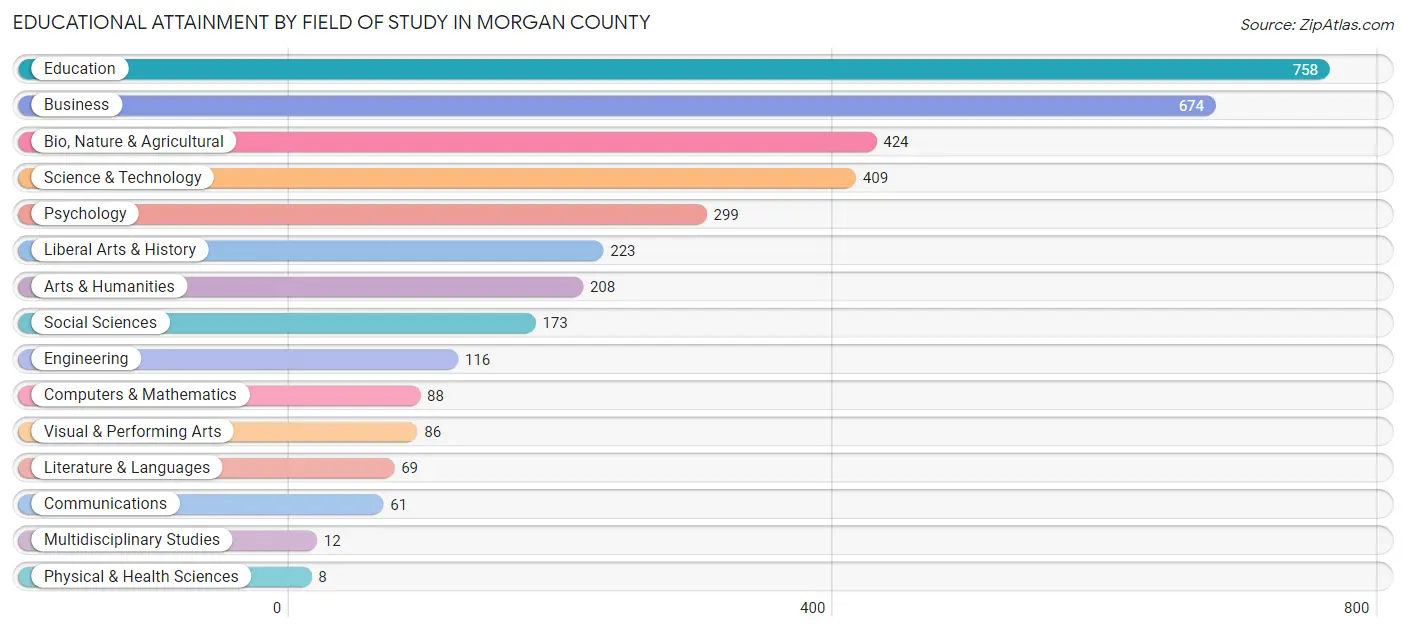
| Field of Study | # Graduates | % Graduates |
| Computers & Mathematics | 88 | 2.4% |
| Bio, Nature & Agricultural | 424 | 11.7% |
| Physical & Health Sciences | 8 | 0.2% |
| Psychology | 299 | 8.3% |
| Social Sciences | 173 | 4.8% |
| Engineering | 116 | 3.2% |
| Multidisciplinary Studies | 12 | 0.3% |
| Science & Technology | 409 | 11.3% |
| Business | 674 | 18.7% |
| Education | 758 | 21.0% |
| Literature & Languages | 69 | 1.9% |
| Liberal Arts & History | 223 | 6.2% |
| Visual & Performing Arts | 86 | 2.4% |
| Communications | 61 | 1.7% |
| Arts & Humanities | 208 | 5.8% |
| Total | 3,608 | 100.0% |
Transportation & Commute in Morgan County
Vehicle Availability by Sex in Morgan County
The most prevalent vehicle ownership categories in Morgan County are males with 2 vehicles (3,022, accounting for 37.7%) and females with 2 vehicles (1,932, making up 57.2%).
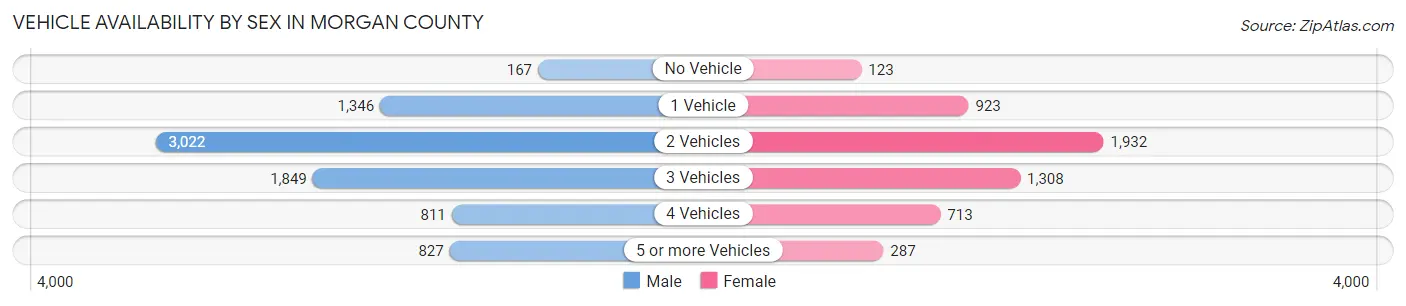
| Vehicles Available | Male | Female |
| No Vehicle | 167 (2.1%) | 123 (2.3%) |
| 1 Vehicle | 1,346 (16.8%) | 923 (17.5%) |
| 2 Vehicles | 3,022 (37.7%) | 1,932 (36.5%) |
| 3 Vehicles | 1,849 (23.1%) | 1,308 (24.7%) |
| 4 Vehicles | 811 (10.1%) | 713 (13.5%) |
| 5 or more Vehicles | 827 (10.3%) | 287 (5.4%) |
| Total | 8,022 (100.0%) | 5,286 (100.0%) |
Commute Time in Morgan County
The most frequently occuring commute durations in Morgan County are 5 to 9 minutes (3,482 commuters, 28.1%), 10 to 14 minutes (2,522 commuters, 20.3%), and 15 to 19 minutes (1,394 commuters, 11.2%).
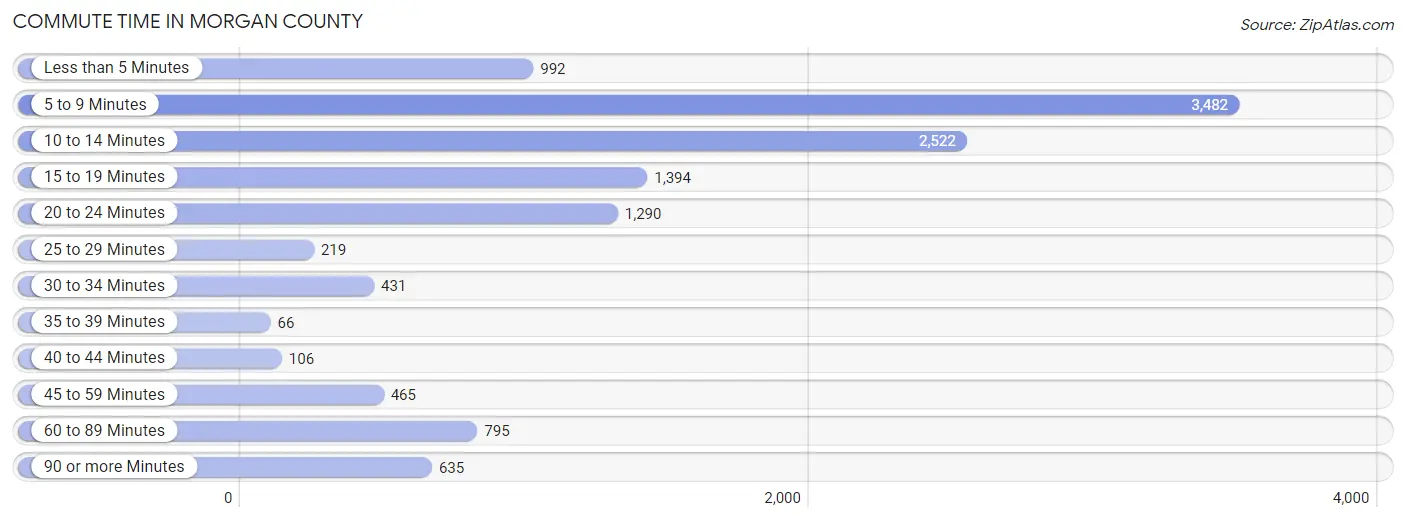
| Commute Time | # Commuters | % Commuters |
| Less than 5 Minutes | 992 | 8.0% |
| 5 to 9 Minutes | 3,482 | 28.1% |
| 10 to 14 Minutes | 2,522 | 20.3% |
| 15 to 19 Minutes | 1,394 | 11.2% |
| 20 to 24 Minutes | 1,290 | 10.4% |
| 25 to 29 Minutes | 219 | 1.8% |
| 30 to 34 Minutes | 431 | 3.5% |
| 35 to 39 Minutes | 66 | 0.5% |
| 40 to 44 Minutes | 106 | 0.9% |
| 45 to 59 Minutes | 465 | 3.7% |
| 60 to 89 Minutes | 795 | 6.4% |
| 90 or more Minutes | 635 | 5.1% |
Commute Time by Sex in Morgan County
The most common commute times in Morgan County are 5 to 9 minutes (1,942 commuters, 25.6%) for males and 5 to 9 minutes (1,540 commuters, 32.0%) for females.
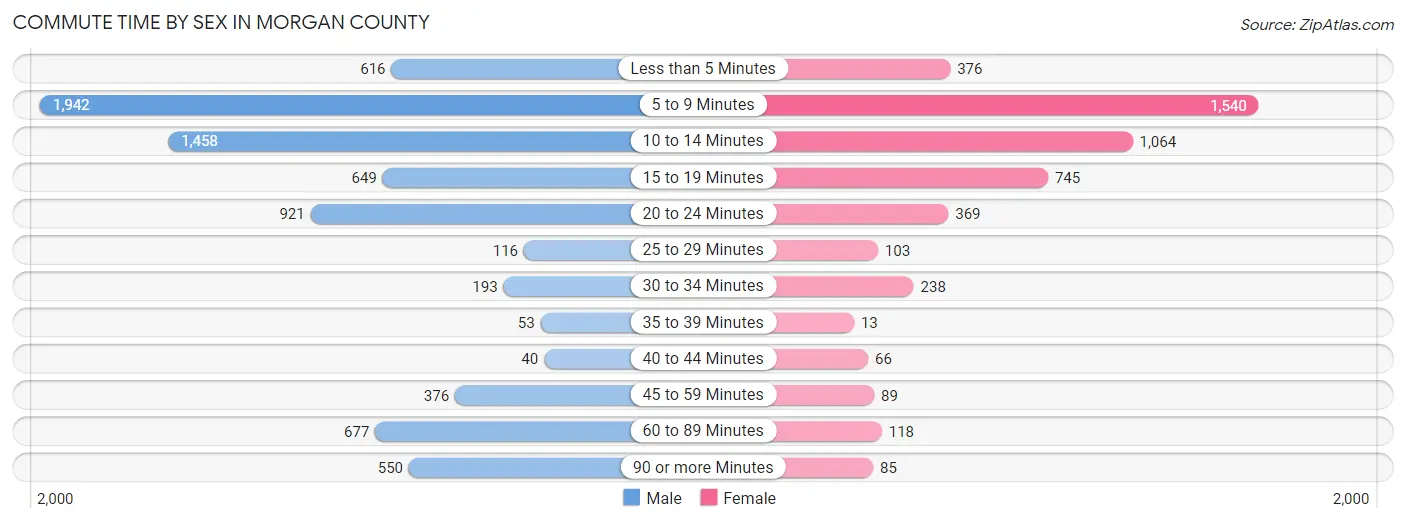
| Commute Time | Male | Female |
| Less than 5 Minutes | 616 (8.1%) | 376 (7.8%) |
| 5 to 9 Minutes | 1,942 (25.6%) | 1,540 (32.0%) |
| 10 to 14 Minutes | 1,458 (19.2%) | 1,064 (22.1%) |
| 15 to 19 Minutes | 649 (8.6%) | 745 (15.5%) |
| 20 to 24 Minutes | 921 (12.1%) | 369 (7.7%) |
| 25 to 29 Minutes | 116 (1.5%) | 103 (2.1%) |
| 30 to 34 Minutes | 193 (2.5%) | 238 (5.0%) |
| 35 to 39 Minutes | 53 (0.7%) | 13 (0.3%) |
| 40 to 44 Minutes | 40 (0.5%) | 66 (1.4%) |
| 45 to 59 Minutes | 376 (5.0%) | 89 (1.8%) |
| 60 to 89 Minutes | 677 (8.9%) | 118 (2.5%) |
| 90 or more Minutes | 550 (7.2%) | 85 (1.8%) |
Time of Departure to Work by Sex in Morgan County
The most frequent times of departure to work in Morgan County are 6:00 AM to 6:29 AM (960, 12.7%) for males and 7:00 AM to 7:29 AM (989, 20.6%) for females.
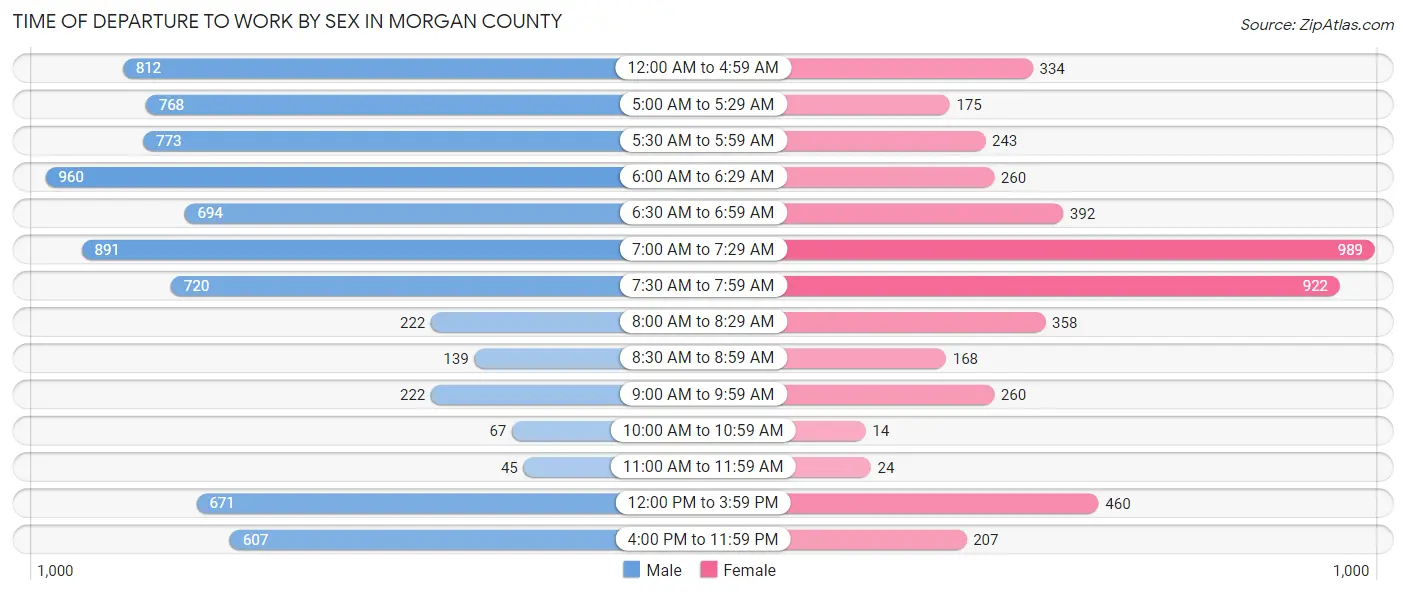
| Time of Departure | Male | Female |
| 12:00 AM to 4:59 AM | 812 (10.7%) | 334 (7.0%) |
| 5:00 AM to 5:29 AM | 768 (10.1%) | 175 (3.6%) |
| 5:30 AM to 5:59 AM | 773 (10.2%) | 243 (5.1%) |
| 6:00 AM to 6:29 AM | 960 (12.7%) | 260 (5.4%) |
| 6:30 AM to 6:59 AM | 694 (9.1%) | 392 (8.2%) |
| 7:00 AM to 7:29 AM | 891 (11.7%) | 989 (20.6%) |
| 7:30 AM to 7:59 AM | 720 (9.5%) | 922 (19.2%) |
| 8:00 AM to 8:29 AM | 222 (2.9%) | 358 (7.4%) |
| 8:30 AM to 8:59 AM | 139 (1.8%) | 168 (3.5%) |
| 9:00 AM to 9:59 AM | 222 (2.9%) | 260 (5.4%) |
| 10:00 AM to 10:59 AM | 67 (0.9%) | 14 (0.3%) |
| 11:00 AM to 11:59 AM | 45 (0.6%) | 24 (0.5%) |
| 12:00 PM to 3:59 PM | 671 (8.8%) | 460 (9.6%) |
| 4:00 PM to 11:59 PM | 607 (8.0%) | 207 (4.3%) |
| Total | 7,591 (100.0%) | 4,806 (100.0%) |
Housing Occupancy in Morgan County
Occupancy by Ownership in Morgan County
Of the total 10,872 dwellings in Morgan County, owner-occupied units account for 7,022 (64.6%), while renter-occupied units make up 3,850 (35.4%).
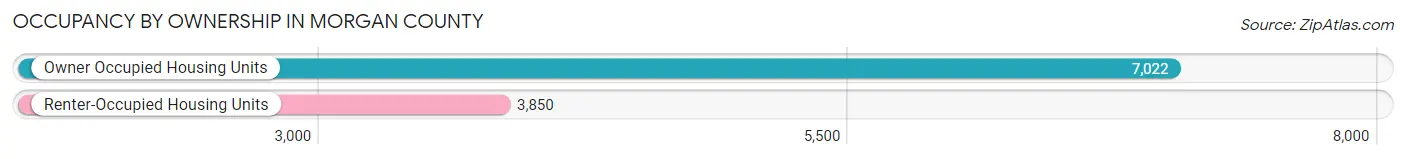
| Occupancy | # Housing Units | % Housing Units |
| Owner Occupied Housing Units | 7,022 | 64.6% |
| Renter-Occupied Housing Units | 3,850 | 35.4% |
| Total Occupied Housing Units | 10,872 | 100.0% |
Occupancy by Household Size in Morgan County
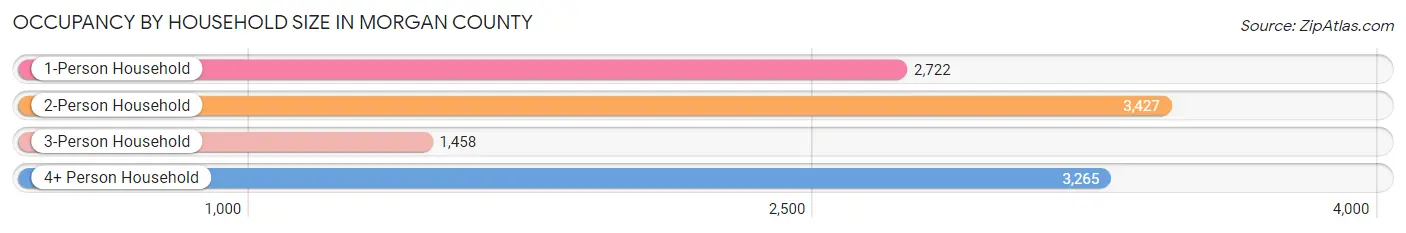
| Household Size | # Housing Units | % Housing Units |
| 1-Person Household | 2,722 | 25.0% |
| 2-Person Household | 3,427 | 31.5% |
| 3-Person Household | 1,458 | 13.4% |
| 4+ Person Household | 3,265 | 30.0% |
| Total Housing Units | 10,872 | 100.0% |
Occupancy by Ownership by Household Size in Morgan County
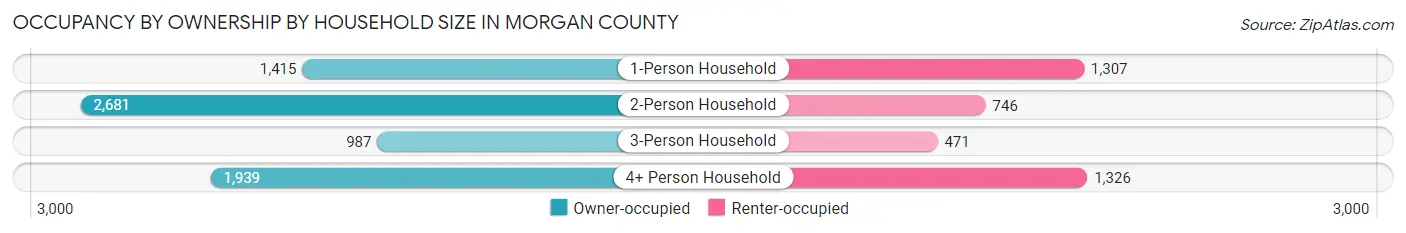
| Household Size | Owner-occupied | Renter-occupied |
| 1-Person Household | 1,415 (52.0%) | 1,307 (48.0%) |
| 2-Person Household | 2,681 (78.2%) | 746 (21.8%) |
| 3-Person Household | 987 (67.7%) | 471 (32.3%) |
| 4+ Person Household | 1,939 (59.4%) | 1,326 (40.6%) |
| Total Housing Units | 7,022 (64.6%) | 3,850 (35.4%) |
Occupancy by Educational Attainment in Morgan County
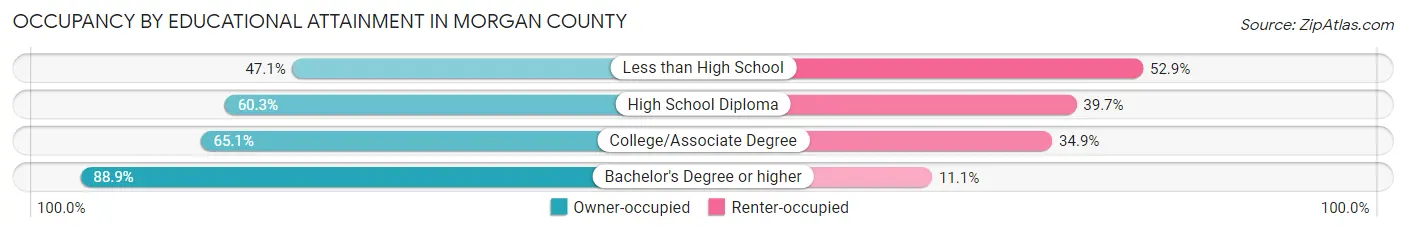
| Household Size | Owner-occupied | Renter-occupied |
| Less than High School | 890 (47.1%) | 1,000 (52.9%) |
| High School Diploma | 2,004 (60.3%) | 1,319 (39.7%) |
| College/Associate Degree | 2,473 (65.1%) | 1,325 (34.9%) |
| Bachelor's Degree or higher | 1,655 (88.9%) | 206 (11.1%) |
Occupancy by Age of Householder in Morgan County
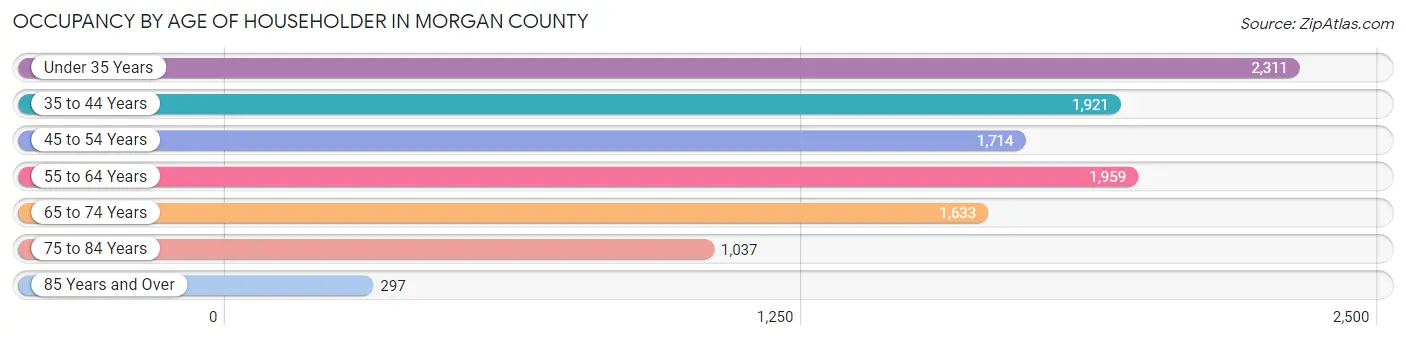
| Age Bracket | # Households | % Households |
| Under 35 Years | 2,311 | 21.3% |
| 35 to 44 Years | 1,921 | 17.7% |
| 45 to 54 Years | 1,714 | 15.8% |
| 55 to 64 Years | 1,959 | 18.0% |
| 65 to 74 Years | 1,633 | 15.0% |
| 75 to 84 Years | 1,037 | 9.5% |
| 85 Years and Over | 297 | 2.7% |
| Total | 10,872 | 100.0% |
Housing Finances in Morgan County
Median Income by Occupancy in Morgan County
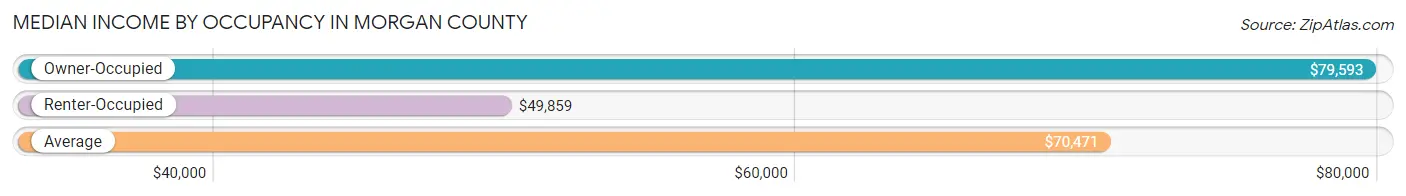
| Occupancy Type | # Households | Median Income |
| Owner-Occupied | 7,022 (64.6%) | $79,593 |
| Renter-Occupied | 3,850 (35.4%) | $49,859 |
| Average | 10,872 (100.0%) | $70,471 |
Occupancy by Householder Income Bracket in Morgan County
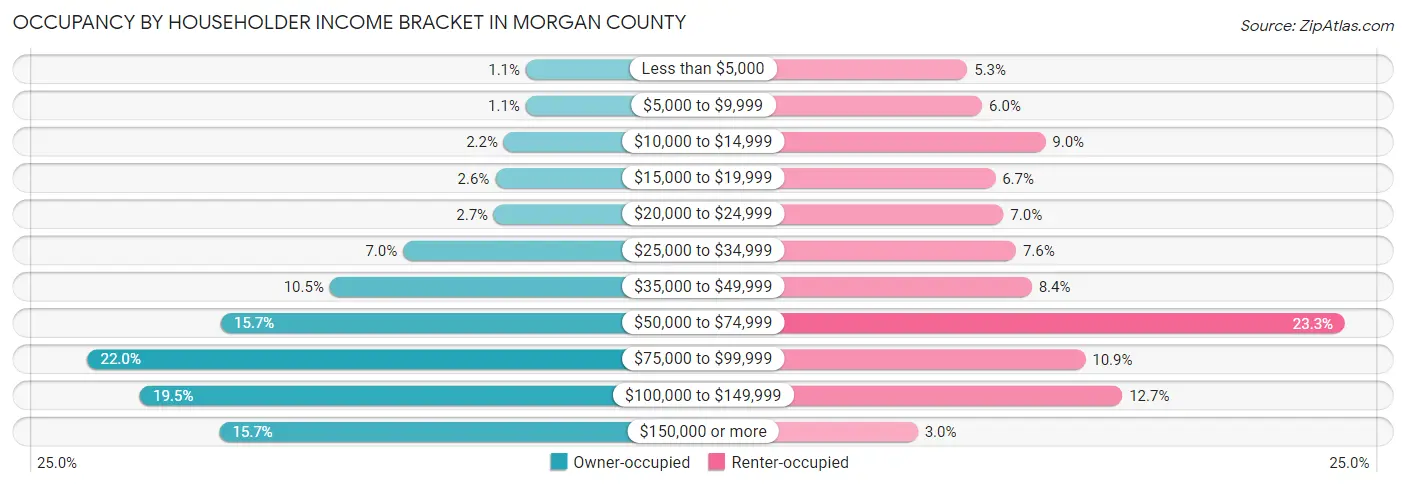
| Income Bracket | Owner-occupied | Renter-occupied |
| Less than $5,000 | 79 (1.1%) | 205 (5.3%) |
| $5,000 to $9,999 | 80 (1.1%) | 232 (6.0%) |
| $10,000 to $14,999 | 153 (2.2%) | 348 (9.0%) |
| $15,000 to $19,999 | 182 (2.6%) | 256 (6.7%) |
| $20,000 to $24,999 | 186 (2.6%) | 271 (7.0%) |
| $25,000 to $34,999 | 490 (7.0%) | 294 (7.6%) |
| $35,000 to $49,999 | 735 (10.5%) | 323 (8.4%) |
| $50,000 to $74,999 | 1,099 (15.7%) | 897 (23.3%) |
| $75,000 to $99,999 | 1,545 (22.0%) | 421 (10.9%) |
| $100,000 to $149,999 | 1,369 (19.5%) | 489 (12.7%) |
| $150,000 or more | 1,104 (15.7%) | 114 (3.0%) |
| Total | 7,022 (100.0%) | 3,850 (100.0%) |
Monthly Housing Cost Tiers in Morgan County
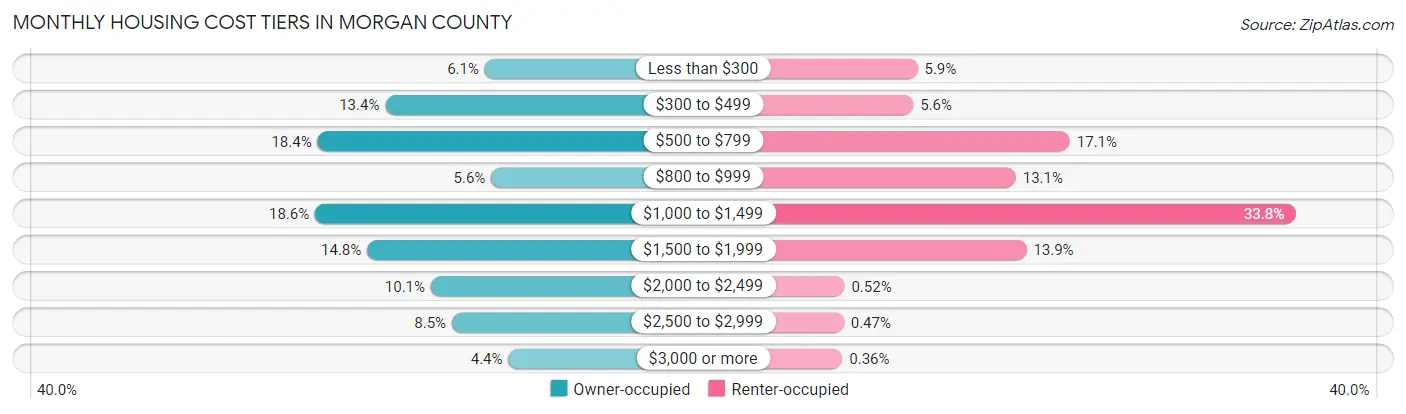
| Monthly Cost | Owner-occupied | Renter-occupied |
| Less than $300 | 429 (6.1%) | 227 (5.9%) |
| $300 to $499 | 944 (13.4%) | 215 (5.6%) |
| $500 to $799 | 1,294 (18.4%) | 659 (17.1%) |
| $800 to $999 | 396 (5.6%) | 506 (13.1%) |
| $1,000 to $1,499 | 1,307 (18.6%) | 1,300 (33.8%) |
| $1,500 to $1,999 | 1,038 (14.8%) | 536 (13.9%) |
| $2,000 to $2,499 | 708 (10.1%) | 20 (0.5%) |
| $2,500 to $2,999 | 599 (8.5%) | 18 (0.5%) |
| $3,000 or more | 307 (4.4%) | 14 (0.4%) |
| Total | 7,022 (100.0%) | 3,850 (100.0%) |
Physical Housing Characteristics in Morgan County
Housing Structures in Morgan County
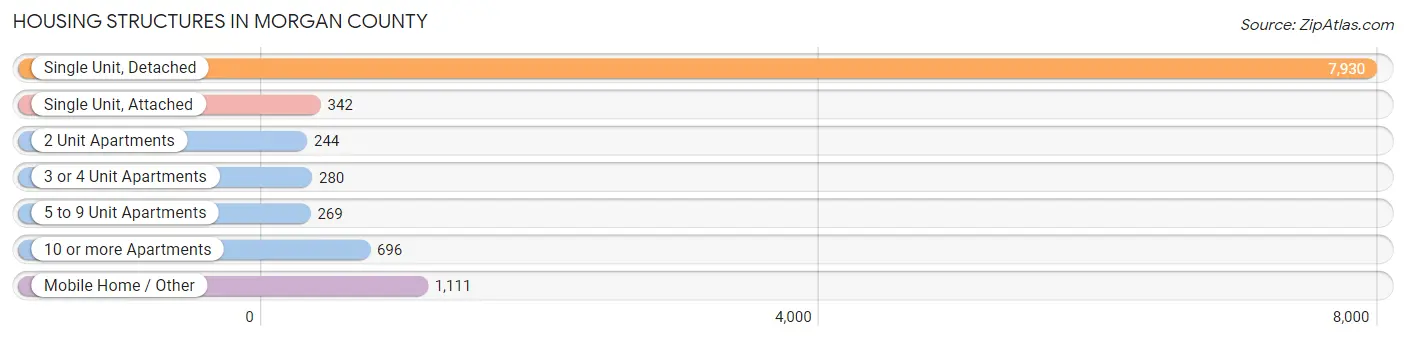
| Structure Type | # Housing Units | % Housing Units |
| Single Unit, Detached | 7,930 | 72.9% |
| Single Unit, Attached | 342 | 3.2% |
| 2 Unit Apartments | 244 | 2.2% |
| 3 or 4 Unit Apartments | 280 | 2.6% |
| 5 to 9 Unit Apartments | 269 | 2.5% |
| 10 or more Apartments | 696 | 6.4% |
| Mobile Home / Other | 1,111 | 10.2% |
| Total | 10,872 | 100.0% |
Housing Structures by Occupancy in Morgan County
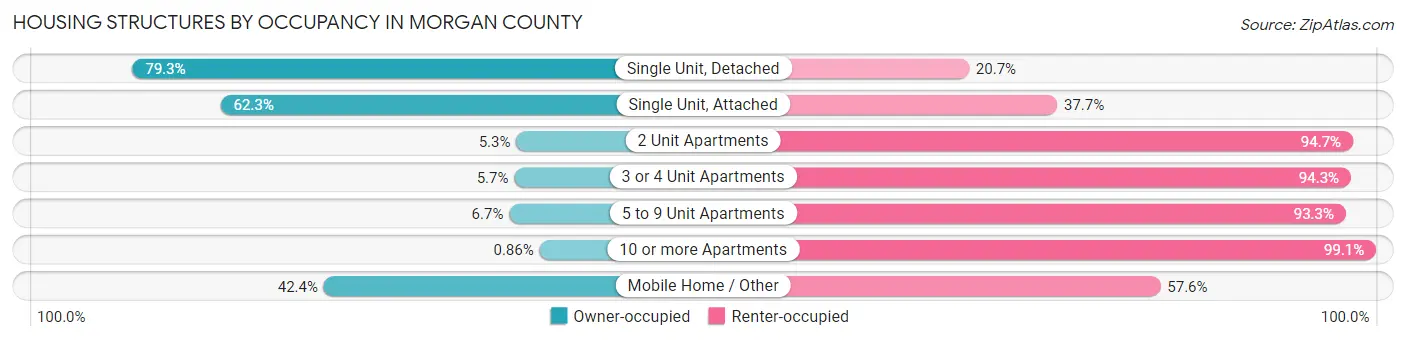
| Structure Type | Owner-occupied | Renter-occupied |
| Single Unit, Detached | 6,285 (79.3%) | 1,645 (20.7%) |
| Single Unit, Attached | 213 (62.3%) | 129 (37.7%) |
| 2 Unit Apartments | 13 (5.3%) | 231 (94.7%) |
| 3 or 4 Unit Apartments | 16 (5.7%) | 264 (94.3%) |
| 5 to 9 Unit Apartments | 18 (6.7%) | 251 (93.3%) |
| 10 or more Apartments | 6 (0.9%) | 690 (99.1%) |
| Mobile Home / Other | 471 (42.4%) | 640 (57.6%) |
| Total | 7,022 (64.6%) | 3,850 (35.4%) |
Housing Structures by Number of Rooms in Morgan County
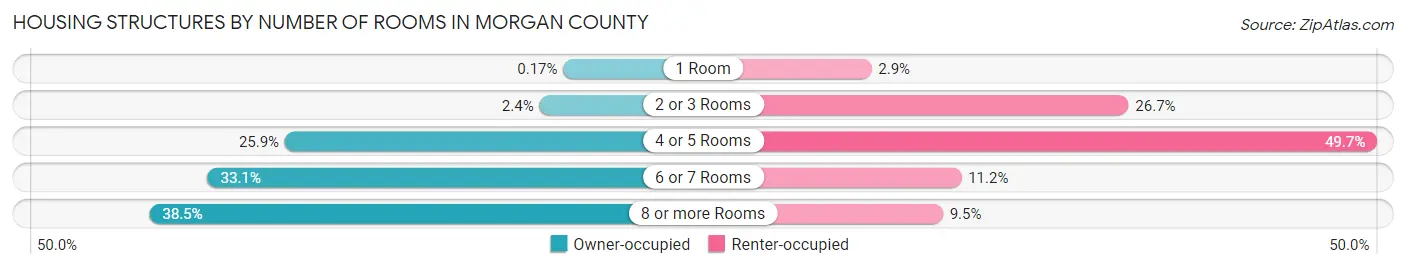
| Number of Rooms | Owner-occupied | Renter-occupied |
| 1 Room | 12 (0.2%) | 112 (2.9%) |
| 2 or 3 Rooms | 167 (2.4%) | 1,027 (26.7%) |
| 4 or 5 Rooms | 1,820 (25.9%) | 1,913 (49.7%) |
| 6 or 7 Rooms | 2,322 (33.1%) | 432 (11.2%) |
| 8 or more Rooms | 2,701 (38.5%) | 366 (9.5%) |
| Total | 7,022 (100.0%) | 3,850 (100.0%) |
Housing Structure by Heating Type in Morgan County
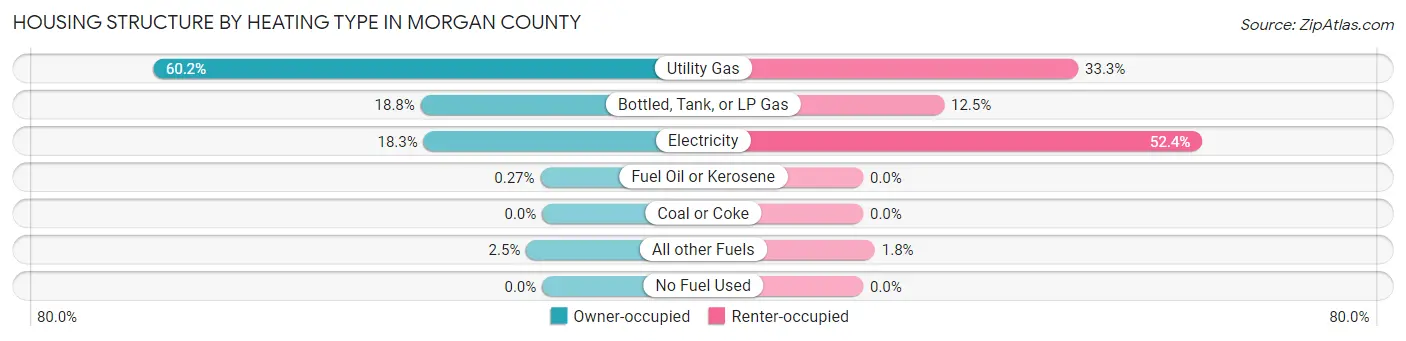
| Heating Type | Owner-occupied | Renter-occupied |
| Utility Gas | 4,225 (60.2%) | 1,280 (33.3%) |
| Bottled, Tank, or LP Gas | 1,319 (18.8%) | 482 (12.5%) |
| Electricity | 1,287 (18.3%) | 2,018 (52.4%) |
| Fuel Oil or Kerosene | 19 (0.3%) | 0 (0.0%) |
| Coal or Coke | 0 (0.0%) | 0 (0.0%) |
| All other Fuels | 172 (2.5%) | 70 (1.8%) |
| No Fuel Used | 0 (0.0%) | 0 (0.0%) |
| Total | 7,022 (100.0%) | 3,850 (100.0%) |
Household Vehicle Usage in Morgan County
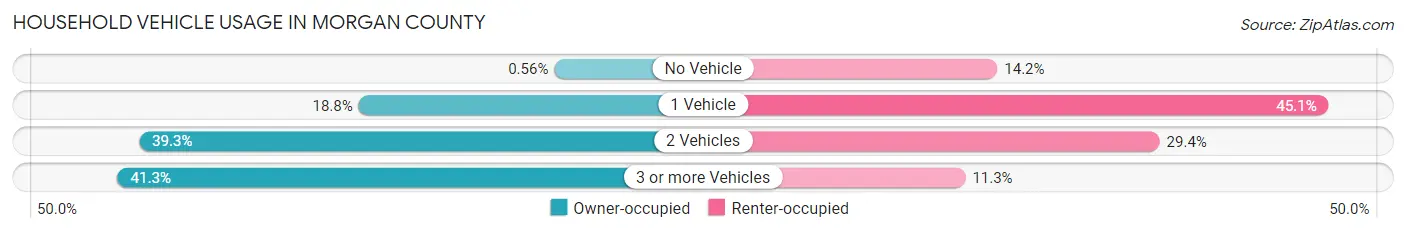
| Vehicles per Household | Owner-occupied | Renter-occupied |
| No Vehicle | 39 (0.6%) | 548 (14.2%) |
| 1 Vehicle | 1,322 (18.8%) | 1,738 (45.1%) |
| 2 Vehicles | 2,760 (39.3%) | 1,131 (29.4%) |
| 3 or more Vehicles | 2,901 (41.3%) | 433 (11.3%) |
| Total | 7,022 (100.0%) | 3,850 (100.0%) |
Real Estate & Mortgages in Morgan County
Real Estate and Mortgage Overview in Morgan County
| Characteristic | Without Mortgage | With Mortgage |
| Housing Units | 2,847 | 4,175 |
| Median Property Value | $254,300 | $292,100 |
| Median Household Income | $66,202 | $746 |
| Monthly Housing Costs | $521 | $305 |
| Real Estate Taxes | $1,161 | $100 |
Property Value by Mortgage Status in Morgan County
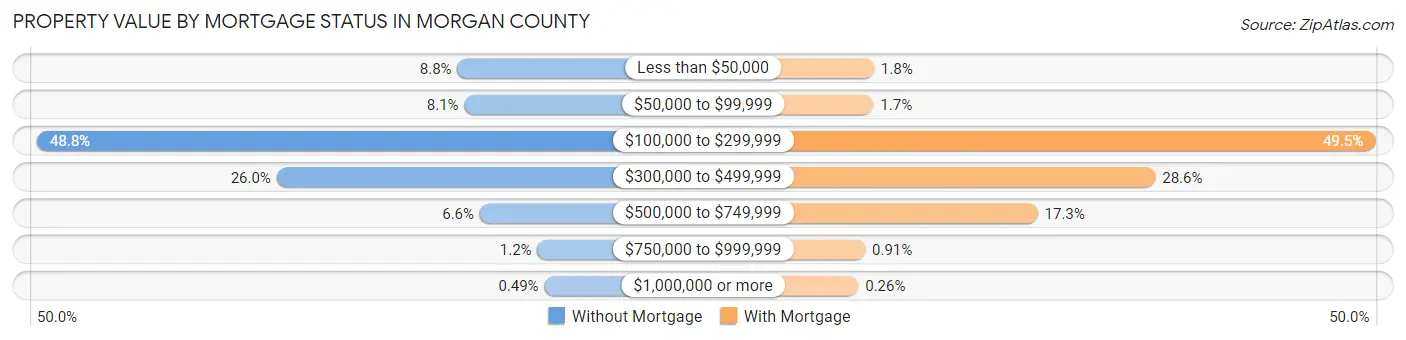
| Property Value | Without Mortgage | With Mortgage |
| Less than $50,000 | 250 (8.8%) | 73 (1.8%) |
| $50,000 to $99,999 | 231 (8.1%) | 71 (1.7%) |
| $100,000 to $299,999 | 1,390 (48.8%) | 2,066 (49.5%) |
| $300,000 to $499,999 | 740 (26.0%) | 1,192 (28.5%) |
| $500,000 to $749,999 | 189 (6.6%) | 724 (17.3%) |
| $750,000 to $999,999 | 33 (1.2%) | 38 (0.9%) |
| $1,000,000 or more | 14 (0.5%) | 11 (0.3%) |
| Total | 2,847 (100.0%) | 4,175 (100.0%) |
Household Income by Mortgage Status in Morgan County
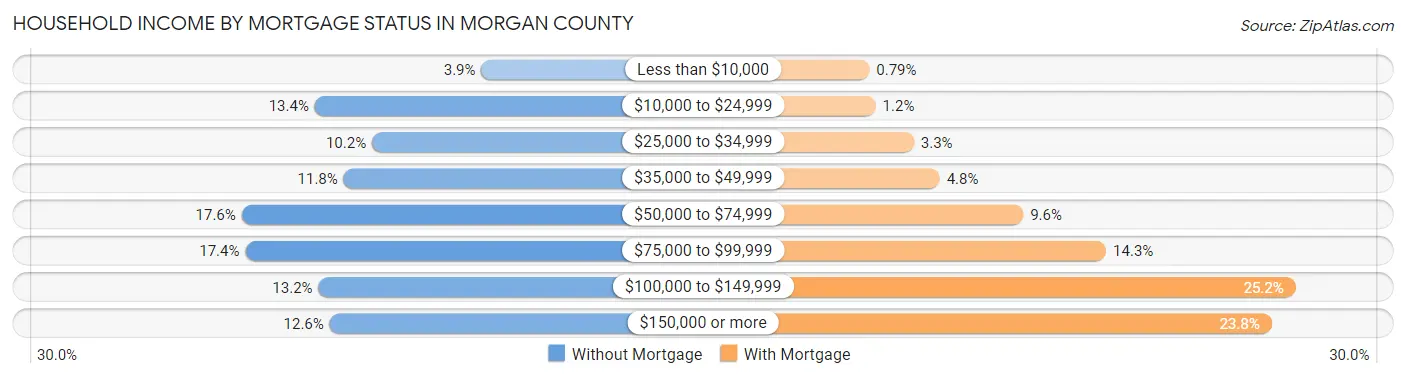
| Household Income | Without Mortgage | With Mortgage |
| Less than $10,000 | 111 (3.9%) | 33 (0.8%) |
| $10,000 to $24,999 | 382 (13.4%) | 48 (1.1%) |
| $25,000 to $34,999 | 289 (10.2%) | 139 (3.3%) |
| $35,000 to $49,999 | 335 (11.8%) | 201 (4.8%) |
| $50,000 to $74,999 | 501 (17.6%) | 400 (9.6%) |
| $75,000 to $99,999 | 495 (17.4%) | 598 (14.3%) |
| $100,000 to $149,999 | 376 (13.2%) | 1,050 (25.2%) |
| $150,000 or more | 358 (12.6%) | 993 (23.8%) |
| Total | 2,847 (100.0%) | 4,175 (100.0%) |
Property Value to Household Income Ratio in Morgan County
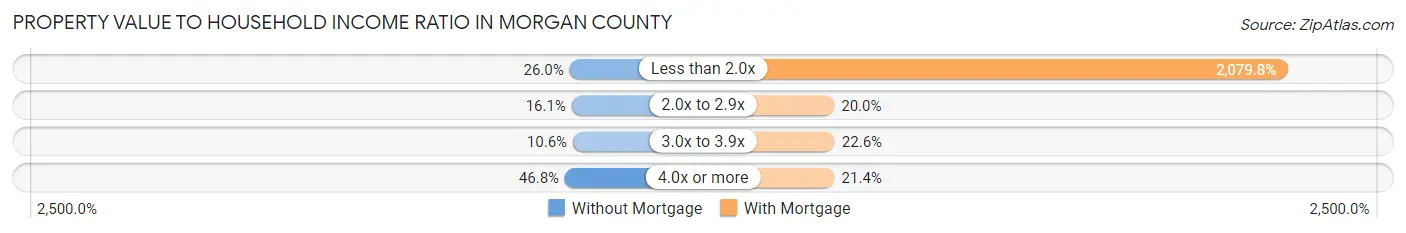
| Value-to-Income Ratio | Without Mortgage | With Mortgage |
| Less than 2.0x | 739 (26.0%) | 86,831 (2,079.8%) |
| 2.0x to 2.9x | 457 (16.1%) | 835 (20.0%) |
| 3.0x to 3.9x | 302 (10.6%) | 944 (22.6%) |
| 4.0x or more | 1,331 (46.8%) | 895 (21.4%) |
| Total | 2,847 (100.0%) | 4,175 (100.0%) |
Real Estate Taxes by Mortgage Status in Morgan County
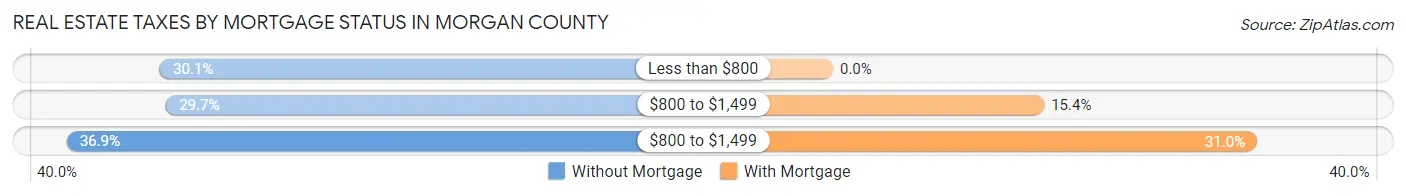
| Property Taxes | Without Mortgage | With Mortgage |
| Less than $800 | 857 (30.1%) | 0 (0.0%) |
| $800 to $1,499 | 844 (29.6%) | 644 (15.4%) |
| $800 to $1,499 | 1,051 (36.9%) | 1,293 (31.0%) |
| Total | 2,847 (100.0%) | 4,175 (100.0%) |
Health & Disability in Morgan County
Health Insurance Coverage by Age in Morgan County
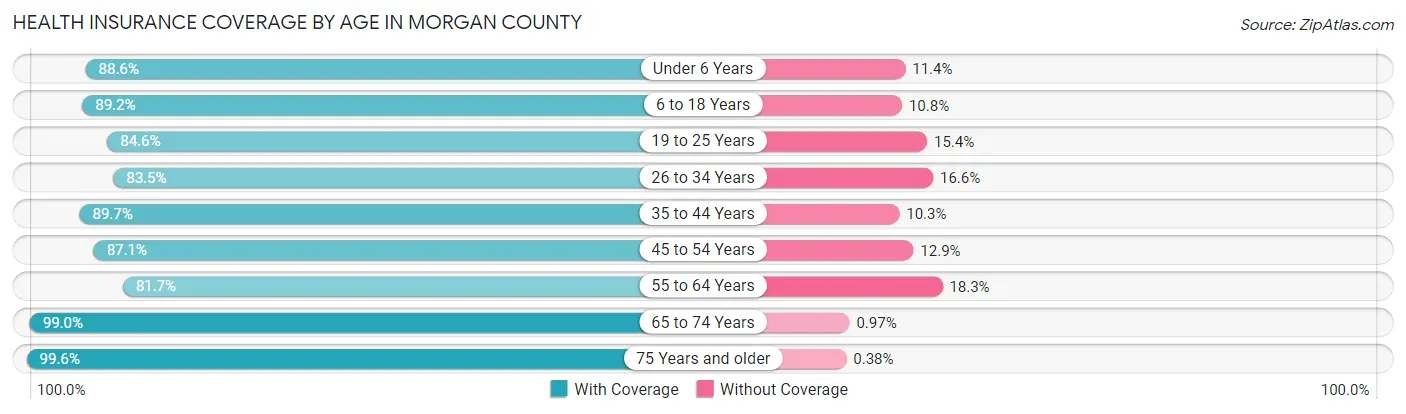
| Age Bracket | With Coverage | Without Coverage |
| Under 6 Years | 2,197 (88.6%) | 282 (11.4%) |
| 6 to 18 Years | 4,775 (89.2%) | 576 (10.8%) |
| 19 to 25 Years | 2,252 (84.6%) | 411 (15.4%) |
| 26 to 34 Years | 2,895 (83.5%) | 574 (16.6%) |
| 35 to 44 Years | 3,139 (89.7%) | 359 (10.3%) |
| 45 to 54 Years | 2,826 (87.1%) | 418 (12.9%) |
| 55 to 64 Years | 2,952 (81.7%) | 661 (18.3%) |
| 65 to 74 Years | 2,449 (99.0%) | 24 (1.0%) |
| 75 Years and older | 1,827 (99.6%) | 7 (0.4%) |
| Total | 25,312 (88.4%) | 3,312 (11.6%) |
Health Insurance Coverage by Citizenship Status in Morgan County
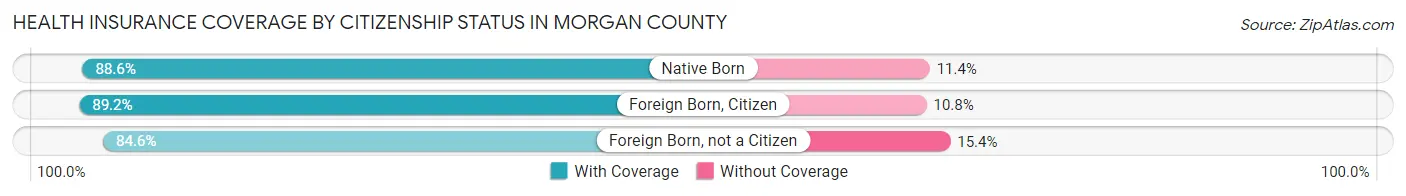
| Citizenship Status | With Coverage | Without Coverage |
| Native Born | 2,197 (88.6%) | 282 (11.4%) |
| Foreign Born, Citizen | 4,775 (89.2%) | 576 (10.8%) |
| Foreign Born, not a Citizen | 2,252 (84.6%) | 411 (15.4%) |
Health Insurance Coverage by Household Income in Morgan County
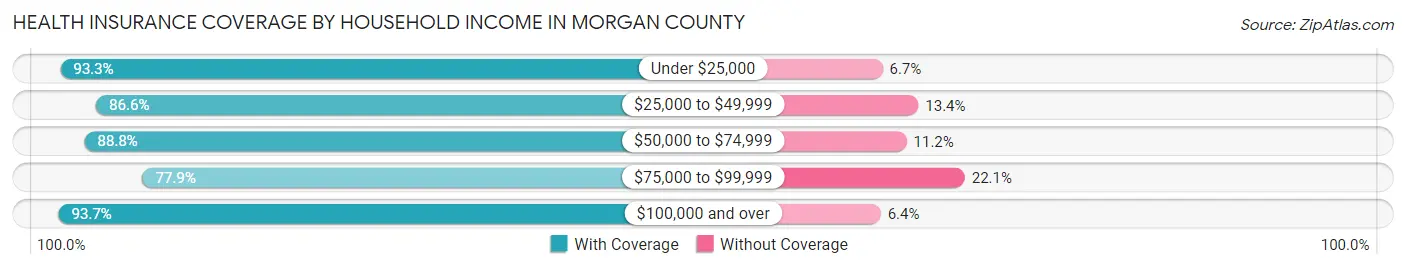
| Household Income | With Coverage | Without Coverage |
| Under $25,000 | 3,326 (93.3%) | 239 (6.7%) |
| $25,000 to $49,999 | 3,073 (86.6%) | 476 (13.4%) |
| $50,000 to $74,999 | 5,388 (88.8%) | 680 (11.2%) |
| $75,000 to $99,999 | 4,633 (77.9%) | 1,315 (22.1%) |
| $100,000 and over | 8,796 (93.6%) | 596 (6.4%) |
Public vs Private Health Insurance Coverage by Age in Morgan County
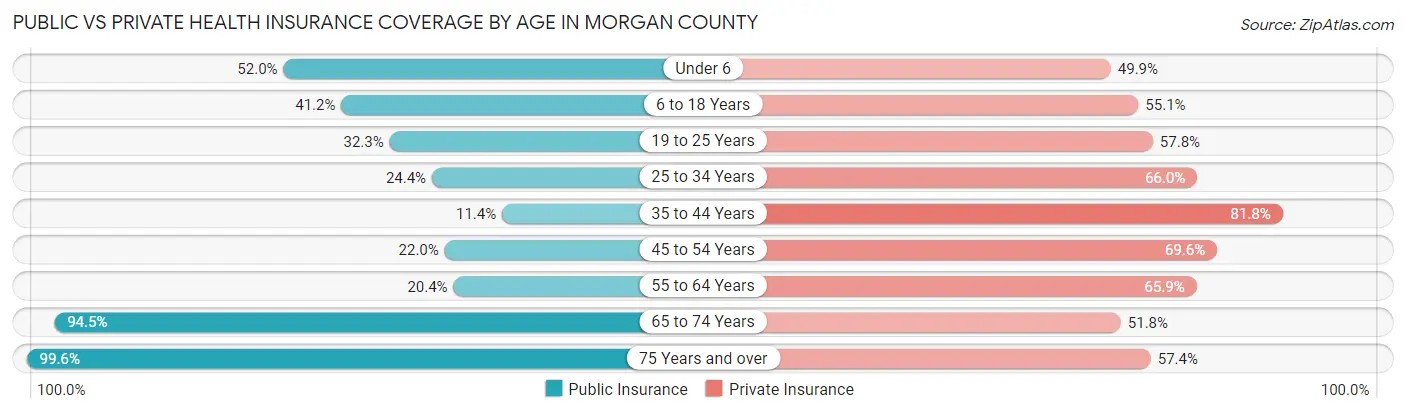
| Age Bracket | Public Insurance | Private Insurance |
| Under 6 | 1,288 (52.0%) | 1,238 (49.9%) |
| 6 to 18 Years | 2,205 (41.2%) | 2,946 (55.1%) |
| 19 to 25 Years | 859 (32.3%) | 1,538 (57.8%) |
| 25 to 34 Years | 846 (24.4%) | 2,288 (66.0%) |
| 35 to 44 Years | 398 (11.4%) | 2,862 (81.8%) |
| 45 to 54 Years | 715 (22.0%) | 2,259 (69.6%) |
| 55 to 64 Years | 737 (20.4%) | 2,379 (65.8%) |
| 65 to 74 Years | 2,337 (94.5%) | 1,281 (51.8%) |
| 75 Years and over | 1,827 (99.6%) | 1,052 (57.4%) |
| Total | 11,212 (39.2%) | 17,843 (62.3%) |
Disability Status by Sex by Age in Morgan County
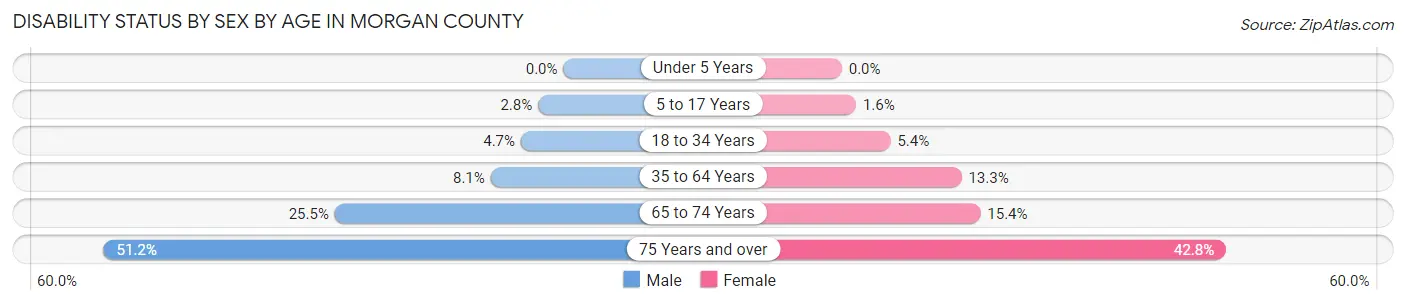
| Age Bracket | Male | Female |
| Under 5 Years | 0 (0.0%) | 0 (0.0%) |
| 5 to 17 Years | 79 (2.8%) | 42 (1.6%) |
| 18 to 34 Years | 162 (4.7%) | 163 (5.4%) |
| 35 to 64 Years | 448 (8.1%) | 643 (13.3%) |
| 65 to 74 Years | 321 (25.5%) | 187 (15.4%) |
| 75 Years and over | 385 (51.2%) | 463 (42.8%) |
Disability Class by Sex by Age in Morgan County
Disability Class: Hearing Difficulty
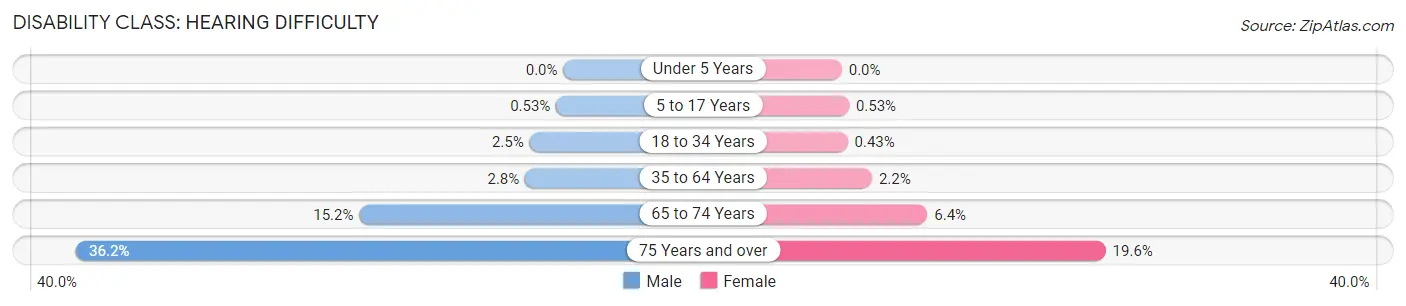
| Age Bracket | Male | Female |
| Under 5 Years | 0 (0.0%) | 0 (0.0%) |
| 5 to 17 Years | 15 (0.5%) | 14 (0.5%) |
| 18 to 34 Years | 86 (2.5%) | 13 (0.4%) |
| 35 to 64 Years | 157 (2.8%) | 108 (2.2%) |
| 65 to 74 Years | 191 (15.1%) | 77 (6.4%) |
| 75 Years and over | 272 (36.2%) | 212 (19.6%) |
Disability Class: Vision Difficulty
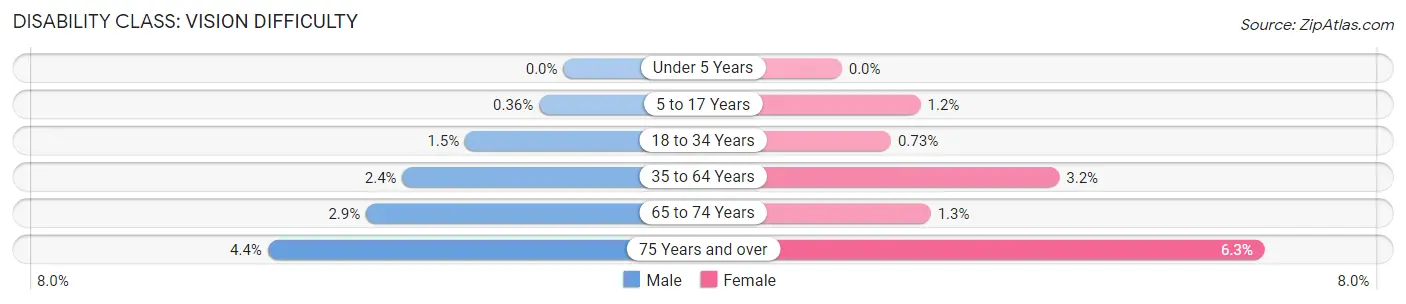
| Age Bracket | Male | Female |
| Under 5 Years | 0 (0.0%) | 0 (0.0%) |
| 5 to 17 Years | 10 (0.4%) | 31 (1.2%) |
| 18 to 34 Years | 50 (1.5%) | 22 (0.7%) |
| 35 to 64 Years | 132 (2.4%) | 156 (3.2%) |
| 65 to 74 Years | 37 (2.9%) | 16 (1.3%) |
| 75 Years and over | 33 (4.4%) | 68 (6.3%) |
Disability Class: Cognitive Difficulty
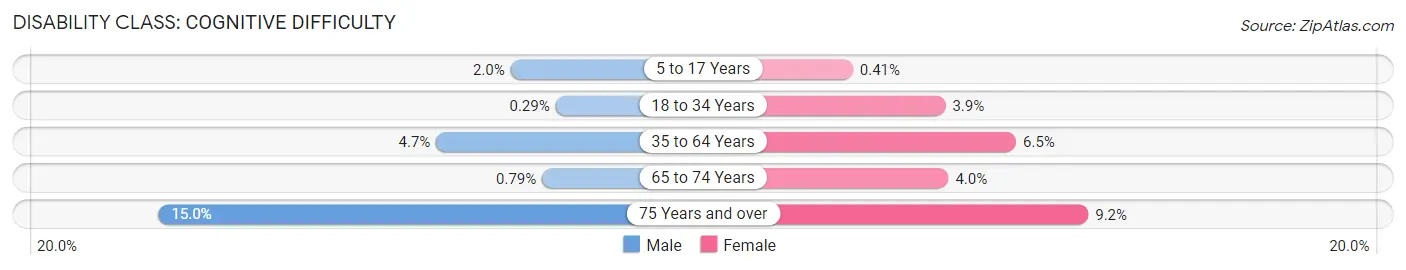
| Age Bracket | Male | Female |
| 5 to 17 Years | 55 (2.0%) | 11 (0.4%) |
| 18 to 34 Years | 10 (0.3%) | 116 (3.8%) |
| 35 to 64 Years | 261 (4.7%) | 312 (6.5%) |
| 65 to 74 Years | 10 (0.8%) | 48 (4.0%) |
| 75 Years and over | 113 (15.0%) | 99 (9.1%) |
Disability Class: Ambulatory Difficulty
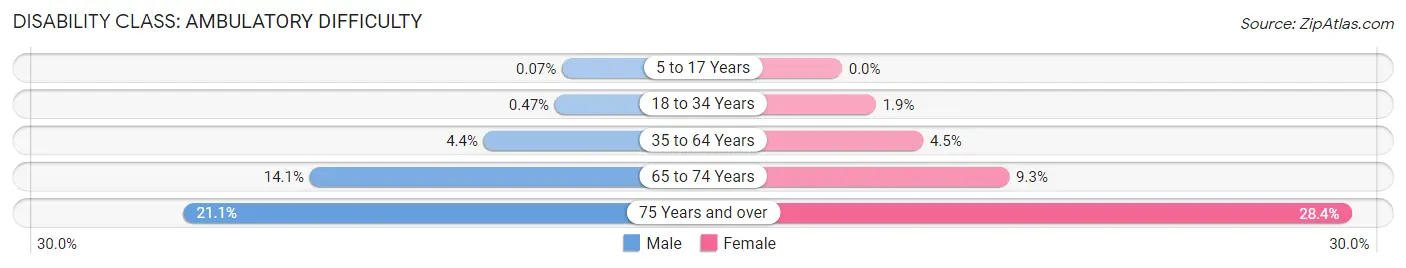
| Age Bracket | Male | Female |
| 5 to 17 Years | 2 (0.1%) | 0 (0.0%) |
| 18 to 34 Years | 16 (0.5%) | 57 (1.9%) |
| 35 to 64 Years | 245 (4.4%) | 218 (4.5%) |
| 65 to 74 Years | 178 (14.1%) | 113 (9.3%) |
| 75 Years and over | 159 (21.1%) | 307 (28.4%) |
Disability Class: Self-Care Difficulty
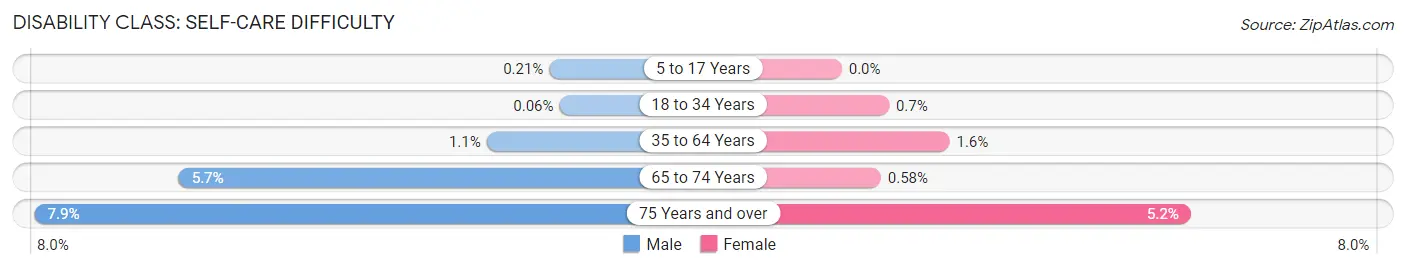
| Age Bracket | Male | Female |
| 5 to 17 Years | 6 (0.2%) | 0 (0.0%) |
| 18 to 34 Years | 2 (0.1%) | 21 (0.7%) |
| 35 to 64 Years | 63 (1.1%) | 77 (1.6%) |
| 65 to 74 Years | 72 (5.7%) | 7 (0.6%) |
| 75 Years and over | 59 (7.9%) | 56 (5.2%) |
Technology Access in Morgan County
Computing Device Access in Morgan County
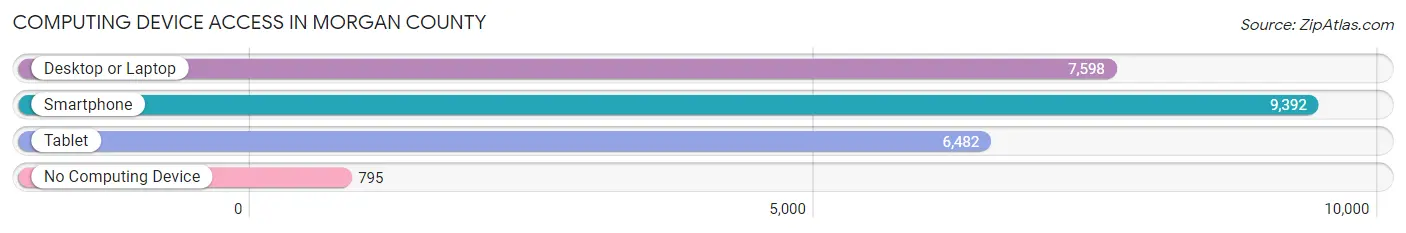
| Device Type | # Households | % Households |
| Desktop or Laptop | 7,598 | 69.9% |
| Smartphone | 9,392 | 86.4% |
| Tablet | 6,482 | 59.6% |
| No Computing Device | 795 | 7.3% |
| Total | 10,872 | 100.0% |
Internet Access in Morgan County
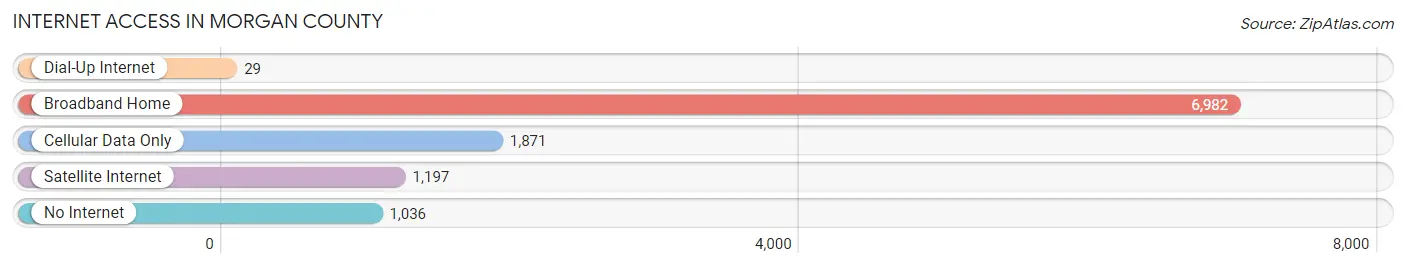
| Internet Type | # Households | % Households |
| Dial-Up Internet | 29 | 0.3% |
| Broadband Home | 6,982 | 64.2% |
| Cellular Data Only | 1,871 | 17.2% |
| Satellite Internet | 1,197 | 11.0% |
| No Internet | 1,036 | 9.5% |
| Total | 10,872 | 100.0% |
Morgan County Summary
Introduction
Morgan County is located in the northeastern corner of Colorado, and is part of the Denver-Aurora-Lakewood Metropolitan Statistical Area. It is bordered by Weld County to the north, Logan County to the east, Washington County to the south, and Adams County to the west. The county seat is Fort Morgan, and the largest city is Brush. The county was named after Colonel Christopher A. Morgan, a Civil War veteran and the first Colorado Secretary of State.
History
The area that is now Morgan County was originally inhabited by the Arapaho and Cheyenne Native American tribes. The first white settlers arrived in the area in the 1860s, and the county was officially established in 1889. The county was originally part of Weld County, but was split off in 1889 due to its large population.
The county was largely agricultural in its early years, with the main crops being wheat, corn, and sugar beets. The sugar beet industry was particularly important to the county, and the Great Western Sugar Company built a large factory in Fort Morgan in 1901. The factory was the largest of its kind in the world at the time, and it helped to spur the growth of the county.
In the early 20th century, the county also saw an influx of immigrants from Europe, particularly from Germany and Russia. These immigrants helped to shape the culture of the county, and many of their descendants still live in the area today.
Geography
Morgan County covers an area of 1,521 square miles, making it the fifth-largest county in Colorado. The county is located in the northeastern corner of the state, and is bordered by Weld County to the north, Logan County to the east, Washington County to the south, and Adams County to the west.
The county is mostly flat, with some rolling hills in the western part of the county. The South Platte River runs through the county, and there are several reservoirs and lakes in the area, including Jackson Lake, Jackson Reservoir, and Lake John.
The county is mostly rural, with the majority of the population living in small towns and unincorporated communities. The largest city in the county is Brush, with a population of 5,400. The county seat is Fort Morgan, with a population of 11,000.
Economy
The economy of Morgan County is largely based on agriculture and energy production. The county is home to several large farms, and the main crops grown in the area are wheat, corn, and sugar beets. The county is also home to several oil and gas fields, and the energy industry is a major employer in the area.
In addition to agriculture and energy production, the county is also home to several manufacturing companies, including a large sugar beet processing plant in Fort Morgan. The county is also home to several retail stores, restaurants, and other businesses.
Demographics
As of the 2010 census, the population of Morgan County was 28,159. The population is largely white (90.2%), with small Hispanic (4.7%) and African American (2.2%) populations. The median household income in the county is $50,845, and the median home value is $164,400.
Conclusion
Morgan County is a rural county located in the northeastern corner of Colorado. The county is largely agricultural, with the main crops being wheat, corn, and sugar beets. The county is also home to several oil and gas fields, and the energy industry is a major employer in the area. The population of the county is largely white, with small Hispanic and African American populations. The median household income in the county is $50,845, and the median home value is $164,400.
Common Questions
What is the Total Population of Morgan County?
Total Population of Morgan County is 29,045.
What is the Total Male Population of Morgan County?
Total Male Population of Morgan County is 15,015.
What is the Total Female Population of Morgan County?
Total Female Population of Morgan County is 14,030.
What is the Ratio of Males per 100 Females in Morgan County?
There are 107.02 Males per 100 Females in Morgan County.
What is the Ratio of Females per 100 Males in Morgan County?
There are 93.44 Females per 100 Males in Morgan County.
What is the Median Population Age in Morgan County?
Median Population Age in Morgan County is 36.9 Years.
What is the Average Family Size in Morgan County
Average Family Size in Morgan County is 3.2 People.
What is the Average Household Size in Morgan County
Average Household Size in Morgan County is 2.6 People.
What is Per Capita Income in Morgan County?
Per Capita income in Morgan County is $30,422.
What is the Median Family Income in Morgan County?
Median Family Income in Morgan County is $81,066.
What is the Median Household income in Morgan County?
Median Household Income in Morgan County is $70,471.
What is Income or Wage Gap in Morgan County?
Income or Wage Gap in Morgan County is 40.4%.
Women in Morgan County earn 59.6 cents for every dollar earned by a man.
What is Family Income Deficit in Morgan County?
Family Income Deficit in Morgan County is $11,070.
Families that are below poverty line in Morgan County earn $11,070 less on average than the poverty threshold level.
What is Inequality or Gini Index in Morgan County?
Inequality or Gini Index in Morgan County is 0.41.
How Large is the Labor Force in Morgan County?
There are 14,330 People in the Labor Forcein in Morgan County.
What is the Percentage of People in the Labor Force in Morgan County?
64.4% of People are in the Labor Force in Morgan County.
What is the Unemployment Rate in Morgan County?
Unemployment Rate in Morgan County is 3.7%.