Montrose County, CO
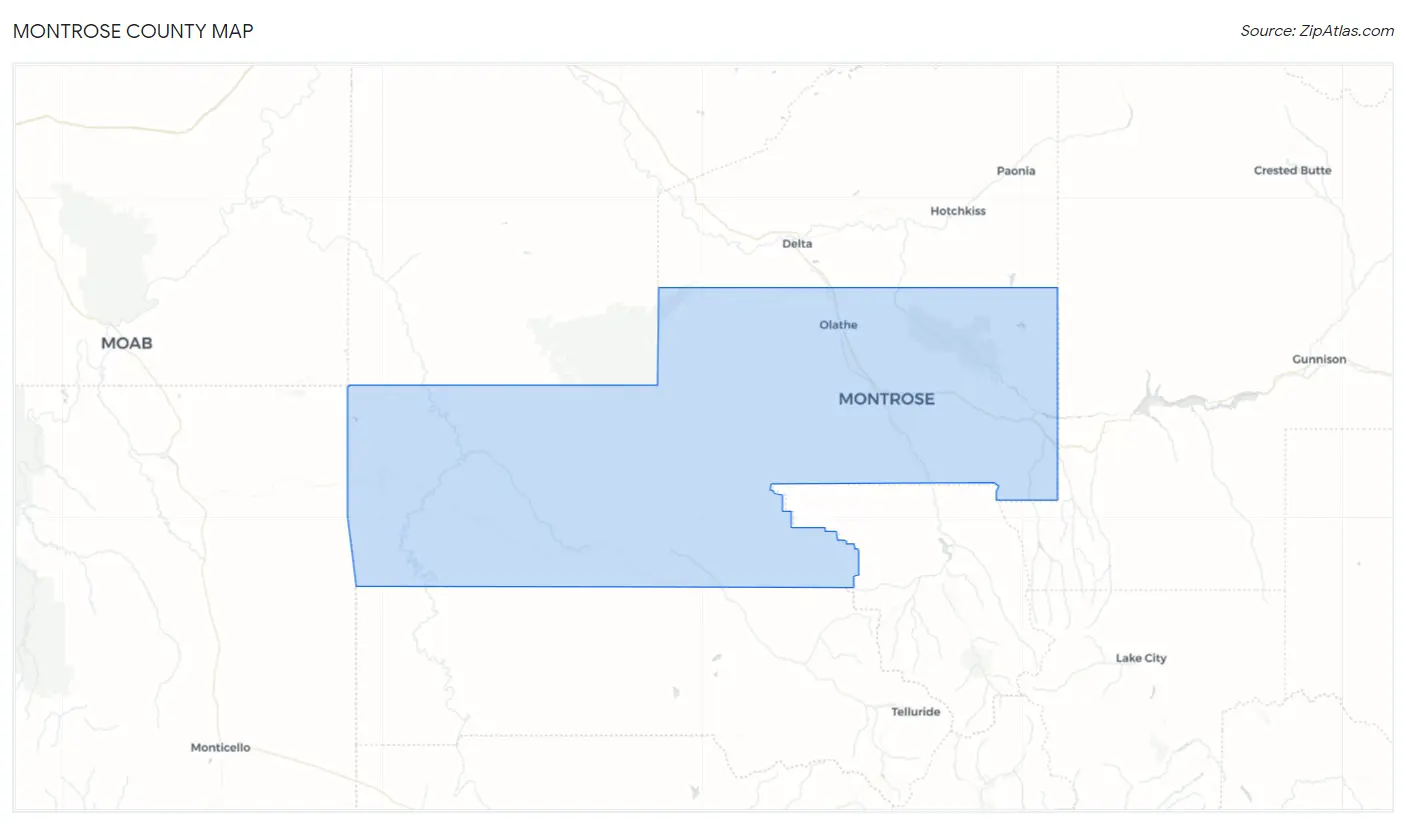
Montrose County Map
Montrose County Overview
42,823
TOTAL POPULATION
21,392
MALE POPULATION
21,431
FEMALE POPULATION
99.82
MALES / 100 FEMALES
100.18
FEMALES / 100 MALES
45.9
MEDIAN AGE
3.0
AVG FAMILY SIZE
2.5
AVG HOUSEHOLD SIZE
$35,755
PER CAPITA INCOME
$78,074
AVG FAMILY INCOME
$62,817
AVG HOUSEHOLD INCOME
17.7%
WAGE / INCOME GAP [ % ]
82.3¢/ $1
WAGE / INCOME GAP [ $ ]
$9,985
FAMILY INCOME DEFICIT
0.47
INEQUALITY / GINI INDEX
19,495
LABOR FORCE [ PEOPLE ]
55.5%
PERCENT IN LABOR FORCE
4.3%
UNEMPLOYMENT RATE
Montrose County Area Codes
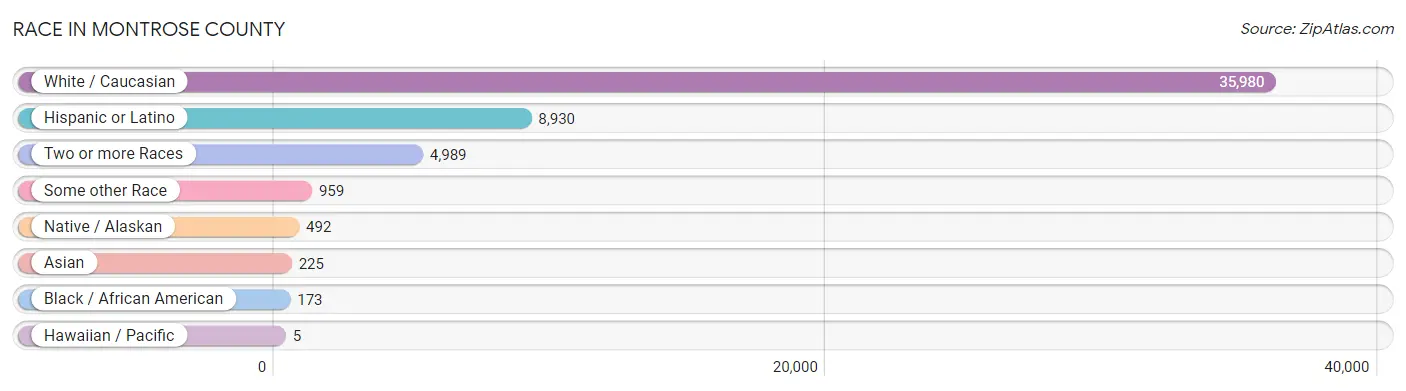
Race in Montrose County
The most populous races in Montrose County are White / Caucasian (35,980 | 84.0%), Hispanic or Latino (8,930 | 20.8%), and Two or more Races (4,989 | 11.7%).
| Race | # Population | % Population |
| Asian | 225 | 0.5% |
| Black / African American | 173 | 0.4% |
| Hawaiian / Pacific | 5 | 0.0% |
| Hispanic or Latino | 8,930 | 20.8% |
| Native / Alaskan | 492 | 1.1% |
| White / Caucasian | 35,980 | 84.0% |
| Two or more Races | 4,989 | 11.7% |
| Some other Race | 959 | 2.2% |
| Total | 42,823 | 100.0% |
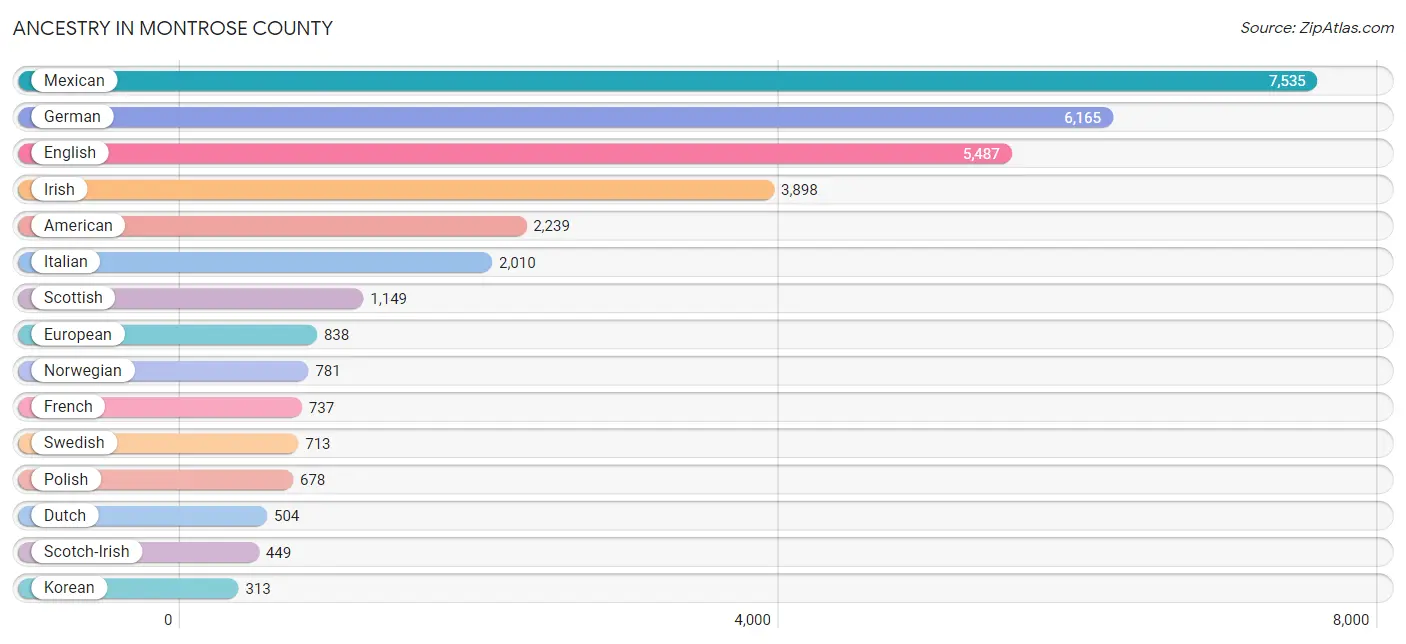
Ancestry in Montrose County
The most populous ancestries reported in Montrose County are Mexican (7,535 | 17.6%), German (6,165 | 14.4%), English (5,487 | 12.8%), Irish (3,898 | 9.1%), and American (2,239 | 5.2%), together accounting for 59.1% of all Montrose County residents.
| Ancestry | # Population | % Population |
| African | 10 | 0.0% |
| American | 2,239 | 5.2% |
| Apache | 160 | 0.4% |
| Arab | 43 | 0.1% |
| Armenian | 51 | 0.1% |
| Australian | 13 | 0.0% |
| Austrian | 59 | 0.1% |
| Basque | 52 | 0.1% |
| Belgian | 24 | 0.1% |
| Bhutanese | 98 | 0.2% |
| British | 165 | 0.4% |
| Burmese | 20 | 0.1% |
| Canadian | 34 | 0.1% |
| Central American | 229 | 0.5% |
| Central American Indian | 6 | 0.0% |
| Cherokee | 312 | 0.7% |
| Chickasaw | 5 | 0.0% |
| Chippewa | 57 | 0.1% |
| Choctaw | 117 | 0.3% |
| Colombian | 3 | 0.0% |
| Cree | 184 | 0.4% |
| Croatian | 24 | 0.1% |
| Czech | 173 | 0.4% |
| Czechoslovakian | 25 | 0.1% |
| Danish | 221 | 0.5% |
| Dutch | 504 | 1.2% |
| Eastern European | 84 | 0.2% |
| English | 5,487 | 12.8% |
| European | 838 | 2.0% |
| Finnish | 16 | 0.0% |
| French | 737 | 1.7% |
| French Canadian | 69 | 0.2% |
| German | 6,165 | 14.4% |
| Greek | 83 | 0.2% |
| Honduran | 3 | 0.0% |
| Hungarian | 47 | 0.1% |
| Icelander | 8 | 0.0% |
| Indian (Asian) | 26 | 0.1% |
| Inupiat | 14 | 0.0% |
| Irish | 3,898 | 9.1% |
| Iroquois | 63 | 0.2% |
| Italian | 2,010 | 4.7% |
| Korean | 313 | 0.7% |
| Lebanese | 9 | 0.0% |
| Lithuanian | 87 | 0.2% |
| Luxembourger | 15 | 0.0% |
| Mexican | 7,535 | 17.6% |
| Mexican American Indian | 12 | 0.0% |
| Native Hawaiian | 5 | 0.0% |
| Navajo | 67 | 0.2% |
| Northern European | 63 | 0.2% |
| Norwegian | 781 | 1.8% |
| Pennsylvania German | 25 | 0.1% |
| Peruvian | 280 | 0.6% |
| Polish | 678 | 1.6% |
| Portuguese | 36 | 0.1% |
| Pueblo | 39 | 0.1% |
| Puerto Rican | 86 | 0.2% |
| Russian | 164 | 0.4% |
| Salvadoran | 226 | 0.5% |
| Scandinavian | 182 | 0.4% |
| Scotch-Irish | 449 | 1.1% |
| Scottish | 1,149 | 2.7% |
| Serbian | 15 | 0.0% |
| Slovak | 32 | 0.1% |
| South American | 308 | 0.7% |
| Spaniard | 119 | 0.3% |
| Spanish | 137 | 0.3% |
| Spanish American | 29 | 0.1% |
| Sri Lankan | 78 | 0.2% |
| Subsaharan African | 10 | 0.0% |
| Swedish | 713 | 1.7% |
| Swiss | 218 | 0.5% |
| Ukrainian | 59 | 0.1% |
| Uruguayan | 25 | 0.1% |
| Ute | 4 | 0.0% |
| Welsh | 226 | 0.5% |
| Yugoslavian | 7 | 0.0% | View All 78 Rows |
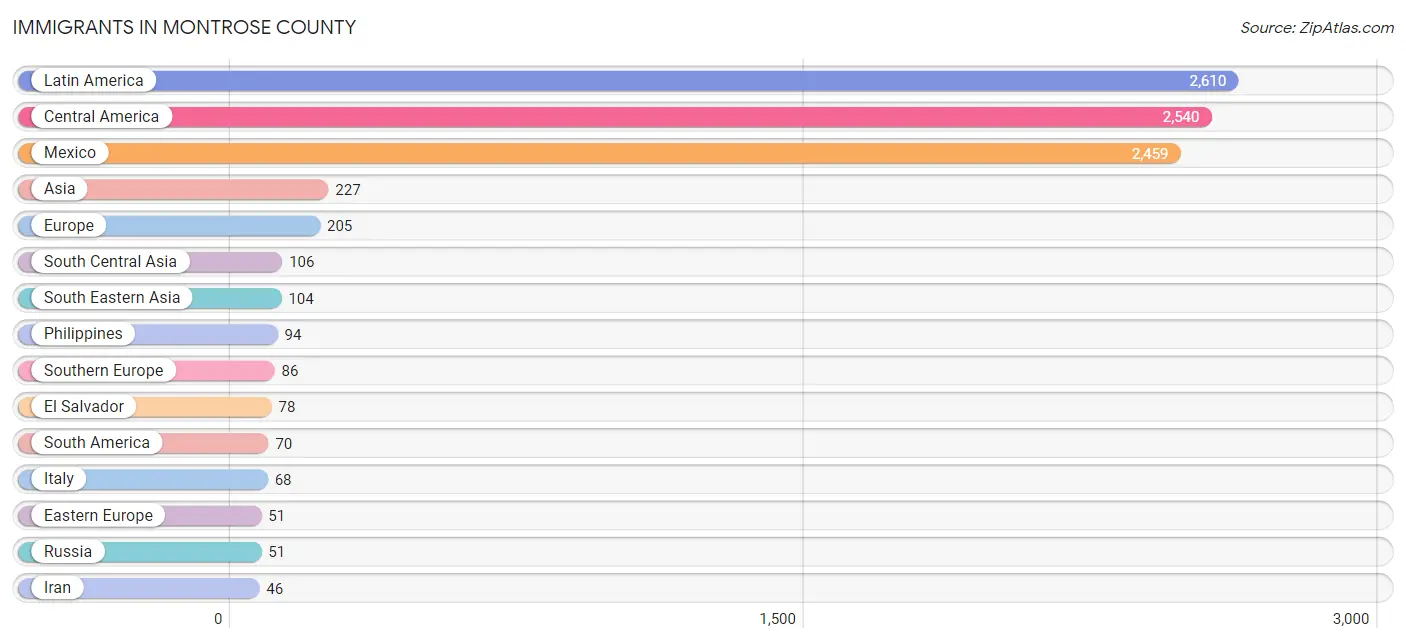
Immigrants in Montrose County
The most numerous immigrant groups reported in Montrose County came from Latin America (2,610 | 6.1%), Central America (2,540 | 5.9%), Mexico (2,459 | 5.7%), Asia (227 | 0.5%), and Europe (205 | 0.5%), together accounting for 18.8% of all Montrose County residents.
| Immigration Origin | # Population | % Population |
| Asia | 227 | 0.5% |
| Australia | 13 | 0.0% |
| Brazil | 19 | 0.0% |
| Canada | 33 | 0.1% |
| Central America | 2,540 | 5.9% |
| China | 4 | 0.0% |
| Colombia | 3 | 0.0% |
| Eastern Asia | 17 | 0.0% |
| Eastern Europe | 51 | 0.1% |
| El Salvador | 78 | 0.2% |
| England | 23 | 0.1% |
| Europe | 205 | 0.5% |
| Germany | 24 | 0.1% |
| Greece | 18 | 0.0% |
| Honduras | 3 | 0.0% |
| Iran | 46 | 0.1% |
| Italy | 68 | 0.2% |
| Japan | 5 | 0.0% |
| Korea | 8 | 0.0% |
| Latin America | 2,610 | 6.1% |
| Mexico | 2,459 | 5.7% |
| Nepal | 14 | 0.0% |
| Netherlands | 1 | 0.0% |
| Northern Europe | 43 | 0.1% |
| Oceania | 31 | 0.1% |
| Pakistan | 46 | 0.1% |
| Peru | 23 | 0.1% |
| Philippines | 94 | 0.2% |
| Russia | 51 | 0.1% |
| Scotland | 12 | 0.0% |
| South America | 70 | 0.2% |
| South Central Asia | 106 | 0.3% |
| South Eastern Asia | 104 | 0.2% |
| Southern Europe | 86 | 0.2% |
| Uruguay | 25 | 0.1% |
| Vietnam | 10 | 0.0% |
| Western Europe | 25 | 0.1% | View All 37 Rows |
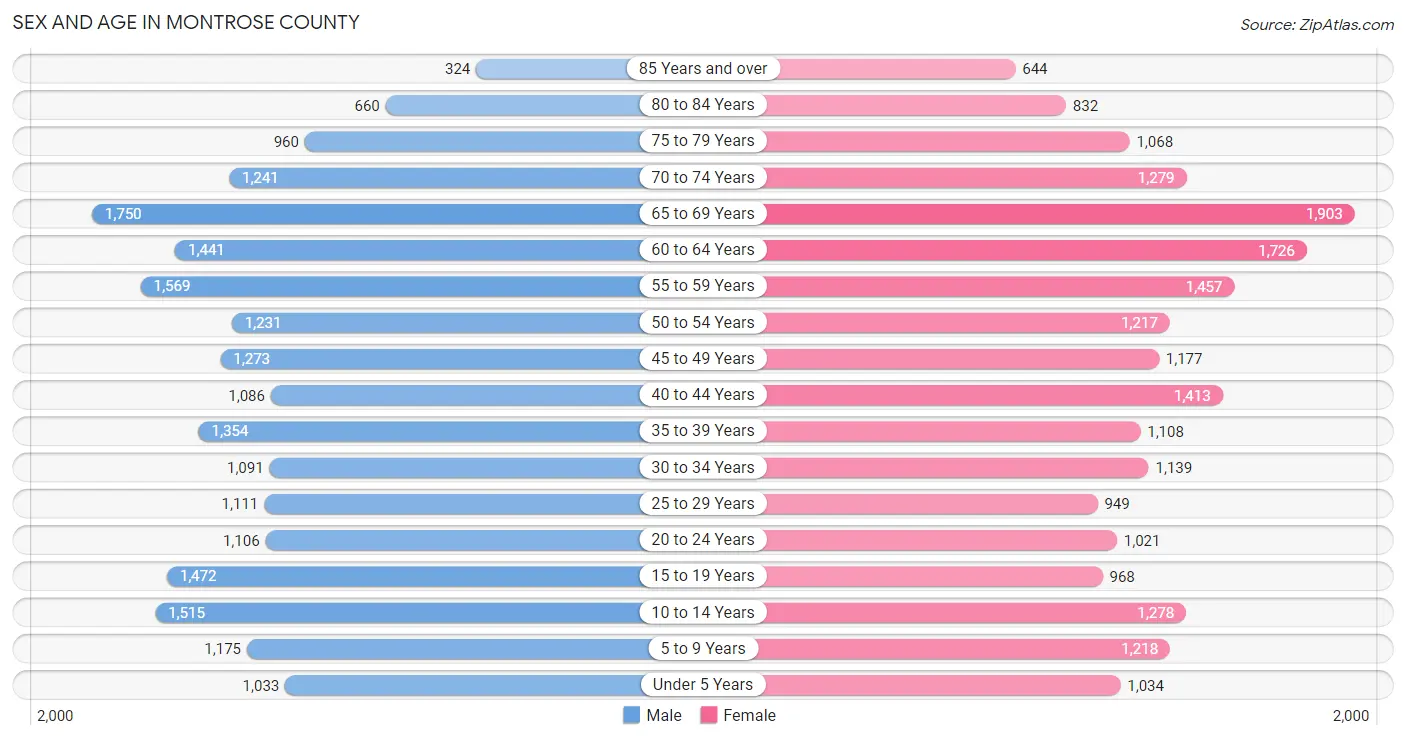
Sex and Age in Montrose County
Sex and Age in Montrose County
The most populous age groups in Montrose County are 65 to 69 Years (1,750 | 8.2%) for men and 65 to 69 Years (1,903 | 8.9%) for women.
| Age Bracket | Male | Female |
| Under 5 Years | 1,033 (4.8%) | 1,034 (4.8%) |
| 5 to 9 Years | 1,175 (5.5%) | 1,218 (5.7%) |
| 10 to 14 Years | 1,515 (7.1%) | 1,278 (6.0%) |
| 15 to 19 Years | 1,472 (6.9%) | 968 (4.5%) |
| 20 to 24 Years | 1,106 (5.2%) | 1,021 (4.8%) |
| 25 to 29 Years | 1,111 (5.2%) | 949 (4.4%) |
| 30 to 34 Years | 1,091 (5.1%) | 1,139 (5.3%) |
| 35 to 39 Years | 1,354 (6.3%) | 1,108 (5.2%) |
| 40 to 44 Years | 1,086 (5.1%) | 1,413 (6.6%) |
| 45 to 49 Years | 1,273 (5.9%) | 1,177 (5.5%) |
| 50 to 54 Years | 1,231 (5.8%) | 1,217 (5.7%) |
| 55 to 59 Years | 1,569 (7.3%) | 1,457 (6.8%) |
| 60 to 64 Years | 1,441 (6.7%) | 1,726 (8.1%) |
| 65 to 69 Years | 1,750 (8.2%) | 1,903 (8.9%) |
| 70 to 74 Years | 1,241 (5.8%) | 1,279 (6.0%) |
| 75 to 79 Years | 960 (4.5%) | 1,068 (5.0%) |
| 80 to 84 Years | 660 (3.1%) | 832 (3.9%) |
| 85 Years and over | 324 (1.5%) | 644 (3.0%) |
| Total | 21,392 (100.0%) | 21,431 (100.0%) |
Families and Households in Montrose County
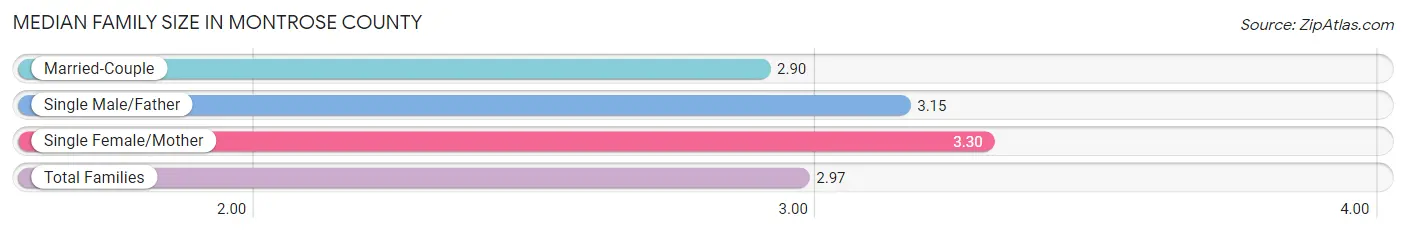
Median Family Size in Montrose County
The median family size in Montrose County is 2.97 persons per family, with single female/mother families (1,681 | 14.2%) accounting for the largest median family size of 3.3 persons per family. On the other hand, married-couple families (9,274 | 78.5%) represent the smallest median family size with 2.90 persons per family.
| Family Type | # Families | Family Size |
| Married-Couple | 9,274 (78.5%) | 2.90 |
| Single Male/Father | 851 (7.2%) | 3.15 |
| Single Female/Mother | 1,681 (14.2%) | 3.30 |
| Total Families | 11,806 (100.0%) | 2.97 |
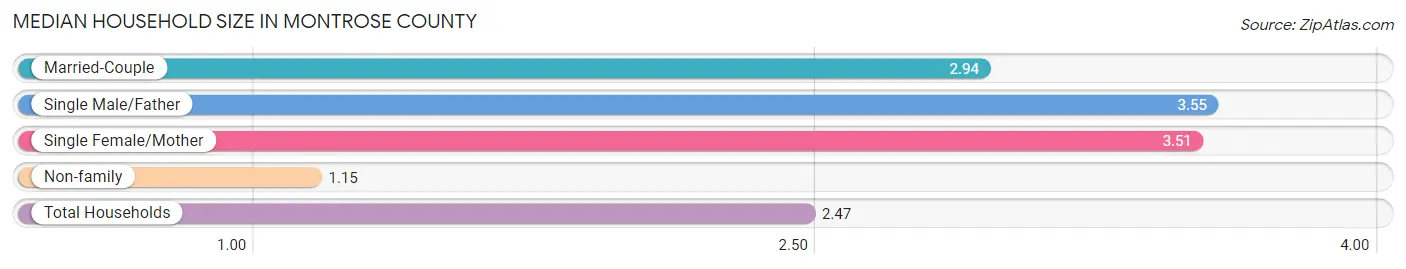
Median Household Size in Montrose County
The median household size in Montrose County is 2.47 persons per household, with single male/father households (851 | 5.0%) accounting for the largest median household size of 3.55 persons per household. non-family households (5,236 | 30.7%) represent the smallest median household size with 1.15 persons per household.
| Household Type | # Households | Household Size |
| Married-Couple | 9,274 (54.4%) | 2.94 |
| Single Male/Father | 851 (5.0%) | 3.55 |
| Single Female/Mother | 1,681 (9.9%) | 3.51 |
| Non-family | 5,236 (30.7%) | 1.15 |
| Total Households | 17,042 (100.0%) | 2.47 |
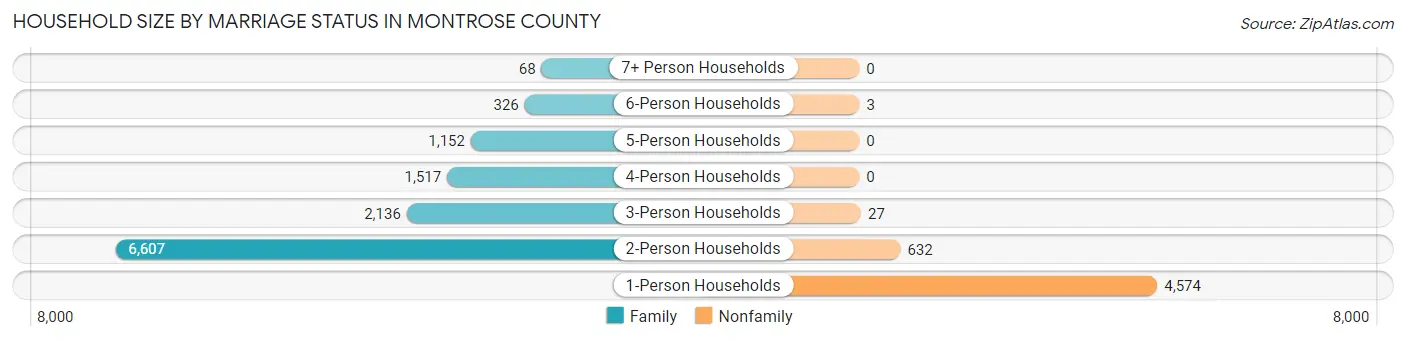
Household Size by Marriage Status in Montrose County
Out of a total of 17,042 households in Montrose County, 11,806 (69.3%) are family households, while 5,236 (30.7%) are nonfamily households. The most numerous type of family households are 2-person households, comprising 6,607, and the most common type of nonfamily households are 1-person households, comprising 4,574.
| Household Size | Family Households | Nonfamily Households |
| 1-Person Households | - | 4,574 (26.8%) |
| 2-Person Households | 6,607 (38.8%) | 632 (3.7%) |
| 3-Person Households | 2,136 (12.5%) | 27 (0.2%) |
| 4-Person Households | 1,517 (8.9%) | 0 (0.0%) |
| 5-Person Households | 1,152 (6.8%) | 0 (0.0%) |
| 6-Person Households | 326 (1.9%) | 3 (0.0%) |
| 7+ Person Households | 68 (0.4%) | 0 (0.0%) |
| Total | 11,806 (69.3%) | 5,236 (30.7%) |
Female Fertility in Montrose County
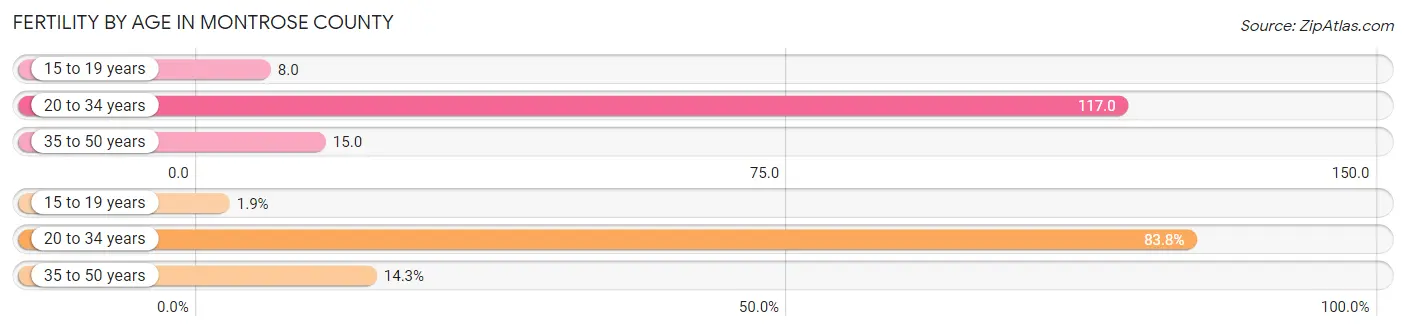
Fertility by Age in Montrose County
Average fertility rate in Montrose County is 54.0 births per 1,000 women. Women in the age bracket of 20 to 34 years have the highest fertility rate with 117.0 births per 1,000 women. Women in the age bracket of 20 to 34 years acount for 83.8% of all women with births.
| Age Bracket | Women with Births | Births / 1,000 Women |
| 15 to 19 years | 8 (1.8%) | 8.0 |
| 20 to 34 years | 363 (83.8%) | 117.0 |
| 35 to 50 years | 62 (14.3%) | 15.0 |
| Total | 433 (100.0%) | 54.0 |
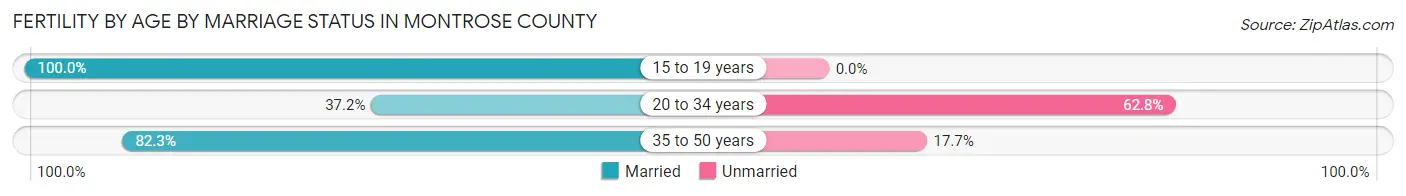
Fertility by Age by Marriage Status in Montrose County
44.8% of women with births (433) in Montrose County are married. The highest percentage of unmarried women with births falls into 20 to 34 years age bracket with 62.8% of them unmarried at the time of birth, while the lowest percentage of unmarried women with births belong to 15 to 19 years age bracket with 0.0% of them unmarried.
| Age Bracket | Married | Unmarried |
| 15 to 19 years | 8 (100.0%) | 0 (0.0%) |
| 20 to 34 years | 135 (37.2%) | 228 (62.8%) |
| 35 to 50 years | 51 (82.3%) | 11 (17.7%) |
| Total | 194 (44.8%) | 239 (55.2%) |
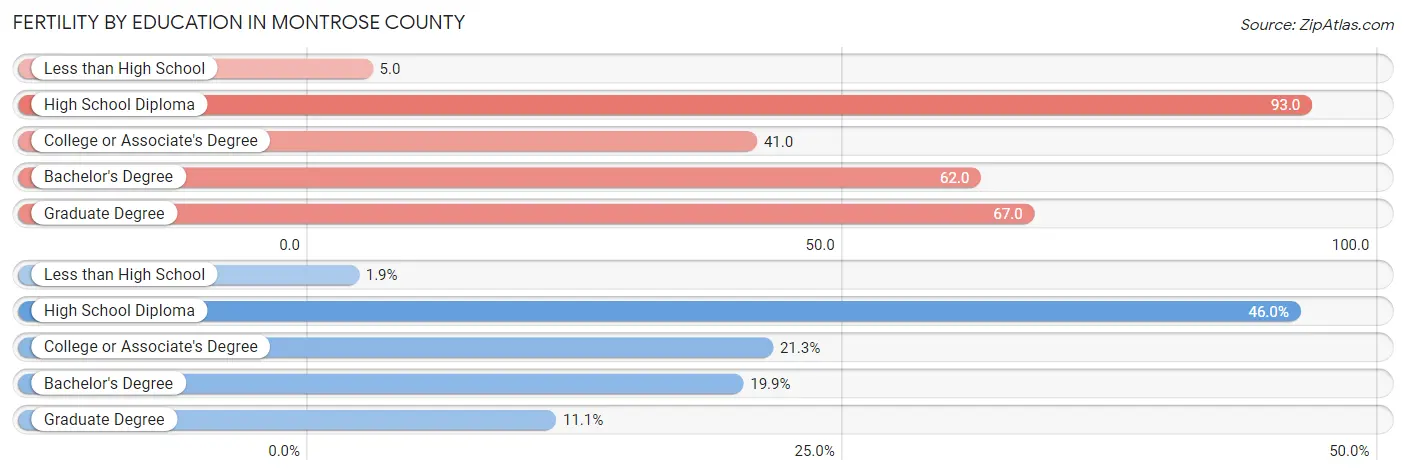
Fertility by Education in Montrose County
Average fertility rate in Montrose County is 54.0 births per 1,000 women. Women with the education attainment of high school diploma have the highest fertility rate of 93.0 births per 1,000 women, while women with the education attainment of less than high school have the lowest fertility at 5.0 births per 1,000 women. Women with the education attainment of high school diploma represent 46.0% of all women with births.
| Educational Attainment | Women with Births | Births / 1,000 Women |
| Less than High School | 8 (1.8%) | 5.0 |
| High School Diploma | 199 (46.0%) | 93.0 |
| College or Associate's Degree | 92 (21.2%) | 41.0 |
| Bachelor's Degree | 86 (19.9%) | 62.0 |
| Graduate Degree | 48 (11.1%) | 67.0 |
| Total | 433 (100.0%) | 54.0 |
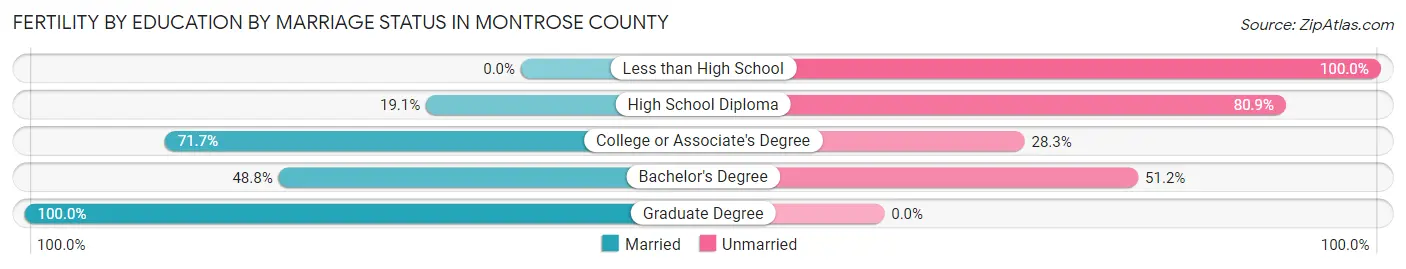
Fertility by Education by Marriage Status in Montrose County
55.2% of women with births in Montrose County are unmarried. Women with the educational attainment of graduate degree are most likely to be married with 100.0% of them married at childbirth, while women with the educational attainment of less than high school are least likely to be married with 100.0% of them unmarried at childbirth.
| Educational Attainment | Married | Unmarried |
| Less than High School | 0 (0.0%) | 8 (100.0%) |
| High School Diploma | 38 (19.1%) | 161 (80.9%) |
| College or Associate's Degree | 66 (71.7%) | 26 (28.3%) |
| Bachelor's Degree | 42 (48.8%) | 44 (51.2%) |
| Graduate Degree | 48 (100.0%) | 0 (0.0%) |
| Total | 194 (44.8%) | 239 (55.2%) |
Income in Montrose County
Income Overview in Montrose County
Per Capita Income in Montrose County is $35,755, while median incomes of families and households are $78,074 and $62,817 respectively.
| Characteristic | Number | Measure |
| Per Capita Income | 42,823 | $35,755 |
| Median Family Income | 11,806 | $78,074 |
| Mean Family Income | 11,806 | $100,016 |
| Median Household Income | 17,042 | $62,817 |
| Mean Household Income | 17,042 | $84,981 |
| Income Deficit | 11,806 | $9,985 |
| Wage / Income Gap (%) | 42,823 | 17.73% |
| Wage / Income Gap ($) | 42,823 | 82.27¢ per $1 |
| Gini / Inequality Index | 42,823 | 0.47 |
Earnings by Sex in Montrose County
Average Earnings in Montrose County are $36,822, $41,901 for men and $34,472 for women, a difference of 17.7%.
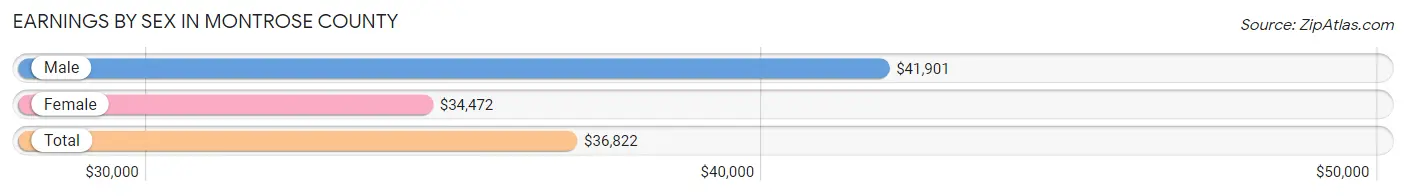
| Sex | Number | Average Earnings |
| Male | 11,780 (55.4%) | $41,901 |
| Female | 9,486 (44.6%) | $34,472 |
| Total | 21,266 (100.0%) | $36,822 |
Earnings by Sex by Income Bracket in Montrose County
The most common earnings brackets in Montrose County are $75,000 to $99,999 for men (1,541 | 13.1%) and $35,000 to $39,999 for women (954 | 10.1%).
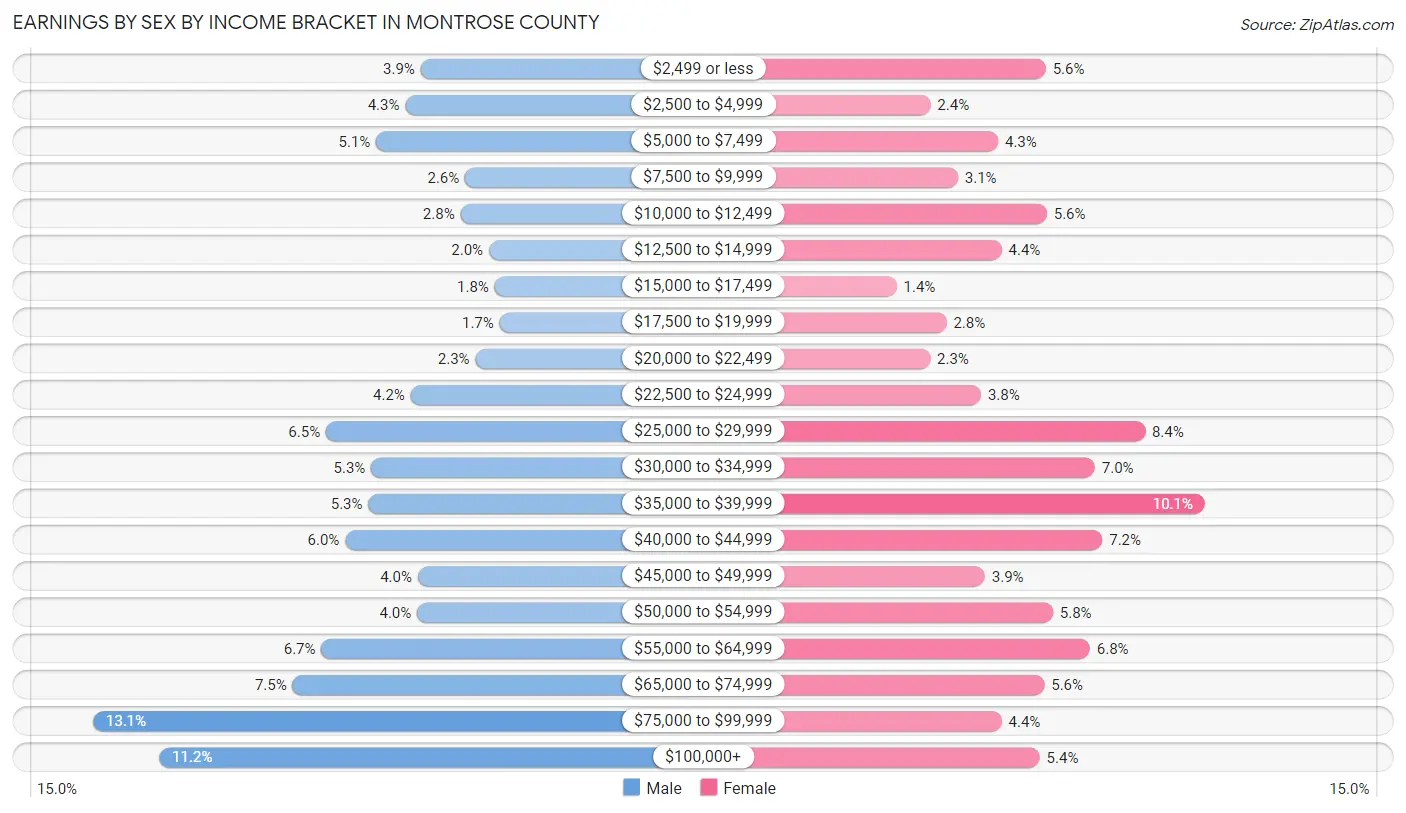
| Income | Male | Female |
| $2,499 or less | 456 (3.9%) | 530 (5.6%) |
| $2,500 to $4,999 | 506 (4.3%) | 223 (2.4%) |
| $5,000 to $7,499 | 603 (5.1%) | 403 (4.3%) |
| $7,500 to $9,999 | 309 (2.6%) | 296 (3.1%) |
| $10,000 to $12,499 | 324 (2.8%) | 533 (5.6%) |
| $12,500 to $14,999 | 230 (1.9%) | 413 (4.3%) |
| $15,000 to $17,499 | 211 (1.8%) | 133 (1.4%) |
| $17,500 to $19,999 | 194 (1.7%) | 266 (2.8%) |
| $20,000 to $22,499 | 274 (2.3%) | 222 (2.3%) |
| $22,500 to $24,999 | 489 (4.2%) | 358 (3.8%) |
| $25,000 to $29,999 | 769 (6.5%) | 795 (8.4%) |
| $30,000 to $34,999 | 620 (5.3%) | 661 (7.0%) |
| $35,000 to $39,999 | 629 (5.3%) | 954 (10.1%) |
| $40,000 to $44,999 | 706 (6.0%) | 681 (7.2%) |
| $45,000 to $49,999 | 465 (4.0%) | 368 (3.9%) |
| $50,000 to $54,999 | 468 (4.0%) | 549 (5.8%) |
| $55,000 to $64,999 | 784 (6.7%) | 648 (6.8%) |
| $65,000 to $74,999 | 880 (7.5%) | 526 (5.6%) |
| $75,000 to $99,999 | 1,541 (13.1%) | 413 (4.3%) |
| $100,000+ | 1,322 (11.2%) | 514 (5.4%) |
| Total | 11,780 (100.0%) | 9,486 (100.0%) |
Earnings by Sex by Educational Attainment in Montrose County
Average earnings in Montrose County are $47,619 for men and $35,826 for women, a difference of 24.8%. Men with an educational attainment of graduate degree enjoy the highest average annual earnings of $75,559, while those with less than high school education earn the least with $37,889. Women with an educational attainment of graduate degree earn the most with the average annual earnings of $40,492, while those with less than high school education have the smallest earnings of $26,221.
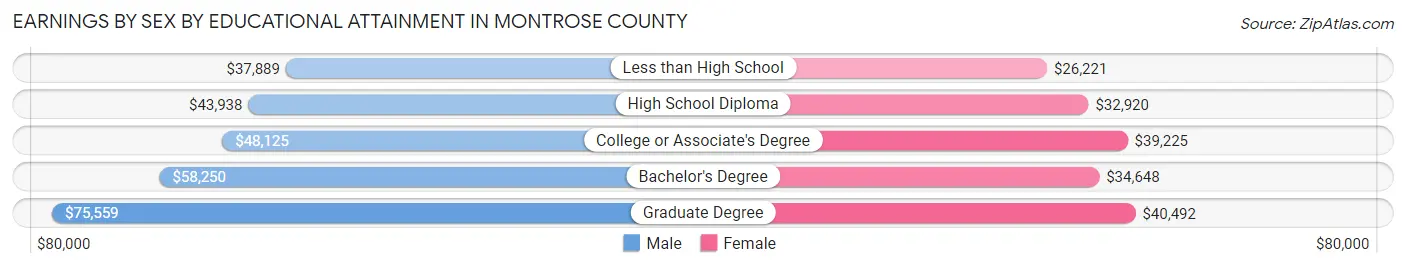
| Educational Attainment | Male Income | Female Income |
| Less than High School | $37,889 | $26,221 |
| High School Diploma | $43,938 | $32,920 |
| College or Associate's Degree | $48,125 | $39,225 |
| Bachelor's Degree | $58,250 | $34,648 |
| Graduate Degree | $75,559 | $40,492 |
| Total | $47,619 | $35,826 |
Family Income in Montrose County
Family Income Brackets in Montrose County
According to the Montrose County family income data, there are 2,184 families falling into the $50,000 to $74,999 income range, which is the most common income bracket and makes up 18.5% of all families. Conversely, the $10,000 to $14,999 income bracket is the least frequent group with only 153 families (1.3%) belonging to this category.
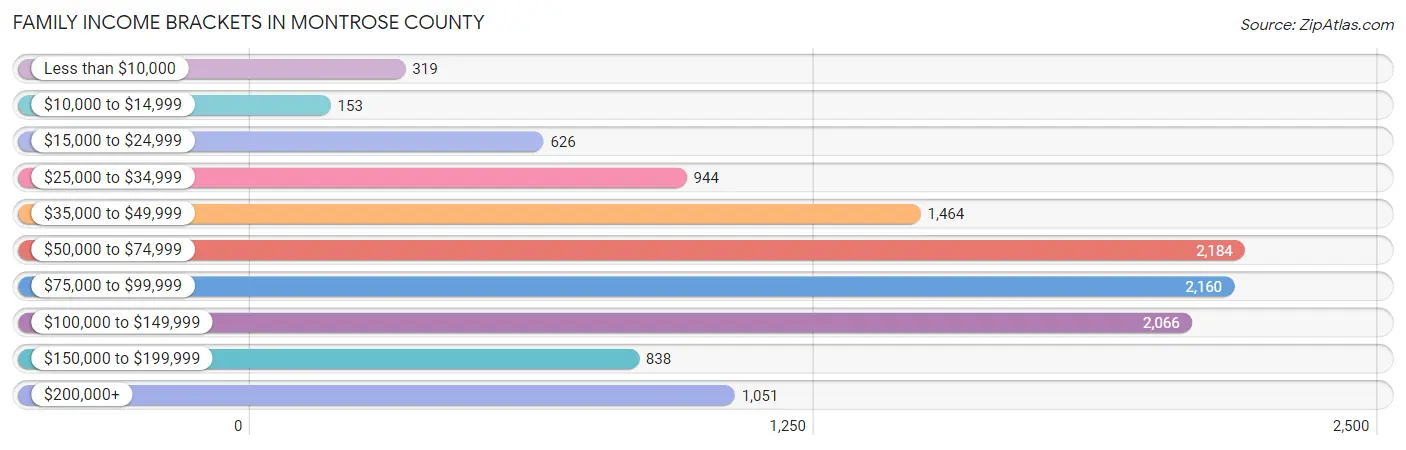
| Income Bracket | # Families | % Families |
| Less than $10,000 | 319 | 2.7% |
| $10,000 to $14,999 | 153 | 1.3% |
| $15,000 to $24,999 | 626 | 5.3% |
| $25,000 to $34,999 | 944 | 8.0% |
| $35,000 to $49,999 | 1,464 | 12.4% |
| $50,000 to $74,999 | 2,184 | 18.5% |
| $75,000 to $99,999 | 2,160 | 18.3% |
| $100,000 to $149,999 | 2,066 | 17.5% |
| $150,000 to $199,999 | 838 | 7.1% |
| $200,000+ | 1,051 | 8.9% |
Family Income by Famaliy Size in Montrose County
7+ person families (60 | 0.5%) account for the highest median family income in Montrose County with $175,313 per family, while 2-person families (6,984 | 59.2%) have the highest median income of $33,890 per family member.
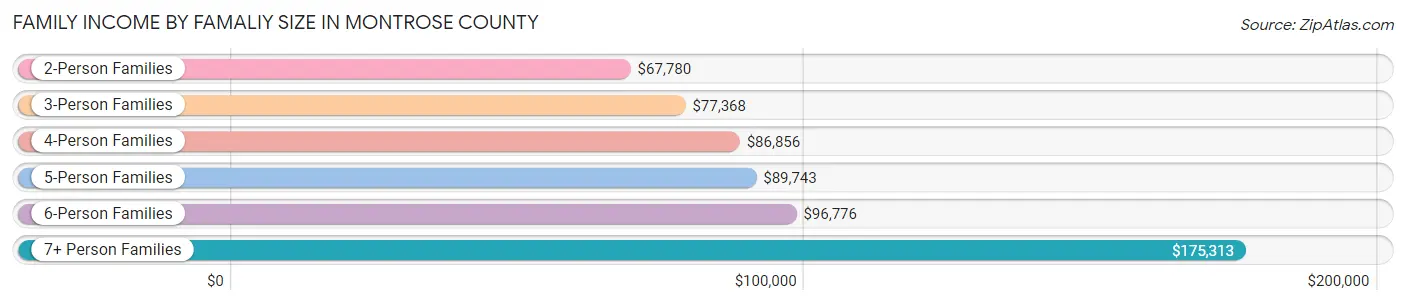
| Income Bracket | # Families | Median Income |
| 2-Person Families | 6,984 (59.2%) | $67,780 |
| 3-Person Families | 1,902 (16.1%) | $77,368 |
| 4-Person Families | 1,633 (13.8%) | $86,856 |
| 5-Person Families | 959 (8.1%) | $89,743 |
| 6-Person Families | 268 (2.3%) | $96,776 |
| 7+ Person Families | 60 (0.5%) | $175,313 |
| Total | 11,806 (100.0%) | $78,074 |
Family Income by Number of Earners in Montrose County
The median family income in Montrose County is $78,074, with families comprising 3+ earners (1,114) having the highest median family income of $134,286, while families with no earners (2,574) have the lowest median family income of $47,721, accounting for 9.4% and 21.8% of families, respectively.
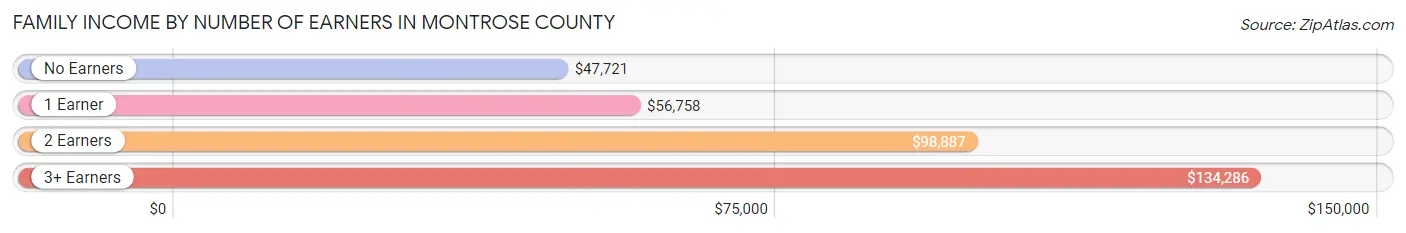
| Number of Earners | # Families | Median Income |
| No Earners | 2,574 (21.8%) | $47,721 |
| 1 Earner | 4,295 (36.4%) | $56,758 |
| 2 Earners | 3,823 (32.4%) | $98,887 |
| 3+ Earners | 1,114 (9.4%) | $134,286 |
| Total | 11,806 (100.0%) | $78,074 |
Household Income in Montrose County
Household Income Brackets in Montrose County
With 2,948 households falling in the category, the $50,000 to $74,999 income range is the most frequent in Montrose County, accounting for 17.3% of all households. In contrast, only 631 households (3.7%) fall into the $10,000 to $14,999 income bracket, making it the least populous group.
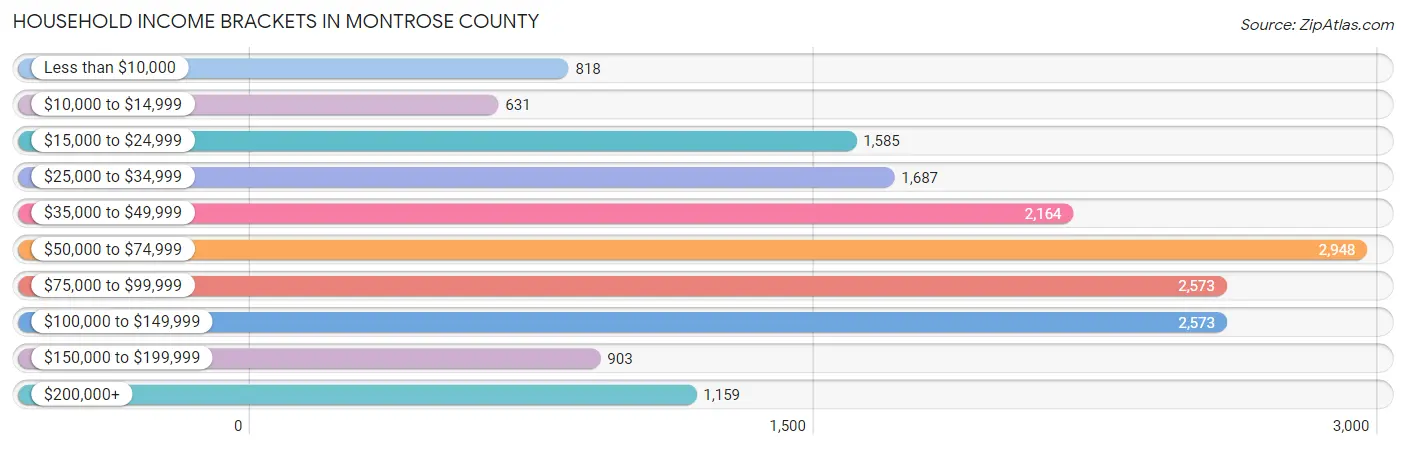
| Income Bracket | # Households | % Households |
| Less than $10,000 | 818 | 4.8% |
| $10,000 to $14,999 | 631 | 3.7% |
| $15,000 to $24,999 | 1,585 | 9.3% |
| $25,000 to $34,999 | 1,687 | 9.9% |
| $35,000 to $49,999 | 2,164 | 12.7% |
| $50,000 to $74,999 | 2,948 | 17.3% |
| $75,000 to $99,999 | 2,573 | 15.1% |
| $100,000 to $149,999 | 2,573 | 15.1% |
| $150,000 to $199,999 | 903 | 5.3% |
| $200,000+ | 1,159 | 6.8% |
Household Income by Householder Age in Montrose County
The median household income in Montrose County is $62,817, with the highest median household income of $80,039 found in the 25 to 44 years age bracket for the primary householder. A total of 4,020 households (23.6%) fall into this category. Meanwhile, the 15 to 24 years age bracket for the primary householder has the lowest median household income of $42,841, with 486 households (2.9%) in this group.
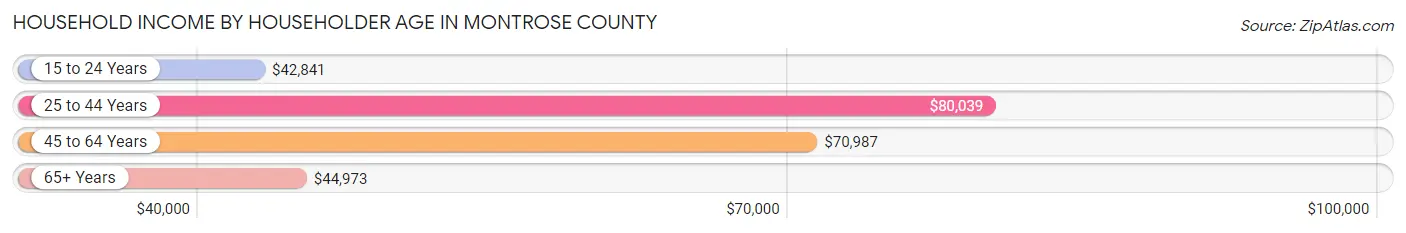
| Income Bracket | # Households | Median Income |
| 15 to 24 Years | 486 (2.9%) | $42,841 |
| 25 to 44 Years | 4,020 (23.6%) | $80,039 |
| 45 to 64 Years | 5,901 (34.6%) | $70,987 |
| 65+ Years | 6,635 (38.9%) | $44,973 |
| Total | 17,042 (100.0%) | $62,817 |
Poverty in Montrose County
Income Below Poverty by Sex and Age in Montrose County
With 10.1% poverty level for males and 13.1% for females among the residents of Montrose County, 12 to 14 year old males and 45 to 54 year old females are the most vulnerable to poverty, with 166 males (20.9%) and 466 females (19.6%) in their respective age groups living below the poverty level.
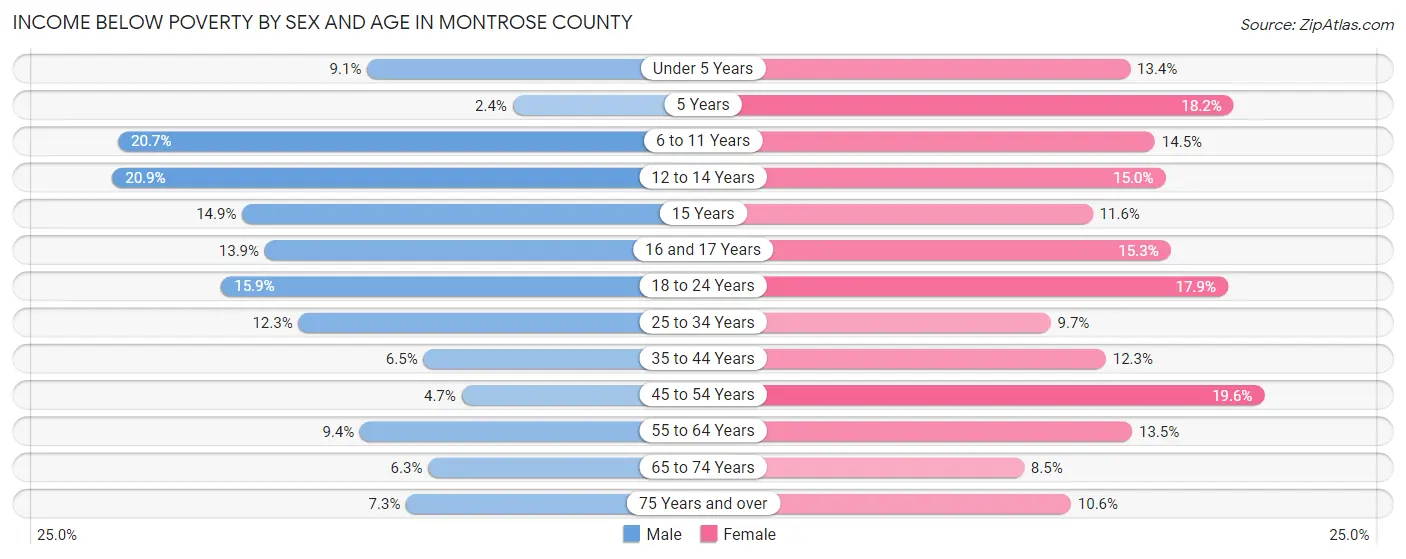
| Age Bracket | Male | Female |
| Under 5 Years | 94 (9.1%) | 127 (13.4%) |
| 5 Years | 6 (2.4%) | 64 (18.2%) |
| 6 to 11 Years | 336 (20.7%) | 200 (14.5%) |
| 12 to 14 Years | 166 (20.9%) | 112 (15.0%) |
| 15 Years | 38 (14.9%) | 22 (11.6%) |
| 16 and 17 Years | 105 (13.9%) | 54 (15.2%) |
| 18 to 24 Years | 247 (15.9%) | 259 (17.9%) |
| 25 to 34 Years | 267 (12.3%) | 202 (9.7%) |
| 35 to 44 Years | 157 (6.5%) | 308 (12.2%) |
| 45 to 54 Years | 118 (4.7%) | 466 (19.6%) |
| 55 to 64 Years | 280 (9.4%) | 423 (13.5%) |
| 65 to 74 Years | 187 (6.3%) | 267 (8.5%) |
| 75 Years and over | 139 (7.3%) | 260 (10.6%) |
| Total | 2,140 (10.1%) | 2,764 (13.1%) |
Income Above Poverty by Sex and Age in Montrose County
According to the poverty statistics in Montrose County, males aged 5 years and females aged 65 to 74 years are the age groups that are most secure financially, with 97.7% of males and 91.5% of females in these age groups living above the poverty line.
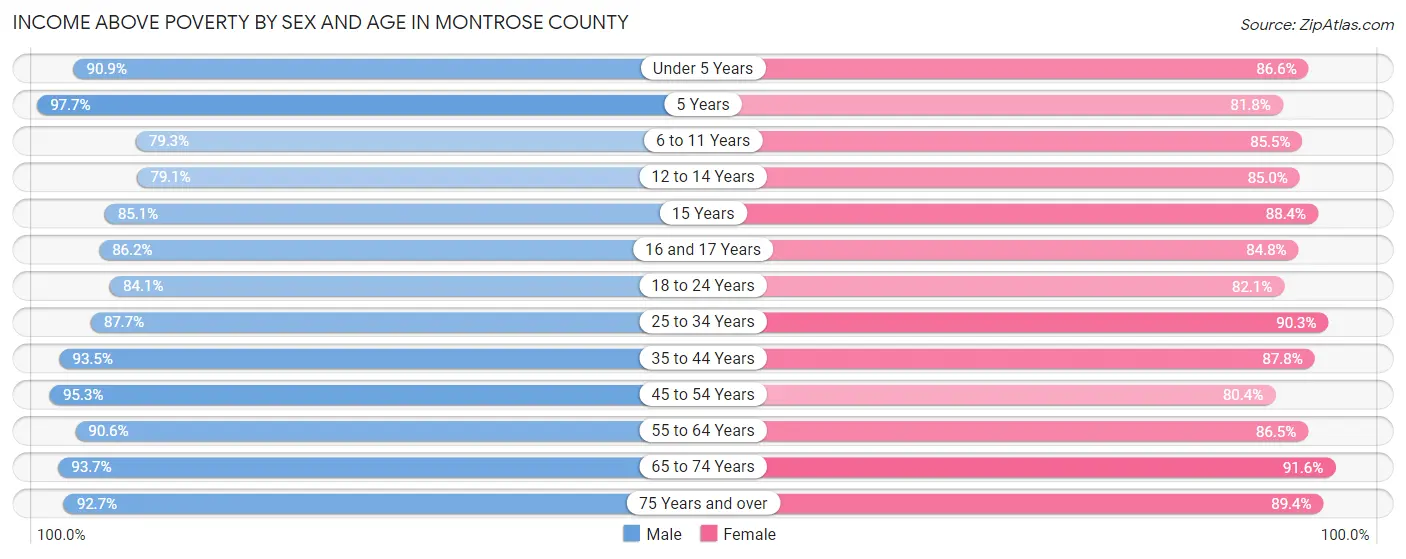
| Age Bracket | Male | Female |
| Under 5 Years | 939 (90.9%) | 822 (86.6%) |
| 5 Years | 249 (97.7%) | 288 (81.8%) |
| 6 to 11 Years | 1,290 (79.3%) | 1,176 (85.5%) |
| 12 to 14 Years | 627 (79.1%) | 634 (85.0%) |
| 15 Years | 217 (85.1%) | 167 (88.4%) |
| 16 and 17 Years | 653 (86.2%) | 300 (84.8%) |
| 18 to 24 Years | 1,309 (84.1%) | 1,187 (82.1%) |
| 25 to 34 Years | 1,905 (87.7%) | 1,882 (90.3%) |
| 35 to 44 Years | 2,263 (93.5%) | 2,207 (87.7%) |
| 45 to 54 Years | 2,380 (95.3%) | 1,911 (80.4%) |
| 55 to 64 Years | 2,689 (90.6%) | 2,718 (86.5%) |
| 65 to 74 Years | 2,796 (93.7%) | 2,892 (91.5%) |
| 75 Years and over | 1,768 (92.7%) | 2,187 (89.4%) |
| Total | 19,085 (89.9%) | 18,371 (86.9%) |
Income Below Poverty Among Married-Couple Families in Montrose County
The poverty statistics for married-couple families in Montrose County show that 6.2% or 579 of the total 9,274 families live below the poverty line. Families with 3 or 4 children have the highest poverty rate of 14.0%, comprising of 124 families. On the other hand, families with 5 or more children have the lowest poverty rate of 0.0%, which includes 0 families.
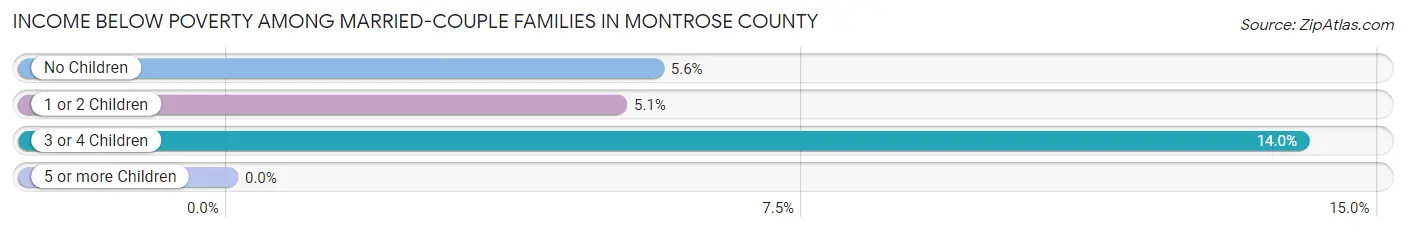
| Children | Above Poverty | Below Poverty |
| No Children | 5,845 (94.4%) | 344 (5.6%) |
| 1 or 2 Children | 2,073 (94.9%) | 111 (5.1%) |
| 3 or 4 Children | 763 (86.0%) | 124 (14.0%) |
| 5 or more Children | 14 (100.0%) | 0 (0.0%) |
| Total | 8,695 (93.8%) | 579 (6.2%) |
Income Below Poverty Among Single-Parent Households in Montrose County
According to the poverty data in Montrose County, 4.8% or 41 single-father households and 18.0% or 302 single-mother households are living below the poverty line. Among single-father households, those with 1 or 2 children have the highest poverty rate, with 27 households (7.4%) experiencing poverty. Likewise, among single-mother households, those with 5 or more children have the highest poverty rate, with 19 households (100.0%) falling below the poverty line.
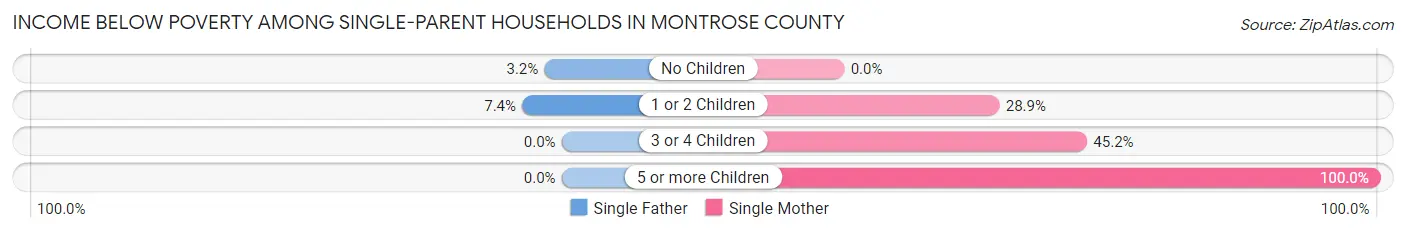
| Children | Single Father | Single Mother |
| No Children | 14 (3.2%) | 0 (0.0%) |
| 1 or 2 Children | 27 (7.4%) | 217 (28.9%) |
| 3 or 4 Children | 0 (0.0%) | 66 (45.2%) |
| 5 or more Children | 0 (0.0%) | 19 (100.0%) |
| Total | 41 (4.8%) | 302 (18.0%) |
Income Below Poverty Among Married-Couple vs Single-Parent Households in Montrose County
The poverty data for Montrose County shows that 579 of the married-couple family households (6.2%) and 343 of the single-parent households (13.6%) are living below the poverty level. Within the married-couple family households, those with 3 or 4 children have the highest poverty rate, with 124 households (14.0%) falling below the poverty line. Among the single-parent households, those with 5 or more children have the highest poverty rate, with 19 household (100.0%) living below poverty.
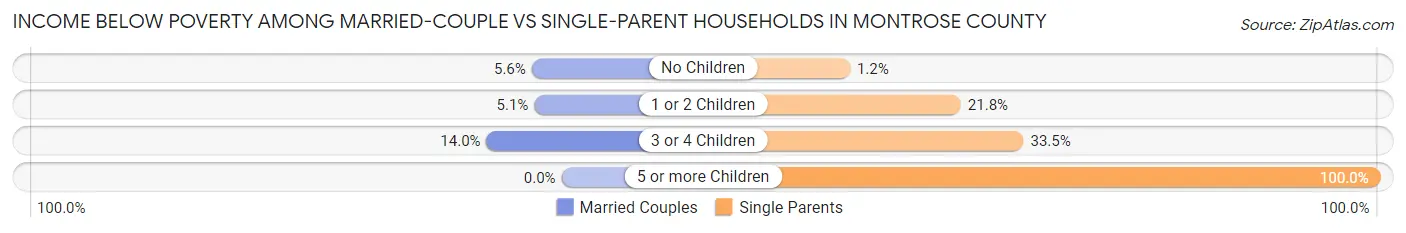
| Children | Married-Couple Families | Single-Parent Households |
| No Children | 344 (5.6%) | 14 (1.2%) |
| 1 or 2 Children | 111 (5.1%) | 244 (21.8%) |
| 3 or 4 Children | 124 (14.0%) | 66 (33.5%) |
| 5 or more Children | 0 (0.0%) | 19 (100.0%) |
| Total | 579 (6.2%) | 343 (13.6%) |
Employment Characteristics in Montrose County
Employment by Class of Employer in Montrose County
Among the 18,297 employed individuals in Montrose County, private company employees (11,131 | 60.8%), self-employed (not incorporated) (2,241 | 12.2%), and not-for-profit organizations (1,668 | 9.1%) make up the most common classes of employment.
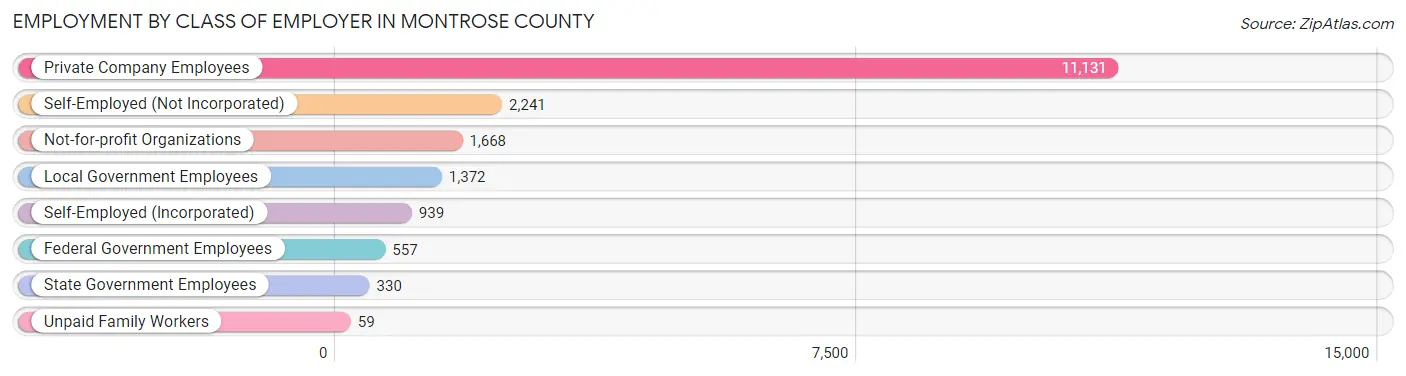
| Employer Class | # Employees | % Employees |
| Private Company Employees | 11,131 | 60.8% |
| Self-Employed (Incorporated) | 939 | 5.1% |
| Self-Employed (Not Incorporated) | 2,241 | 12.2% |
| Not-for-profit Organizations | 1,668 | 9.1% |
| Local Government Employees | 1,372 | 7.5% |
| State Government Employees | 330 | 1.8% |
| Federal Government Employees | 557 | 3.0% |
| Unpaid Family Workers | 59 | 0.3% |
| Total | 18,297 | 100.0% |
Employment Status by Age in Montrose County
According to the labor force statistics for Montrose County, out of the total population over 16 years of age (35,126), 55.5% or 19,495 individuals are in the labor force, with 4.3% or 838 of them unemployed. The age group with the highest labor force participation rate is 25 to 29 years, with 85.0% or 1,751 individuals in the labor force. Within the labor force, the 35 to 44 years age range has the highest percentage of unemployed individuals, with 9.3% or 377 of them being unemployed.
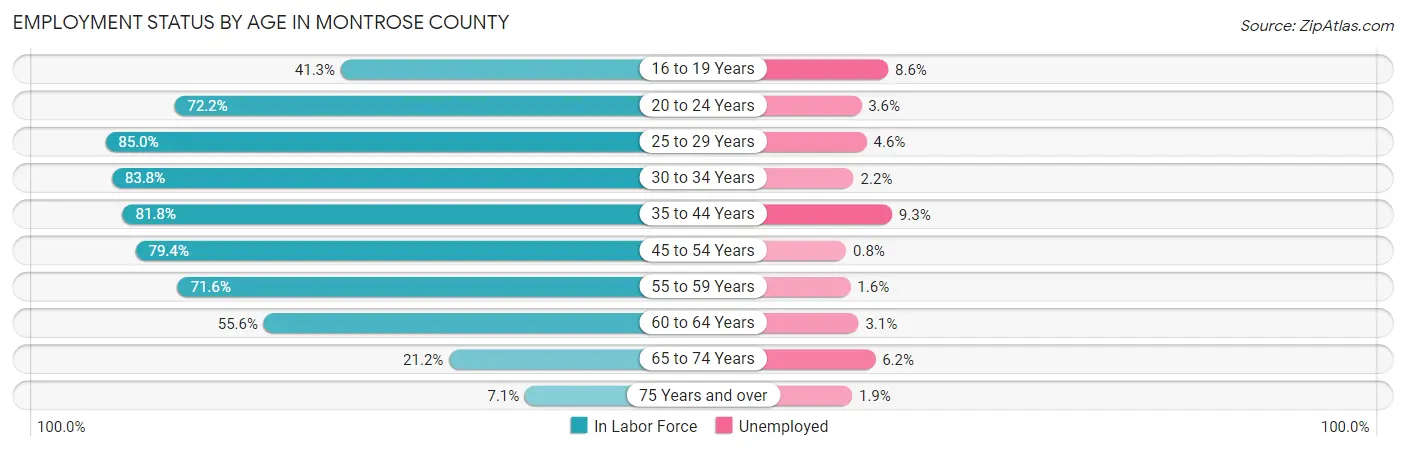
| Age Bracket | In Labor Force | Unemployed |
| 16 to 19 Years | 824 (41.3%) | 71 (8.6%) |
| 20 to 24 Years | 1,536 (72.2%) | 55 (3.6%) |
| 25 to 29 Years | 1,751 (85.0%) | 81 (4.6%) |
| 30 to 34 Years | 1,869 (83.8%) | 41 (2.2%) |
| 35 to 44 Years | 4,058 (81.8%) | 377 (9.3%) |
| 45 to 54 Years | 3,889 (79.4%) | 31 (0.8%) |
| 55 to 59 Years | 2,167 (71.6%) | 35 (1.6%) |
| 60 to 64 Years | 1,761 (55.6%) | 55 (3.1%) |
| 65 to 74 Years | 1,309 (21.2%) | 81 (6.2%) |
| 75 Years and over | 319 (7.1%) | 6 (1.9%) |
| Total | 19,495 (55.5%) | 838 (4.3%) |
Employment Status by Educational Attainment in Montrose County
According to labor force statistics for Montrose County, 76.2% of individuals (15,501) out of the total population between 25 and 64 years of age (20,342) are in the labor force, with 4.0% or 620 of them being unemployed. The group with the highest labor force participation rate are those with the educational attainment of bachelor's degree or higher, with 81.4% or 4,280 individuals in the labor force. Within the labor force, individuals with less than high school education have the highest percentage of unemployment, with 7.8% or 105 of them being unemployed.
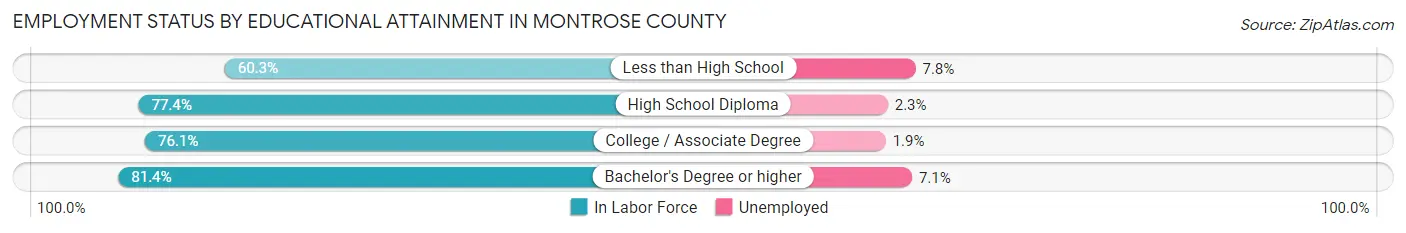
| Educational Attainment | In Labor Force | Unemployed |
| Less than High School | 1,346 (60.3%) | 174 (7.8%) |
| High School Diploma | 5,526 (77.4%) | 164 (2.3%) |
| College / Associate Degree | 4,348 (76.1%) | 109 (1.9%) |
| Bachelor's Degree or higher | 4,280 (81.4%) | 373 (7.1%) |
| Total | 15,501 (76.2%) | 814 (4.0%) |
Employment Occupations by Sex in Montrose County
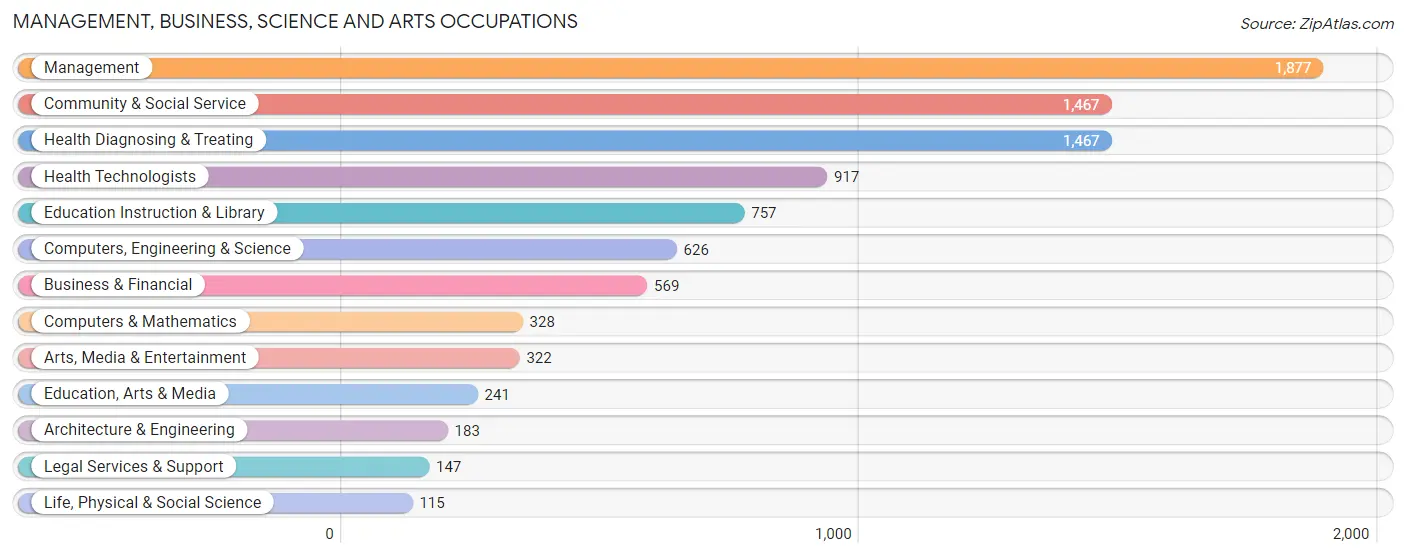
Management, Business, Science and Arts Occupations
The most common Management, Business, Science and Arts occupations in Montrose County are Management (1,877 | 10.1%), Community & Social Service (1,467 | 7.9%), Health Diagnosing & Treating (1,467 | 7.9%), Health Technologists (917 | 4.9%), and Education Instruction & Library (757 | 4.1%).
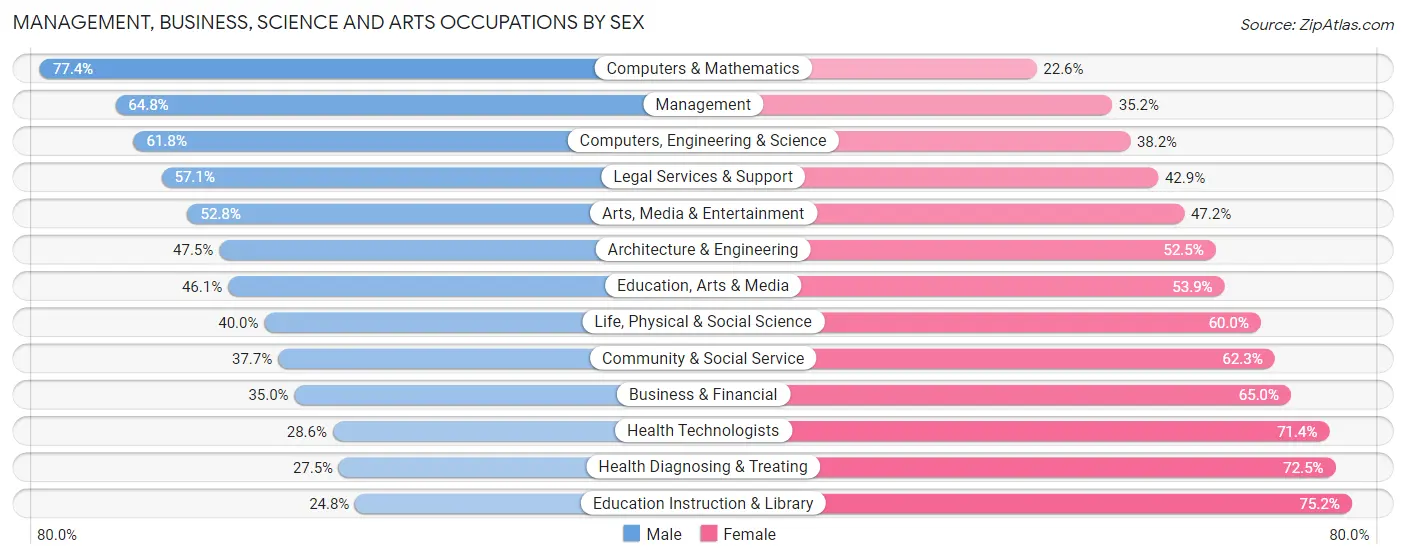
Management, Business, Science and Arts Occupations by Sex
Within the Management, Business, Science and Arts occupations in Montrose County, the most male-oriented occupations are Computers & Mathematics (77.4%), Management (64.8%), and Computers, Engineering & Science (61.8%), while the most female-oriented occupations are Education Instruction & Library (75.2%), Health Diagnosing & Treating (72.5%), and Health Technologists (71.4%).
| Occupation | Male | Female |
| Management | 1,217 (64.8%) | 660 (35.2%) |
| Business & Financial | 199 (35.0%) | 370 (65.0%) |
| Computers, Engineering & Science | 387 (61.8%) | 239 (38.2%) |
| Computers & Mathematics | 254 (77.4%) | 74 (22.6%) |
| Architecture & Engineering | 87 (47.5%) | 96 (52.5%) |
| Life, Physical & Social Science | 46 (40.0%) | 69 (60.0%) |
| Community & Social Service | 553 (37.7%) | 914 (62.3%) |
| Education, Arts & Media | 111 (46.1%) | 130 (53.9%) |
| Legal Services & Support | 84 (57.1%) | 63 (42.9%) |
| Education Instruction & Library | 188 (24.8%) | 569 (75.2%) |
| Arts, Media & Entertainment | 170 (52.8%) | 152 (47.2%) |
| Health Diagnosing & Treating | 404 (27.5%) | 1,063 (72.5%) |
| Health Technologists | 262 (28.6%) | 655 (71.4%) |
| Total (Category) | 2,760 (46.0%) | 3,246 (54.0%) |
| Total (Overall) | 10,349 (55.7%) | 8,226 (44.3%) |
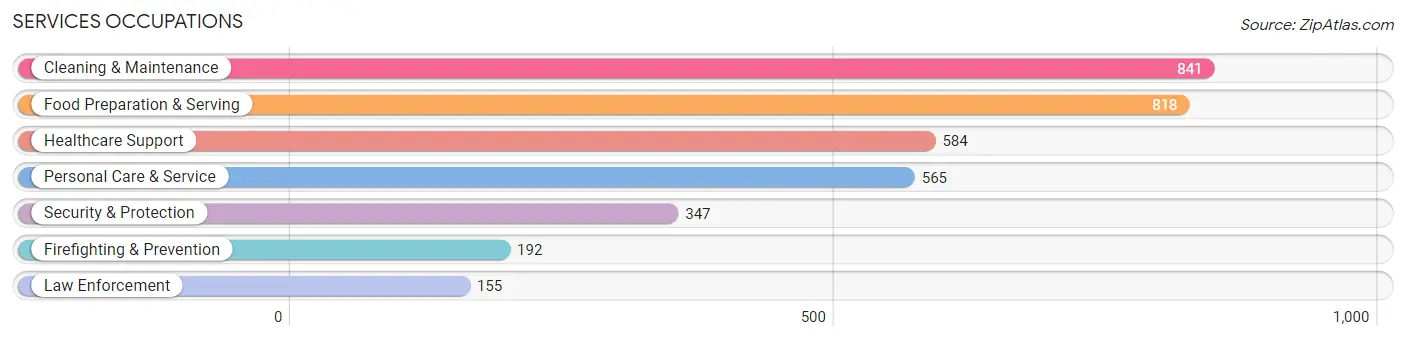
Services Occupations
The most common Services occupations in Montrose County are Cleaning & Maintenance (841 | 4.5%), Food Preparation & Serving (818 | 4.4%), Healthcare Support (584 | 3.1%), Personal Care & Service (565 | 3.0%), and Security & Protection (347 | 1.9%).
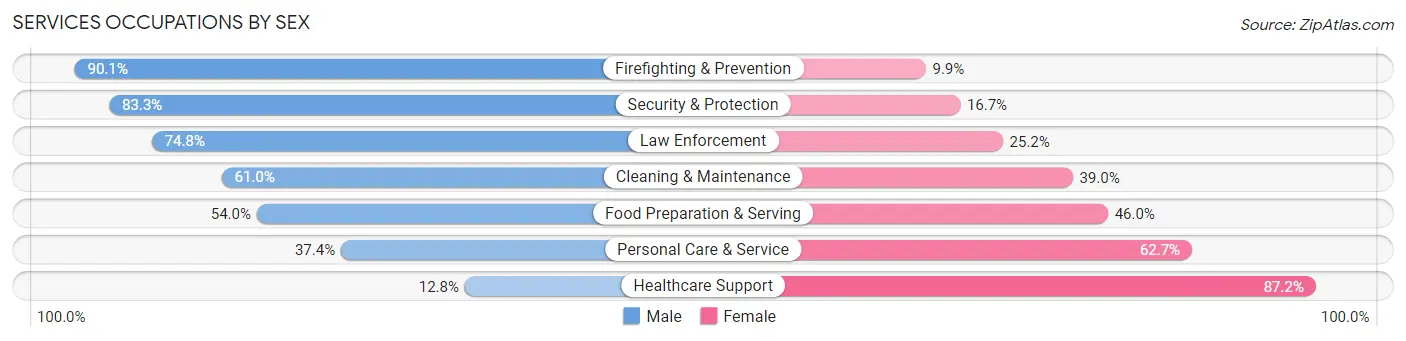
Services Occupations by Sex
Within the Services occupations in Montrose County, the most male-oriented occupations are Firefighting & Prevention (90.1%), Security & Protection (83.3%), and Law Enforcement (74.8%), while the most female-oriented occupations are Healthcare Support (87.2%), Personal Care & Service (62.6%), and Food Preparation & Serving (46.0%).
| Occupation | Male | Female |
| Healthcare Support | 75 (12.8%) | 509 (87.2%) |
| Security & Protection | 289 (83.3%) | 58 (16.7%) |
| Firefighting & Prevention | 173 (90.1%) | 19 (9.9%) |
| Law Enforcement | 116 (74.8%) | 39 (25.2%) |
| Food Preparation & Serving | 442 (54.0%) | 376 (46.0%) |
| Cleaning & Maintenance | 513 (61.0%) | 328 (39.0%) |
| Personal Care & Service | 211 (37.3%) | 354 (62.6%) |
| Total (Category) | 1,530 (48.5%) | 1,625 (51.5%) |
| Total (Overall) | 10,349 (55.7%) | 8,226 (44.3%) |
Sales and Office Occupations
The most common Sales and Office occupations in Montrose County are Office & Administration (2,183 | 11.7%), and Sales & Related (1,901 | 10.2%).
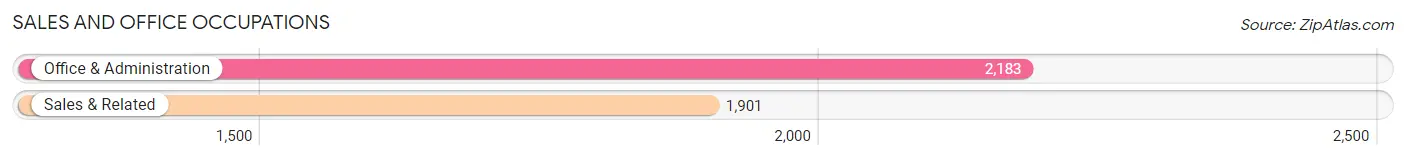
Sales and Office Occupations by Sex

| Occupation | Male | Female |
| Sales & Related | 929 (48.9%) | 972 (51.1%) |
| Office & Administration | 398 (18.2%) | 1,785 (81.8%) |
| Total (Category) | 1,327 (32.5%) | 2,757 (67.5%) |
| Total (Overall) | 10,349 (55.7%) | 8,226 (44.3%) |
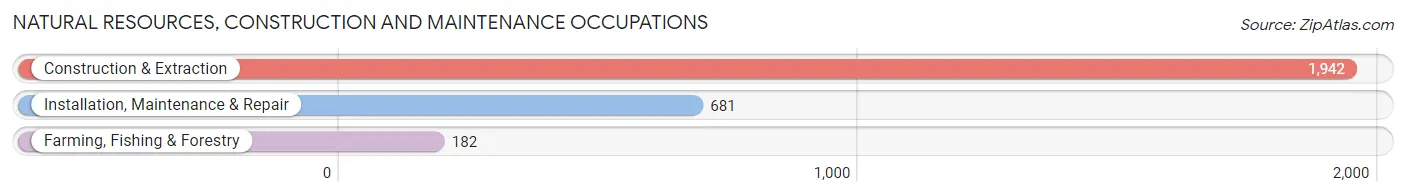
Natural Resources, Construction and Maintenance Occupations
The most common Natural Resources, Construction and Maintenance occupations in Montrose County are Construction & Extraction (1,942 | 10.4%), Installation, Maintenance & Repair (681 | 3.7%), and Farming, Fishing & Forestry (182 | 1.0%).
Natural Resources, Construction and Maintenance Occupations by Sex
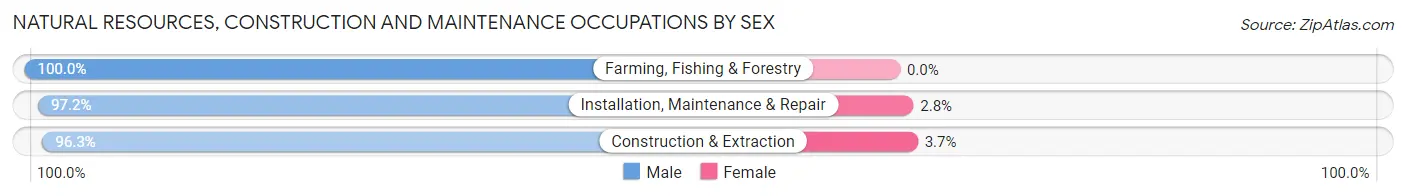
| Occupation | Male | Female |
| Farming, Fishing & Forestry | 182 (100.0%) | 0 (0.0%) |
| Construction & Extraction | 1,870 (96.3%) | 72 (3.7%) |
| Installation, Maintenance & Repair | 662 (97.2%) | 19 (2.8%) |
| Total (Category) | 2,714 (96.8%) | 91 (3.2%) |
| Total (Overall) | 10,349 (55.7%) | 8,226 (44.3%) |
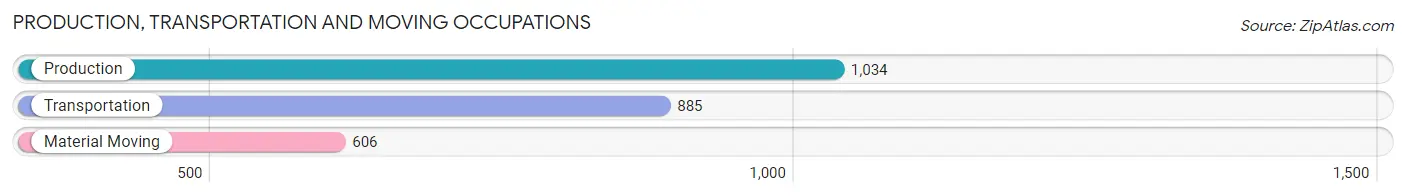
Production, Transportation and Moving Occupations
The most common Production, Transportation and Moving occupations in Montrose County are Production (1,034 | 5.6%), Transportation (885 | 4.8%), and Material Moving (606 | 3.3%).
Production, Transportation and Moving Occupations by Sex
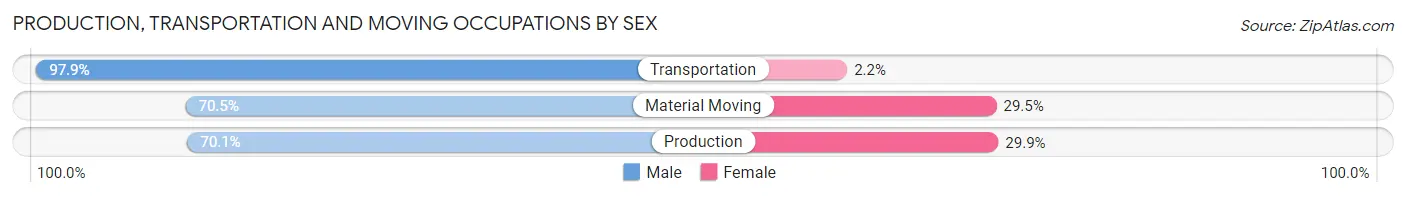
| Occupation | Male | Female |
| Production | 725 (70.1%) | 309 (29.9%) |
| Transportation | 866 (97.9%) | 19 (2.1%) |
| Material Moving | 427 (70.5%) | 179 (29.5%) |
| Total (Category) | 2,018 (79.9%) | 507 (20.1%) |
| Total (Overall) | 10,349 (55.7%) | 8,226 (44.3%) |
Employment Industries by Sex in Montrose County
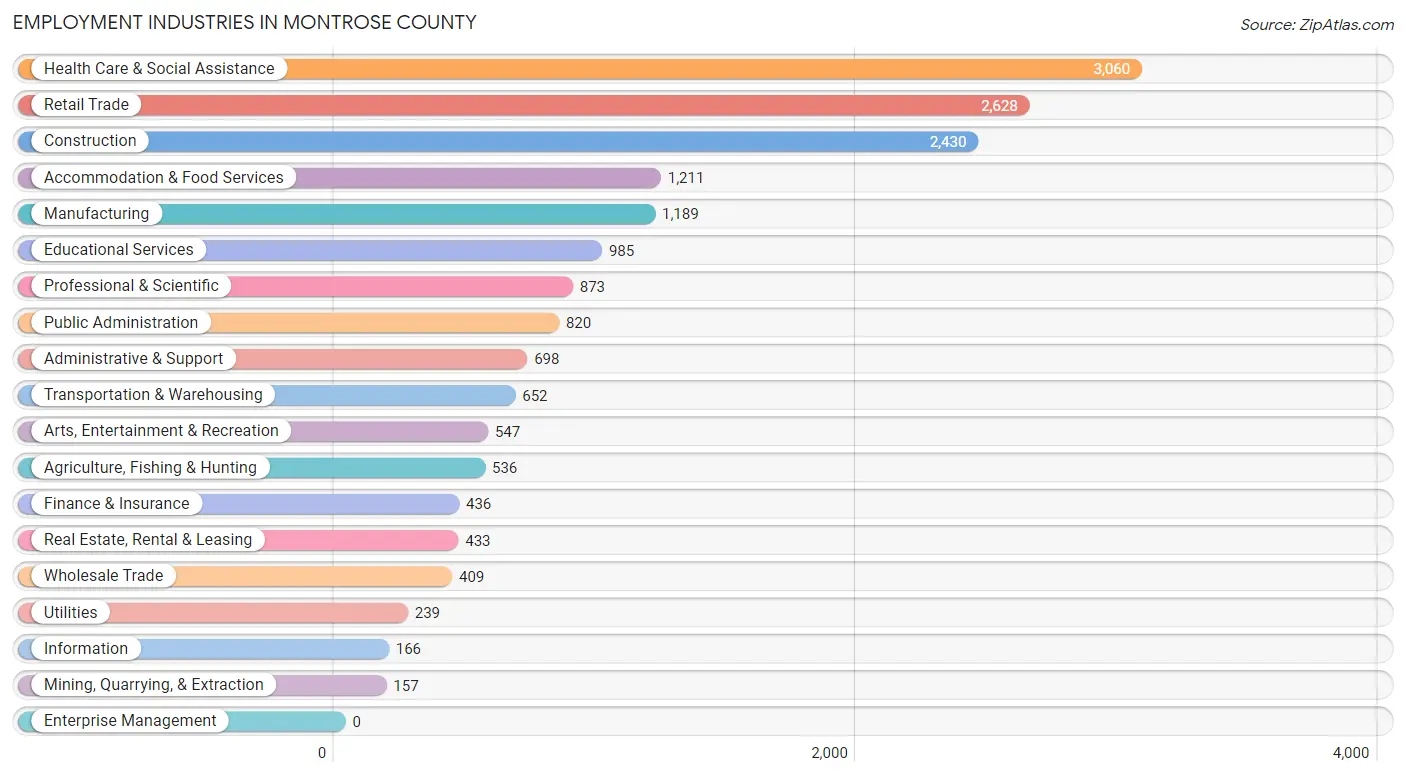
Employment Industries in Montrose County
The major employment industries in Montrose County include Health Care & Social Assistance (3,060 | 16.5%), Retail Trade (2,628 | 14.1%), Construction (2,430 | 13.1%), Accommodation & Food Services (1,211 | 6.5%), and Manufacturing (1,189 | 6.4%).
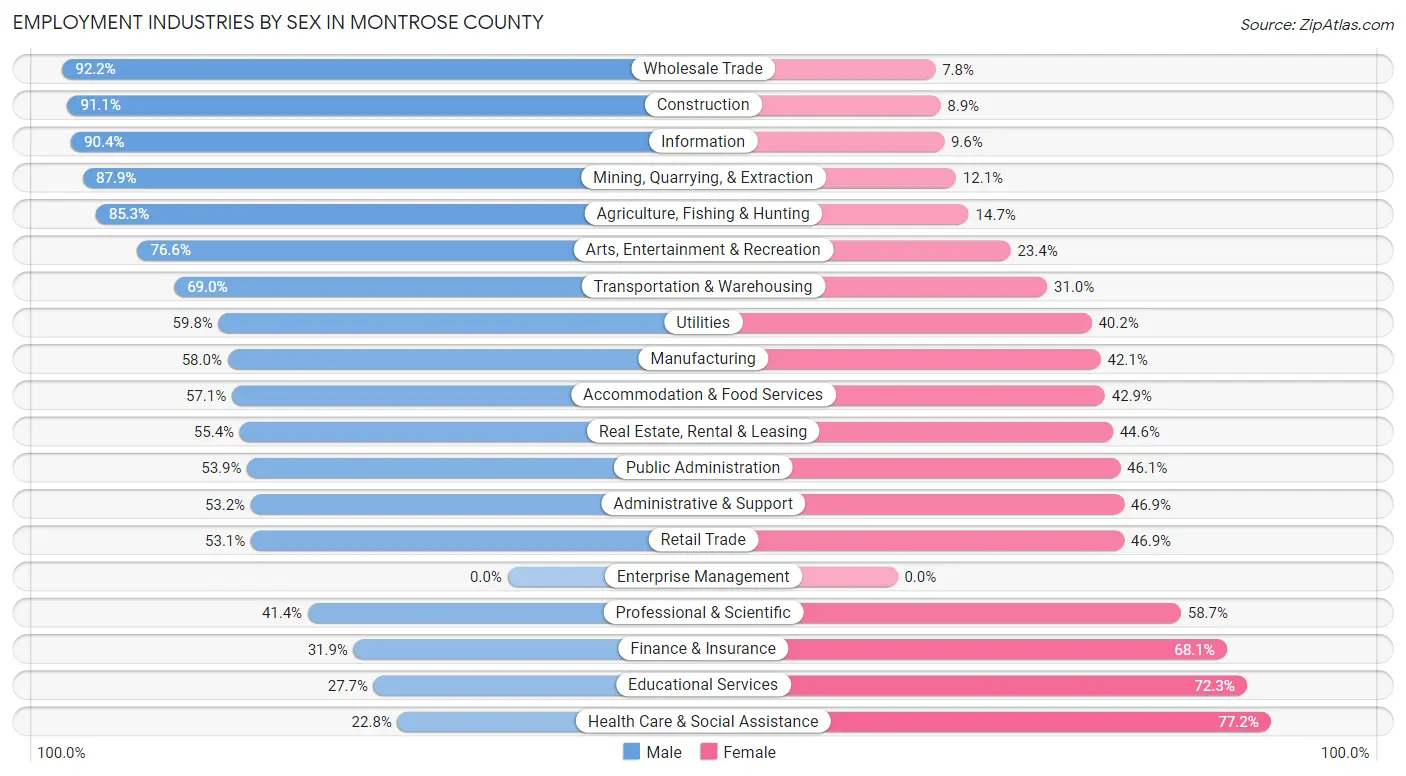
Employment Industries by Sex in Montrose County
The Montrose County industries that see more men than women are Wholesale Trade (92.2%), Construction (91.1%), and Information (90.4%), whereas the industries that tend to have a higher number of women are Health Care & Social Assistance (77.2%), Educational Services (72.3%), and Finance & Insurance (68.1%).
| Industry | Male | Female |
| Agriculture, Fishing & Hunting | 457 (85.3%) | 79 (14.7%) |
| Mining, Quarrying, & Extraction | 138 (87.9%) | 19 (12.1%) |
| Construction | 2,214 (91.1%) | 216 (8.9%) |
| Manufacturing | 689 (58.0%) | 500 (42.0%) |
| Wholesale Trade | 377 (92.2%) | 32 (7.8%) |
| Retail Trade | 1,396 (53.1%) | 1,232 (46.9%) |
| Transportation & Warehousing | 450 (69.0%) | 202 (31.0%) |
| Utilities | 143 (59.8%) | 96 (40.2%) |
| Information | 150 (90.4%) | 16 (9.6%) |
| Finance & Insurance | 139 (31.9%) | 297 (68.1%) |
| Real Estate, Rental & Leasing | 240 (55.4%) | 193 (44.6%) |
| Professional & Scientific | 361 (41.3%) | 512 (58.7%) |
| Enterprise Management | 0 (0.0%) | 0 (0.0%) |
| Administrative & Support | 371 (53.1%) | 327 (46.9%) |
| Educational Services | 273 (27.7%) | 712 (72.3%) |
| Health Care & Social Assistance | 697 (22.8%) | 2,363 (77.2%) |
| Arts, Entertainment & Recreation | 419 (76.6%) | 128 (23.4%) |
| Accommodation & Food Services | 691 (57.1%) | 520 (42.9%) |
| Public Administration | 442 (53.9%) | 378 (46.1%) |
| Total | 10,349 (55.7%) | 8,226 (44.3%) |
Education in Montrose County
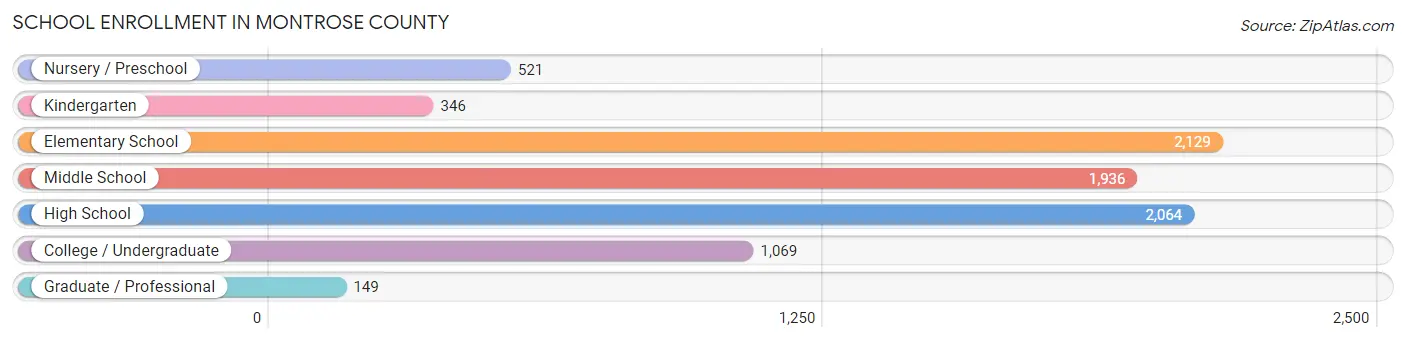
School Enrollment in Montrose County
The most common levels of schooling among the 8,214 students in Montrose County are elementary school (2,129 | 25.9%), high school (2,064 | 25.1%), and middle school (1,936 | 23.6%).
| School Level | # Students | % Students |
| Nursery / Preschool | 521 | 6.3% |
| Kindergarten | 346 | 4.2% |
| Elementary School | 2,129 | 25.9% |
| Middle School | 1,936 | 23.6% |
| High School | 2,064 | 25.1% |
| College / Undergraduate | 1,069 | 13.0% |
| Graduate / Professional | 149 | 1.8% |
| Total | 8,214 | 100.0% |
School Enrollment by Age by Funding Source in Montrose County
Out of a total of 8,214 students who are enrolled in schools in Montrose County, 1,043 (12.7%) attend a private institution, while the remaining 7,171 (87.3%) are enrolled in public schools. The age group of 35 years and over has the highest likelihood of being enrolled in private schools, with 97 (36.1% in the age bracket) enrolled. Conversely, the age group of 15 to 17 year olds has the lowest likelihood of being enrolled in a private school, with 1,385 (94.0% in the age bracket) attending a public institution.
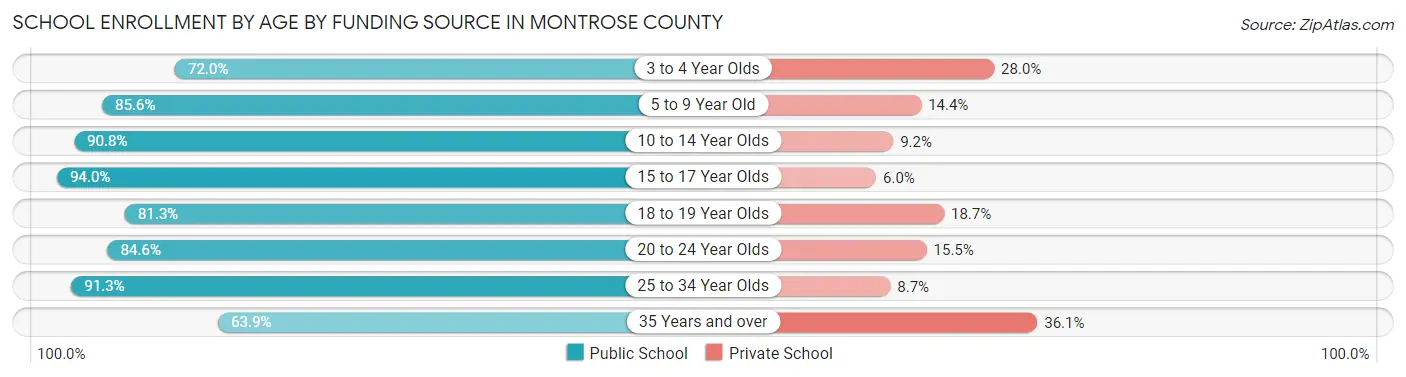
| Age Bracket | Public School | Private School |
| 3 to 4 Year Olds | 208 (72.0%) | 81 (28.0%) |
| 5 to 9 Year Old | 1,784 (85.6%) | 301 (14.4%) |
| 10 to 14 Year Olds | 2,440 (90.8%) | 248 (9.2%) |
| 15 to 17 Year Olds | 1,385 (94.0%) | 89 (6.0%) |
| 18 to 19 Year Olds | 496 (81.3%) | 114 (18.7%) |
| 20 to 24 Year Olds | 520 (84.6%) | 95 (15.4%) |
| 25 to 34 Year Olds | 168 (91.3%) | 16 (8.7%) |
| 35 Years and over | 172 (63.9%) | 97 (36.1%) |
| Total | 7,171 (87.3%) | 1,043 (12.7%) |
Educational Attainment by Field of Study in Montrose County
Business (1,475 | 16.1%), education (1,409 | 15.4%), bio, nature & agricultural (931 | 10.2%), science & technology (739 | 8.1%), and arts & humanities (730 | 8.0%) are the most common fields of study among 9,176 individuals in Montrose County who have obtained a bachelor's degree or higher.
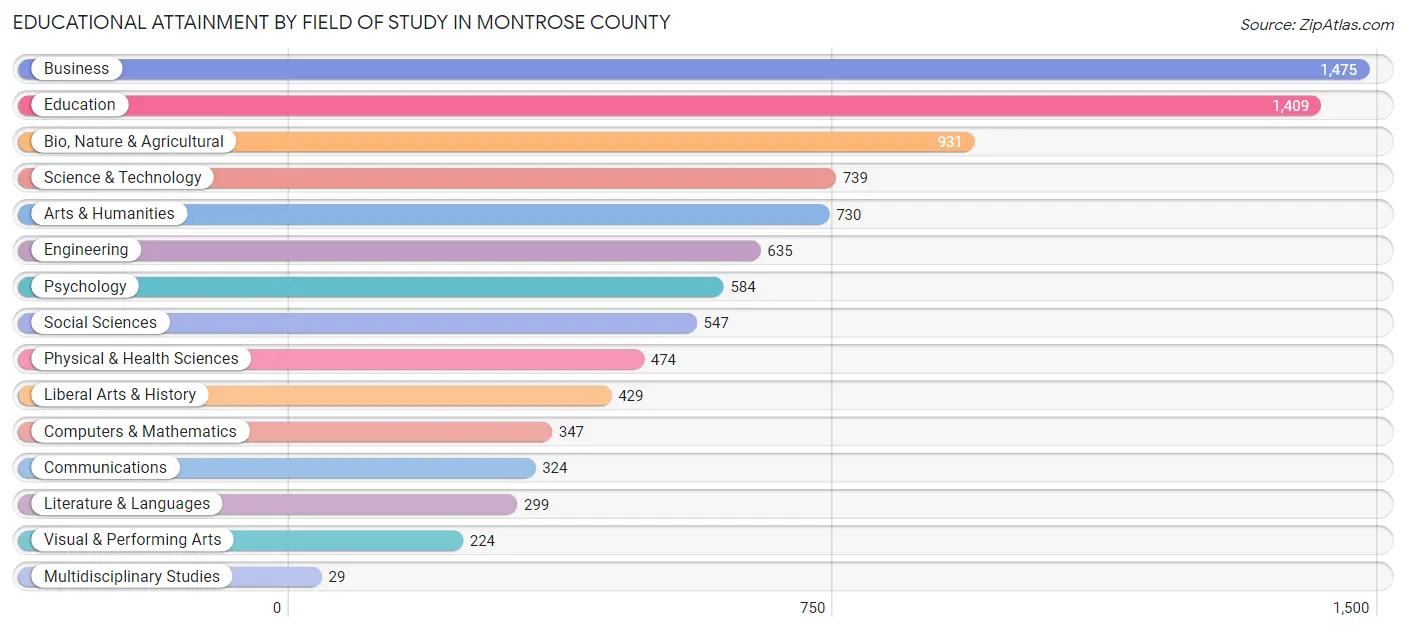
| Field of Study | # Graduates | % Graduates |
| Computers & Mathematics | 347 | 3.8% |
| Bio, Nature & Agricultural | 931 | 10.2% |
| Physical & Health Sciences | 474 | 5.2% |
| Psychology | 584 | 6.4% |
| Social Sciences | 547 | 6.0% |
| Engineering | 635 | 6.9% |
| Multidisciplinary Studies | 29 | 0.3% |
| Science & Technology | 739 | 8.1% |
| Business | 1,475 | 16.1% |
| Education | 1,409 | 15.4% |
| Literature & Languages | 299 | 3.3% |
| Liberal Arts & History | 429 | 4.7% |
| Visual & Performing Arts | 224 | 2.4% |
| Communications | 324 | 3.5% |
| Arts & Humanities | 730 | 8.0% |
| Total | 9,176 | 100.0% |
Transportation & Commute in Montrose County
Vehicle Availability by Sex in Montrose County
The most prevalent vehicle ownership categories in Montrose County are males with 2 vehicles (4,502, accounting for 44.2%) and females with 2 vehicles (3,607, making up 56.4%).
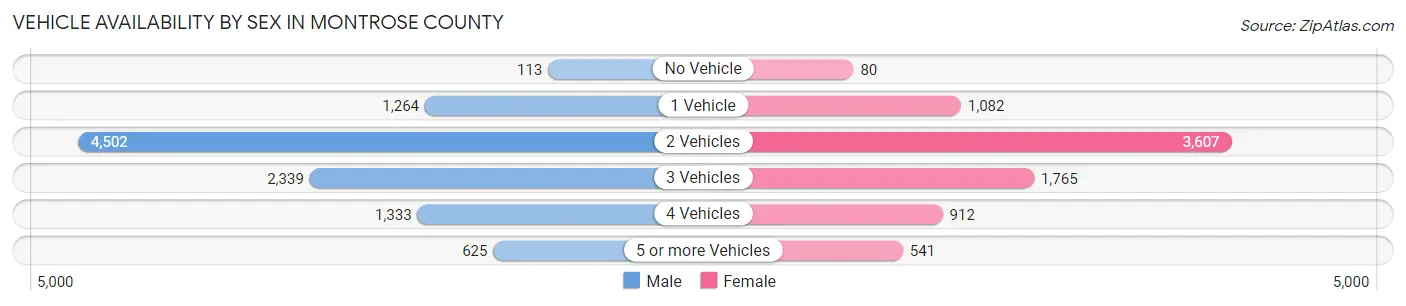
| Vehicles Available | Male | Female |
| No Vehicle | 113 (1.1%) | 80 (1.0%) |
| 1 Vehicle | 1,264 (12.4%) | 1,082 (13.6%) |
| 2 Vehicles | 4,502 (44.2%) | 3,607 (45.2%) |
| 3 Vehicles | 2,339 (23.0%) | 1,765 (22.1%) |
| 4 Vehicles | 1,333 (13.1%) | 912 (11.4%) |
| 5 or more Vehicles | 625 (6.1%) | 541 (6.8%) |
| Total | 10,176 (100.0%) | 7,987 (100.0%) |
Commute Time in Montrose County
The most frequently occuring commute durations in Montrose County are 10 to 14 minutes (4,206 commuters, 25.8%), 15 to 19 minutes (3,507 commuters, 21.5%), and 5 to 9 minutes (2,671 commuters, 16.4%).
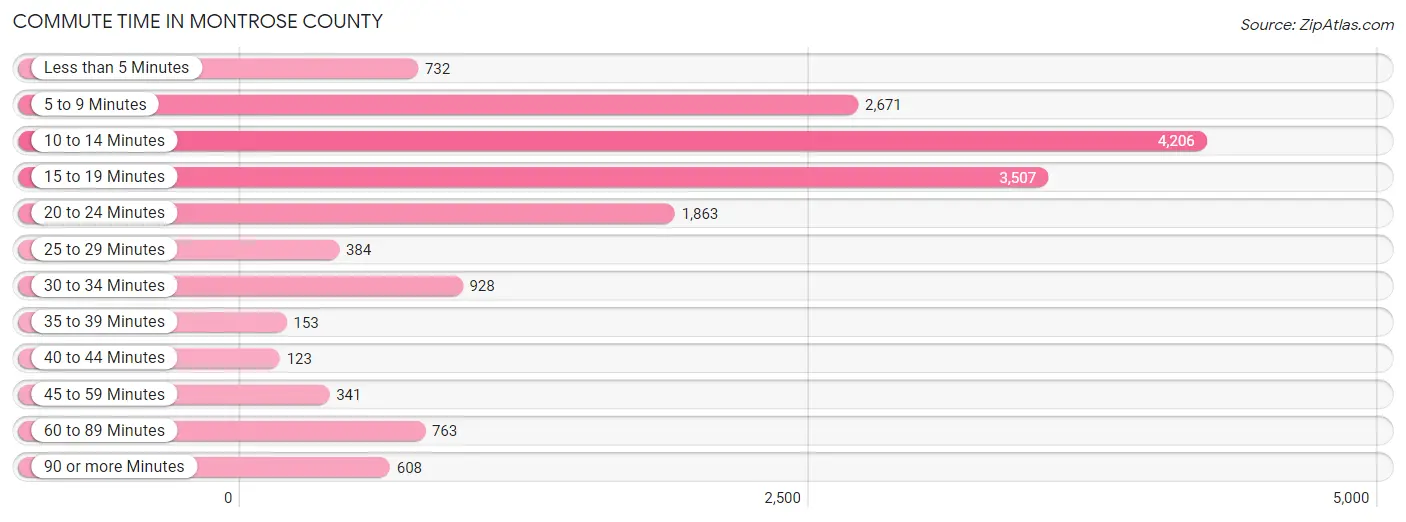
| Commute Time | # Commuters | % Commuters |
| Less than 5 Minutes | 732 | 4.5% |
| 5 to 9 Minutes | 2,671 | 16.4% |
| 10 to 14 Minutes | 4,206 | 25.8% |
| 15 to 19 Minutes | 3,507 | 21.5% |
| 20 to 24 Minutes | 1,863 | 11.4% |
| 25 to 29 Minutes | 384 | 2.4% |
| 30 to 34 Minutes | 928 | 5.7% |
| 35 to 39 Minutes | 153 | 0.9% |
| 40 to 44 Minutes | 123 | 0.8% |
| 45 to 59 Minutes | 341 | 2.1% |
| 60 to 89 Minutes | 763 | 4.7% |
| 90 or more Minutes | 608 | 3.7% |
Commute Time by Sex in Montrose County
The most common commute times in Montrose County are 10 to 14 minutes (2,195 commuters, 23.8%) for males and 10 to 14 minutes (2,011 commuters, 28.4%) for females.
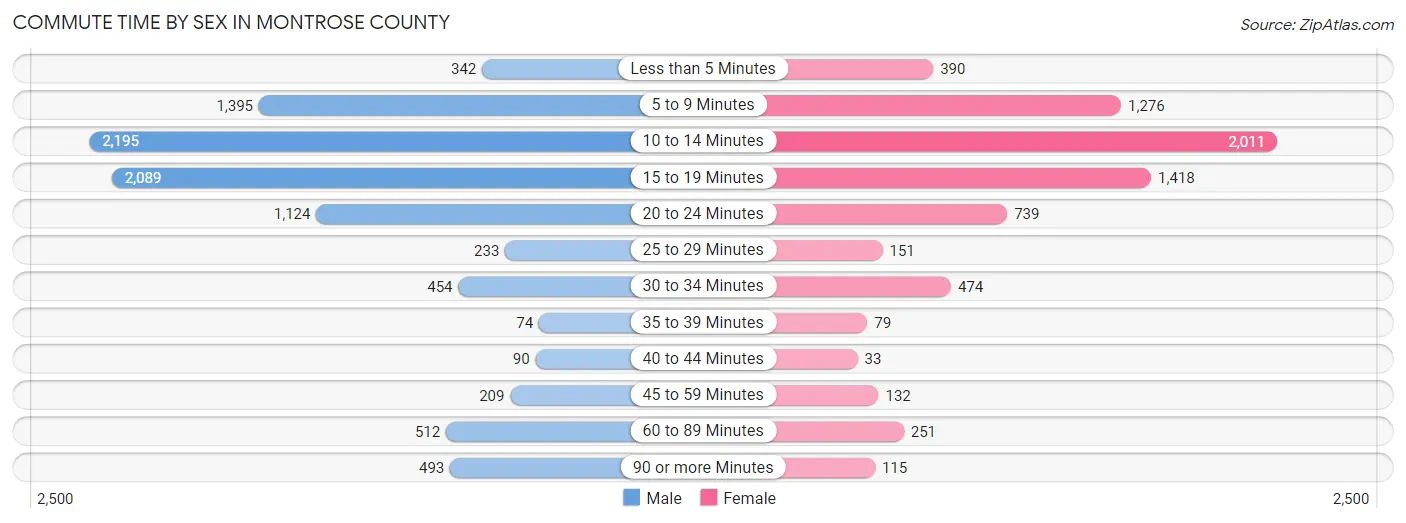
| Commute Time | Male | Female |
| Less than 5 Minutes | 342 (3.7%) | 390 (5.5%) |
| 5 to 9 Minutes | 1,395 (15.1%) | 1,276 (18.0%) |
| 10 to 14 Minutes | 2,195 (23.8%) | 2,011 (28.4%) |
| 15 to 19 Minutes | 2,089 (22.7%) | 1,418 (20.1%) |
| 20 to 24 Minutes | 1,124 (12.2%) | 739 (10.4%) |
| 25 to 29 Minutes | 233 (2.5%) | 151 (2.1%) |
| 30 to 34 Minutes | 454 (4.9%) | 474 (6.7%) |
| 35 to 39 Minutes | 74 (0.8%) | 79 (1.1%) |
| 40 to 44 Minutes | 90 (1.0%) | 33 (0.5%) |
| 45 to 59 Minutes | 209 (2.3%) | 132 (1.9%) |
| 60 to 89 Minutes | 512 (5.6%) | 251 (3.5%) |
| 90 or more Minutes | 493 (5.3%) | 115 (1.6%) |
Time of Departure to Work by Sex in Montrose County
The most frequent times of departure to work in Montrose County are 7:00 AM to 7:29 AM (1,317, 14.3%) for males and 7:30 AM to 7:59 AM (1,661, 23.5%) for females.
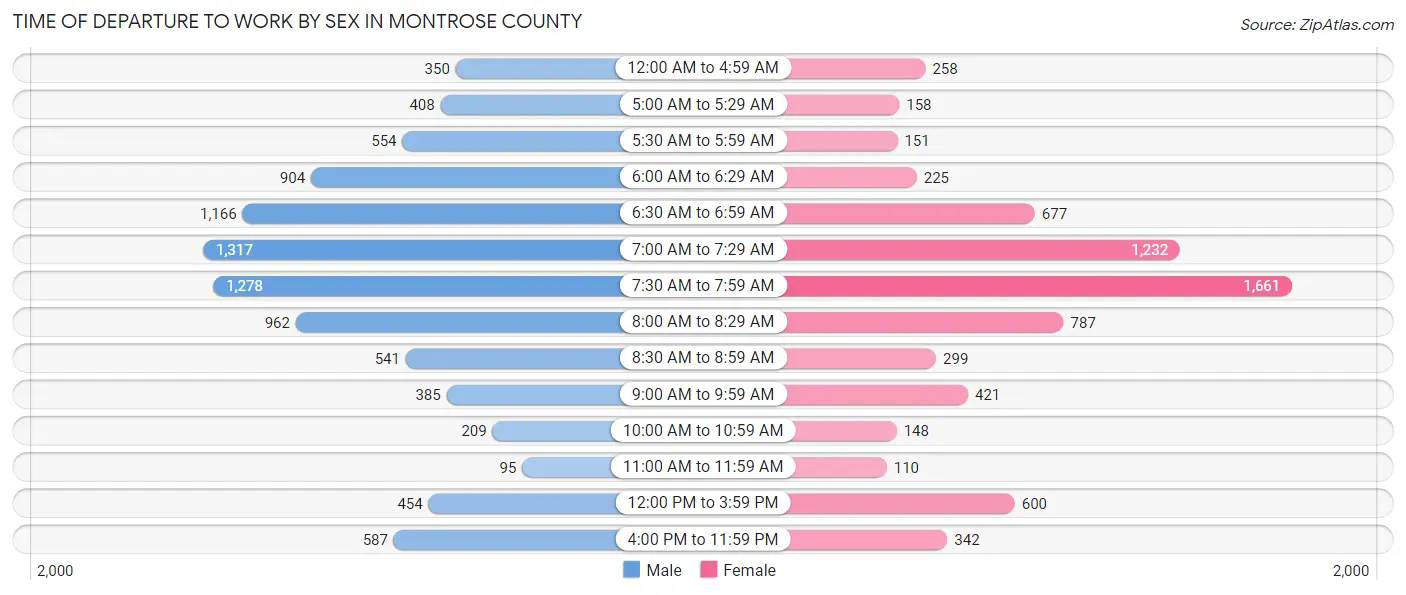
| Time of Departure | Male | Female |
| 12:00 AM to 4:59 AM | 350 (3.8%) | 258 (3.6%) |
| 5:00 AM to 5:29 AM | 408 (4.4%) | 158 (2.2%) |
| 5:30 AM to 5:59 AM | 554 (6.0%) | 151 (2.1%) |
| 6:00 AM to 6:29 AM | 904 (9.8%) | 225 (3.2%) |
| 6:30 AM to 6:59 AM | 1,166 (12.7%) | 677 (9.6%) |
| 7:00 AM to 7:29 AM | 1,317 (14.3%) | 1,232 (17.4%) |
| 7:30 AM to 7:59 AM | 1,278 (13.9%) | 1,661 (23.5%) |
| 8:00 AM to 8:29 AM | 962 (10.4%) | 787 (11.1%) |
| 8:30 AM to 8:59 AM | 541 (5.9%) | 299 (4.2%) |
| 9:00 AM to 9:59 AM | 385 (4.2%) | 421 (6.0%) |
| 10:00 AM to 10:59 AM | 209 (2.3%) | 148 (2.1%) |
| 11:00 AM to 11:59 AM | 95 (1.0%) | 110 (1.6%) |
| 12:00 PM to 3:59 PM | 454 (4.9%) | 600 (8.5%) |
| 4:00 PM to 11:59 PM | 587 (6.4%) | 342 (4.8%) |
| Total | 9,210 (100.0%) | 7,069 (100.0%) |
Housing Occupancy in Montrose County
Occupancy by Ownership in Montrose County
Of the total 17,042 dwellings in Montrose County, owner-occupied units account for 12,961 (76.0%), while renter-occupied units make up 4,081 (23.9%).
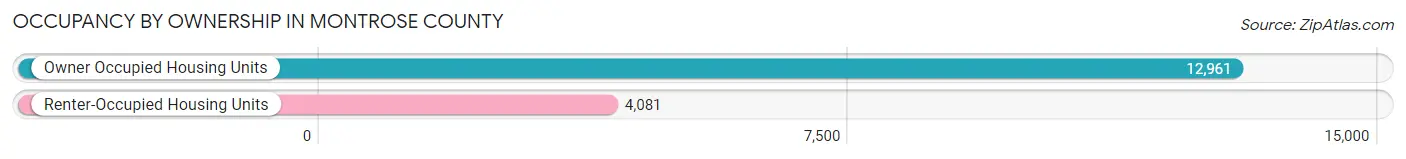
| Occupancy | # Housing Units | % Housing Units |
| Owner Occupied Housing Units | 12,961 | 76.0% |
| Renter-Occupied Housing Units | 4,081 | 23.9% |
| Total Occupied Housing Units | 17,042 | 100.0% |
Occupancy by Household Size in Montrose County
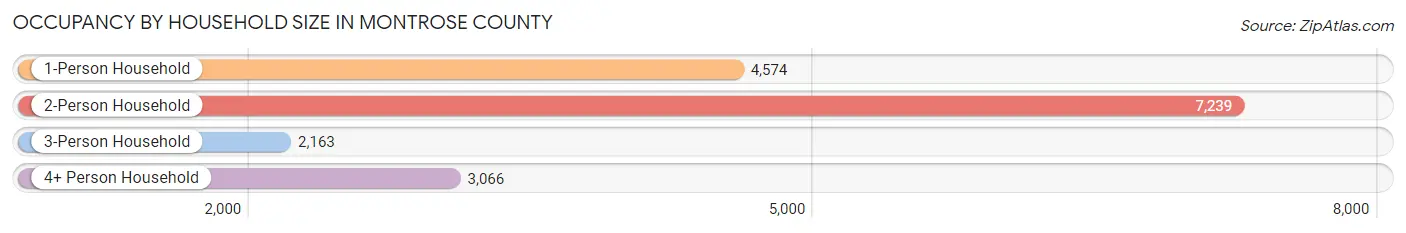
| Household Size | # Housing Units | % Housing Units |
| 1-Person Household | 4,574 | 26.8% |
| 2-Person Household | 7,239 | 42.5% |
| 3-Person Household | 2,163 | 12.7% |
| 4+ Person Household | 3,066 | 18.0% |
| Total Housing Units | 17,042 | 100.0% |
Occupancy by Ownership by Household Size in Montrose County
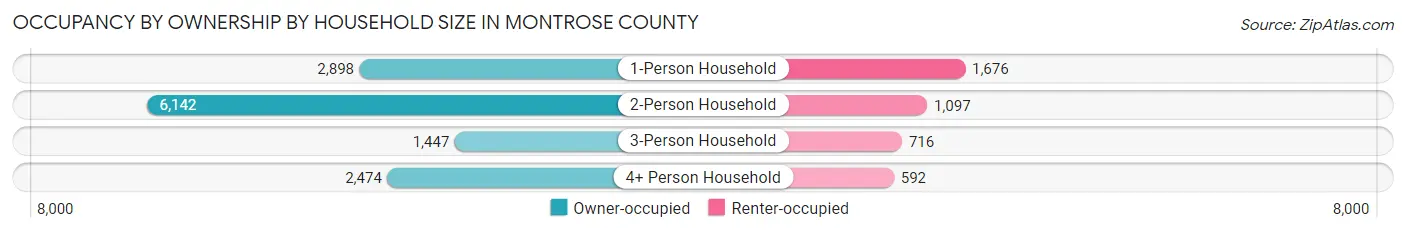
| Household Size | Owner-occupied | Renter-occupied |
| 1-Person Household | 2,898 (63.4%) | 1,676 (36.6%) |
| 2-Person Household | 6,142 (84.9%) | 1,097 (15.1%) |
| 3-Person Household | 1,447 (66.9%) | 716 (33.1%) |
| 4+ Person Household | 2,474 (80.7%) | 592 (19.3%) |
| Total Housing Units | 12,961 (76.0%) | 4,081 (23.9%) |
Occupancy by Educational Attainment in Montrose County
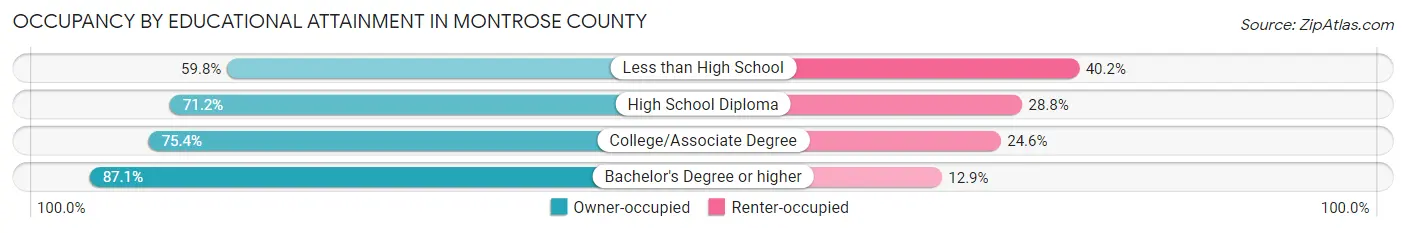
| Household Size | Owner-occupied | Renter-occupied |
| Less than High School | 970 (59.8%) | 651 (40.2%) |
| High School Diploma | 3,792 (71.2%) | 1,535 (28.8%) |
| College/Associate Degree | 3,810 (75.4%) | 1,244 (24.6%) |
| Bachelor's Degree or higher | 4,389 (87.1%) | 651 (12.9%) |
Occupancy by Age of Householder in Montrose County
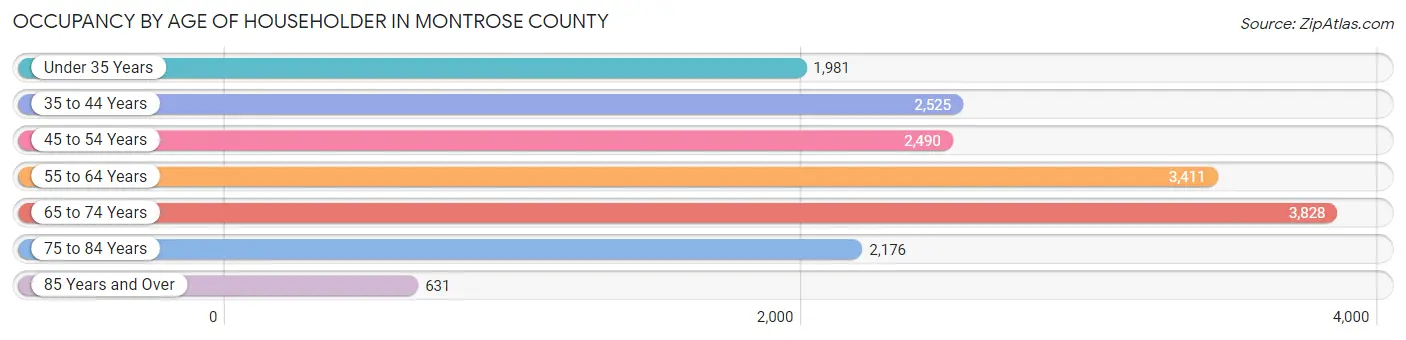
| Age Bracket | # Households | % Households |
| Under 35 Years | 1,981 | 11.6% |
| 35 to 44 Years | 2,525 | 14.8% |
| 45 to 54 Years | 2,490 | 14.6% |
| 55 to 64 Years | 3,411 | 20.0% |
| 65 to 74 Years | 3,828 | 22.5% |
| 75 to 84 Years | 2,176 | 12.8% |
| 85 Years and Over | 631 | 3.7% |
| Total | 17,042 | 100.0% |
Housing Finances in Montrose County
Median Income by Occupancy in Montrose County
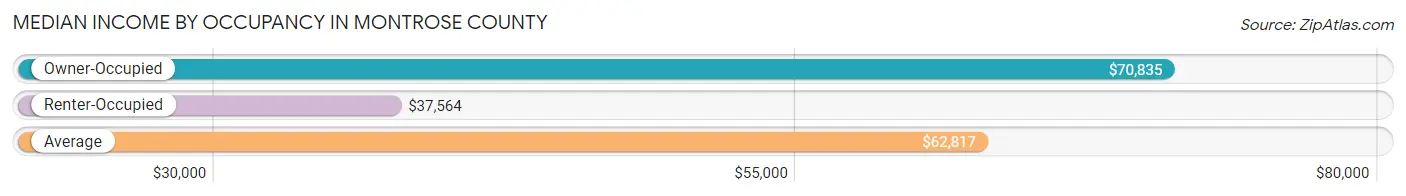
| Occupancy Type | # Households | Median Income |
| Owner-Occupied | 12,961 (76.0%) | $70,835 |
| Renter-Occupied | 4,081 (23.9%) | $37,564 |
| Average | 17,042 (100.0%) | $62,817 |
Occupancy by Householder Income Bracket in Montrose County
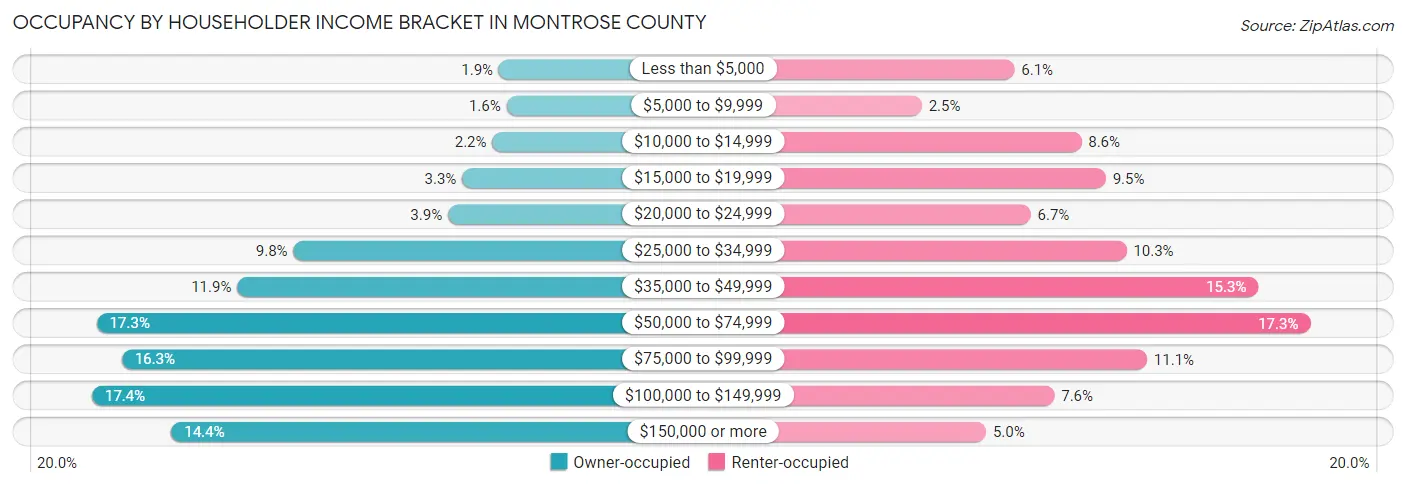
| Income Bracket | Owner-occupied | Renter-occupied |
| Less than $5,000 | 250 (1.9%) | 247 (6.0%) |
| $5,000 to $9,999 | 213 (1.6%) | 103 (2.5%) |
| $10,000 to $14,999 | 282 (2.2%) | 351 (8.6%) |
| $15,000 to $19,999 | 431 (3.3%) | 389 (9.5%) |
| $20,000 to $24,999 | 501 (3.9%) | 272 (6.7%) |
| $25,000 to $34,999 | 1,265 (9.8%) | 421 (10.3%) |
| $35,000 to $49,999 | 1,542 (11.9%) | 626 (15.3%) |
| $50,000 to $74,999 | 2,237 (17.3%) | 707 (17.3%) |
| $75,000 to $99,999 | 2,112 (16.3%) | 453 (11.1%) |
| $100,000 to $149,999 | 2,260 (17.4%) | 309 (7.6%) |
| $150,000 or more | 1,868 (14.4%) | 203 (5.0%) |
| Total | 12,961 (100.0%) | 4,081 (100.0%) |
Monthly Housing Cost Tiers in Montrose County
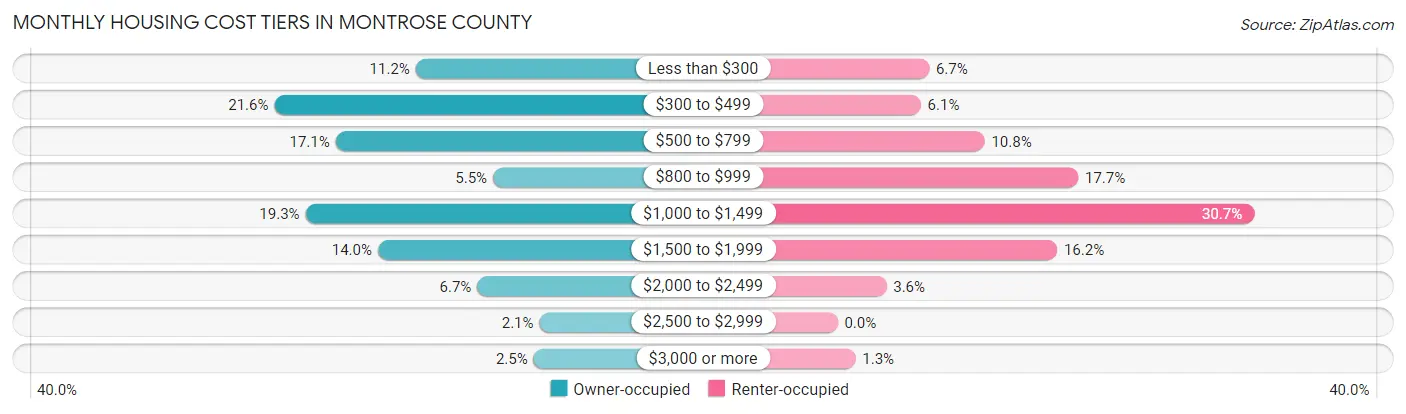
| Monthly Cost | Owner-occupied | Renter-occupied |
| Less than $300 | 1,451 (11.2%) | 275 (6.7%) |
| $300 to $499 | 2,801 (21.6%) | 250 (6.1%) |
| $500 to $799 | 2,216 (17.1%) | 442 (10.8%) |
| $800 to $999 | 714 (5.5%) | 723 (17.7%) |
| $1,000 to $1,499 | 2,504 (19.3%) | 1,252 (30.7%) |
| $1,500 to $1,999 | 1,813 (14.0%) | 660 (16.2%) |
| $2,000 to $2,499 | 865 (6.7%) | 147 (3.6%) |
| $2,500 to $2,999 | 271 (2.1%) | 0 (0.0%) |
| $3,000 or more | 326 (2.5%) | 54 (1.3%) |
| Total | 12,961 (100.0%) | 4,081 (100.0%) |
Physical Housing Characteristics in Montrose County
Housing Structures in Montrose County
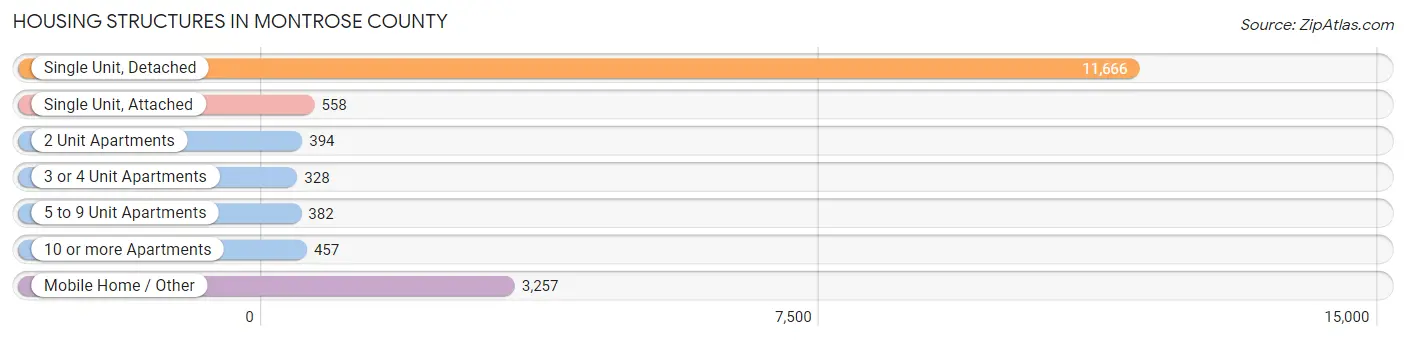
| Structure Type | # Housing Units | % Housing Units |
| Single Unit, Detached | 11,666 | 68.4% |
| Single Unit, Attached | 558 | 3.3% |
| 2 Unit Apartments | 394 | 2.3% |
| 3 or 4 Unit Apartments | 328 | 1.9% |
| 5 to 9 Unit Apartments | 382 | 2.2% |
| 10 or more Apartments | 457 | 2.7% |
| Mobile Home / Other | 3,257 | 19.1% |
| Total | 17,042 | 100.0% |
Housing Structures by Occupancy in Montrose County
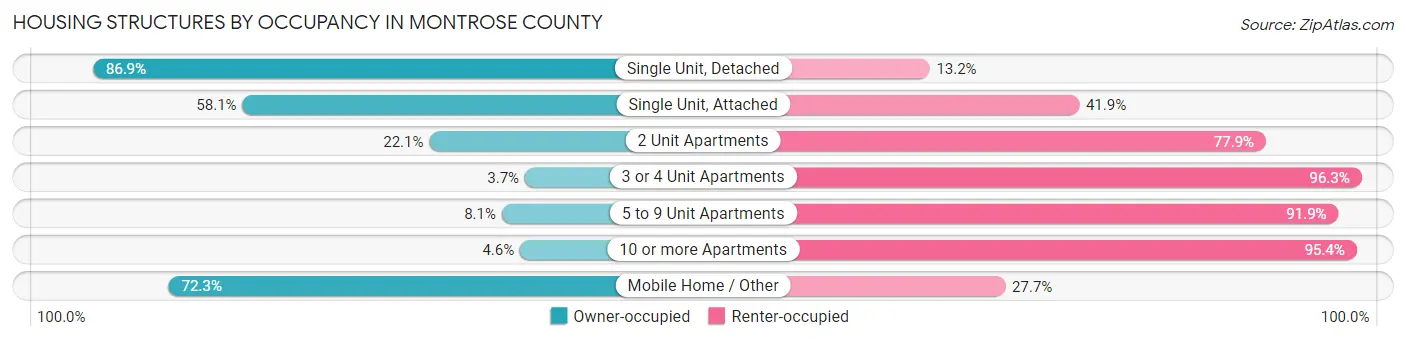
| Structure Type | Owner-occupied | Renter-occupied |
| Single Unit, Detached | 10,132 (86.9%) | 1,534 (13.2%) |
| Single Unit, Attached | 324 (58.1%) | 234 (41.9%) |
| 2 Unit Apartments | 87 (22.1%) | 307 (77.9%) |
| 3 or 4 Unit Apartments | 12 (3.7%) | 316 (96.3%) |
| 5 to 9 Unit Apartments | 31 (8.1%) | 351 (91.9%) |
| 10 or more Apartments | 21 (4.6%) | 436 (95.4%) |
| Mobile Home / Other | 2,354 (72.3%) | 903 (27.7%) |
| Total | 12,961 (76.0%) | 4,081 (23.9%) |
Housing Structures by Number of Rooms in Montrose County
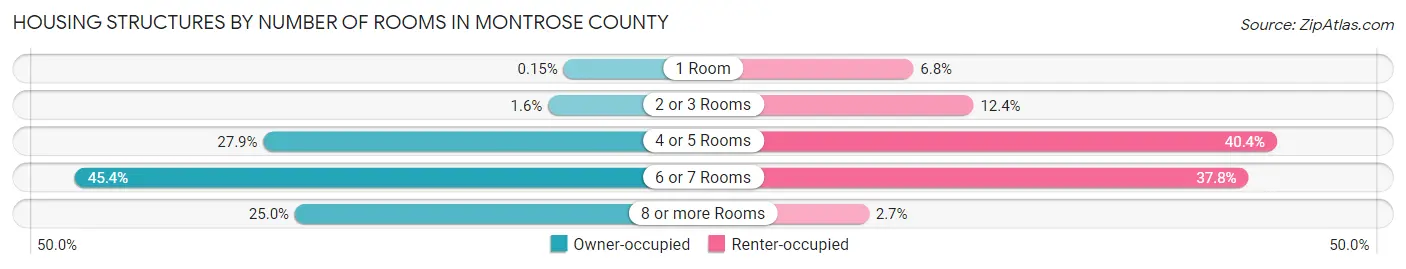
| Number of Rooms | Owner-occupied | Renter-occupied |
| 1 Room | 19 (0.2%) | 277 (6.8%) |
| 2 or 3 Rooms | 205 (1.6%) | 504 (12.3%) |
| 4 or 5 Rooms | 3,619 (27.9%) | 1,649 (40.4%) |
| 6 or 7 Rooms | 5,878 (45.4%) | 1,542 (37.8%) |
| 8 or more Rooms | 3,240 (25.0%) | 109 (2.7%) |
| Total | 12,961 (100.0%) | 4,081 (100.0%) |
Housing Structure by Heating Type in Montrose County
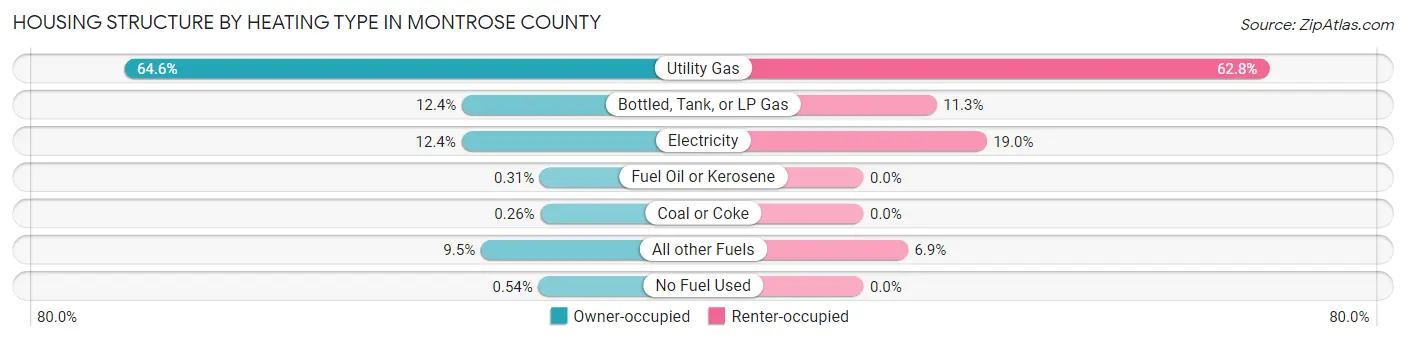
| Heating Type | Owner-occupied | Renter-occupied |
| Utility Gas | 8,377 (64.6%) | 2,562 (62.8%) |
| Bottled, Tank, or LP Gas | 1,603 (12.4%) | 462 (11.3%) |
| Electricity | 1,612 (12.4%) | 777 (19.0%) |
| Fuel Oil or Kerosene | 40 (0.3%) | 0 (0.0%) |
| Coal or Coke | 34 (0.3%) | 0 (0.0%) |
| All other Fuels | 1,225 (9.5%) | 280 (6.9%) |
| No Fuel Used | 70 (0.5%) | 0 (0.0%) |
| Total | 12,961 (100.0%) | 4,081 (100.0%) |
Household Vehicle Usage in Montrose County
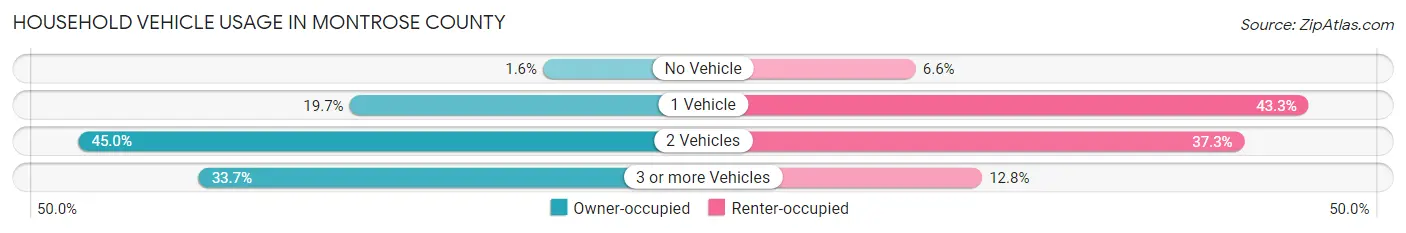
| Vehicles per Household | Owner-occupied | Renter-occupied |
| No Vehicle | 210 (1.6%) | 270 (6.6%) |
| 1 Vehicle | 2,551 (19.7%) | 1,766 (43.3%) |
| 2 Vehicles | 5,827 (45.0%) | 1,522 (37.3%) |
| 3 or more Vehicles | 4,373 (33.7%) | 523 (12.8%) |
| Total | 12,961 (100.0%) | 4,081 (100.0%) |
Real Estate & Mortgages in Montrose County
Real Estate and Mortgage Overview in Montrose County
| Characteristic | Without Mortgage | With Mortgage |
| Housing Units | 6,339 | 6,622 |
| Median Property Value | $299,600 | $324,100 |
| Median Household Income | $57,319 | $915 |
| Monthly Housing Costs | $420 | $301 |
| Real Estate Taxes | $1,067 | $61 |
Property Value by Mortgage Status in Montrose County
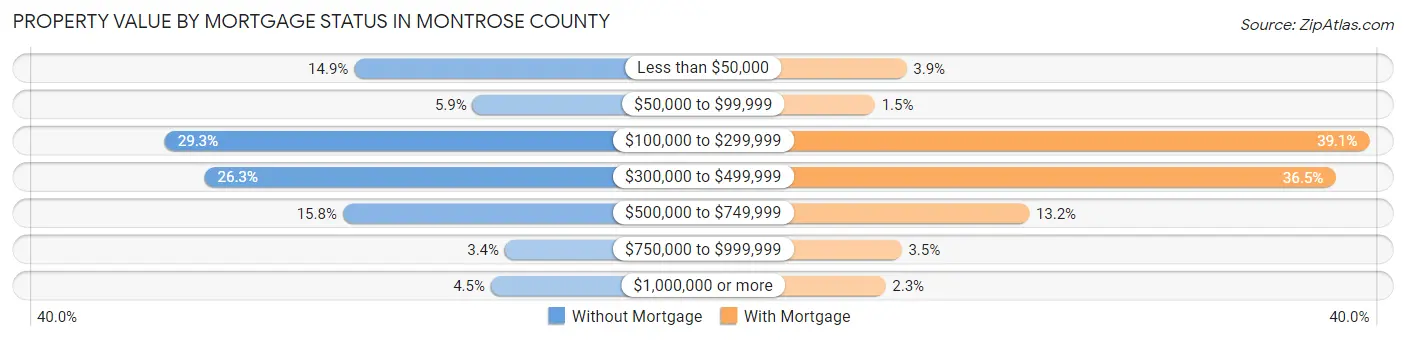
| Property Value | Without Mortgage | With Mortgage |
| Less than $50,000 | 944 (14.9%) | 256 (3.9%) |
| $50,000 to $99,999 | 372 (5.9%) | 97 (1.5%) |
| $100,000 to $299,999 | 1,858 (29.3%) | 2,592 (39.1%) |
| $300,000 to $499,999 | 1,666 (26.3%) | 2,420 (36.5%) |
| $500,000 to $749,999 | 999 (15.8%) | 875 (13.2%) |
| $750,000 to $999,999 | 216 (3.4%) | 232 (3.5%) |
| $1,000,000 or more | 284 (4.5%) | 150 (2.3%) |
| Total | 6,339 (100.0%) | 6,622 (100.0%) |
Household Income by Mortgage Status in Montrose County
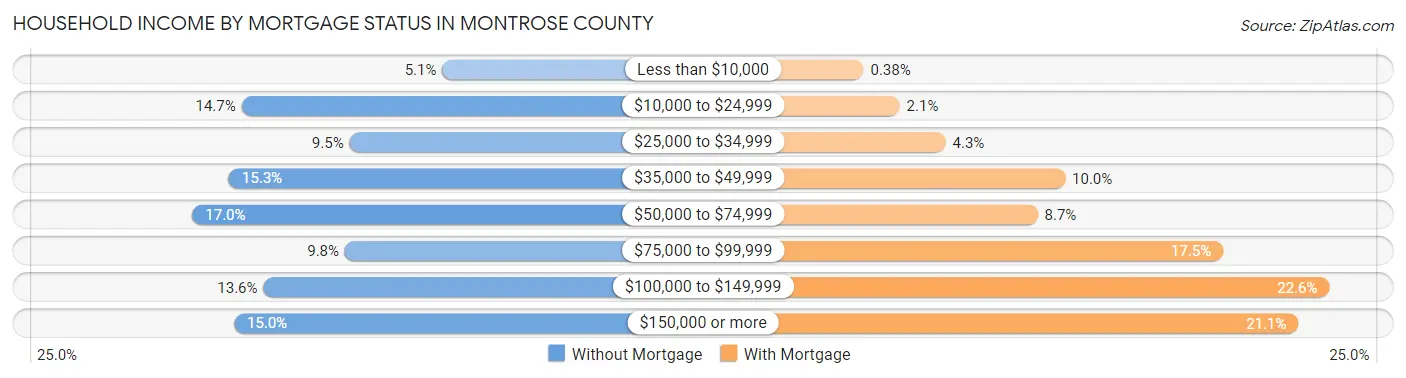
| Household Income | Without Mortgage | With Mortgage |
| Less than $10,000 | 324 (5.1%) | 25 (0.4%) |
| $10,000 to $24,999 | 930 (14.7%) | 139 (2.1%) |
| $25,000 to $34,999 | 604 (9.5%) | 284 (4.3%) |
| $35,000 to $49,999 | 968 (15.3%) | 661 (10.0%) |
| $50,000 to $74,999 | 1,078 (17.0%) | 574 (8.7%) |
| $75,000 to $99,999 | 618 (9.8%) | 1,159 (17.5%) |
| $100,000 to $149,999 | 864 (13.6%) | 1,494 (22.6%) |
| $150,000 or more | 953 (15.0%) | 1,396 (21.1%) |
| Total | 6,339 (100.0%) | 6,622 (100.0%) |
Property Value to Household Income Ratio in Montrose County
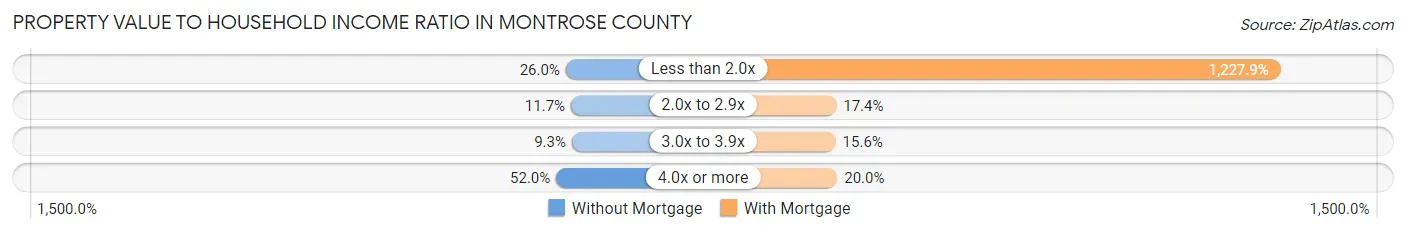
| Value-to-Income Ratio | Without Mortgage | With Mortgage |
| Less than 2.0x | 1,645 (26.0%) | 81,312 (1,227.9%) |
| 2.0x to 2.9x | 744 (11.7%) | 1,155 (17.4%) |
| 3.0x to 3.9x | 589 (9.3%) | 1,036 (15.6%) |
| 4.0x or more | 3,298 (52.0%) | 1,327 (20.0%) |
| Total | 6,339 (100.0%) | 6,622 (100.0%) |
Real Estate Taxes by Mortgage Status in Montrose County
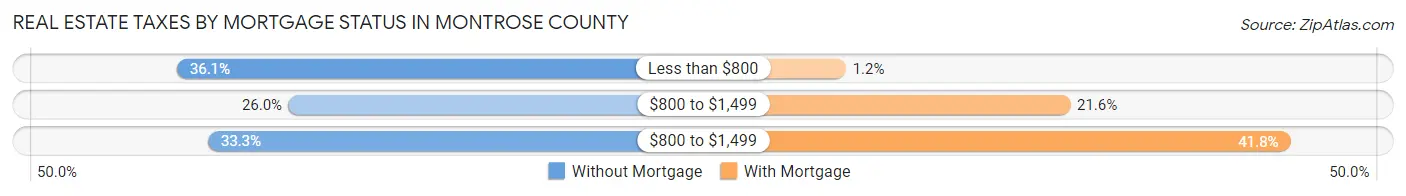
| Property Taxes | Without Mortgage | With Mortgage |
| Less than $800 | 2,288 (36.1%) | 77 (1.2%) |
| $800 to $1,499 | 1,645 (26.0%) | 1,433 (21.6%) |
| $800 to $1,499 | 2,109 (33.3%) | 2,766 (41.8%) |
| Total | 6,339 (100.0%) | 6,622 (100.0%) |
Health & Disability in Montrose County
Health Insurance Coverage by Age in Montrose County
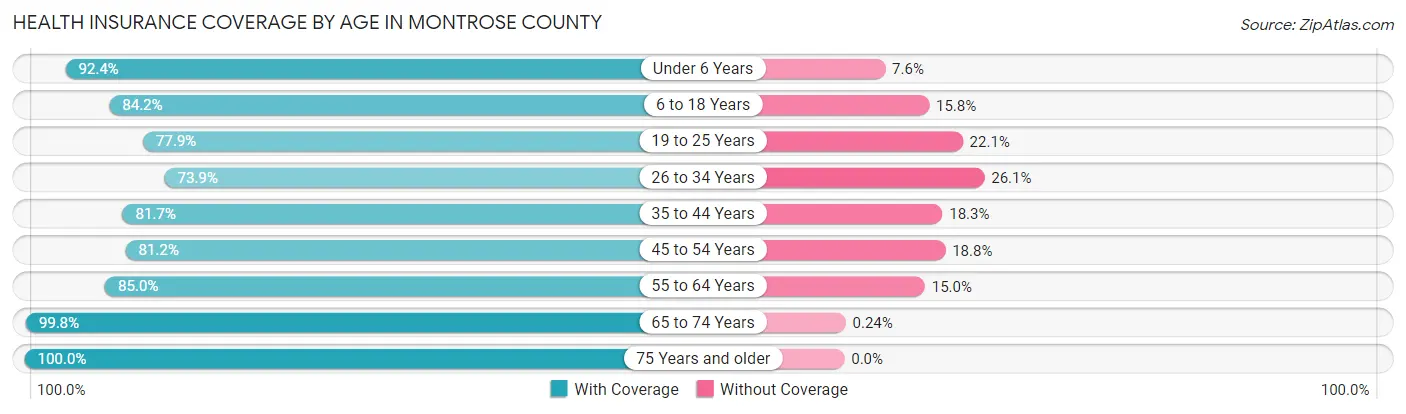
| Age Bracket | With Coverage | Without Coverage |
| Under 6 Years | 2,485 (92.4%) | 205 (7.6%) |
| 6 to 18 Years | 5,595 (84.2%) | 1,051 (15.8%) |
| 19 to 25 Years | 2,355 (77.9%) | 667 (22.1%) |
| 26 to 34 Years | 2,718 (73.9%) | 960 (26.1%) |
| 35 to 44 Years | 4,009 (81.7%) | 897 (18.3%) |
| 45 to 54 Years | 3,942 (81.2%) | 914 (18.8%) |
| 55 to 64 Years | 5,193 (85.0%) | 917 (15.0%) |
| 65 to 74 Years | 6,127 (99.8%) | 15 (0.2%) |
| 75 Years and older | 4,354 (100.0%) | 0 (0.0%) |
| Total | 36,778 (86.7%) | 5,626 (13.3%) |
Health Insurance Coverage by Citizenship Status in Montrose County
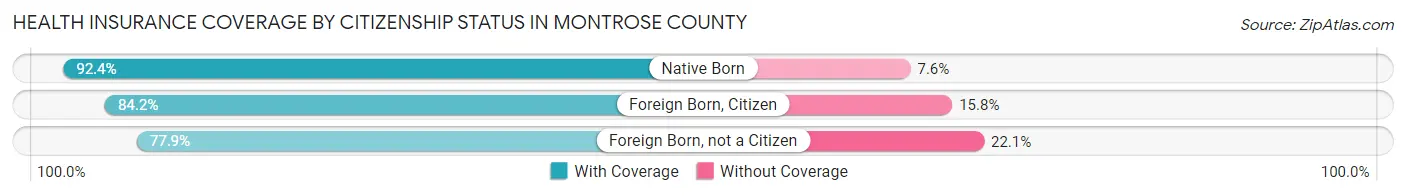
| Citizenship Status | With Coverage | Without Coverage |
| Native Born | 2,485 (92.4%) | 205 (7.6%) |
| Foreign Born, Citizen | 5,595 (84.2%) | 1,051 (15.8%) |
| Foreign Born, not a Citizen | 2,355 (77.9%) | 667 (22.1%) |
Health Insurance Coverage by Household Income in Montrose County
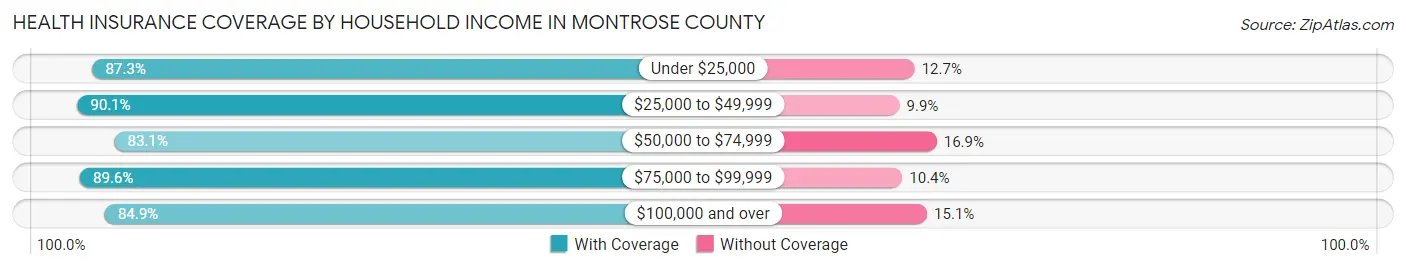
| Household Income | With Coverage | Without Coverage |
| Under $25,000 | 4,317 (87.3%) | 630 (12.7%) |
| $25,000 to $49,999 | 7,024 (90.1%) | 771 (9.9%) |
| $50,000 to $74,999 | 6,281 (83.1%) | 1,274 (16.9%) |
| $75,000 to $99,999 | 6,480 (89.6%) | 753 (10.4%) |
| $100,000 and over | 12,365 (84.9%) | 2,193 (15.1%) |
Public vs Private Health Insurance Coverage by Age in Montrose County
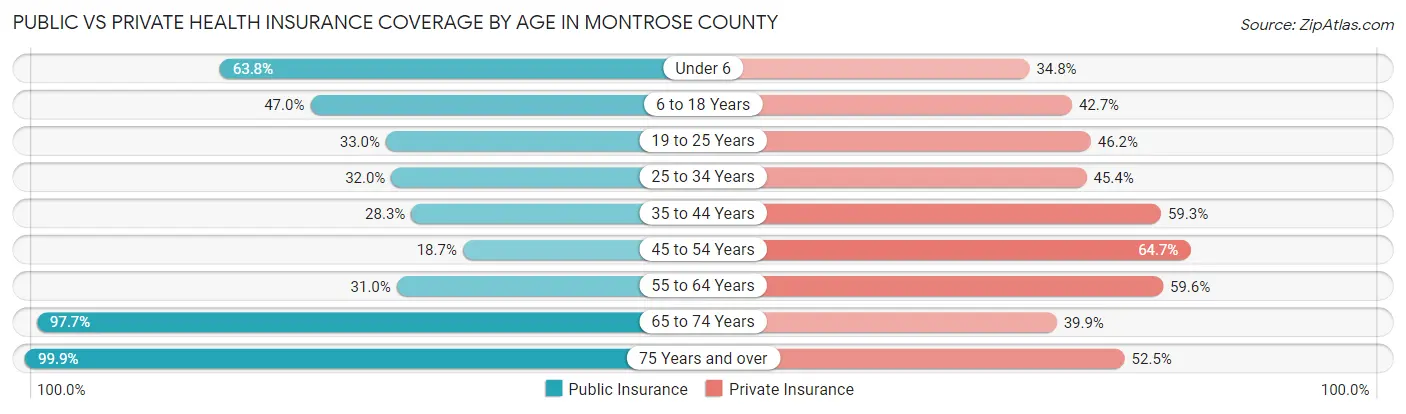
| Age Bracket | Public Insurance | Private Insurance |
| Under 6 | 1,715 (63.7%) | 937 (34.8%) |
| 6 to 18 Years | 3,122 (47.0%) | 2,839 (42.7%) |
| 19 to 25 Years | 996 (33.0%) | 1,397 (46.2%) |
| 25 to 34 Years | 1,175 (32.0%) | 1,671 (45.4%) |
| 35 to 44 Years | 1,386 (28.2%) | 2,907 (59.3%) |
| 45 to 54 Years | 907 (18.7%) | 3,140 (64.7%) |
| 55 to 64 Years | 1,891 (30.9%) | 3,643 (59.6%) |
| 65 to 74 Years | 6,002 (97.7%) | 2,450 (39.9%) |
| 75 Years and over | 4,349 (99.9%) | 2,286 (52.5%) |
| Total | 21,543 (50.8%) | 21,270 (50.2%) |
Disability Status by Sex by Age in Montrose County
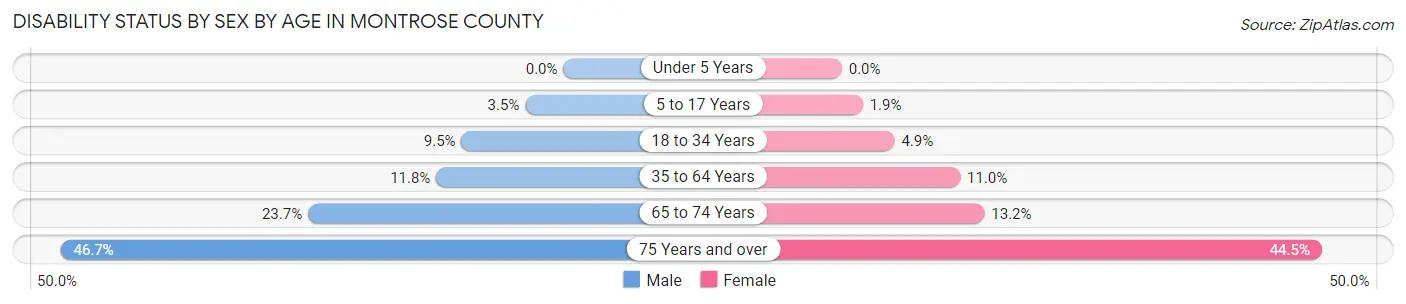
| Age Bracket | Male | Female |
| Under 5 Years | 0 (0.0%) | 0 (0.0%) |
| 5 to 17 Years | 131 (3.5%) | 59 (1.9%) |
| 18 to 34 Years | 351 (9.5%) | 172 (4.9%) |
| 35 to 64 Years | 927 (11.8%) | 880 (11.0%) |
| 65 to 74 Years | 707 (23.7%) | 418 (13.2%) |
| 75 Years and over | 890 (46.7%) | 1,090 (44.5%) |
Disability Class by Sex by Age in Montrose County
Disability Class: Hearing Difficulty
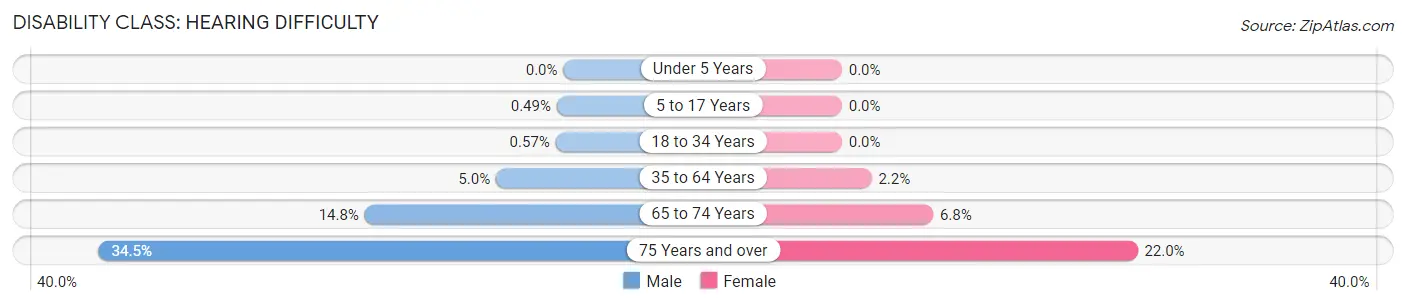
| Age Bracket | Male | Female |
| Under 5 Years | 0 (0.0%) | 0 (0.0%) |
| 5 to 17 Years | 18 (0.5%) | 0 (0.0%) |
| 18 to 34 Years | 21 (0.6%) | 0 (0.0%) |
| 35 to 64 Years | 393 (5.0%) | 176 (2.2%) |
| 65 to 74 Years | 440 (14.7%) | 214 (6.8%) |
| 75 Years and over | 658 (34.5%) | 537 (22.0%) |
Disability Class: Vision Difficulty
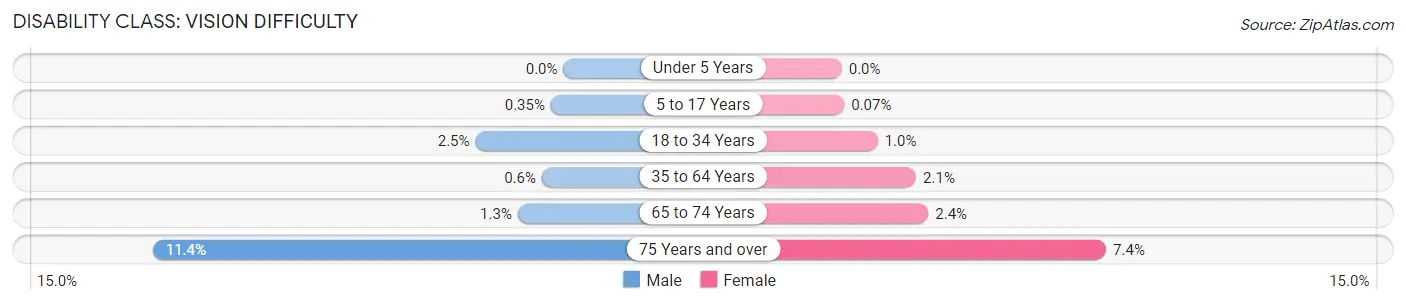
| Age Bracket | Male | Female |
| Under 5 Years | 0 (0.0%) | 0 (0.0%) |
| 5 to 17 Years | 13 (0.4%) | 2 (0.1%) |
| 18 to 34 Years | 91 (2.5%) | 35 (1.0%) |
| 35 to 64 Years | 47 (0.6%) | 166 (2.1%) |
| 65 to 74 Years | 38 (1.3%) | 76 (2.4%) |
| 75 Years and over | 218 (11.4%) | 180 (7.4%) |
Disability Class: Cognitive Difficulty
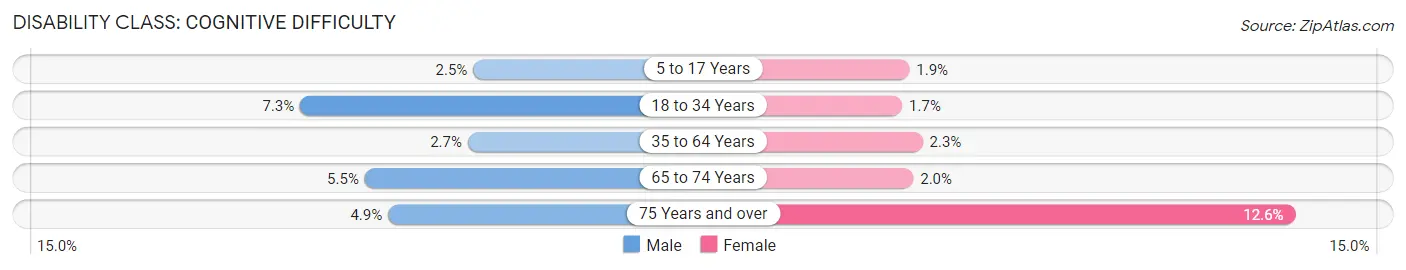
| Age Bracket | Male | Female |
| 5 to 17 Years | 93 (2.5%) | 57 (1.9%) |
| 18 to 34 Years | 272 (7.3%) | 59 (1.7%) |
| 35 to 64 Years | 209 (2.7%) | 180 (2.2%) |
| 65 to 74 Years | 165 (5.5%) | 63 (2.0%) |
| 75 Years and over | 93 (4.9%) | 309 (12.6%) |
Disability Class: Ambulatory Difficulty
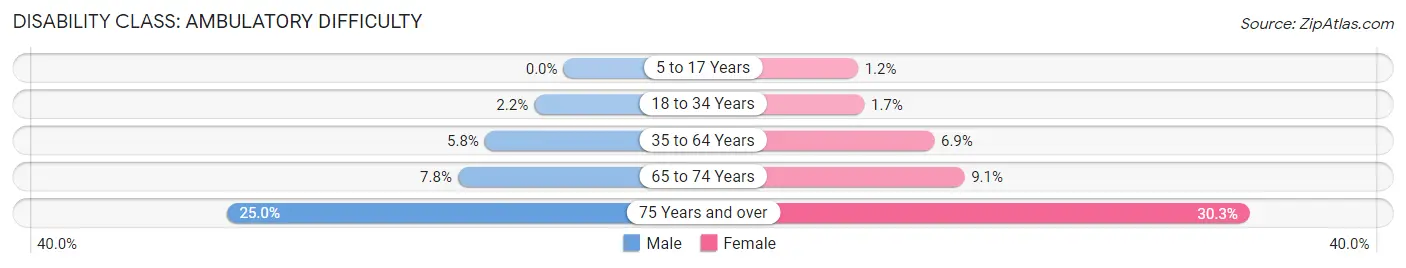
| Age Bracket | Male | Female |
| 5 to 17 Years | 0 (0.0%) | 36 (1.2%) |
| 18 to 34 Years | 81 (2.2%) | 58 (1.7%) |
| 35 to 64 Years | 459 (5.8%) | 549 (6.9%) |
| 65 to 74 Years | 234 (7.8%) | 287 (9.1%) |
| 75 Years and over | 477 (25.0%) | 741 (30.3%) |
Disability Class: Self-Care Difficulty
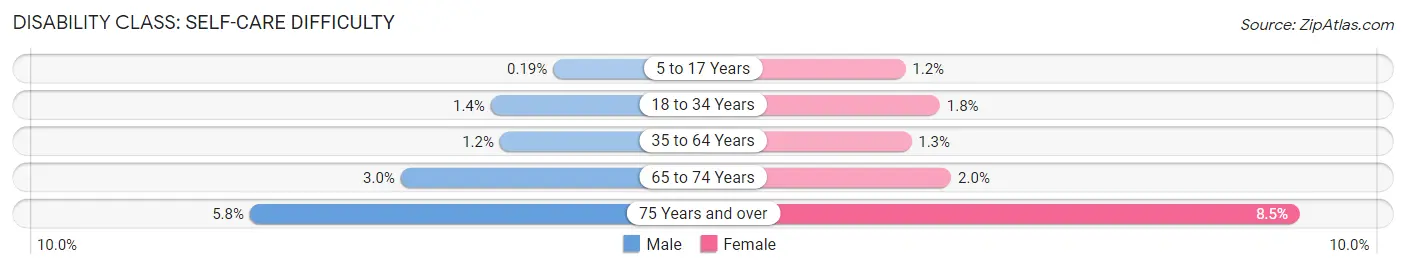
| Age Bracket | Male | Female |
| 5 to 17 Years | 7 (0.2%) | 36 (1.2%) |
| 18 to 34 Years | 50 (1.3%) | 64 (1.8%) |
| 35 to 64 Years | 93 (1.2%) | 103 (1.3%) |
| 65 to 74 Years | 90 (3.0%) | 64 (2.0%) |
| 75 Years and over | 111 (5.8%) | 208 (8.5%) |
Technology Access in Montrose County
Computing Device Access in Montrose County
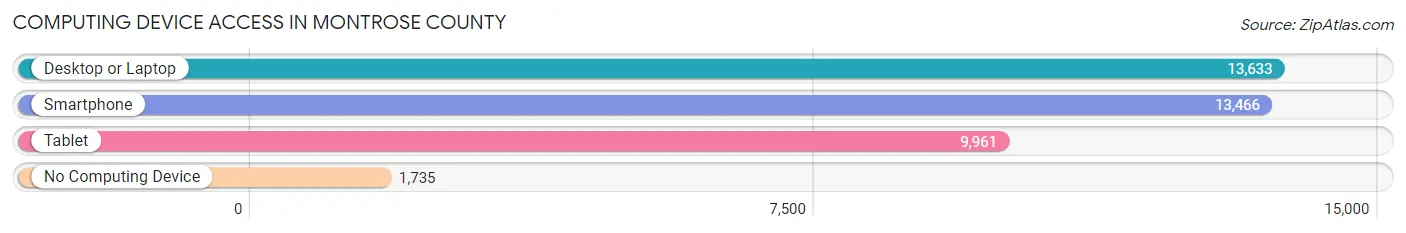
| Device Type | # Households | % Households |
| Desktop or Laptop | 13,633 | 80.0% |
| Smartphone | 13,466 | 79.0% |
| Tablet | 9,961 | 58.5% |
| No Computing Device | 1,735 | 10.2% |
| Total | 17,042 | 100.0% |
Internet Access in Montrose County
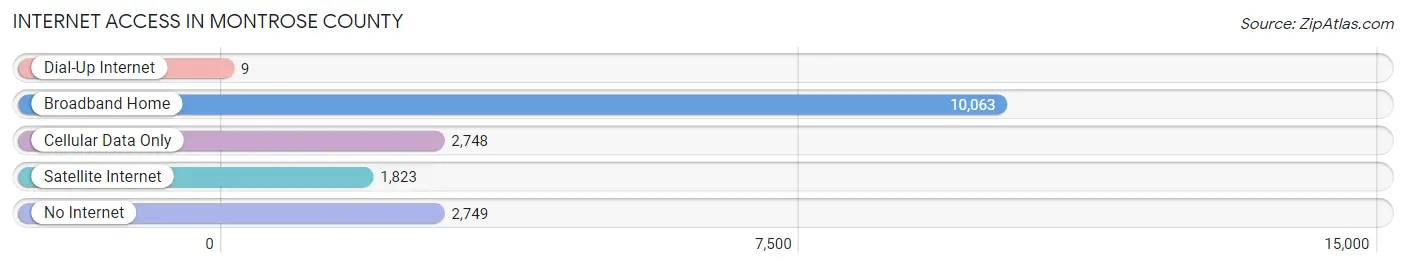
| Internet Type | # Households | % Households |
| Dial-Up Internet | 9 | 0.1% |
| Broadband Home | 10,063 | 59.1% |
| Cellular Data Only | 2,748 | 16.1% |
| Satellite Internet | 1,823 | 10.7% |
| No Internet | 2,749 | 16.1% |
| Total | 17,042 | 100.0% |
Montrose County Summary
Montrose County is located in the western part of the state of Colorado, in the United States. It is bordered by San Miguel County to the north, Delta County to the east, Ouray County to the south, and Mesa County to the west. The county seat is Montrose, and the county has a total area of 2,241 square miles. As of the 2010 census, the population was 41,276.
History
Montrose County was established in 1883, and was named after the city of Montrose, which was named after Lord Montrose, a Scottish nobleman. The county was originally part of Ute Indian territory, and was later part of the Uncompahgre Valley Ute Reservation. The Ute people were forcibly removed from the area in 1881, and the land was opened up for settlement.
The first settlers in the area were ranchers and farmers, who were attracted by the fertile soil and abundant water. The county was also home to several mining operations, including gold, silver, and coal. The county was also home to several Native American tribes, including the Ute, Apache, and Navajo.
Geography
Montrose County is located in the western part of the state of Colorado, in the United States. It is bordered by San Miguel County to the north, Delta County to the east, Ouray County to the south, and Mesa County to the west. The county has a total area of 2,241 square miles, of which 2,232 square miles is land and 9 square miles is water.
The county is located in the Uncompahgre Plateau, which is a high desert region. The terrain is mostly flat, with some rolling hills and canyons. The highest point in the county is Mount Sneffels, which has an elevation of 14,150 feet. The county is home to several rivers, including the Gunnison, Uncompahgre, and San Miguel.
Economy
The economy of Montrose County is largely based on agriculture, mining, and tourism. The county is home to several large farms, which produce a variety of crops, including hay, wheat, corn, and alfalfa. The county is also home to several large mining operations, which produce gold, silver, and coal.
Tourism is also an important part of the economy, as the county is home to several popular attractions, including the Black Canyon of the Gunnison National Park, the Uncompahgre National Forest, and the San Juan National Forest. The county is also home to several ski resorts, including Telluride Ski Resort and Crested Butte Mountain Resort.
Demographics
As of the 2010 census, the population of Montrose County was 41,276. The population is largely white (90.2%), with small percentages of Hispanic (4.7%), Native American (2.2%), and African American (1.2%) populations. The median household income is $45,845, and the median age is 38.7 years.
The county is home to several large cities, including Montrose (population 19,132), Delta (population 8,915), and Olathe (population 2,845). The county is also home to several smaller towns, including Ridgway (population 845), Hotchkiss (population 745), and Paonia (population 645).
Common Questions
What is the Total Population of Montrose County?
Total Population of Montrose County is 42,823.
What is the Total Male Population of Montrose County?
Total Male Population of Montrose County is 21,392.
What is the Total Female Population of Montrose County?
Total Female Population of Montrose County is 21,431.
What is the Ratio of Males per 100 Females in Montrose County?
There are 99.82 Males per 100 Females in Montrose County.
What is the Ratio of Females per 100 Males in Montrose County?
There are 100.18 Females per 100 Males in Montrose County.
What is the Median Population Age in Montrose County?
Median Population Age in Montrose County is 45.9 Years.
What is the Average Family Size in Montrose County
Average Family Size in Montrose County is 3.0 People.
What is the Average Household Size in Montrose County
Average Household Size in Montrose County is 2.5 People.
What is Per Capita Income in Montrose County?
Per Capita income in Montrose County is $35,755.
What is the Median Family Income in Montrose County?
Median Family Income in Montrose County is $78,074.
What is the Median Household income in Montrose County?
Median Household Income in Montrose County is $62,817.
What is Income or Wage Gap in Montrose County?
Income or Wage Gap in Montrose County is 17.7%.
Women in Montrose County earn 82.3 cents for every dollar earned by a man.
What is Family Income Deficit in Montrose County?
Family Income Deficit in Montrose County is $9,985.
Families that are below poverty line in Montrose County earn $9,985 less on average than the poverty threshold level.
What is Inequality or Gini Index in Montrose County?
Inequality or Gini Index in Montrose County is 0.47.
How Large is the Labor Force in Montrose County?
There are 19,495 People in the Labor Forcein in Montrose County.
What is the Percentage of People in the Labor Force in Montrose County?
55.5% of People are in the Labor Force in Montrose County.
What is the Unemployment Rate in Montrose County?
Unemployment Rate in Montrose County is 4.3%.