Montezuma County, CO
Montezuma County Map
Montezuma County Overview
26,070
TOTAL POPULATION
13,026
MALE POPULATION
13,044
FEMALE POPULATION
99.86
MALES / 100 FEMALES
100.14
FEMALES / 100 MALES
43.7
MEDIAN AGE
3.0
AVG FAMILY SIZE
2.5
AVG HOUSEHOLD SIZE
$31,044
PER CAPITA INCOME
$72,887
AVG FAMILY INCOME
$61,377
AVG HOUSEHOLD INCOME
16.5%
WAGE / INCOME GAP [ % ]
83.5¢/ $1
WAGE / INCOME GAP [ $ ]
0.42
INEQUALITY / GINI INDEX
11,377
LABOR FORCE [ PEOPLE ]
53.8%
PERCENT IN LABOR FORCE
4.4%
UNEMPLOYMENT RATE
Montezuma County Area Codes
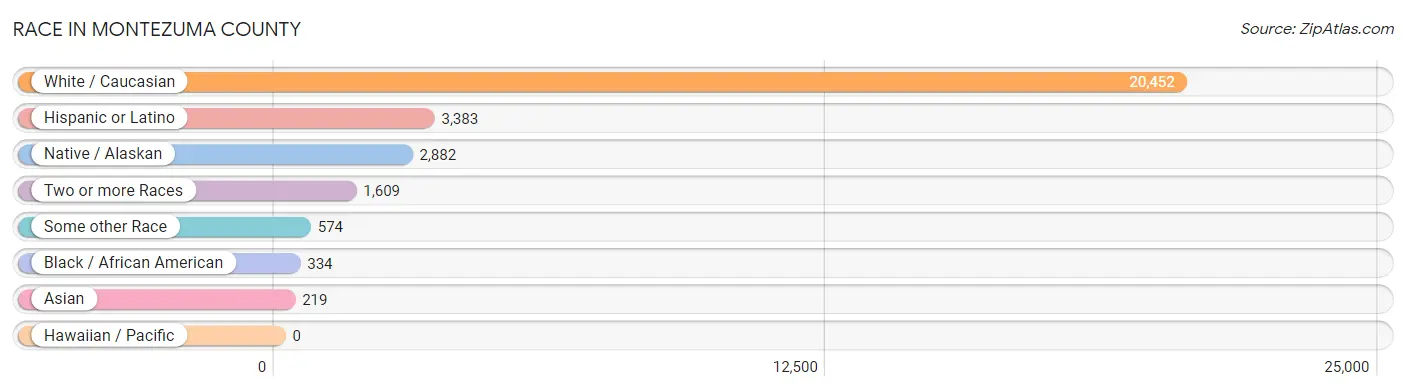
Race in Montezuma County
The most populous races in Montezuma County are White / Caucasian (20,452 | 78.4%), Hispanic or Latino (3,383 | 13.0%), and Native / Alaskan (2,882 | 11.1%).
| Race | # Population | % Population |
| Asian | 219 | 0.8% |
| Black / African American | 334 | 1.3% |
| Hawaiian / Pacific | 0 | 0.0% |
| Hispanic or Latino | 3,383 | 13.0% |
| Native / Alaskan | 2,882 | 11.1% |
| White / Caucasian | 20,452 | 78.4% |
| Two or more Races | 1,609 | 6.2% |
| Some other Race | 574 | 2.2% |
| Total | 26,070 | 100.0% |
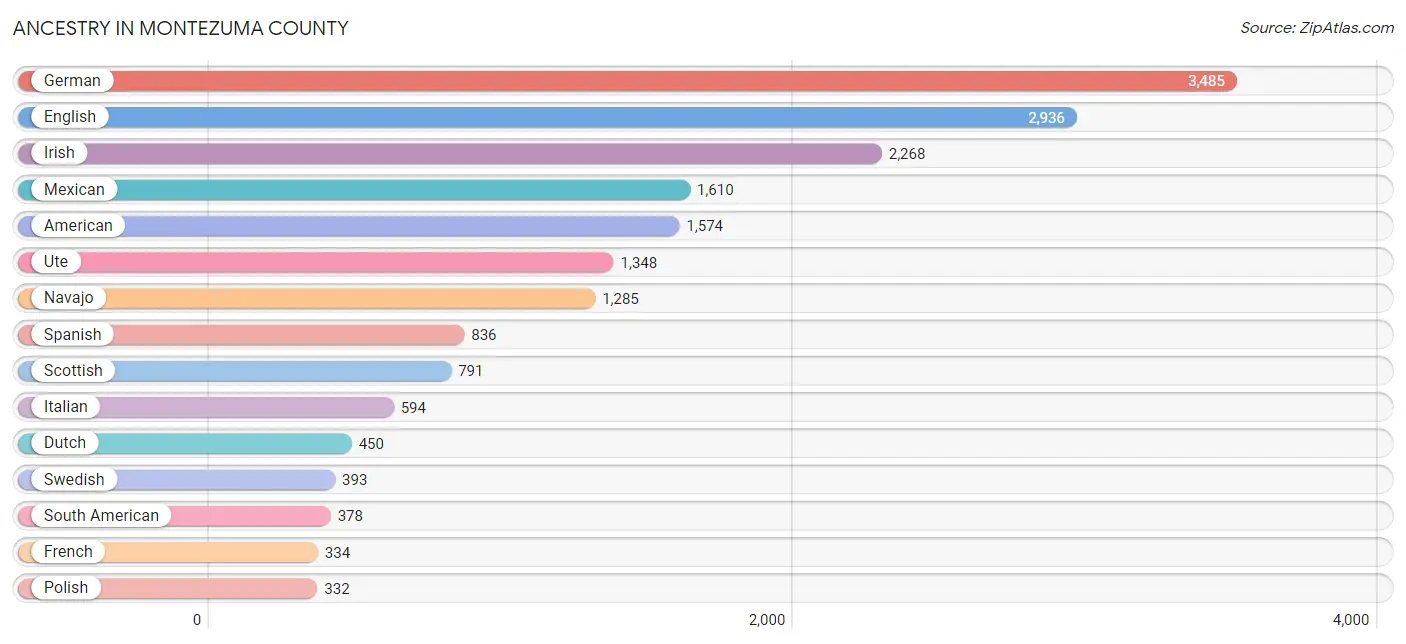
Ancestry in Montezuma County
The most populous ancestries reported in Montezuma County are German (3,485 | 13.4%), English (2,936 | 11.3%), Irish (2,268 | 8.7%), Mexican (1,610 | 6.2%), and American (1,574 | 6.0%), together accounting for 45.6% of all Montezuma County residents.
| Ancestry | # Population | % Population |
| African | 62 | 0.2% |
| American | 1,574 | 6.0% |
| Apache | 34 | 0.1% |
| Arab | 29 | 0.1% |
| Argentinean | 202 | 0.8% |
| Australian | 9 | 0.0% |
| Austrian | 23 | 0.1% |
| Bhutanese | 21 | 0.1% |
| Blackfeet | 27 | 0.1% |
| British | 197 | 0.8% |
| Canadian | 47 | 0.2% |
| Celtic | 9 | 0.0% |
| Central American | 16 | 0.1% |
| Central American Indian | 132 | 0.5% |
| Cherokee | 324 | 1.2% |
| Chippewa | 25 | 0.1% |
| Choctaw | 38 | 0.2% |
| Colombian | 25 | 0.1% |
| Croatian | 10 | 0.0% |
| Czech | 140 | 0.5% |
| Czechoslovakian | 11 | 0.0% |
| Danish | 88 | 0.3% |
| Dutch | 450 | 1.7% |
| Eastern European | 30 | 0.1% |
| English | 2,936 | 11.3% |
| European | 306 | 1.2% |
| Finnish | 63 | 0.2% |
| French | 334 | 1.3% |
| French Canadian | 72 | 0.3% |
| German | 3,485 | 13.4% |
| Greek | 58 | 0.2% |
| Hungarian | 77 | 0.3% |
| Indian (Asian) | 132 | 0.5% |
| Irish | 2,268 | 8.7% |
| Italian | 594 | 2.3% |
| Japanese | 17 | 0.1% |
| Korean | 66 | 0.3% |
| Laotian | 6 | 0.0% |
| Lebanese | 29 | 0.1% |
| Lithuanian | 10 | 0.0% |
| Mexican | 1,610 | 6.2% |
| Native Hawaiian | 10 | 0.0% |
| Navajo | 1,285 | 4.9% |
| Nicaraguan | 16 | 0.1% |
| Northern European | 66 | 0.3% |
| Norwegian | 242 | 0.9% |
| Osage | 18 | 0.1% |
| Pakistani | 18 | 0.1% |
| Pennsylvania German | 10 | 0.0% |
| Peruvian | 151 | 0.6% |
| Polish | 332 | 1.3% |
| Portuguese | 133 | 0.5% |
| Pueblo | 71 | 0.3% |
| Puerto Rican | 78 | 0.3% |
| Romanian | 4 | 0.0% |
| Russian | 151 | 0.6% |
| Scandinavian | 167 | 0.6% |
| Scotch-Irish | 193 | 0.7% |
| Scottish | 791 | 3.0% |
| Serbian | 11 | 0.0% |
| Sioux | 13 | 0.1% |
| Slavic | 10 | 0.0% |
| Slovak | 10 | 0.0% |
| Slovene | 9 | 0.0% |
| Somali | 5 | 0.0% |
| South African | 2 | 0.0% |
| South American | 378 | 1.5% |
| Spaniard | 177 | 0.7% |
| Spanish | 836 | 3.2% |
| Spanish American | 55 | 0.2% |
| Subsaharan African | 69 | 0.3% |
| Swedish | 393 | 1.5% |
| Swiss | 3 | 0.0% |
| Ukrainian | 12 | 0.1% |
| Ute | 1,348 | 5.2% |
| Welsh | 101 | 0.4% | View All 76 Rows |
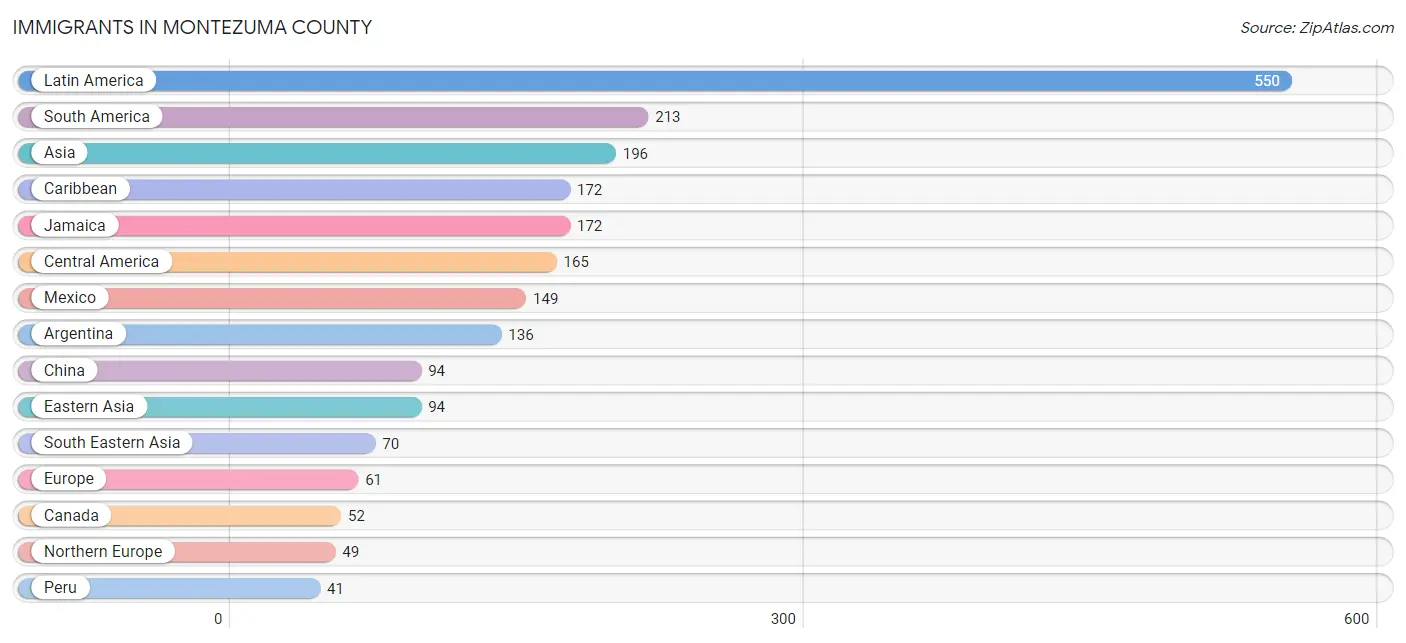
Immigrants in Montezuma County
The most numerous immigrant groups reported in Montezuma County came from Latin America (550 | 2.1%), South America (213 | 0.8%), Asia (196 | 0.7%), Caribbean (172 | 0.7%), and Jamaica (172 | 0.7%), together accounting for 5.0% of all Montezuma County residents.
| Immigration Origin | # Population | % Population |
| Africa | 4 | 0.0% |
| Argentina | 136 | 0.5% |
| Asia | 196 | 0.7% |
| Australia | 9 | 0.0% |
| Bangladesh | 29 | 0.1% |
| Cambodia | 17 | 0.1% |
| Canada | 52 | 0.2% |
| Caribbean | 172 | 0.7% |
| Central America | 165 | 0.6% |
| China | 94 | 0.4% |
| Colombia | 25 | 0.1% |
| Eastern Africa | 2 | 0.0% |
| Eastern Asia | 94 | 0.4% |
| Eastern Europe | 4 | 0.0% |
| England | 16 | 0.1% |
| Europe | 61 | 0.2% |
| Germany | 8 | 0.0% |
| Guyana | 11 | 0.0% |
| Israel | 3 | 0.0% |
| Jamaica | 172 | 0.7% |
| Latin America | 550 | 2.1% |
| Mexico | 149 | 0.6% |
| Nicaragua | 16 | 0.1% |
| Northern Europe | 49 | 0.2% |
| Oceania | 9 | 0.0% |
| Peru | 41 | 0.2% |
| Philippines | 36 | 0.1% |
| Poland | 4 | 0.0% |
| South Africa | 2 | 0.0% |
| South America | 213 | 0.8% |
| South Central Asia | 29 | 0.1% |
| South Eastern Asia | 70 | 0.3% |
| Sweden | 13 | 0.1% |
| Thailand | 17 | 0.1% |
| Western Asia | 3 | 0.0% |
| Western Europe | 8 | 0.0% |
| Zimbabwe | 2 | 0.0% | View All 37 Rows |
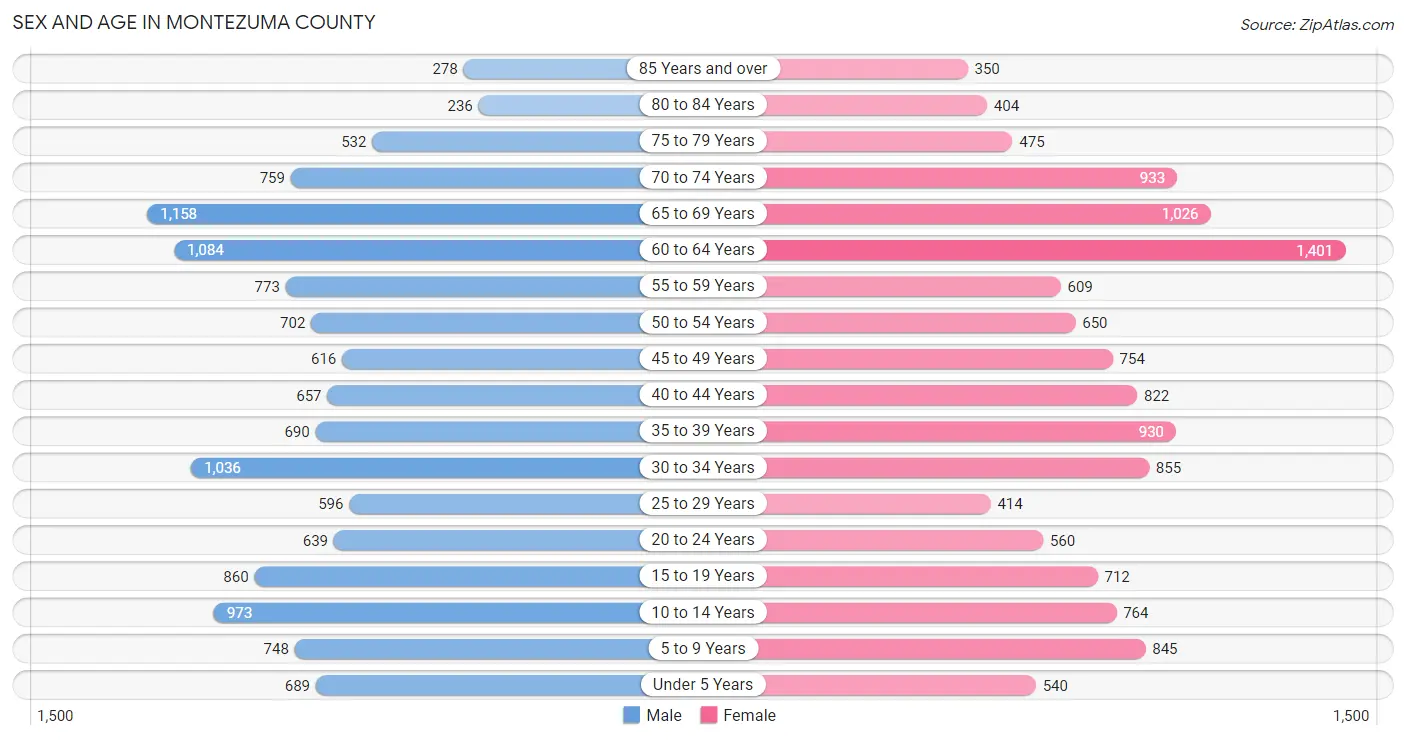
Sex and Age in Montezuma County
Sex and Age in Montezuma County
The most populous age groups in Montezuma County are 65 to 69 Years (1,158 | 8.9%) for men and 60 to 64 Years (1,401 | 10.7%) for women.
| Age Bracket | Male | Female |
| Under 5 Years | 689 (5.3%) | 540 (4.1%) |
| 5 to 9 Years | 748 (5.7%) | 845 (6.5%) |
| 10 to 14 Years | 973 (7.5%) | 764 (5.9%) |
| 15 to 19 Years | 860 (6.6%) | 712 (5.5%) |
| 20 to 24 Years | 639 (4.9%) | 560 (4.3%) |
| 25 to 29 Years | 596 (4.6%) | 414 (3.2%) |
| 30 to 34 Years | 1,036 (8.0%) | 855 (6.6%) |
| 35 to 39 Years | 690 (5.3%) | 930 (7.1%) |
| 40 to 44 Years | 657 (5.0%) | 822 (6.3%) |
| 45 to 49 Years | 616 (4.7%) | 754 (5.8%) |
| 50 to 54 Years | 702 (5.4%) | 650 (5.0%) |
| 55 to 59 Years | 773 (5.9%) | 609 (4.7%) |
| 60 to 64 Years | 1,084 (8.3%) | 1,401 (10.7%) |
| 65 to 69 Years | 1,158 (8.9%) | 1,026 (7.9%) |
| 70 to 74 Years | 759 (5.8%) | 933 (7.1%) |
| 75 to 79 Years | 532 (4.1%) | 475 (3.6%) |
| 80 to 84 Years | 236 (1.8%) | 404 (3.1%) |
| 85 Years and over | 278 (2.1%) | 350 (2.7%) |
| Total | 13,026 (100.0%) | 13,044 (100.0%) |
Families and Households in Montezuma County
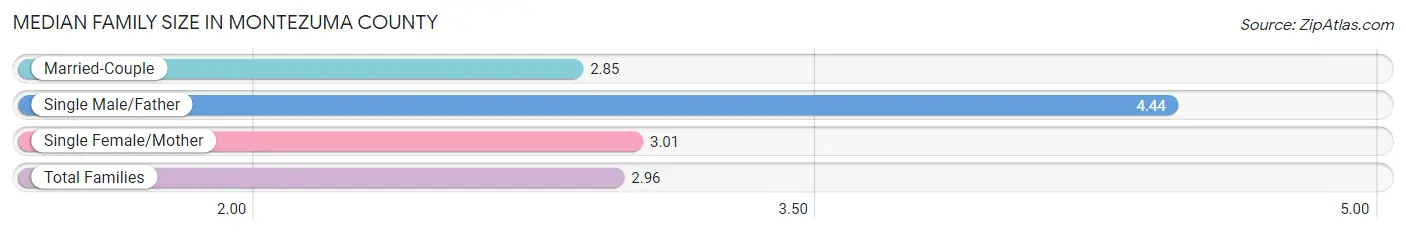
Median Family Size in Montezuma County
The median family size in Montezuma County is 2.96 persons per family, with single male/father families (368 | 5.2%) accounting for the largest median family size of 4.44 persons per family. On the other hand, married-couple families (5,519 | 78.3%) represent the smallest median family size with 2.85 persons per family.
| Family Type | # Families | Family Size |
| Married-Couple | 5,519 (78.3%) | 2.85 |
| Single Male/Father | 368 (5.2%) | 4.44 |
| Single Female/Mother | 1,161 (16.5%) | 3.01 |
| Total Families | 7,048 (100.0%) | 2.96 |
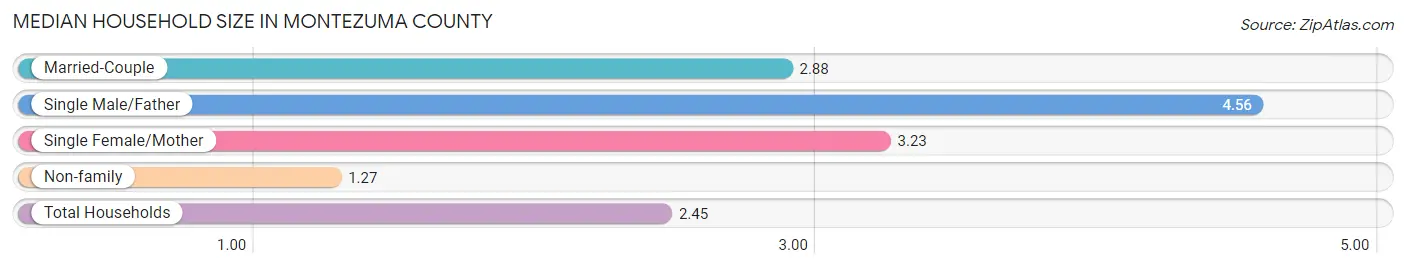
Median Household Size in Montezuma County
The median household size in Montezuma County is 2.45 persons per household, with single male/father households (368 | 3.5%) accounting for the largest median household size of 4.56 persons per household. non-family households (3,472 | 33.0%) represent the smallest median household size with 1.27 persons per household.
| Household Type | # Households | Household Size |
| Married-Couple | 5,519 (52.5%) | 2.88 |
| Single Male/Father | 368 (3.5%) | 4.56 |
| Single Female/Mother | 1,161 (11.0%) | 3.23 |
| Non-family | 3,472 (33.0%) | 1.27 |
| Total Households | 10,520 (100.0%) | 2.45 |
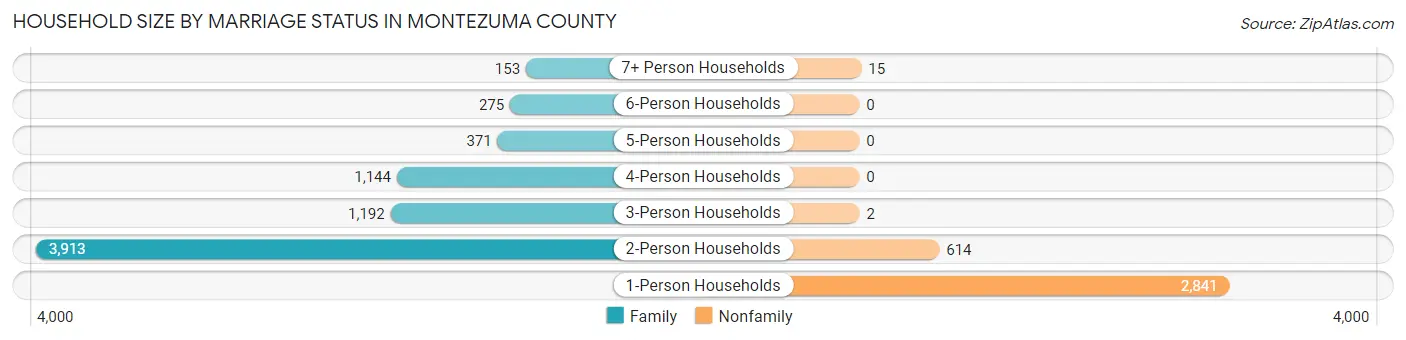
Household Size by Marriage Status in Montezuma County
Out of a total of 10,520 households in Montezuma County, 7,048 (67.0%) are family households, while 3,472 (33.0%) are nonfamily households. The most numerous type of family households are 2-person households, comprising 3,913, and the most common type of nonfamily households are 1-person households, comprising 2,841.
| Household Size | Family Households | Nonfamily Households |
| 1-Person Households | - | 2,841 (27.0%) |
| 2-Person Households | 3,913 (37.2%) | 614 (5.8%) |
| 3-Person Households | 1,192 (11.3%) | 2 (0.0%) |
| 4-Person Households | 1,144 (10.9%) | 0 (0.0%) |
| 5-Person Households | 371 (3.5%) | 0 (0.0%) |
| 6-Person Households | 275 (2.6%) | 0 (0.0%) |
| 7+ Person Households | 153 (1.5%) | 15 (0.1%) |
| Total | 7,048 (67.0%) | 3,472 (33.0%) |
Female Fertility in Montezuma County
Fertility by Age in Montezuma County
Average fertility rate in Montezuma County is 74.0 births per 1,000 women. Women in the age bracket of 20 to 34 years have the highest fertility rate with 92.0 births per 1,000 women. Women in the age bracket of 35 to 50 years acount for 55.8% of all women with births.
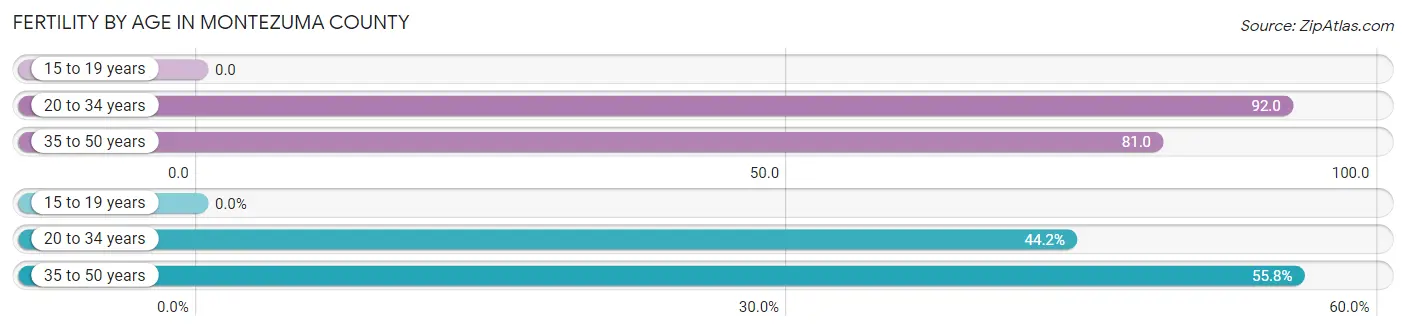
| Age Bracket | Women with Births | Births / 1,000 Women |
| 15 to 19 years | 0 (0.0%) | 0.0 |
| 20 to 34 years | 168 (44.2%) | 92.0 |
| 35 to 50 years | 212 (55.8%) | 81.0 |
| Total | 380 (100.0%) | 74.0 |
Fertility by Age by Marriage Status in Montezuma County
42.9% of women with births (380) in Montezuma County are married. The highest percentage of unmarried women with births falls into 35 to 50 years age bracket with 92.4% of them unmarried at the time of birth, while the lowest percentage of unmarried women with births belong to 20 to 34 years age bracket with 12.5% of them unmarried.
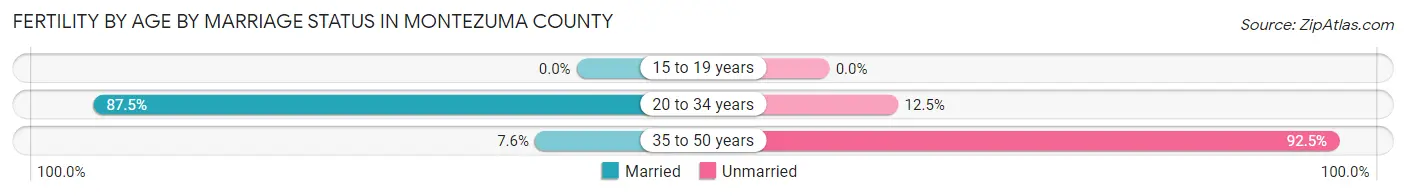
| Age Bracket | Married | Unmarried |
| 15 to 19 years | 0 (0.0%) | 0 (0.0%) |
| 20 to 34 years | 147 (87.5%) | 21 (12.5%) |
| 35 to 50 years | 16 (7.5%) | 196 (92.4%) |
| Total | 163 (42.9%) | 217 (57.1%) |
Fertility by Education in Montezuma County
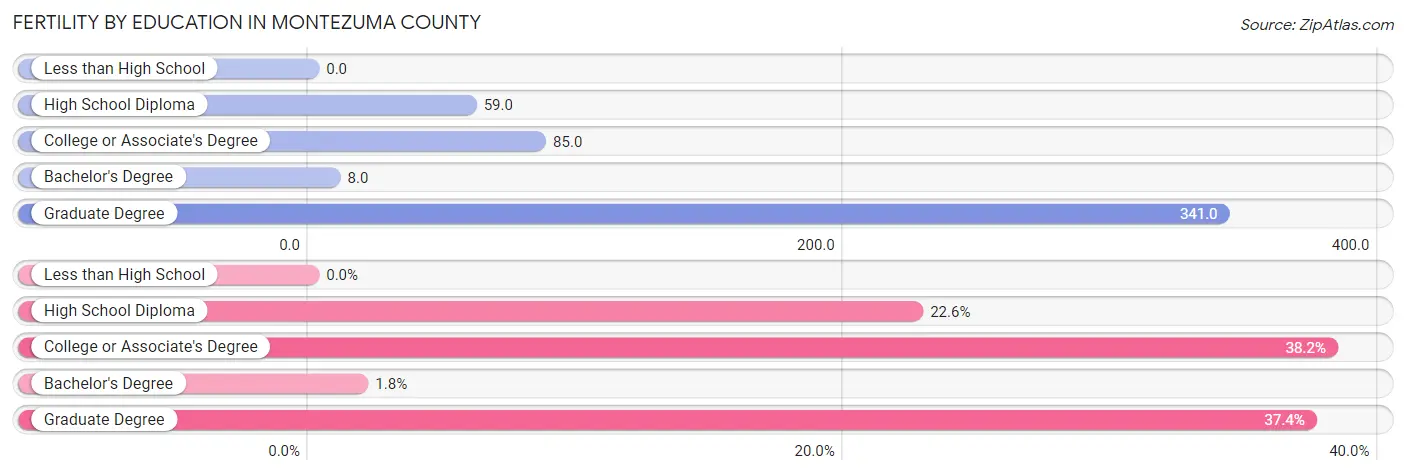
| Educational Attainment | Women with Births | Births / 1,000 Women |
| Less than High School | 0 (0.0%) | 0.0 |
| High School Diploma | 86 (22.6%) | 59.0 |
| College or Associate's Degree | 145 (38.2%) | 85.0 |
| Bachelor's Degree | 7 (1.8%) | 8.0 |
| Graduate Degree | 142 (37.4%) | 341.0 |
| Total | 380 (100.0%) | 74.0 |
Fertility by Education by Marriage Status in Montezuma County
57.1% of women with births in Montezuma County are unmarried. Women with the educational attainment of college or associate's degree are most likely to be married with 80.0% of them married at childbirth, while women with the educational attainment of bachelor's degree are least likely to be married with 100.0% of them unmarried at childbirth.
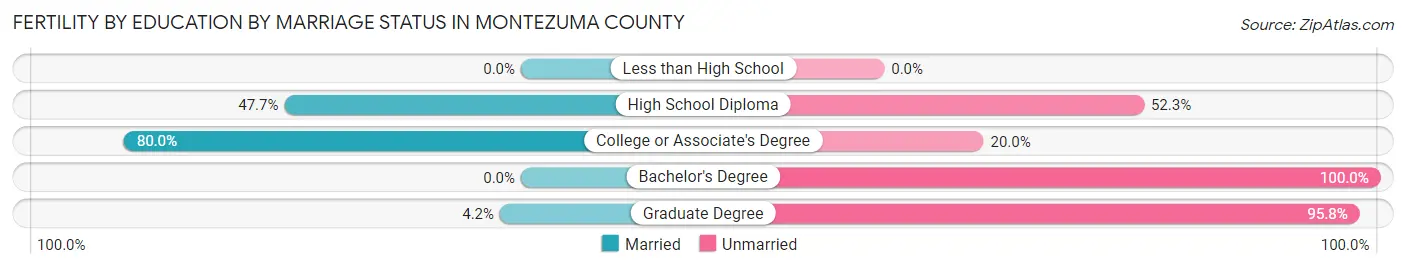
| Educational Attainment | Married | Unmarried |
| Less than High School | 0 (0.0%) | 0 (0.0%) |
| High School Diploma | 41 (47.7%) | 45 (52.3%) |
| College or Associate's Degree | 116 (80.0%) | 29 (20.0%) |
| Bachelor's Degree | 0 (0.0%) | 7 (100.0%) |
| Graduate Degree | 6 (4.2%) | 136 (95.8%) |
| Total | 163 (42.9%) | 217 (57.1%) |
Income in Montezuma County
Income Overview in Montezuma County
Per Capita Income in Montezuma County is $31,044, while median incomes of families and households are $72,887 and $61,377 respectively.
| Characteristic | Number | Measure |
| Per Capita Income | 26,070 | $31,044 |
| Median Family Income | 7,048 | $72,887 |
| Mean Family Income | 7,048 | $88,839 |
| Median Household Income | 10,520 | $61,377 |
| Mean Household Income | 10,520 | $76,273 |
| Income Deficit | 7,048 | $0 |
| Wage / Income Gap (%) | 26,070 | 16.51% |
| Wage / Income Gap ($) | 26,070 | 83.49¢ per $1 |
| Gini / Inequality Index | 26,070 | 0.42 |
Earnings by Sex in Montezuma County
Average Earnings in Montezuma County are $33,136, $35,830 for men and $29,916 for women, a difference of 16.5%.
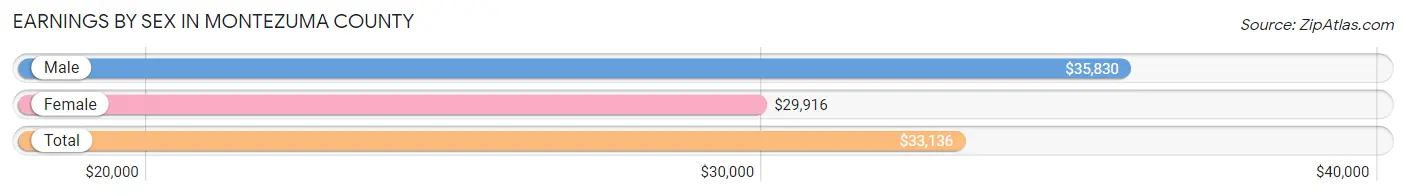
| Sex | Number | Average Earnings |
| Male | 6,559 (54.1%) | $35,830 |
| Female | 5,561 (45.9%) | $29,916 |
| Total | 12,120 (100.0%) | $33,136 |
Earnings by Sex by Income Bracket in Montezuma County
The most common earnings brackets in Montezuma County are $25,000 to $29,999 for men (922 | 14.1%) and $40,000 to $44,999 for women (414 | 7.4%).
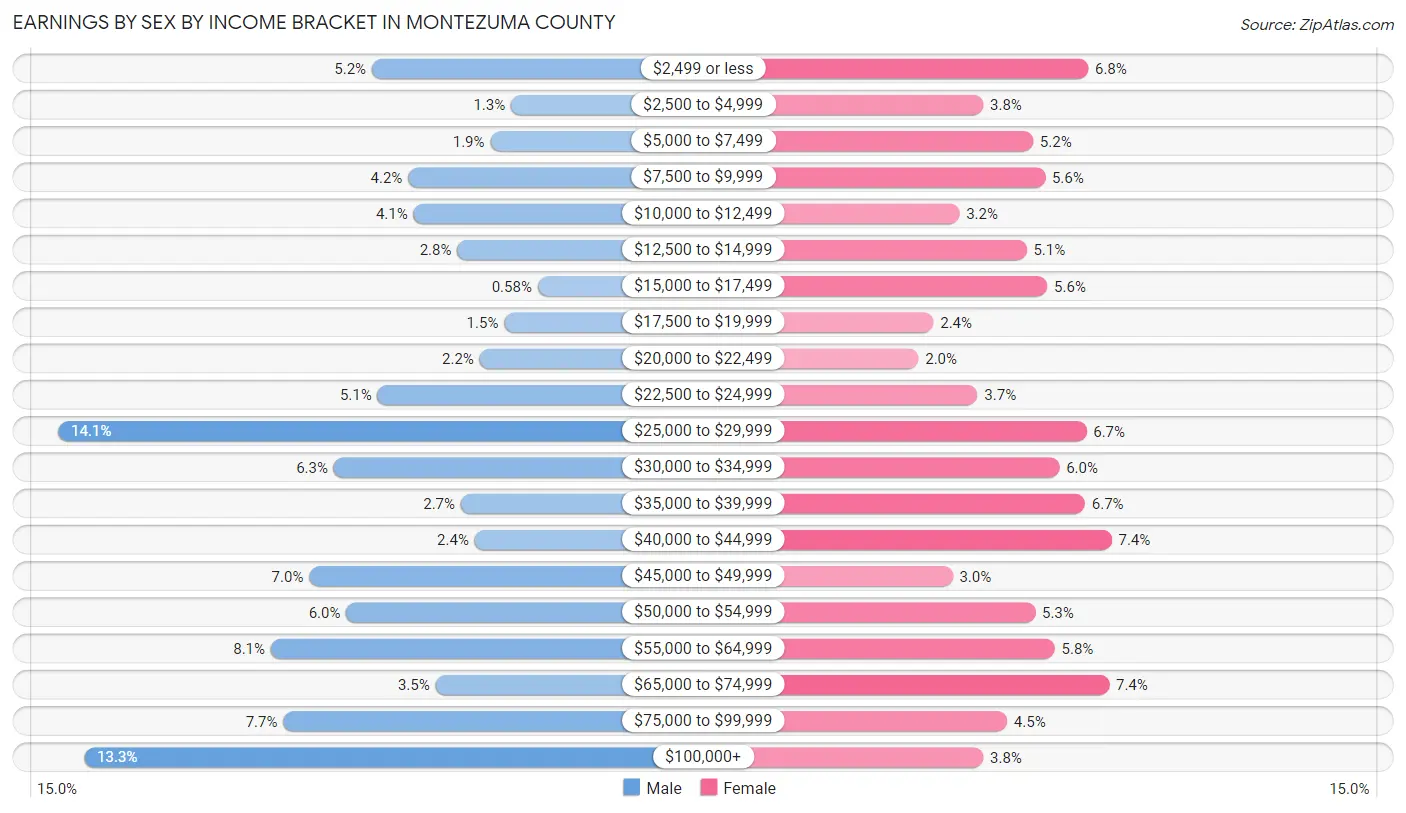
| Income | Male | Female |
| $2,499 or less | 344 (5.2%) | 377 (6.8%) |
| $2,500 to $4,999 | 87 (1.3%) | 213 (3.8%) |
| $5,000 to $7,499 | 125 (1.9%) | 291 (5.2%) |
| $7,500 to $9,999 | 277 (4.2%) | 310 (5.6%) |
| $10,000 to $12,499 | 267 (4.1%) | 176 (3.2%) |
| $12,500 to $14,999 | 186 (2.8%) | 281 (5.1%) |
| $15,000 to $17,499 | 38 (0.6%) | 313 (5.6%) |
| $17,500 to $19,999 | 100 (1.5%) | 135 (2.4%) |
| $20,000 to $22,499 | 145 (2.2%) | 112 (2.0%) |
| $22,500 to $24,999 | 333 (5.1%) | 204 (3.7%) |
| $25,000 to $29,999 | 922 (14.1%) | 374 (6.7%) |
| $30,000 to $34,999 | 414 (6.3%) | 332 (6.0%) |
| $35,000 to $39,999 | 180 (2.7%) | 372 (6.7%) |
| $40,000 to $44,999 | 154 (2.4%) | 414 (7.4%) |
| $45,000 to $49,999 | 459 (7.0%) | 165 (3.0%) |
| $50,000 to $54,999 | 391 (6.0%) | 294 (5.3%) |
| $55,000 to $64,999 | 530 (8.1%) | 325 (5.8%) |
| $65,000 to $74,999 | 226 (3.5%) | 410 (7.4%) |
| $75,000 to $99,999 | 507 (7.7%) | 250 (4.5%) |
| $100,000+ | 874 (13.3%) | 213 (3.8%) |
| Total | 6,559 (100.0%) | 5,561 (100.0%) |
Earnings by Sex by Educational Attainment in Montezuma County
Average earnings in Montezuma County are $45,461 for men and $33,374 for women, a difference of 26.6%. Men with an educational attainment of graduate degree enjoy the highest average annual earnings of $54,013, while those with less than high school education earn the least with $25,948. Women with an educational attainment of graduate degree earn the most with the average annual earnings of $67,635, while those with less than high school education have the smallest earnings of $22,050.
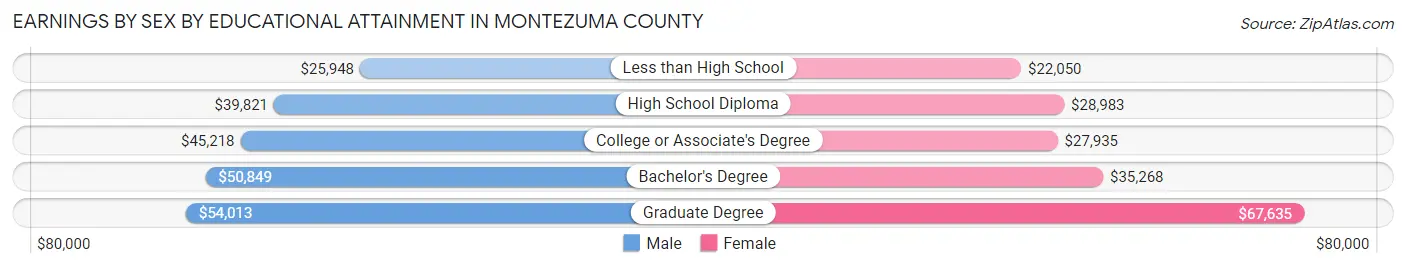
| Educational Attainment | Male Income | Female Income |
| Less than High School | $25,948 | $22,050 |
| High School Diploma | $39,821 | $28,983 |
| College or Associate's Degree | $45,218 | $27,935 |
| Bachelor's Degree | $50,849 | $35,268 |
| Graduate Degree | $54,013 | $67,635 |
| Total | $45,461 | $33,374 |
Family Income in Montezuma County
Family Income Brackets in Montezuma County
According to the Montezuma County family income data, there are 1,656 families falling into the $50,000 to $74,999 income range, which is the most common income bracket and makes up 23.5% of all families. Conversely, the $10,000 to $14,999 income bracket is the least frequent group with only 70 families (1.0%) belonging to this category.
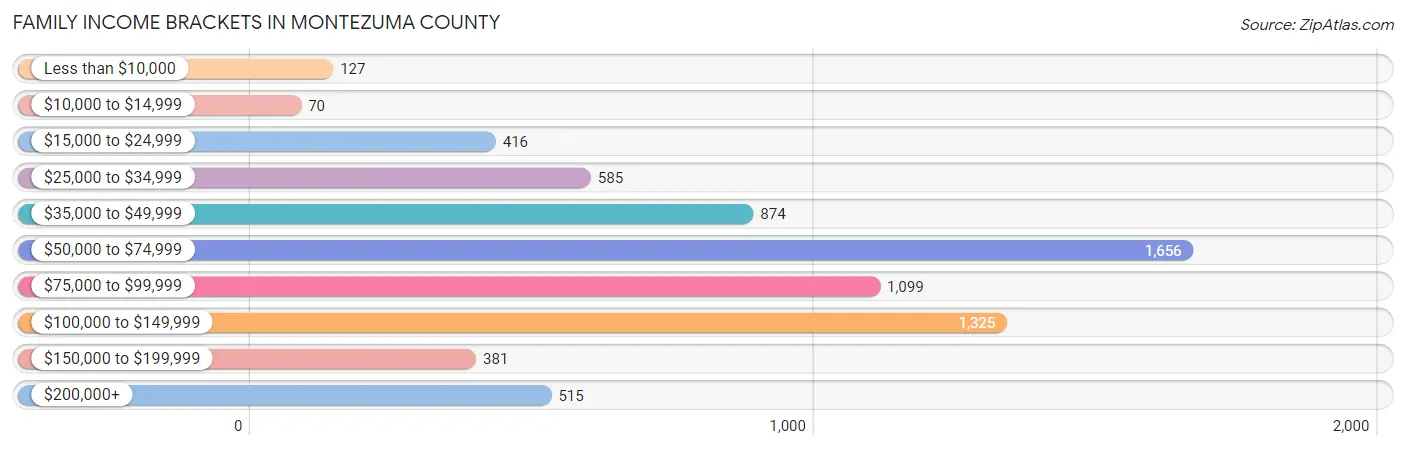
| Income Bracket | # Families | % Families |
| Less than $10,000 | 127 | 1.8% |
| $10,000 to $14,999 | 70 | 1.0% |
| $15,000 to $24,999 | 416 | 5.9% |
| $25,000 to $34,999 | 585 | 8.3% |
| $35,000 to $49,999 | 874 | 12.4% |
| $50,000 to $74,999 | 1,656 | 23.5% |
| $75,000 to $99,999 | 1,099 | 15.6% |
| $100,000 to $149,999 | 1,325 | 18.8% |
| $150,000 to $199,999 | 381 | 5.4% |
| $200,000+ | 515 | 7.3% |
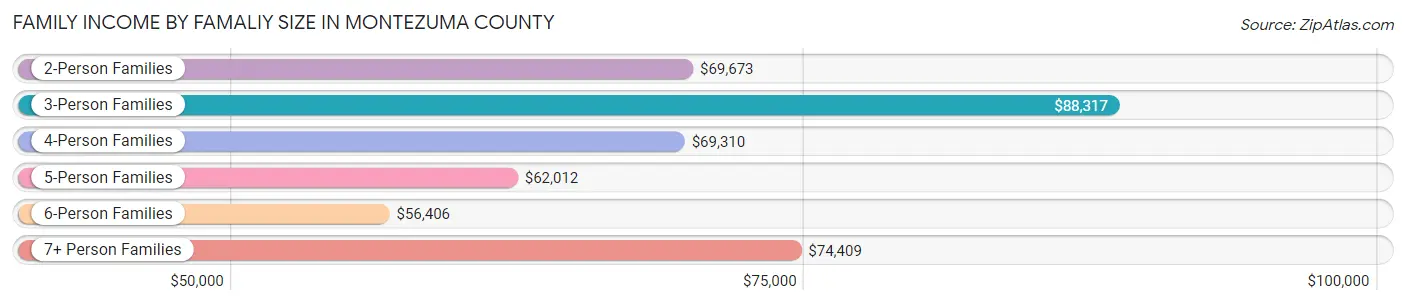
Family Income by Famaliy Size in Montezuma County
3-person families (1,147 | 16.3%) account for the highest median family income in Montezuma County with $88,317 per family, while 2-person families (4,134 | 58.7%) have the highest median income of $34,836 per family member.
| Income Bracket | # Families | Median Income |
| 2-Person Families | 4,134 (58.7%) | $69,673 |
| 3-Person Families | 1,147 (16.3%) | $88,317 |
| 4-Person Families | 970 (13.8%) | $69,310 |
| 5-Person Families | 369 (5.2%) | $62,012 |
| 6-Person Families | 332 (4.7%) | $56,406 |
| 7+ Person Families | 96 (1.4%) | $74,409 |
| Total | 7,048 (100.0%) | $72,887 |
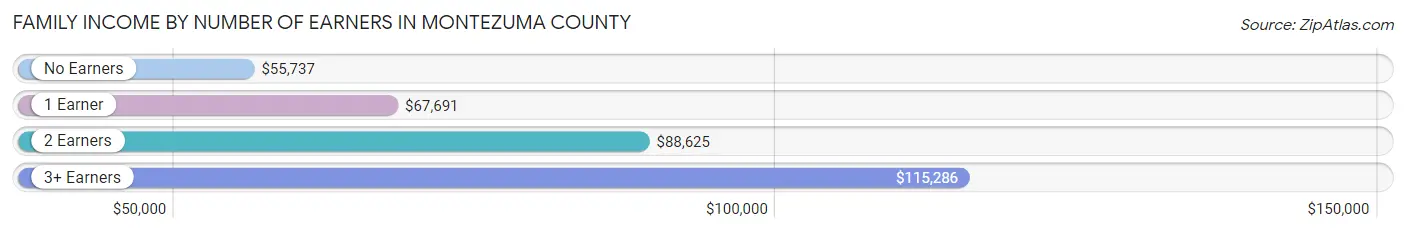
Family Income by Number of Earners in Montezuma County
The median family income in Montezuma County is $72,887, with families comprising 3+ earners (304) having the highest median family income of $115,286, while families with no earners (1,463) have the lowest median family income of $55,737, accounting for 4.3% and 20.8% of families, respectively.
| Number of Earners | # Families | Median Income |
| No Earners | 1,463 (20.8%) | $55,737 |
| 1 Earner | 2,532 (35.9%) | $67,691 |
| 2 Earners | 2,749 (39.0%) | $88,625 |
| 3+ Earners | 304 (4.3%) | $115,286 |
| Total | 7,048 (100.0%) | $72,887 |
Household Income in Montezuma County
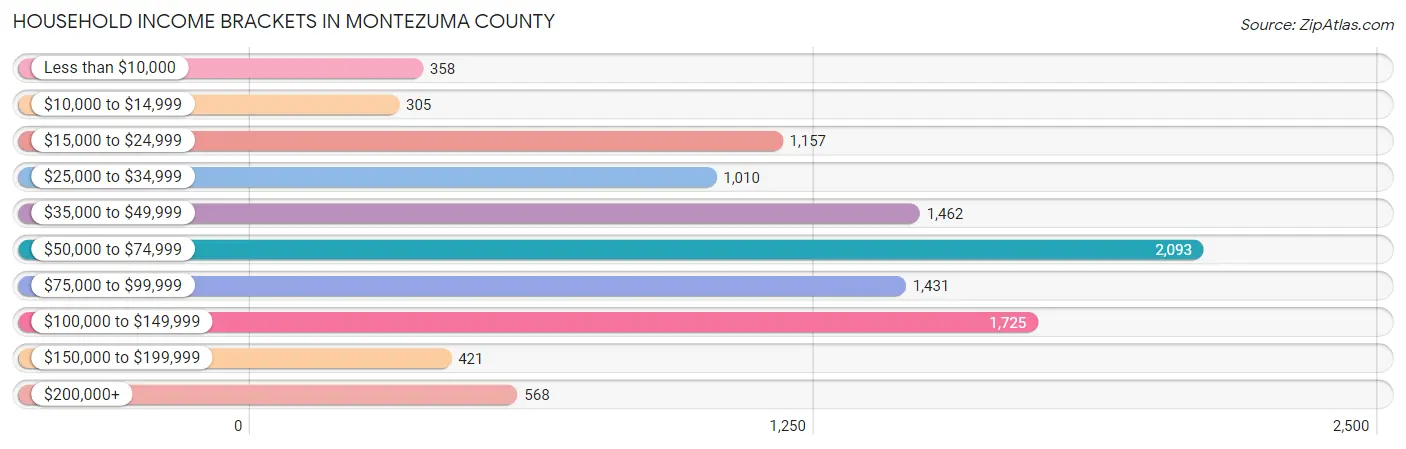
Household Income Brackets in Montezuma County
With 2,093 households falling in the category, the $50,000 to $74,999 income range is the most frequent in Montezuma County, accounting for 19.9% of all households. In contrast, only 305 households (2.9%) fall into the $10,000 to $14,999 income bracket, making it the least populous group.
| Income Bracket | # Households | % Households |
| Less than $10,000 | 358 | 3.4% |
| $10,000 to $14,999 | 305 | 2.9% |
| $15,000 to $24,999 | 1,157 | 11.0% |
| $25,000 to $34,999 | 1,010 | 9.6% |
| $35,000 to $49,999 | 1,462 | 13.9% |
| $50,000 to $74,999 | 2,093 | 19.9% |
| $75,000 to $99,999 | 1,431 | 13.6% |
| $100,000 to $149,999 | 1,725 | 16.4% |
| $150,000 to $199,999 | 421 | 4.0% |
| $200,000+ | 568 | 5.4% |
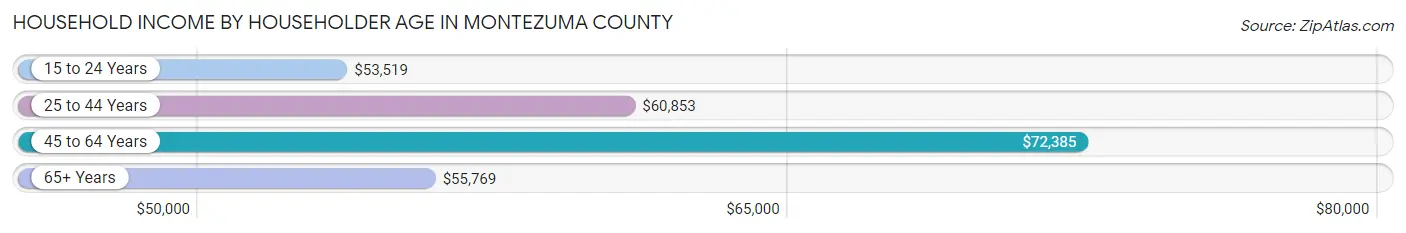
Household Income by Householder Age in Montezuma County
The median household income in Montezuma County is $61,377, with the highest median household income of $72,385 found in the 45 to 64 years age bracket for the primary householder. A total of 3,460 households (32.9%) fall into this category. Meanwhile, the 15 to 24 years age bracket for the primary householder has the lowest median household income of $53,519, with 250 households (2.4%) in this group.
| Income Bracket | # Households | Median Income |
| 15 to 24 Years | 250 (2.4%) | $53,519 |
| 25 to 44 Years | 2,865 (27.2%) | $60,853 |
| 45 to 64 Years | 3,460 (32.9%) | $72,385 |
| 65+ Years | 3,945 (37.5%) | $55,769 |
| Total | 10,520 (100.0%) | $61,377 |
Poverty in Montezuma County
Income Below Poverty by Sex and Age in Montezuma County
With 12.8% poverty level for males and 12.3% for females among the residents of Montezuma County, under 5 year old males and 18 to 24 year old females are the most vulnerable to poverty, with 199 males (30.2%) and 227 females (28.0%) in their respective age groups living below the poverty level.
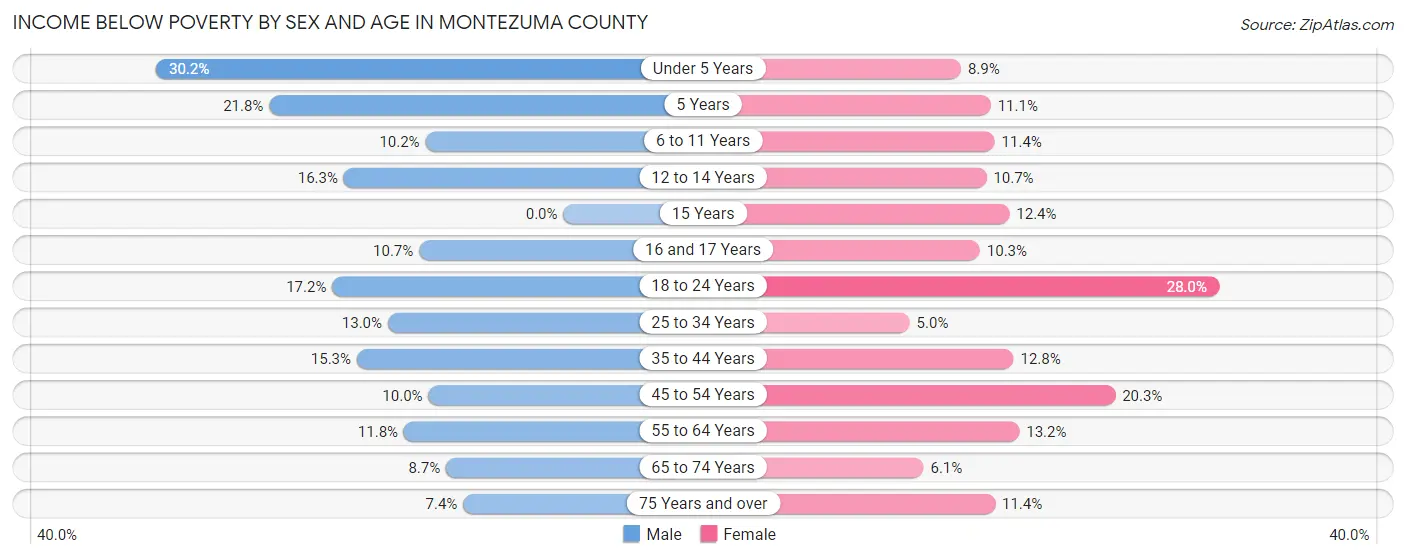
| Age Bracket | Male | Female |
| Under 5 Years | 199 (30.2%) | 44 (8.8%) |
| 5 Years | 38 (21.8%) | 24 (11.1%) |
| 6 to 11 Years | 98 (10.2%) | 106 (11.4%) |
| 12 to 14 Years | 96 (16.3%) | 45 (10.7%) |
| 15 Years | 0 (0.0%) | 27 (12.4%) |
| 16 and 17 Years | 36 (10.7%) | 25 (10.2%) |
| 18 to 24 Years | 174 (17.2%) | 227 (28.0%) |
| 25 to 34 Years | 212 (13.0%) | 63 (5.0%) |
| 35 to 44 Years | 203 (15.3%) | 222 (12.8%) |
| 45 to 54 Years | 132 (10.0%) | 285 (20.3%) |
| 55 to 64 Years | 219 (11.8%) | 265 (13.2%) |
| 65 to 74 Years | 166 (8.7%) | 117 (6.1%) |
| 75 Years and over | 76 (7.4%) | 132 (11.4%) |
| Total | 1,649 (12.8%) | 1,582 (12.3%) |
Income Above Poverty by Sex and Age in Montezuma County
According to the poverty statistics in Montezuma County, males aged 15 years and females aged 25 to 34 years are the age groups that are most secure financially, with 100.0% of males and 95.0% of females in these age groups living above the poverty line.
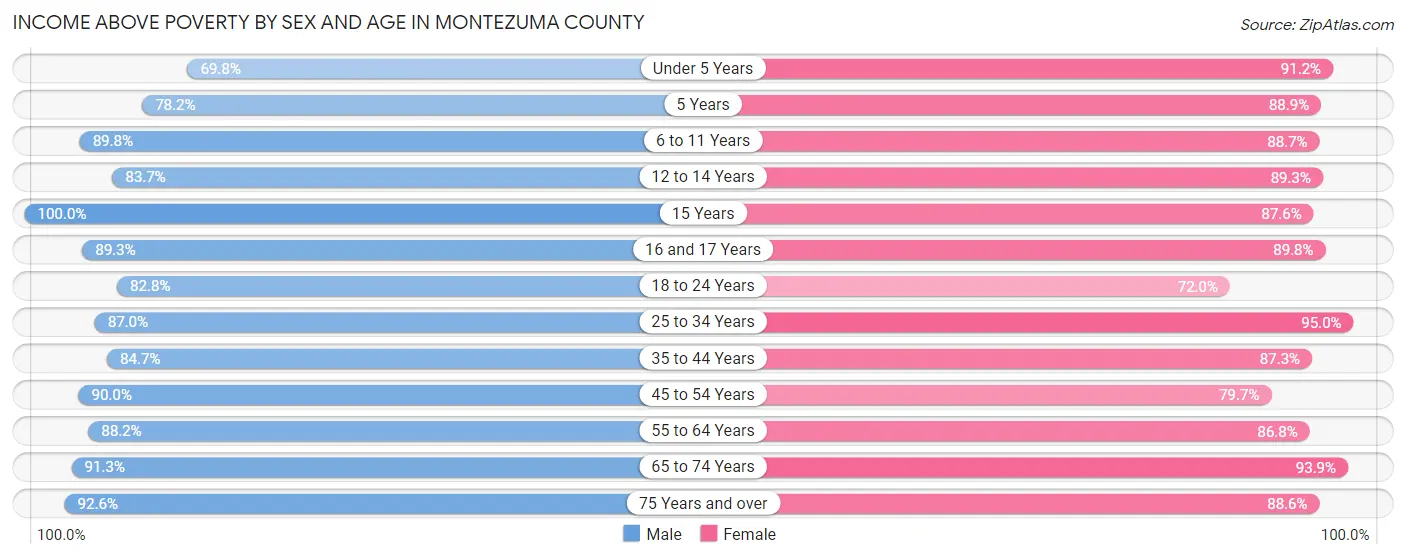
| Age Bracket | Male | Female |
| Under 5 Years | 459 (69.8%) | 453 (91.1%) |
| 5 Years | 136 (78.2%) | 193 (88.9%) |
| 6 to 11 Years | 859 (89.8%) | 828 (88.6%) |
| 12 to 14 Years | 493 (83.7%) | 374 (89.3%) |
| 15 Years | 147 (100.0%) | 190 (87.6%) |
| 16 and 17 Years | 300 (89.3%) | 219 (89.7%) |
| 18 to 24 Years | 840 (82.8%) | 584 (72.0%) |
| 25 to 34 Years | 1,415 (87.0%) | 1,188 (95.0%) |
| 35 to 44 Years | 1,121 (84.7%) | 1,519 (87.3%) |
| 45 to 54 Years | 1,186 (90.0%) | 1,119 (79.7%) |
| 55 to 64 Years | 1,631 (88.2%) | 1,745 (86.8%) |
| 65 to 74 Years | 1,739 (91.3%) | 1,811 (93.9%) |
| 75 Years and over | 946 (92.6%) | 1,028 (88.6%) |
| Total | 11,272 (87.2%) | 11,251 (87.7%) |
Income Below Poverty Among Married-Couple Families in Montezuma County
The poverty statistics for married-couple families in Montezuma County show that 5.6% or 308 of the total 5,519 families live below the poverty line. Families with 3 or 4 children have the highest poverty rate of 19.7%, comprising of 61 families. On the other hand, families with no children have the lowest poverty rate of 3.8%, which includes 142 families.
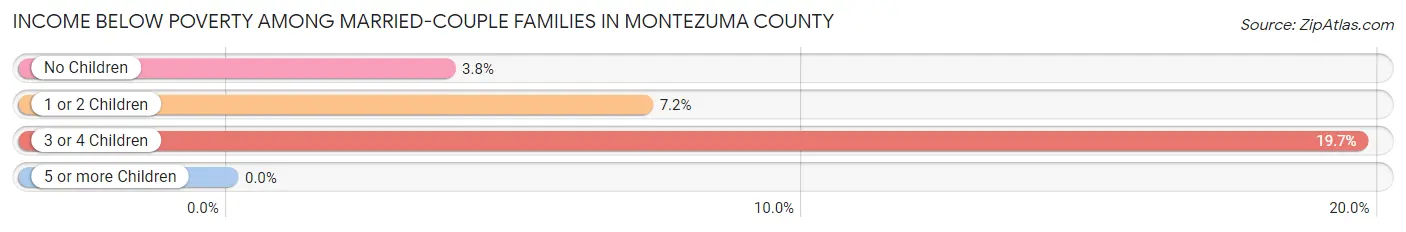
| Children | Above Poverty | Below Poverty |
| No Children | 3,612 (96.2%) | 142 (3.8%) |
| 1 or 2 Children | 1,350 (92.8%) | 105 (7.2%) |
| 3 or 4 Children | 249 (80.3%) | 61 (19.7%) |
| 5 or more Children | 0 (0.0%) | 0 (0.0%) |
| Total | 5,211 (94.4%) | 308 (5.6%) |
Income Below Poverty Among Single-Parent Households in Montezuma County
According to the poverty data in Montezuma County, 12.0% or 44 single-father households and 17.1% or 198 single-mother households are living below the poverty line. Among single-father households, those with 5 or more children have the highest poverty rate, with 28 households (100.0%) experiencing poverty. Likewise, among single-mother households, those with 3 or 4 children have the highest poverty rate, with 75 households (39.9%) falling below the poverty line.
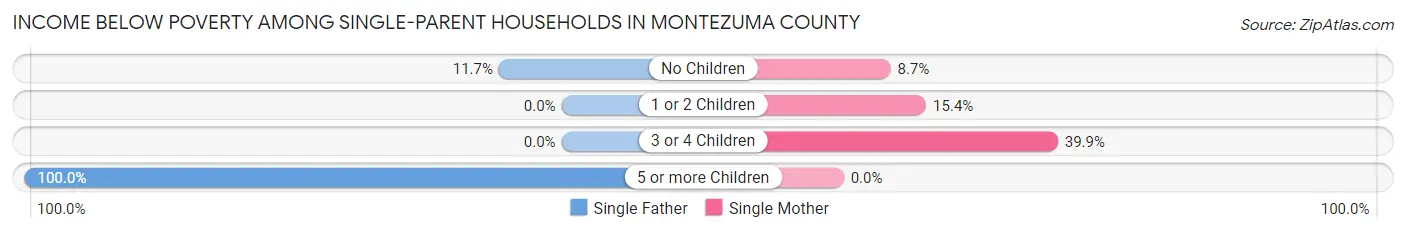
| Children | Single Father | Single Mother |
| No Children | 16 (11.7%) | 29 (8.7%) |
| 1 or 2 Children | 0 (0.0%) | 94 (15.4%) |
| 3 or 4 Children | 0 (0.0%) | 75 (39.9%) |
| 5 or more Children | 28 (100.0%) | 0 (0.0%) |
| Total | 44 (12.0%) | 198 (17.1%) |
Income Below Poverty Among Married-Couple vs Single-Parent Households in Montezuma County
The poverty data for Montezuma County shows that 308 of the married-couple family households (5.6%) and 242 of the single-parent households (15.8%) are living below the poverty level. Within the married-couple family households, those with 3 or 4 children have the highest poverty rate, with 61 households (19.7%) falling below the poverty line. Among the single-parent households, those with 5 or more children have the highest poverty rate, with 28 household (49.1%) living below poverty.
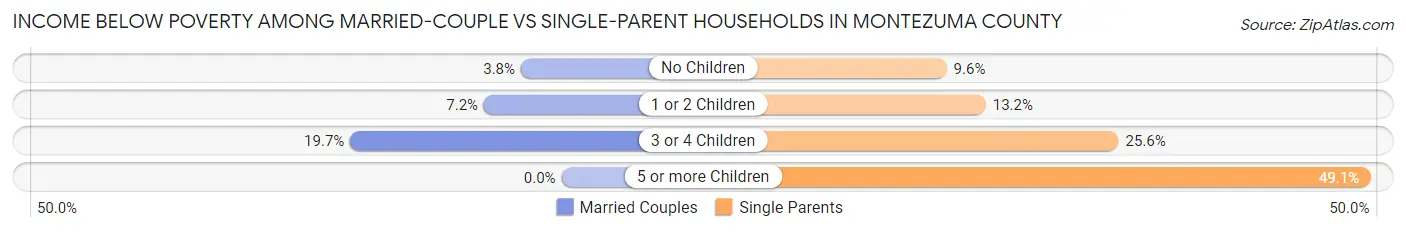
| Children | Married-Couple Families | Single-Parent Households |
| No Children | 142 (3.8%) | 45 (9.6%) |
| 1 or 2 Children | 105 (7.2%) | 94 (13.2%) |
| 3 or 4 Children | 61 (19.7%) | 75 (25.6%) |
| 5 or more Children | 0 (0.0%) | 28 (49.1%) |
| Total | 308 (5.6%) | 242 (15.8%) |
Employment Characteristics in Montezuma County
Employment by Class of Employer in Montezuma County
Among the 10,741 employed individuals in Montezuma County, private company employees (5,940 | 55.3%), local government employees (1,381 | 12.9%), and not-for-profit organizations (782 | 7.3%) make up the most common classes of employment.
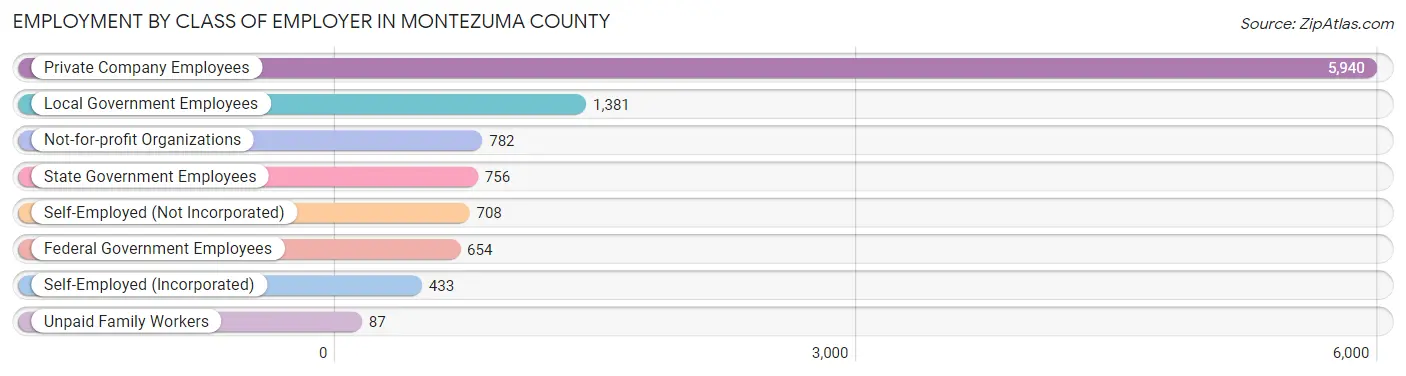
| Employer Class | # Employees | % Employees |
| Private Company Employees | 5,940 | 55.3% |
| Self-Employed (Incorporated) | 433 | 4.0% |
| Self-Employed (Not Incorporated) | 708 | 6.6% |
| Not-for-profit Organizations | 782 | 7.3% |
| Local Government Employees | 1,381 | 12.9% |
| State Government Employees | 756 | 7.0% |
| Federal Government Employees | 654 | 6.1% |
| Unpaid Family Workers | 87 | 0.8% |
| Total | 10,741 | 100.0% |
Employment Status by Age in Montezuma County
According to the labor force statistics for Montezuma County, out of the total population over 16 years of age (21,147), 53.8% or 11,377 individuals are in the labor force, with 4.4% or 501 of them unemployed. The age group with the highest labor force participation rate is 45 to 54 years, with 78.7% or 2,142 individuals in the labor force. Within the labor force, the 16 to 19 years age range has the highest percentage of unemployed individuals, with 20.5% or 113 of them being unemployed.
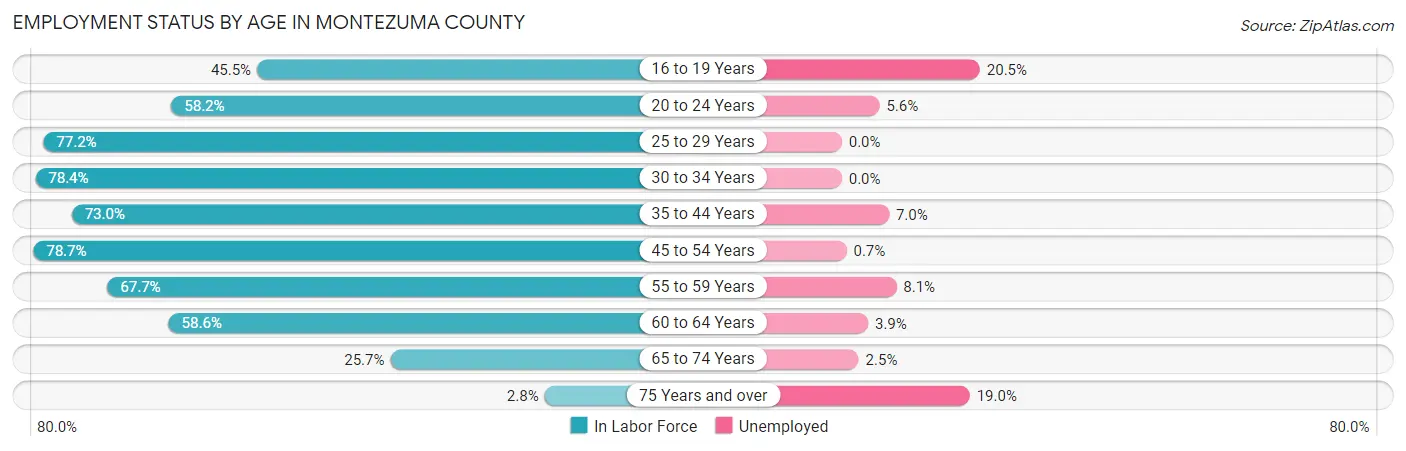
| Age Bracket | In Labor Force | Unemployed |
| 16 to 19 Years | 550 (45.5%) | 113 (20.5%) |
| 20 to 24 Years | 698 (58.2%) | 39 (5.6%) |
| 25 to 29 Years | 780 (77.2%) | 0 (0.0%) |
| 30 to 34 Years | 1,483 (78.4%) | 0 (0.0%) |
| 35 to 44 Years | 2,262 (73.0%) | 158 (7.0%) |
| 45 to 54 Years | 2,142 (78.7%) | 15 (0.7%) |
| 55 to 59 Years | 936 (67.7%) | 76 (8.1%) |
| 60 to 64 Years | 1,456 (58.6%) | 57 (3.9%) |
| 65 to 74 Years | 996 (25.7%) | 25 (2.5%) |
| 75 Years and over | 64 (2.8%) | 12 (19.0%) |
| Total | 11,377 (53.8%) | 501 (4.4%) |
Employment Status by Educational Attainment in Montezuma County
According to labor force statistics for Montezuma County, 72.0% of individuals (9,064) out of the total population between 25 and 64 years of age (12,589) are in the labor force, with 3.4% or 308 of them being unemployed. The group with the highest labor force participation rate are those with the educational attainment of bachelor's degree or higher, with 89.1% or 3,175 individuals in the labor force. Within the labor force, individuals with college / associate degree education have the highest percentage of unemployment, with 7.0% or 163 of them being unemployed.
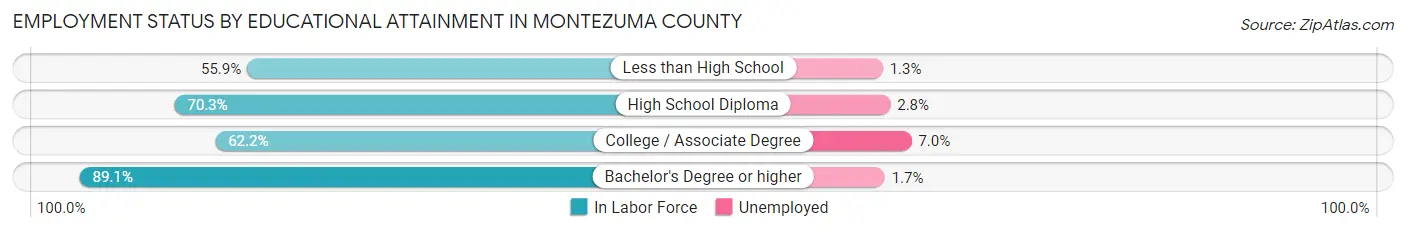
| Educational Attainment | In Labor Force | Unemployed |
| Less than High School | 614 (55.9%) | 14 (1.3%) |
| High School Diploma | 2,938 (70.3%) | 117 (2.8%) |
| College / Associate Degree | 2,331 (62.2%) | 262 (7.0%) |
| Bachelor's Degree or higher | 3,175 (89.1%) | 61 (1.7%) |
| Total | 9,064 (72.0%) | 428 (3.4%) |
Employment Occupations by Sex in Montezuma County
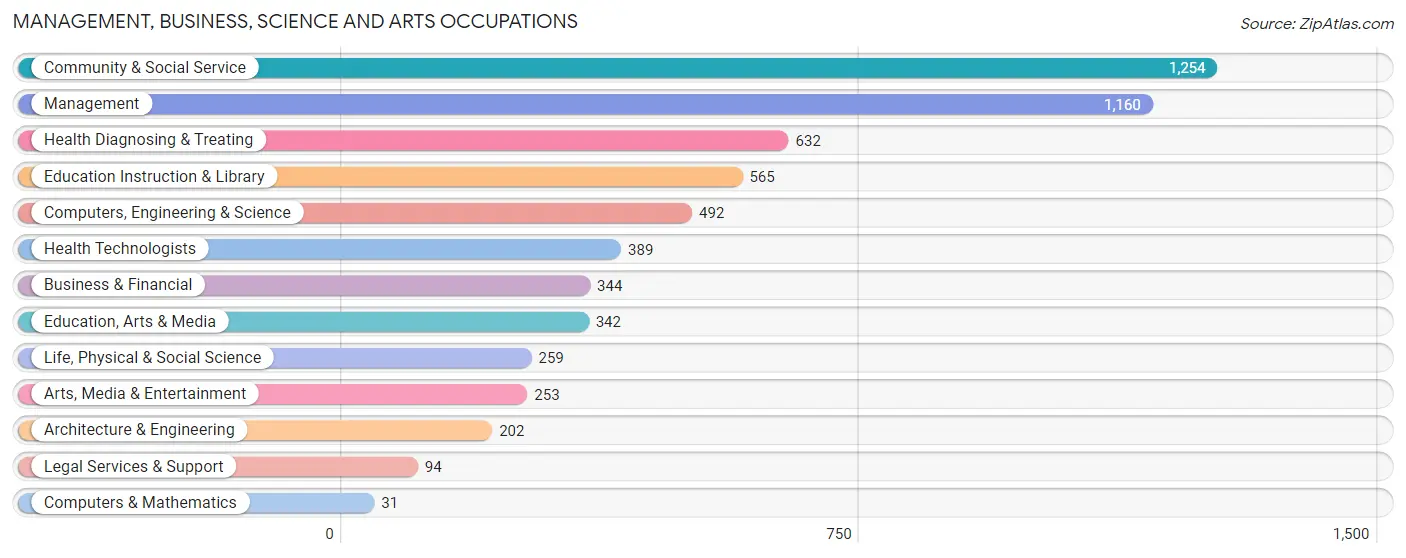
Management, Business, Science and Arts Occupations
The most common Management, Business, Science and Arts occupations in Montezuma County are Community & Social Service (1,254 | 11.5%), Management (1,160 | 10.7%), Health Diagnosing & Treating (632 | 5.8%), Education Instruction & Library (565 | 5.2%), and Computers, Engineering & Science (492 | 4.5%).
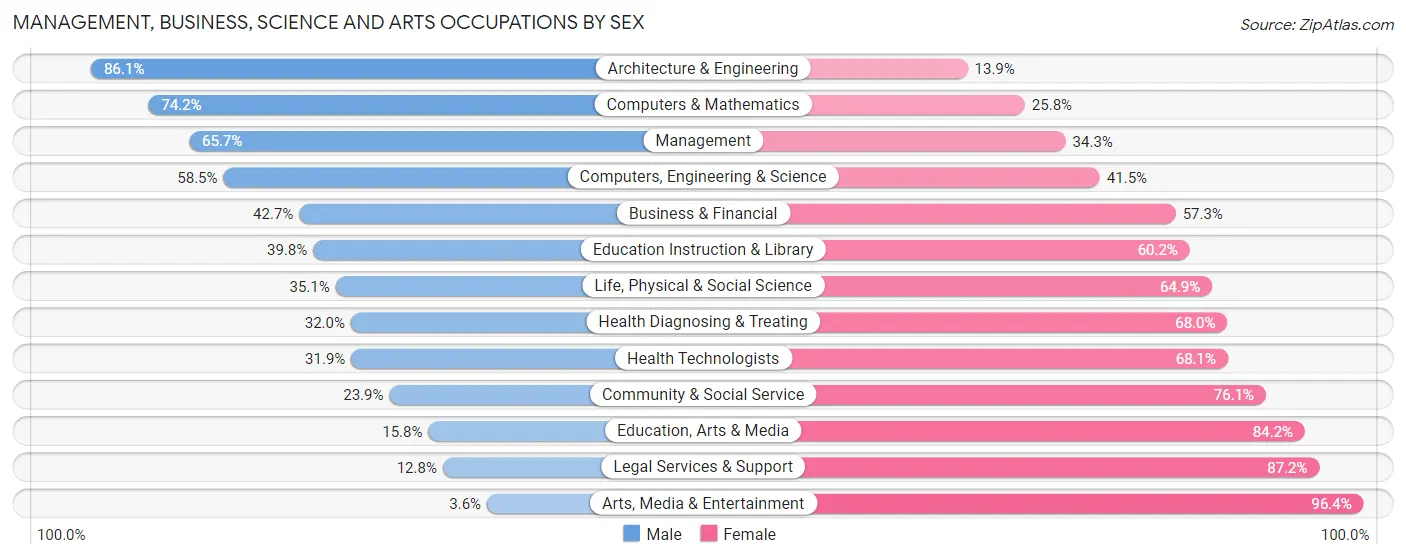
Management, Business, Science and Arts Occupations by Sex
Within the Management, Business, Science and Arts occupations in Montezuma County, the most male-oriented occupations are Architecture & Engineering (86.1%), Computers & Mathematics (74.2%), and Management (65.7%), while the most female-oriented occupations are Arts, Media & Entertainment (96.4%), Legal Services & Support (87.2%), and Education, Arts & Media (84.2%).
| Occupation | Male | Female |
| Management | 762 (65.7%) | 398 (34.3%) |
| Business & Financial | 147 (42.7%) | 197 (57.3%) |
| Computers, Engineering & Science | 288 (58.5%) | 204 (41.5%) |
| Computers & Mathematics | 23 (74.2%) | 8 (25.8%) |
| Architecture & Engineering | 174 (86.1%) | 28 (13.9%) |
| Life, Physical & Social Science | 91 (35.1%) | 168 (64.9%) |
| Community & Social Service | 300 (23.9%) | 954 (76.1%) |
| Education, Arts & Media | 54 (15.8%) | 288 (84.2%) |
| Legal Services & Support | 12 (12.8%) | 82 (87.2%) |
| Education Instruction & Library | 225 (39.8%) | 340 (60.2%) |
| Arts, Media & Entertainment | 9 (3.6%) | 244 (96.4%) |
| Health Diagnosing & Treating | 202 (32.0%) | 430 (68.0%) |
| Health Technologists | 124 (31.9%) | 265 (68.1%) |
| Total (Category) | 1,699 (43.8%) | 2,183 (56.2%) |
| Total (Overall) | 5,838 (53.7%) | 5,033 (46.3%) |
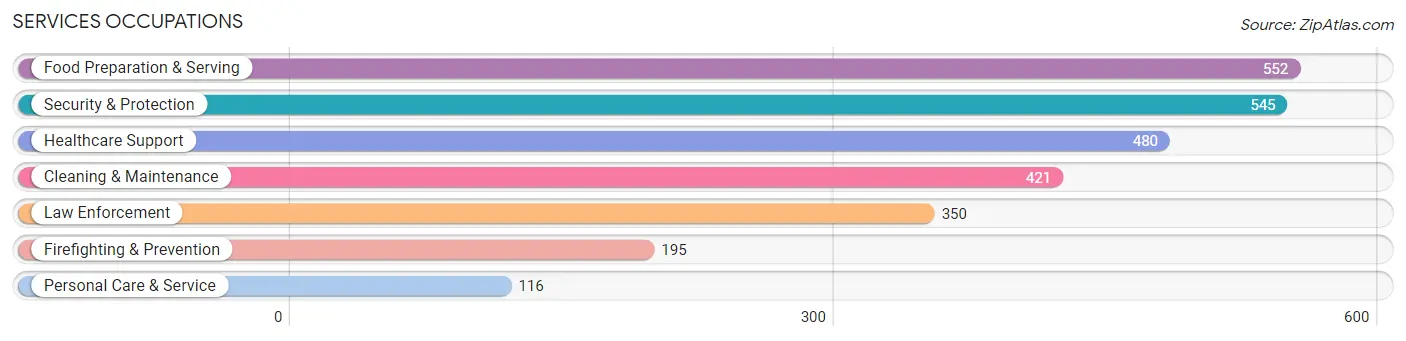
Services Occupations
The most common Services occupations in Montezuma County are Food Preparation & Serving (552 | 5.1%), Security & Protection (545 | 5.0%), Healthcare Support (480 | 4.4%), Cleaning & Maintenance (421 | 3.9%), and Law Enforcement (350 | 3.2%).
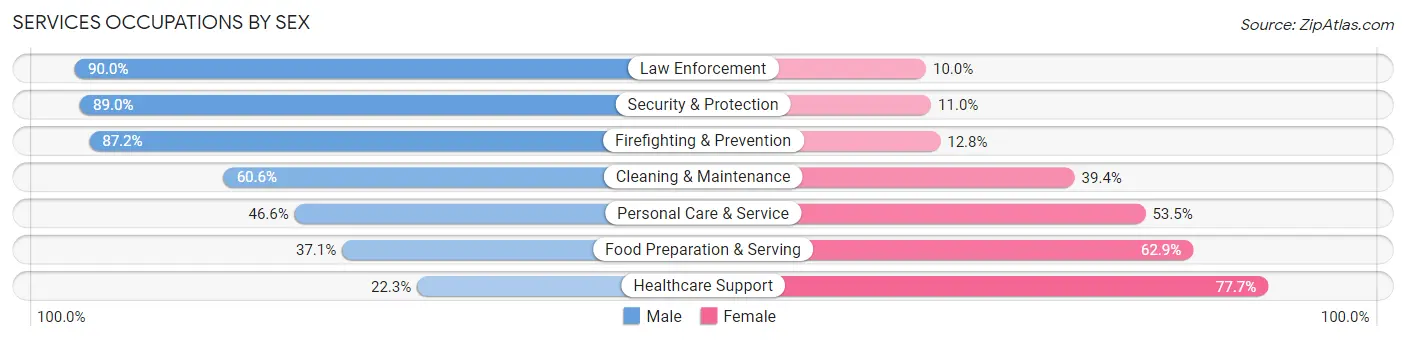
Services Occupations by Sex
Within the Services occupations in Montezuma County, the most male-oriented occupations are Law Enforcement (90.0%), Security & Protection (89.0%), and Firefighting & Prevention (87.2%), while the most female-oriented occupations are Healthcare Support (77.7%), Food Preparation & Serving (62.9%), and Personal Care & Service (53.4%).
| Occupation | Male | Female |
| Healthcare Support | 107 (22.3%) | 373 (77.7%) |
| Security & Protection | 485 (89.0%) | 60 (11.0%) |
| Firefighting & Prevention | 170 (87.2%) | 25 (12.8%) |
| Law Enforcement | 315 (90.0%) | 35 (10.0%) |
| Food Preparation & Serving | 205 (37.1%) | 347 (62.9%) |
| Cleaning & Maintenance | 255 (60.6%) | 166 (39.4%) |
| Personal Care & Service | 54 (46.6%) | 62 (53.4%) |
| Total (Category) | 1,106 (52.3%) | 1,008 (47.7%) |
| Total (Overall) | 5,838 (53.7%) | 5,033 (46.3%) |
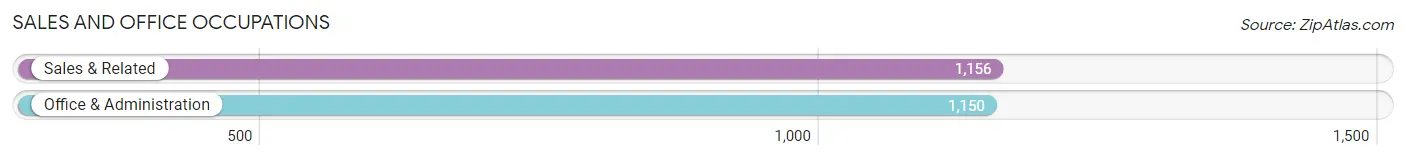
Sales and Office Occupations
The most common Sales and Office occupations in Montezuma County are Sales & Related (1,156 | 10.6%), and Office & Administration (1,150 | 10.6%).
Sales and Office Occupations by Sex
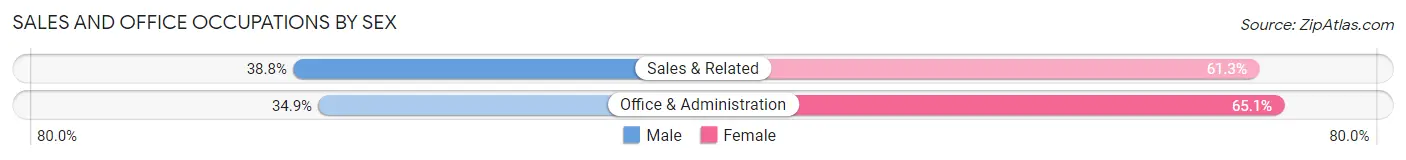
| Occupation | Male | Female |
| Sales & Related | 448 (38.8%) | 708 (61.3%) |
| Office & Administration | 401 (34.9%) | 749 (65.1%) |
| Total (Category) | 849 (36.8%) | 1,457 (63.2%) |
| Total (Overall) | 5,838 (53.7%) | 5,033 (46.3%) |
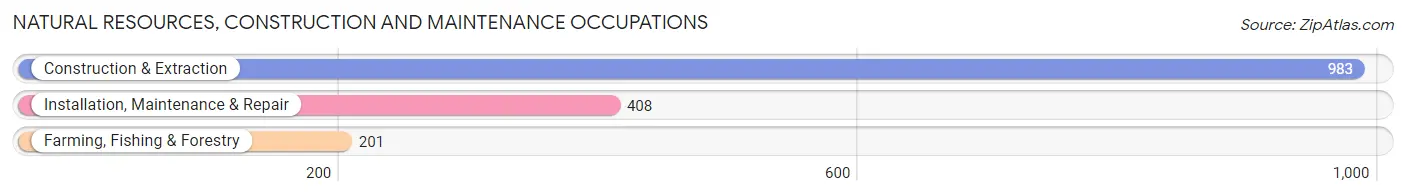
Natural Resources, Construction and Maintenance Occupations
The most common Natural Resources, Construction and Maintenance occupations in Montezuma County are Construction & Extraction (983 | 9.0%), Installation, Maintenance & Repair (408 | 3.7%), and Farming, Fishing & Forestry (201 | 1.8%).
Natural Resources, Construction and Maintenance Occupations by Sex
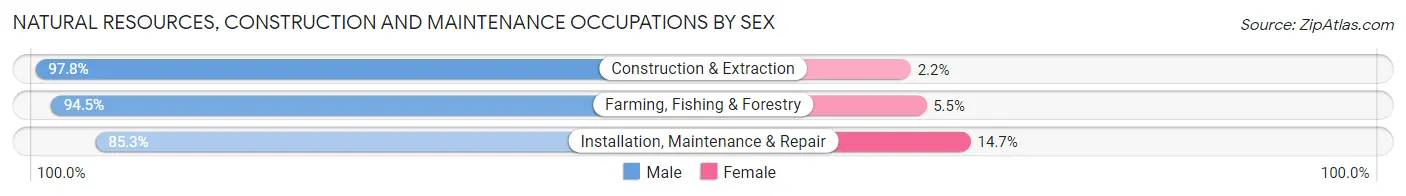
| Occupation | Male | Female |
| Farming, Fishing & Forestry | 190 (94.5%) | 11 (5.5%) |
| Construction & Extraction | 961 (97.8%) | 22 (2.2%) |
| Installation, Maintenance & Repair | 348 (85.3%) | 60 (14.7%) |
| Total (Category) | 1,499 (94.2%) | 93 (5.8%) |
| Total (Overall) | 5,838 (53.7%) | 5,033 (46.3%) |
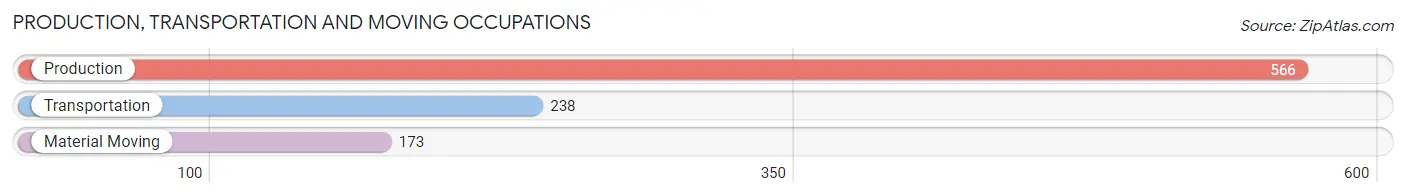
Production, Transportation and Moving Occupations
The most common Production, Transportation and Moving occupations in Montezuma County are Production (566 | 5.2%), Transportation (238 | 2.2%), and Material Moving (173 | 1.6%).
Production, Transportation and Moving Occupations by Sex
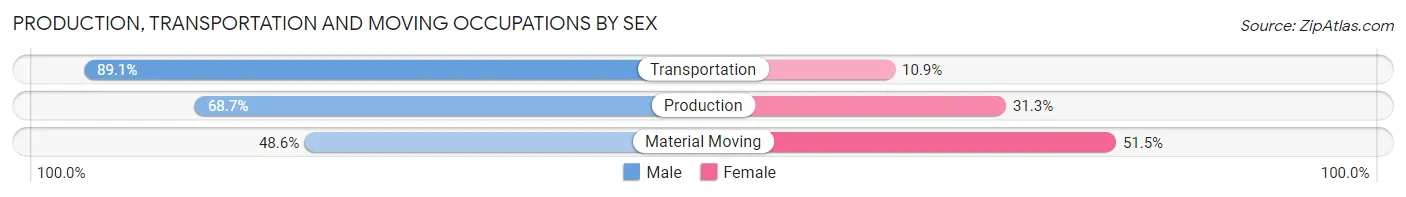
| Occupation | Male | Female |
| Production | 389 (68.7%) | 177 (31.3%) |
| Transportation | 212 (89.1%) | 26 (10.9%) |
| Material Moving | 84 (48.5%) | 89 (51.4%) |
| Total (Category) | 685 (70.1%) | 292 (29.9%) |
| Total (Overall) | 5,838 (53.7%) | 5,033 (46.3%) |
Employment Industries by Sex in Montezuma County
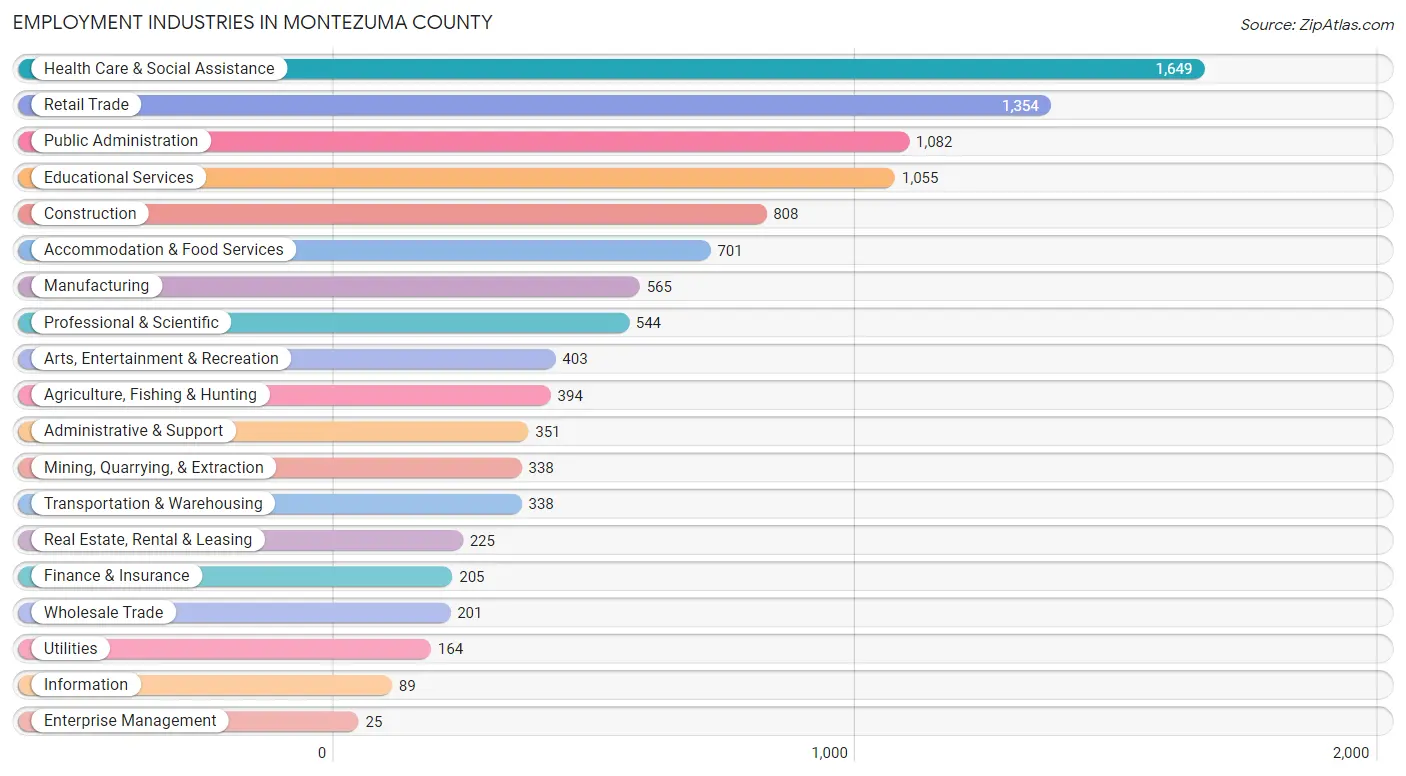
Employment Industries in Montezuma County
The major employment industries in Montezuma County include Health Care & Social Assistance (1,649 | 15.2%), Retail Trade (1,354 | 12.5%), Public Administration (1,082 | 10.0%), Educational Services (1,055 | 9.7%), and Construction (808 | 7.4%).
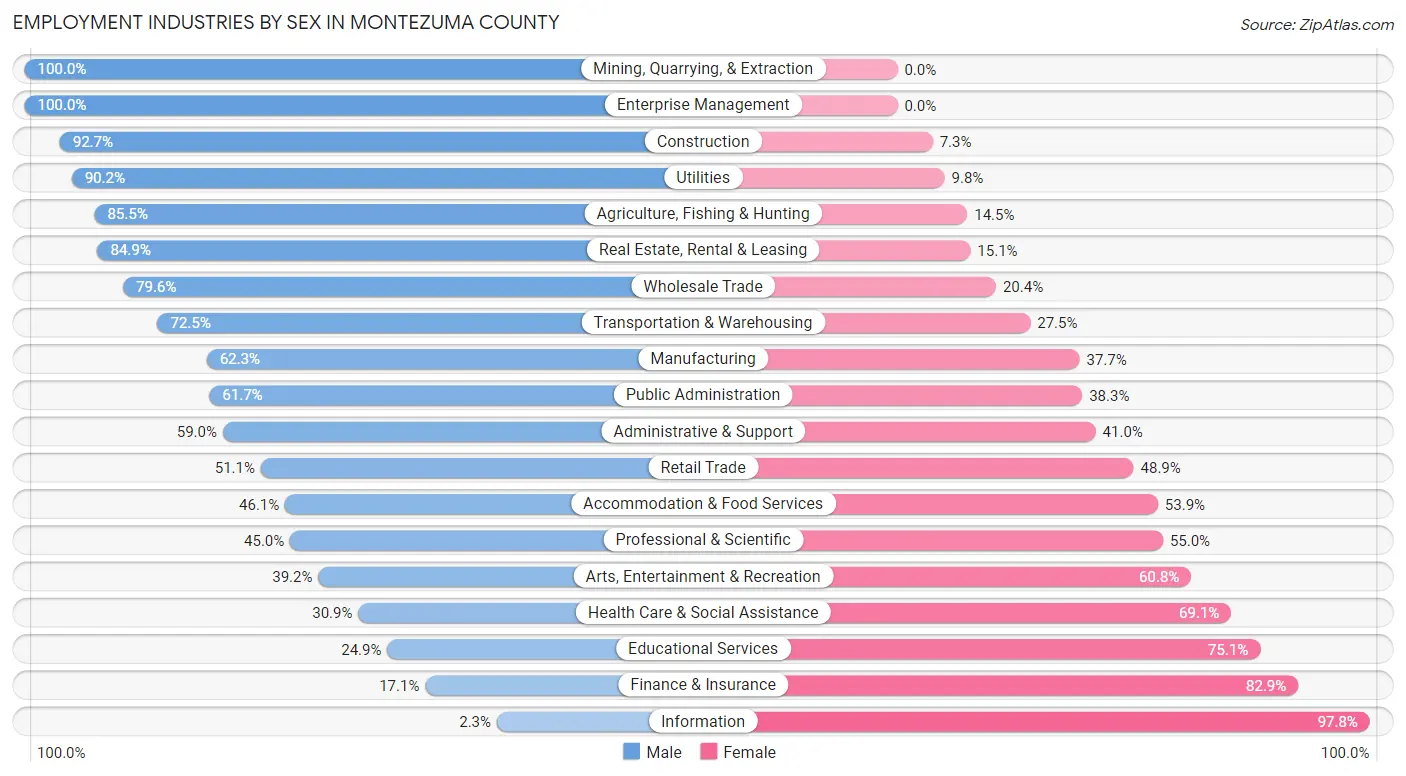
Employment Industries by Sex in Montezuma County
The Montezuma County industries that see more men than women are Mining, Quarrying, & Extraction (100.0%), Enterprise Management (100.0%), and Construction (92.7%), whereas the industries that tend to have a higher number of women are Information (97.8%), Finance & Insurance (82.9%), and Educational Services (75.1%).
| Industry | Male | Female |
| Agriculture, Fishing & Hunting | 337 (85.5%) | 57 (14.5%) |
| Mining, Quarrying, & Extraction | 338 (100.0%) | 0 (0.0%) |
| Construction | 749 (92.7%) | 59 (7.3%) |
| Manufacturing | 352 (62.3%) | 213 (37.7%) |
| Wholesale Trade | 160 (79.6%) | 41 (20.4%) |
| Retail Trade | 692 (51.1%) | 662 (48.9%) |
| Transportation & Warehousing | 245 (72.5%) | 93 (27.5%) |
| Utilities | 148 (90.2%) | 16 (9.8%) |
| Information | 2 (2.2%) | 87 (97.8%) |
| Finance & Insurance | 35 (17.1%) | 170 (82.9%) |
| Real Estate, Rental & Leasing | 191 (84.9%) | 34 (15.1%) |
| Professional & Scientific | 245 (45.0%) | 299 (55.0%) |
| Enterprise Management | 25 (100.0%) | 0 (0.0%) |
| Administrative & Support | 207 (59.0%) | 144 (41.0%) |
| Educational Services | 263 (24.9%) | 792 (75.1%) |
| Health Care & Social Assistance | 510 (30.9%) | 1,139 (69.1%) |
| Arts, Entertainment & Recreation | 158 (39.2%) | 245 (60.8%) |
| Accommodation & Food Services | 323 (46.1%) | 378 (53.9%) |
| Public Administration | 668 (61.7%) | 414 (38.3%) |
| Total | 5,838 (53.7%) | 5,033 (46.3%) |
Education in Montezuma County
School Enrollment in Montezuma County
The most common levels of schooling among the 5,300 students in Montezuma County are high school (1,430 | 27.0%), elementary school (1,324 | 25.0%), and middle school (1,296 | 24.4%).
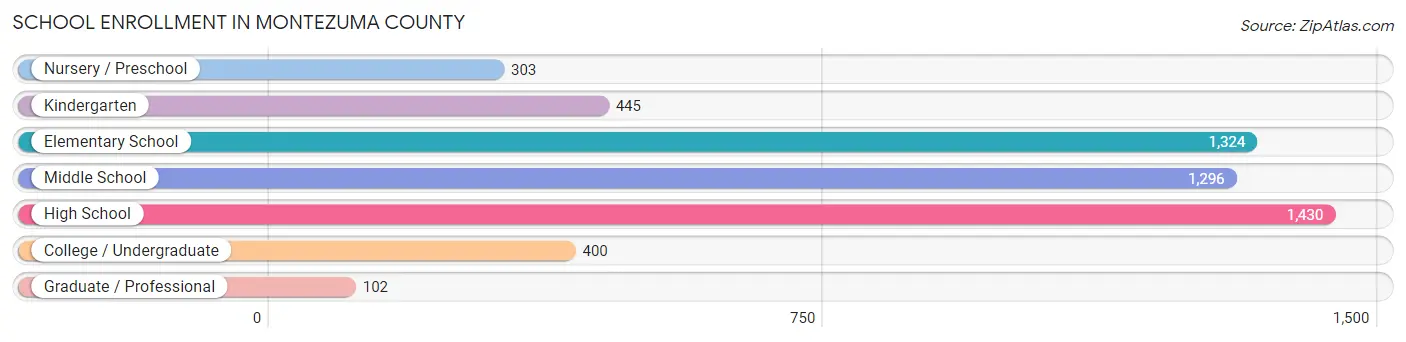
| School Level | # Students | % Students |
| Nursery / Preschool | 303 | 5.7% |
| Kindergarten | 445 | 8.4% |
| Elementary School | 1,324 | 25.0% |
| Middle School | 1,296 | 24.4% |
| High School | 1,430 | 27.0% |
| College / Undergraduate | 400 | 7.5% |
| Graduate / Professional | 102 | 1.9% |
| Total | 5,300 | 100.0% |
School Enrollment by Age by Funding Source in Montezuma County
Out of a total of 5,300 students who are enrolled in schools in Montezuma County, 652 (12.3%) attend a private institution, while the remaining 4,648 (87.7%) are enrolled in public schools. The age group of 25 to 34 year olds has the highest likelihood of being enrolled in private schools, with 24 (48.0% in the age bracket) enrolled. Conversely, the age group of 15 to 17 year olds has the lowest likelihood of being enrolled in a private school, with 899 (95.1% in the age bracket) attending a public institution.
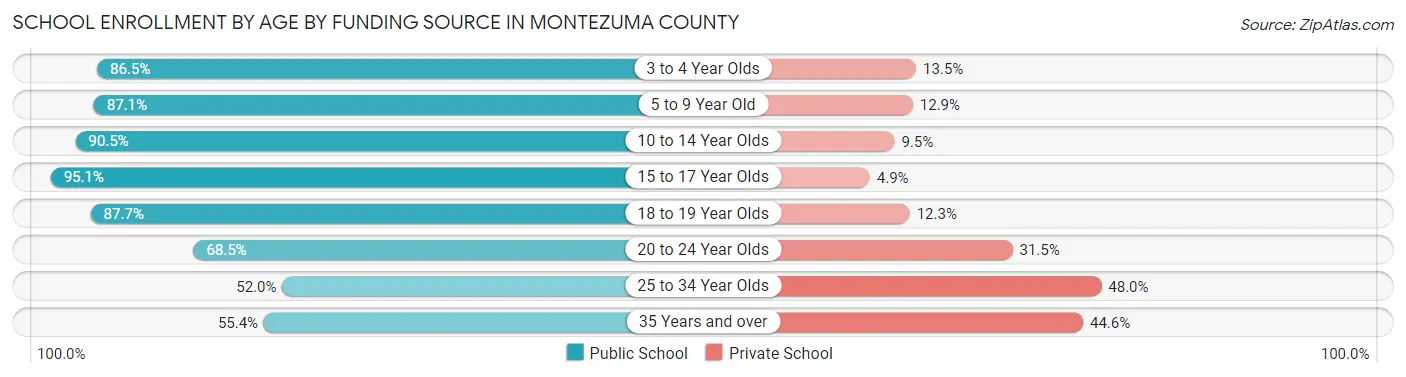
| Age Bracket | Public School | Private School |
| 3 to 4 Year Olds | 237 (86.5%) | 37 (13.5%) |
| 5 to 9 Year Old | 1,298 (87.1%) | 192 (12.9%) |
| 10 to 14 Year Olds | 1,540 (90.5%) | 161 (9.5%) |
| 15 to 17 Year Olds | 899 (95.1%) | 46 (4.9%) |
| 18 to 19 Year Olds | 435 (87.7%) | 61 (12.3%) |
| 20 to 24 Year Olds | 122 (68.5%) | 56 (31.5%) |
| 25 to 34 Year Olds | 26 (52.0%) | 24 (48.0%) |
| 35 Years and over | 92 (55.4%) | 74 (44.6%) |
| Total | 4,648 (87.7%) | 652 (12.3%) |
Educational Attainment by Field of Study in Montezuma County
Education (1,026 | 16.7%), business (983 | 16.0%), bio, nature & agricultural (694 | 11.3%), social sciences (615 | 10.0%), and science & technology (607 | 9.9%) are the most common fields of study among 6,132 individuals in Montezuma County who have obtained a bachelor's degree or higher.
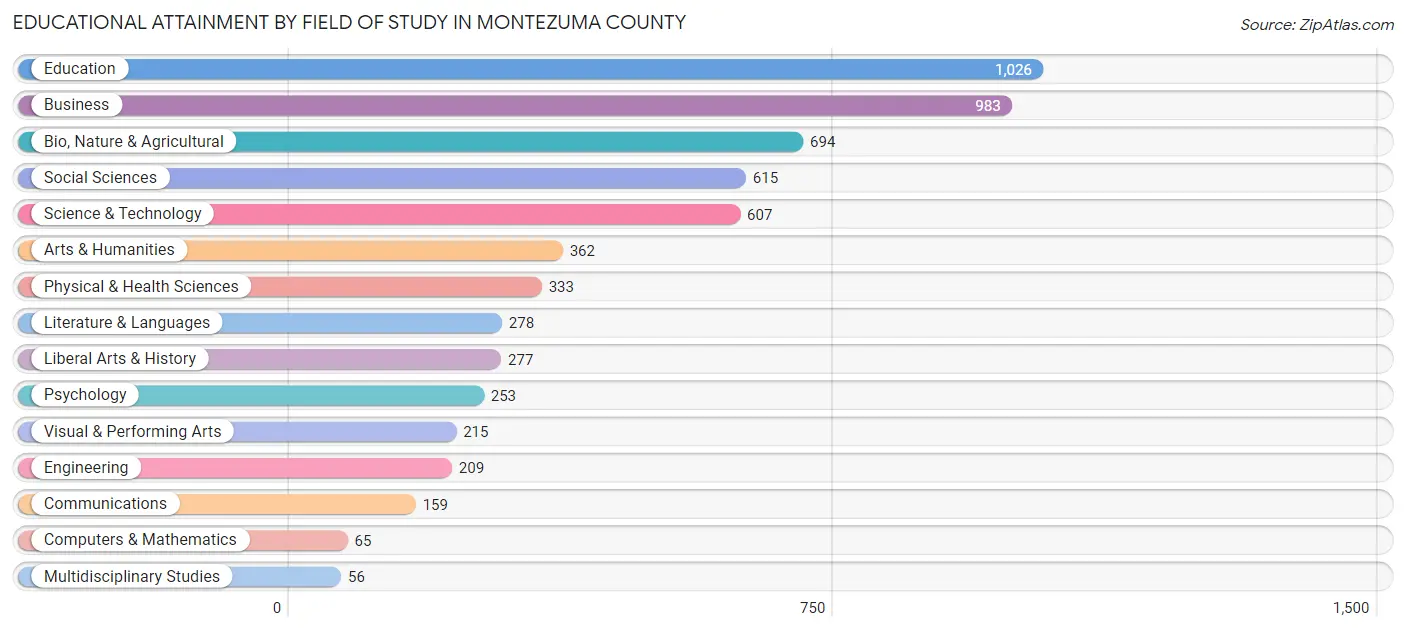
| Field of Study | # Graduates | % Graduates |
| Computers & Mathematics | 65 | 1.1% |
| Bio, Nature & Agricultural | 694 | 11.3% |
| Physical & Health Sciences | 333 | 5.4% |
| Psychology | 253 | 4.1% |
| Social Sciences | 615 | 10.0% |
| Engineering | 209 | 3.4% |
| Multidisciplinary Studies | 56 | 0.9% |
| Science & Technology | 607 | 9.9% |
| Business | 983 | 16.0% |
| Education | 1,026 | 16.7% |
| Literature & Languages | 278 | 4.5% |
| Liberal Arts & History | 277 | 4.5% |
| Visual & Performing Arts | 215 | 3.5% |
| Communications | 159 | 2.6% |
| Arts & Humanities | 362 | 5.9% |
| Total | 6,132 | 100.0% |
Transportation & Commute in Montezuma County
Vehicle Availability by Sex in Montezuma County
The most prevalent vehicle ownership categories in Montezuma County are males with 2 vehicles (2,197, accounting for 38.1%) and females with 2 vehicles (2,053, making up 44.4%).
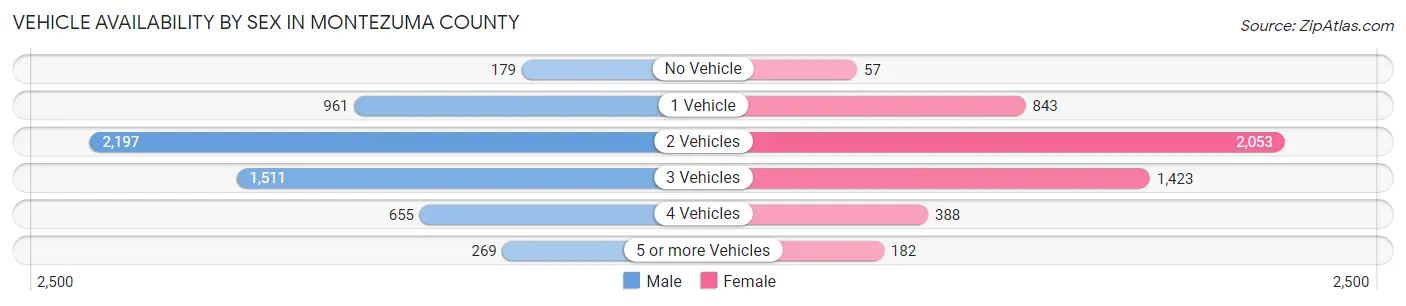
| Vehicles Available | Male | Female |
| No Vehicle | 179 (3.1%) | 57 (1.1%) |
| 1 Vehicle | 961 (16.7%) | 843 (17.0%) |
| 2 Vehicles | 2,197 (38.1%) | 2,053 (41.5%) |
| 3 Vehicles | 1,511 (26.2%) | 1,423 (28.8%) |
| 4 Vehicles | 655 (11.4%) | 388 (7.8%) |
| 5 or more Vehicles | 269 (4.7%) | 182 (3.7%) |
| Total | 5,772 (100.0%) | 4,946 (100.0%) |
Commute Time in Montezuma County
The most frequently occuring commute durations in Montezuma County are 5 to 9 minutes (1,856 commuters, 19.2%), 10 to 14 minutes (1,763 commuters, 18.2%), and 15 to 19 minutes (1,391 commuters, 14.4%).
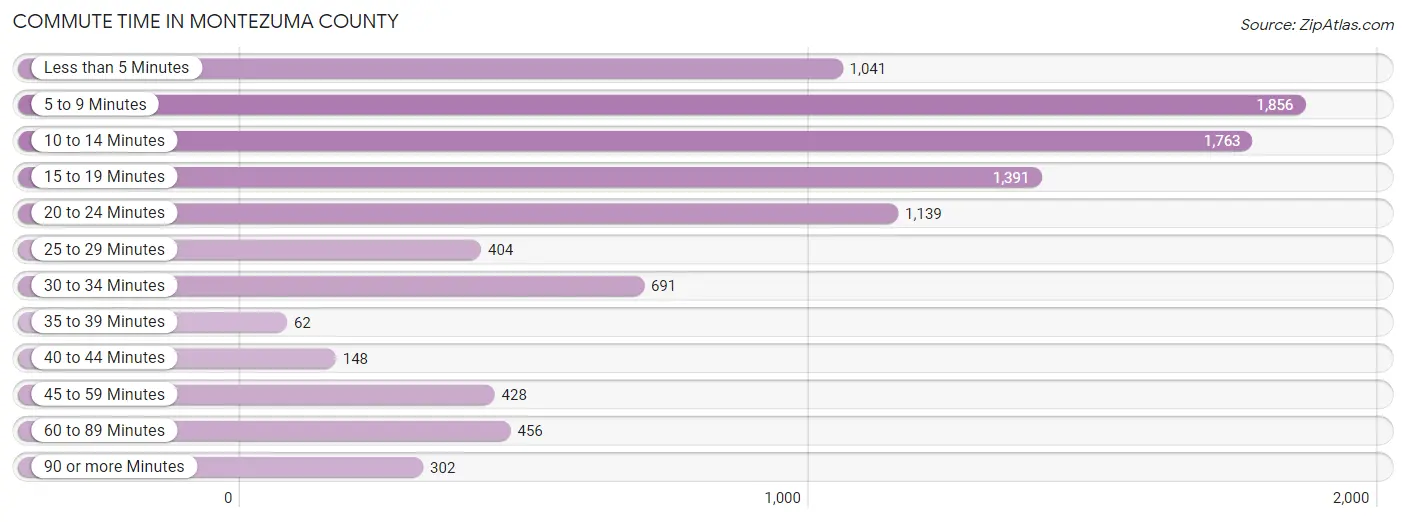
| Commute Time | # Commuters | % Commuters |
| Less than 5 Minutes | 1,041 | 10.7% |
| 5 to 9 Minutes | 1,856 | 19.2% |
| 10 to 14 Minutes | 1,763 | 18.2% |
| 15 to 19 Minutes | 1,391 | 14.4% |
| 20 to 24 Minutes | 1,139 | 11.8% |
| 25 to 29 Minutes | 404 | 4.2% |
| 30 to 34 Minutes | 691 | 7.1% |
| 35 to 39 Minutes | 62 | 0.6% |
| 40 to 44 Minutes | 148 | 1.5% |
| 45 to 59 Minutes | 428 | 4.4% |
| 60 to 89 Minutes | 456 | 4.7% |
| 90 or more Minutes | 302 | 3.1% |
Commute Time by Sex in Montezuma County
The most common commute times in Montezuma County are 5 to 9 minutes (1,015 commuters, 19.2%) for males and 10 to 14 minutes (1,021 commuters, 23.2%) for females.
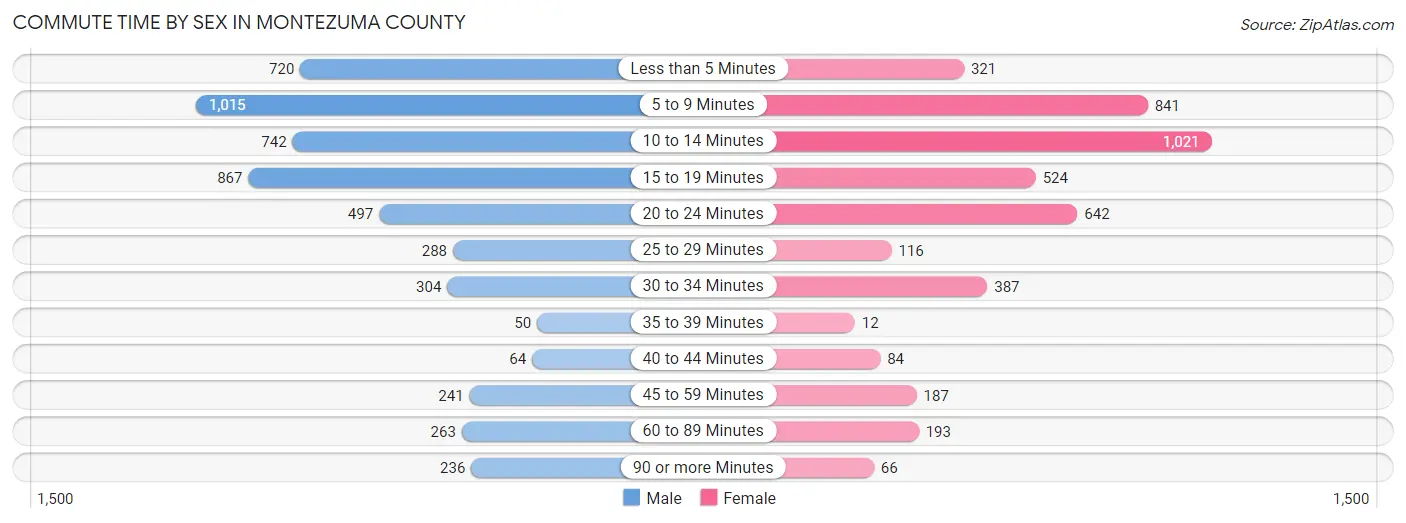
| Commute Time | Male | Female |
| Less than 5 Minutes | 720 (13.6%) | 321 (7.3%) |
| 5 to 9 Minutes | 1,015 (19.2%) | 841 (19.1%) |
| 10 to 14 Minutes | 742 (14.0%) | 1,021 (23.2%) |
| 15 to 19 Minutes | 867 (16.4%) | 524 (11.9%) |
| 20 to 24 Minutes | 497 (9.4%) | 642 (14.6%) |
| 25 to 29 Minutes | 288 (5.4%) | 116 (2.6%) |
| 30 to 34 Minutes | 304 (5.8%) | 387 (8.8%) |
| 35 to 39 Minutes | 50 (0.9%) | 12 (0.3%) |
| 40 to 44 Minutes | 64 (1.2%) | 84 (1.9%) |
| 45 to 59 Minutes | 241 (4.6%) | 187 (4.3%) |
| 60 to 89 Minutes | 263 (5.0%) | 193 (4.4%) |
| 90 or more Minutes | 236 (4.5%) | 66 (1.5%) |
Time of Departure to Work by Sex in Montezuma County
The most frequent times of departure to work in Montezuma County are 7:30 AM to 7:59 AM (1,299, 24.6%) for males and 7:30 AM to 7:59 AM (1,052, 23.9%) for females.
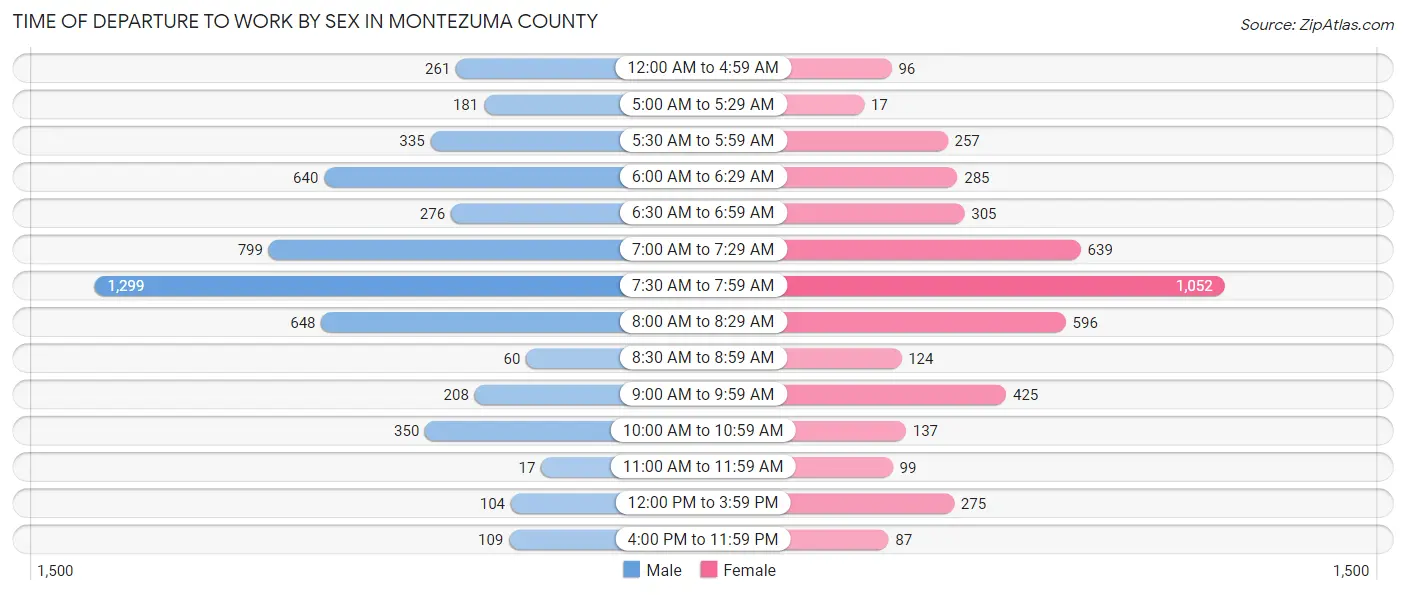
| Time of Departure | Male | Female |
| 12:00 AM to 4:59 AM | 261 (4.9%) | 96 (2.2%) |
| 5:00 AM to 5:29 AM | 181 (3.4%) | 17 (0.4%) |
| 5:30 AM to 5:59 AM | 335 (6.3%) | 257 (5.9%) |
| 6:00 AM to 6:29 AM | 640 (12.1%) | 285 (6.5%) |
| 6:30 AM to 6:59 AM | 276 (5.2%) | 305 (6.9%) |
| 7:00 AM to 7:29 AM | 799 (15.1%) | 639 (14.5%) |
| 7:30 AM to 7:59 AM | 1,299 (24.6%) | 1,052 (23.9%) |
| 8:00 AM to 8:29 AM | 648 (12.3%) | 596 (13.6%) |
| 8:30 AM to 8:59 AM | 60 (1.1%) | 124 (2.8%) |
| 9:00 AM to 9:59 AM | 208 (3.9%) | 425 (9.7%) |
| 10:00 AM to 10:59 AM | 350 (6.6%) | 137 (3.1%) |
| 11:00 AM to 11:59 AM | 17 (0.3%) | 99 (2.2%) |
| 12:00 PM to 3:59 PM | 104 (2.0%) | 275 (6.3%) |
| 4:00 PM to 11:59 PM | 109 (2.1%) | 87 (2.0%) |
| Total | 5,287 (100.0%) | 4,394 (100.0%) |
Housing Occupancy in Montezuma County
Occupancy by Ownership in Montezuma County
Of the total 10,520 dwellings in Montezuma County, owner-occupied units account for 7,736 (73.5%), while renter-occupied units make up 2,784 (26.5%).
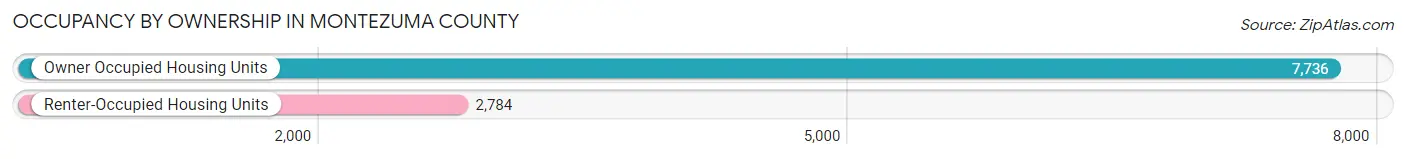
| Occupancy | # Housing Units | % Housing Units |
| Owner Occupied Housing Units | 7,736 | 73.5% |
| Renter-Occupied Housing Units | 2,784 | 26.5% |
| Total Occupied Housing Units | 10,520 | 100.0% |
Occupancy by Household Size in Montezuma County
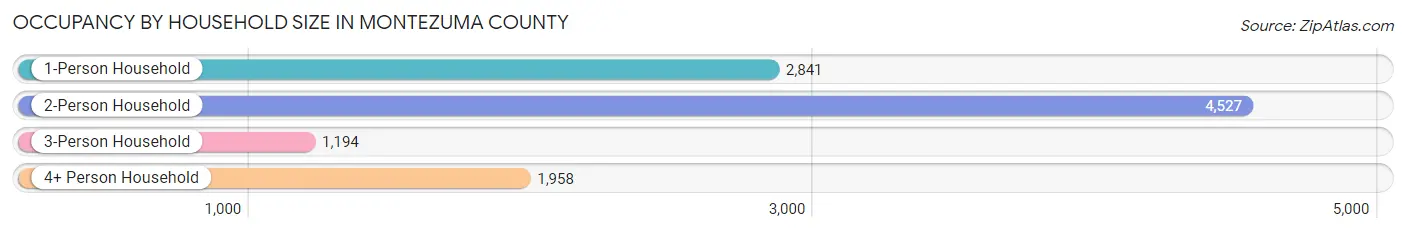
| Household Size | # Housing Units | % Housing Units |
| 1-Person Household | 2,841 | 27.0% |
| 2-Person Household | 4,527 | 43.0% |
| 3-Person Household | 1,194 | 11.4% |
| 4+ Person Household | 1,958 | 18.6% |
| Total Housing Units | 10,520 | 100.0% |
Occupancy by Ownership by Household Size in Montezuma County
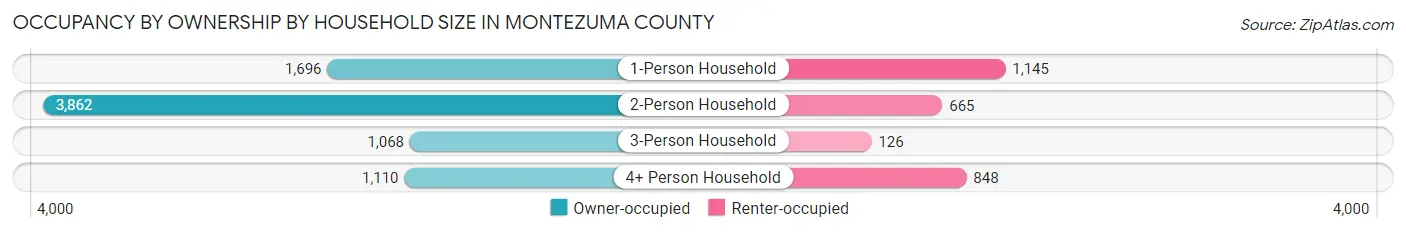
| Household Size | Owner-occupied | Renter-occupied |
| 1-Person Household | 1,696 (59.7%) | 1,145 (40.3%) |
| 2-Person Household | 3,862 (85.3%) | 665 (14.7%) |
| 3-Person Household | 1,068 (89.4%) | 126 (10.5%) |
| 4+ Person Household | 1,110 (56.7%) | 848 (43.3%) |
| Total Housing Units | 7,736 (73.5%) | 2,784 (26.5%) |
Occupancy by Educational Attainment in Montezuma County
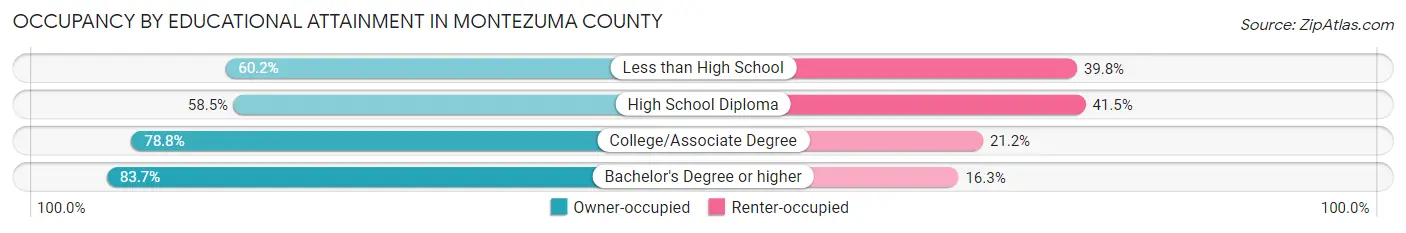
| Household Size | Owner-occupied | Renter-occupied |
| Less than High School | 440 (60.2%) | 291 (39.8%) |
| High School Diploma | 1,689 (58.5%) | 1,198 (41.5%) |
| College/Associate Degree | 2,740 (78.8%) | 736 (21.2%) |
| Bachelor's Degree or higher | 2,867 (83.7%) | 559 (16.3%) |
Occupancy by Age of Householder in Montezuma County
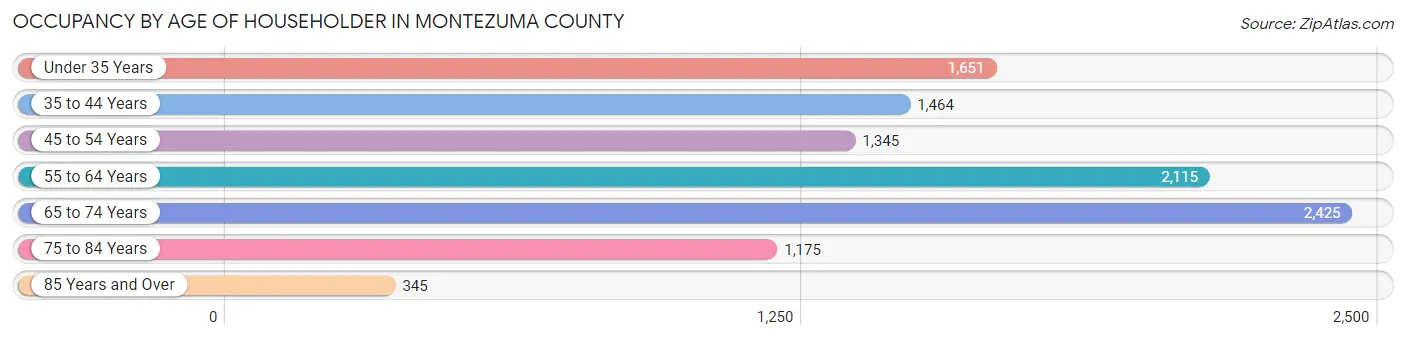
| Age Bracket | # Households | % Households |
| Under 35 Years | 1,651 | 15.7% |
| 35 to 44 Years | 1,464 | 13.9% |
| 45 to 54 Years | 1,345 | 12.8% |
| 55 to 64 Years | 2,115 | 20.1% |
| 65 to 74 Years | 2,425 | 23.1% |
| 75 to 84 Years | 1,175 | 11.2% |
| 85 Years and Over | 345 | 3.3% |
| Total | 10,520 | 100.0% |
Housing Finances in Montezuma County
Median Income by Occupancy in Montezuma County
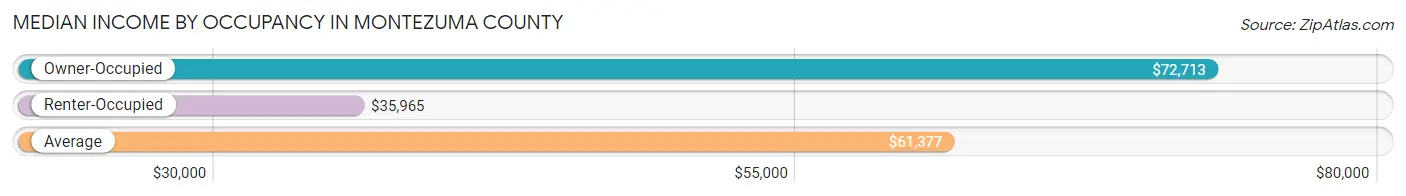
| Occupancy Type | # Households | Median Income |
| Owner-Occupied | 7,736 (73.5%) | $72,713 |
| Renter-Occupied | 2,784 (26.5%) | $35,965 |
| Average | 10,520 (100.0%) | $61,377 |
Occupancy by Householder Income Bracket in Montezuma County
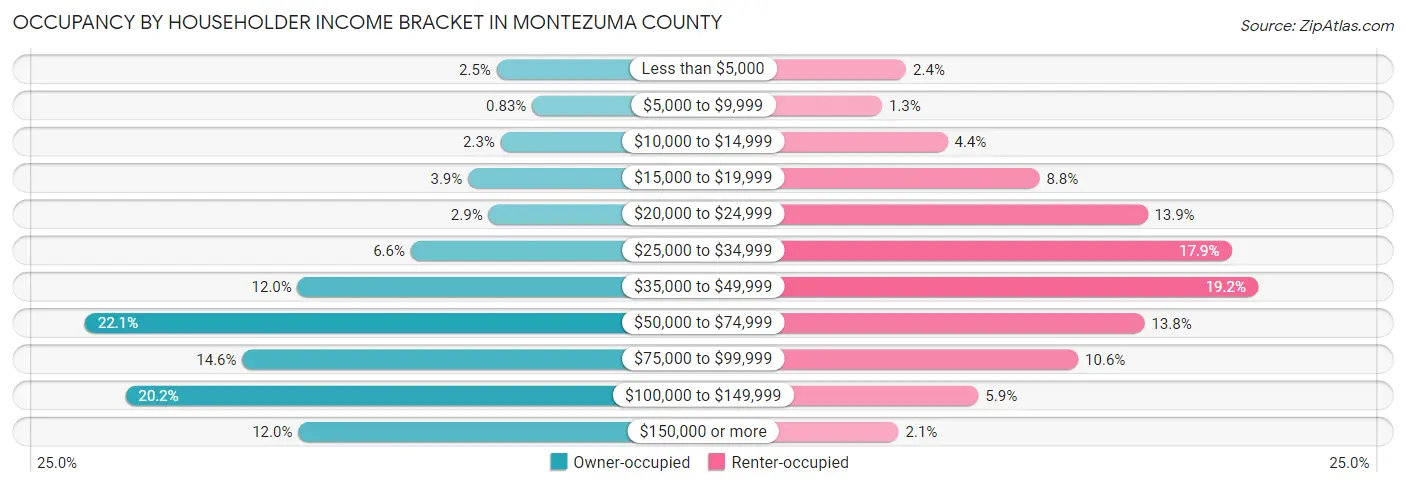
| Income Bracket | Owner-occupied | Renter-occupied |
| Less than $5,000 | 195 (2.5%) | 67 (2.4%) |
| $5,000 to $9,999 | 64 (0.8%) | 35 (1.3%) |
| $10,000 to $14,999 | 180 (2.3%) | 122 (4.4%) |
| $15,000 to $19,999 | 300 (3.9%) | 244 (8.8%) |
| $20,000 to $24,999 | 225 (2.9%) | 387 (13.9%) |
| $25,000 to $34,999 | 511 (6.6%) | 498 (17.9%) |
| $35,000 to $49,999 | 928 (12.0%) | 533 (19.2%) |
| $50,000 to $74,999 | 1,712 (22.1%) | 383 (13.8%) |
| $75,000 to $99,999 | 1,132 (14.6%) | 295 (10.6%) |
| $100,000 to $149,999 | 1,563 (20.2%) | 163 (5.9%) |
| $150,000 or more | 926 (12.0%) | 57 (2.1%) |
| Total | 7,736 (100.0%) | 2,784 (100.0%) |
Monthly Housing Cost Tiers in Montezuma County
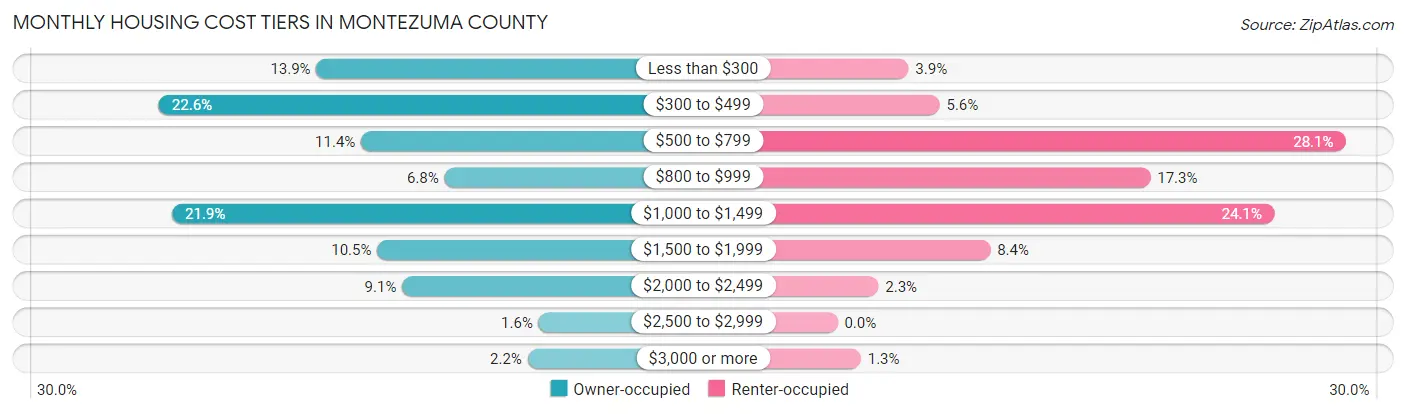
| Monthly Cost | Owner-occupied | Renter-occupied |
| Less than $300 | 1,074 (13.9%) | 109 (3.9%) |
| $300 to $499 | 1,747 (22.6%) | 157 (5.6%) |
| $500 to $799 | 883 (11.4%) | 781 (28.1%) |
| $800 to $999 | 526 (6.8%) | 481 (17.3%) |
| $1,000 to $1,499 | 1,690 (21.8%) | 671 (24.1%) |
| $1,500 to $1,999 | 814 (10.5%) | 235 (8.4%) |
| $2,000 to $2,499 | 707 (9.1%) | 63 (2.3%) |
| $2,500 to $2,999 | 124 (1.6%) | 0 (0.0%) |
| $3,000 or more | 171 (2.2%) | 36 (1.3%) |
| Total | 7,736 (100.0%) | 2,784 (100.0%) |
Physical Housing Characteristics in Montezuma County
Housing Structures in Montezuma County
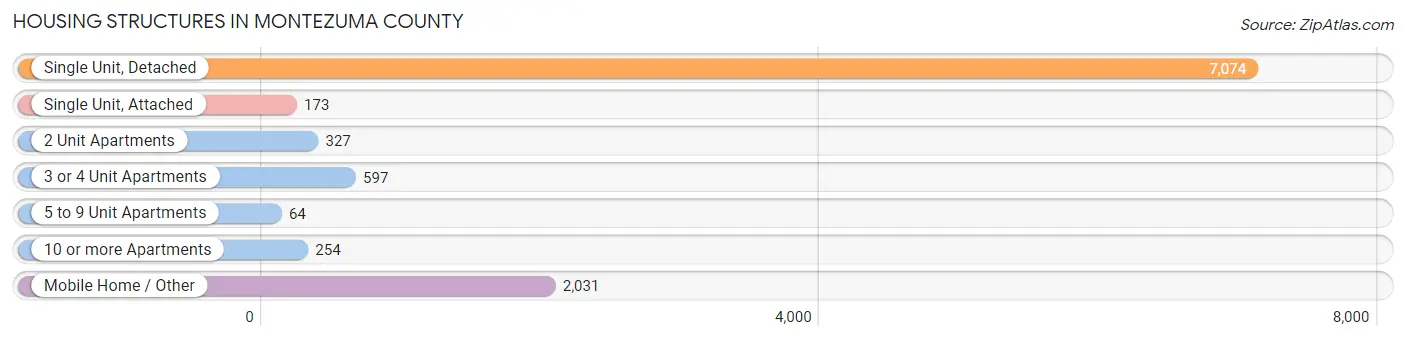
| Structure Type | # Housing Units | % Housing Units |
| Single Unit, Detached | 7,074 | 67.2% |
| Single Unit, Attached | 173 | 1.6% |
| 2 Unit Apartments | 327 | 3.1% |
| 3 or 4 Unit Apartments | 597 | 5.7% |
| 5 to 9 Unit Apartments | 64 | 0.6% |
| 10 or more Apartments | 254 | 2.4% |
| Mobile Home / Other | 2,031 | 19.3% |
| Total | 10,520 | 100.0% |
Housing Structures by Occupancy in Montezuma County
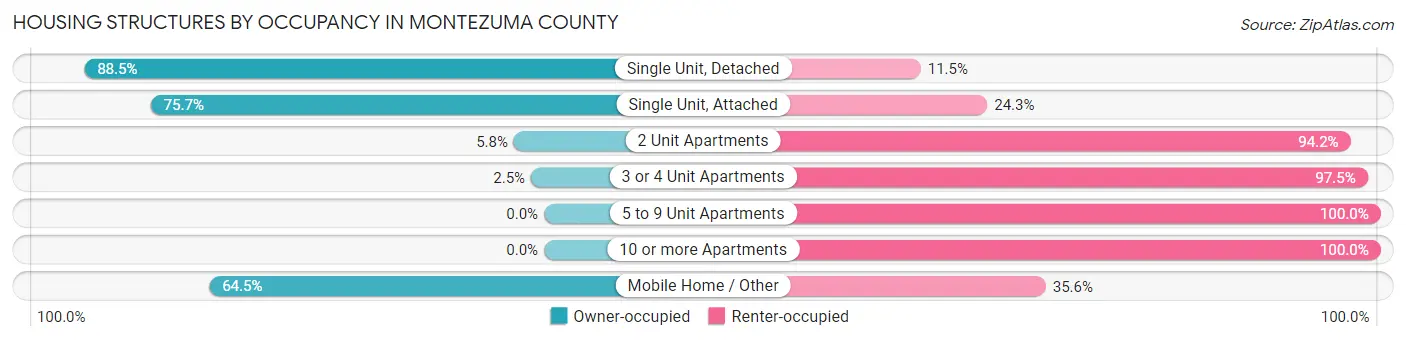
| Structure Type | Owner-occupied | Renter-occupied |
| Single Unit, Detached | 6,262 (88.5%) | 812 (11.5%) |
| Single Unit, Attached | 131 (75.7%) | 42 (24.3%) |
| 2 Unit Apartments | 19 (5.8%) | 308 (94.2%) |
| 3 or 4 Unit Apartments | 15 (2.5%) | 582 (97.5%) |
| 5 to 9 Unit Apartments | 0 (0.0%) | 64 (100.0%) |
| 10 or more Apartments | 0 (0.0%) | 254 (100.0%) |
| Mobile Home / Other | 1,309 (64.4%) | 722 (35.5%) |
| Total | 7,736 (73.5%) | 2,784 (26.5%) |
Housing Structures by Number of Rooms in Montezuma County
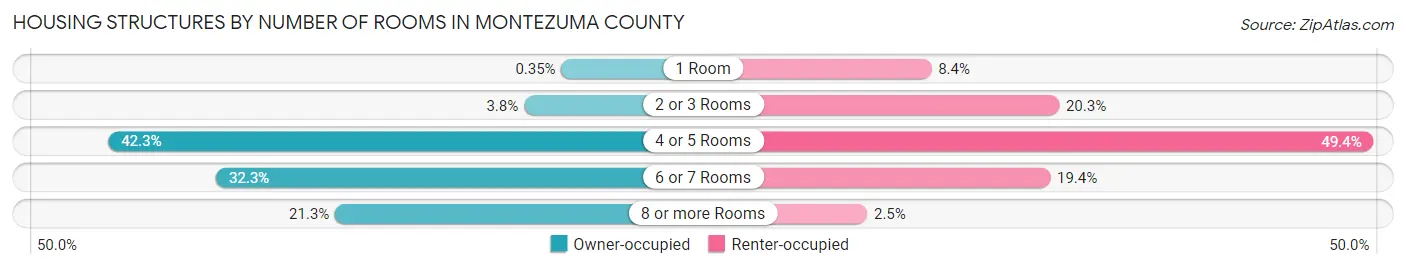
| Number of Rooms | Owner-occupied | Renter-occupied |
| 1 Room | 27 (0.4%) | 235 (8.4%) |
| 2 or 3 Rooms | 295 (3.8%) | 564 (20.3%) |
| 4 or 5 Rooms | 3,269 (42.3%) | 1,374 (49.3%) |
| 6 or 7 Rooms | 2,499 (32.3%) | 541 (19.4%) |
| 8 or more Rooms | 1,646 (21.3%) | 70 (2.5%) |
| Total | 7,736 (100.0%) | 2,784 (100.0%) |
Housing Structure by Heating Type in Montezuma County
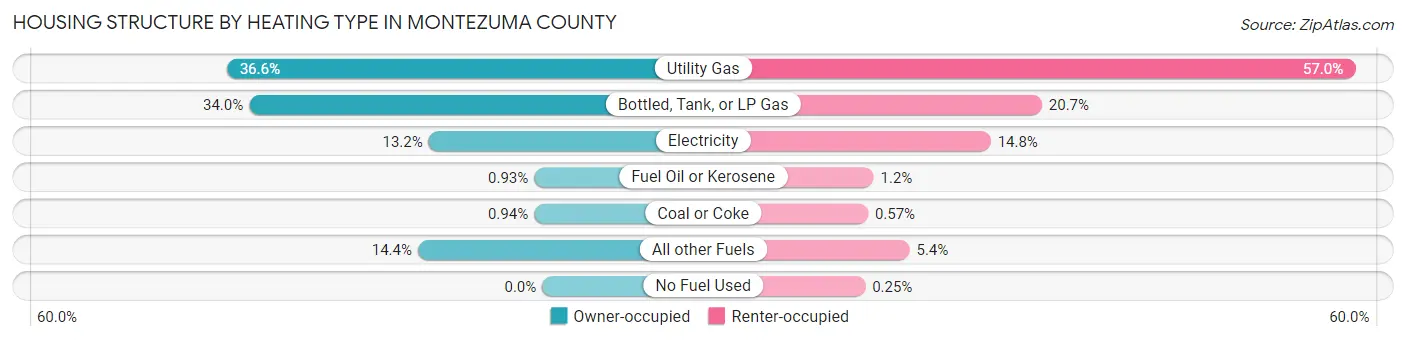
| Heating Type | Owner-occupied | Renter-occupied |
| Utility Gas | 2,828 (36.6%) | 1,588 (57.0%) |
| Bottled, Tank, or LP Gas | 2,629 (34.0%) | 577 (20.7%) |
| Electricity | 1,019 (13.2%) | 412 (14.8%) |
| Fuel Oil or Kerosene | 72 (0.9%) | 34 (1.2%) |
| Coal or Coke | 73 (0.9%) | 16 (0.6%) |
| All other Fuels | 1,115 (14.4%) | 150 (5.4%) |
| No Fuel Used | 0 (0.0%) | 7 (0.3%) |
| Total | 7,736 (100.0%) | 2,784 (100.0%) |
Household Vehicle Usage in Montezuma County
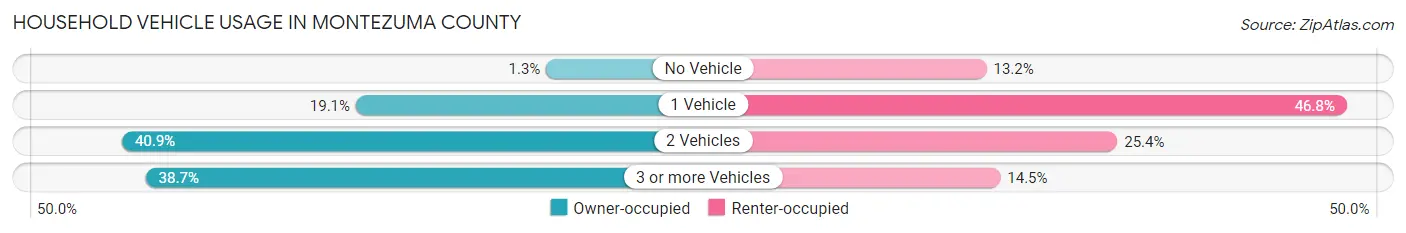
| Vehicles per Household | Owner-occupied | Renter-occupied |
| No Vehicle | 101 (1.3%) | 368 (13.2%) |
| 1 Vehicle | 1,476 (19.1%) | 1,304 (46.8%) |
| 2 Vehicles | 3,165 (40.9%) | 708 (25.4%) |
| 3 or more Vehicles | 2,994 (38.7%) | 404 (14.5%) |
| Total | 7,736 (100.0%) | 2,784 (100.0%) |
Real Estate & Mortgages in Montezuma County
Real Estate and Mortgage Overview in Montezuma County
| Characteristic | Without Mortgage | With Mortgage |
| Housing Units | 3,604 | 4,132 |
| Median Property Value | $245,800 | $314,300 |
| Median Household Income | $54,754 | $690 |
| Monthly Housing Costs | $379 | $169 |
| Real Estate Taxes | $783 | $98 |
Property Value by Mortgage Status in Montezuma County
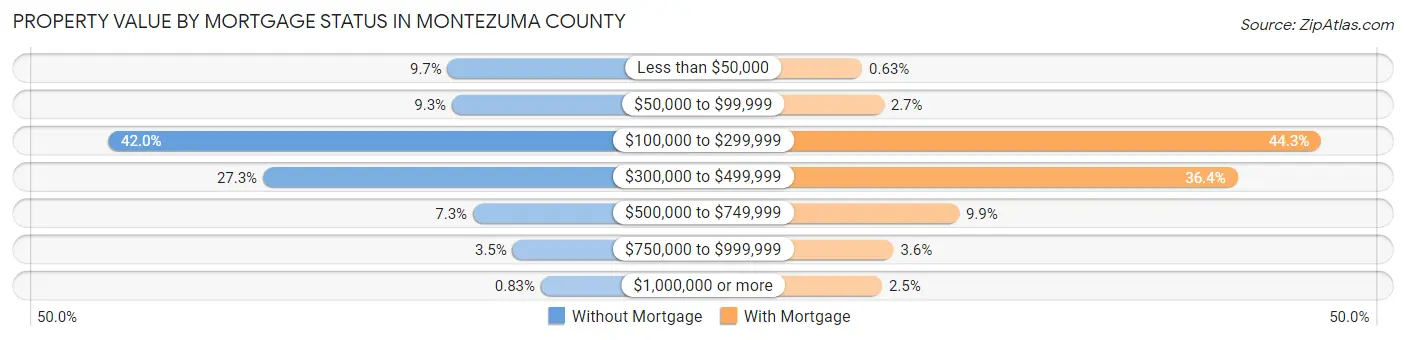
| Property Value | Without Mortgage | With Mortgage |
| Less than $50,000 | 350 (9.7%) | 26 (0.6%) |
| $50,000 to $99,999 | 335 (9.3%) | 111 (2.7%) |
| $100,000 to $299,999 | 1,515 (42.0%) | 1,832 (44.3%) |
| $300,000 to $499,999 | 984 (27.3%) | 1,503 (36.4%) |
| $500,000 to $749,999 | 263 (7.3%) | 407 (9.9%) |
| $750,000 to $999,999 | 127 (3.5%) | 149 (3.6%) |
| $1,000,000 or more | 30 (0.8%) | 104 (2.5%) |
| Total | 3,604 (100.0%) | 4,132 (100.0%) |
Household Income by Mortgage Status in Montezuma County
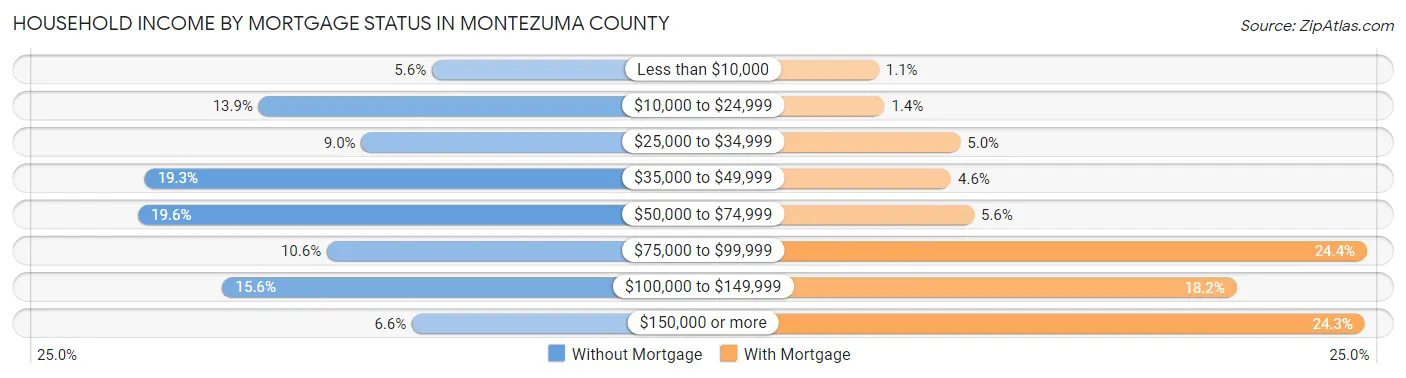
| Household Income | Without Mortgage | With Mortgage |
| Less than $10,000 | 202 (5.6%) | 46 (1.1%) |
| $10,000 to $24,999 | 499 (13.9%) | 57 (1.4%) |
| $25,000 to $34,999 | 323 (9.0%) | 206 (5.0%) |
| $35,000 to $49,999 | 695 (19.3%) | 188 (4.5%) |
| $50,000 to $74,999 | 706 (19.6%) | 233 (5.6%) |
| $75,000 to $99,999 | 382 (10.6%) | 1,006 (24.3%) |
| $100,000 to $149,999 | 561 (15.6%) | 750 (18.1%) |
| $150,000 or more | 236 (6.6%) | 1,002 (24.2%) |
| Total | 3,604 (100.0%) | 4,132 (100.0%) |
Property Value to Household Income Ratio in Montezuma County
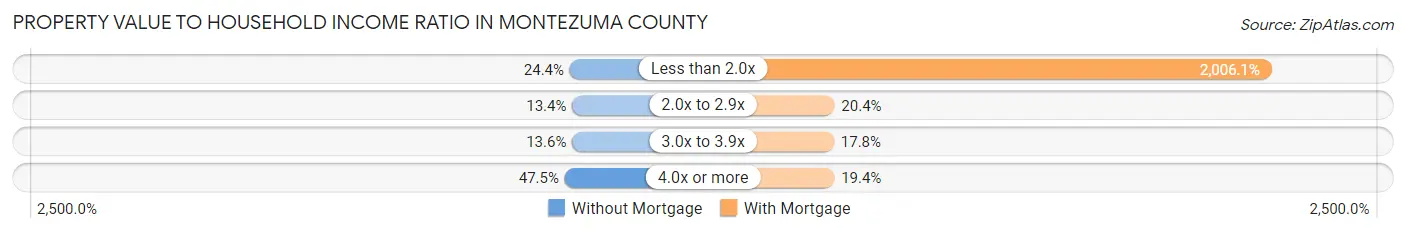
| Value-to-Income Ratio | Without Mortgage | With Mortgage |
| Less than 2.0x | 880 (24.4%) | 82,891 (2,006.1%) |
| 2.0x to 2.9x | 482 (13.4%) | 841 (20.3%) |
| 3.0x to 3.9x | 491 (13.6%) | 736 (17.8%) |
| 4.0x or more | 1,713 (47.5%) | 800 (19.4%) |
| Total | 3,604 (100.0%) | 4,132 (100.0%) |
Real Estate Taxes by Mortgage Status in Montezuma County
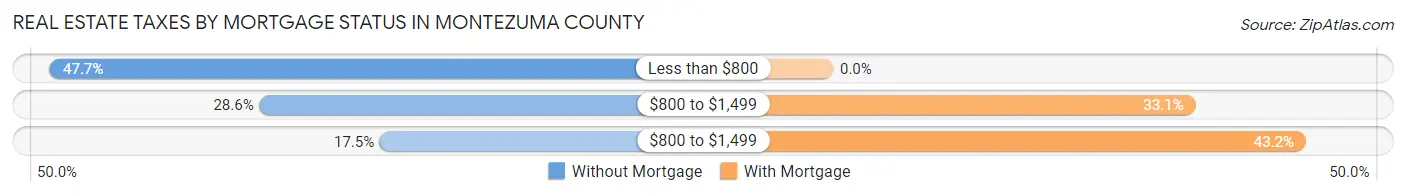
| Property Taxes | Without Mortgage | With Mortgage |
| Less than $800 | 1,718 (47.7%) | 0 (0.0%) |
| $800 to $1,499 | 1,029 (28.5%) | 1,368 (33.1%) |
| $800 to $1,499 | 632 (17.5%) | 1,784 (43.2%) |
| Total | 3,604 (100.0%) | 4,132 (100.0%) |
Health & Disability in Montezuma County
Health Insurance Coverage by Age in Montezuma County
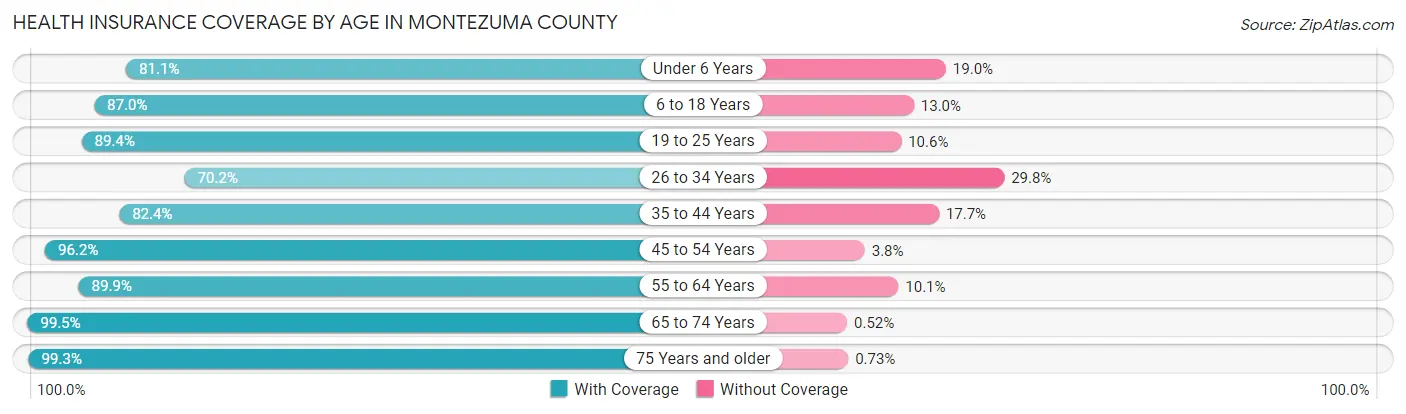
| Age Bracket | With Coverage | Without Coverage |
| Under 6 Years | 1,313 (81.0%) | 307 (19.0%) |
| 6 to 18 Years | 3,684 (87.0%) | 549 (13.0%) |
| 19 to 25 Years | 1,531 (89.4%) | 182 (10.6%) |
| 26 to 34 Years | 1,852 (70.2%) | 787 (29.8%) |
| 35 to 44 Years | 2,524 (82.4%) | 541 (17.6%) |
| 45 to 54 Years | 2,618 (96.2%) | 104 (3.8%) |
| 55 to 64 Years | 3,471 (89.9%) | 389 (10.1%) |
| 65 to 74 Years | 3,813 (99.5%) | 20 (0.5%) |
| 75 Years and older | 2,166 (99.3%) | 16 (0.7%) |
| Total | 22,972 (88.8%) | 2,895 (11.2%) |
Health Insurance Coverage by Citizenship Status in Montezuma County
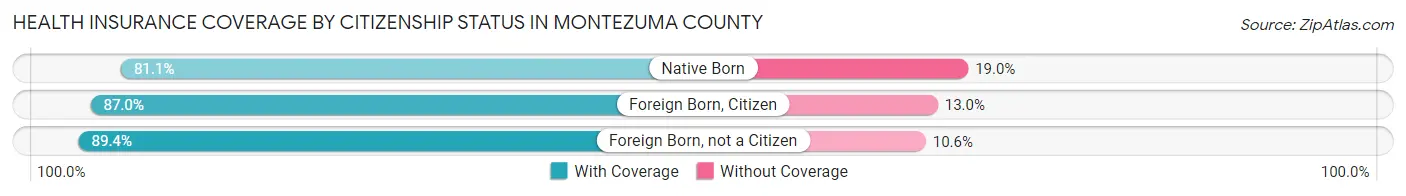
| Citizenship Status | With Coverage | Without Coverage |
| Native Born | 1,313 (81.0%) | 307 (19.0%) |
| Foreign Born, Citizen | 3,684 (87.0%) | 549 (13.0%) |
| Foreign Born, not a Citizen | 1,531 (89.4%) | 182 (10.6%) |
Health Insurance Coverage by Household Income in Montezuma County
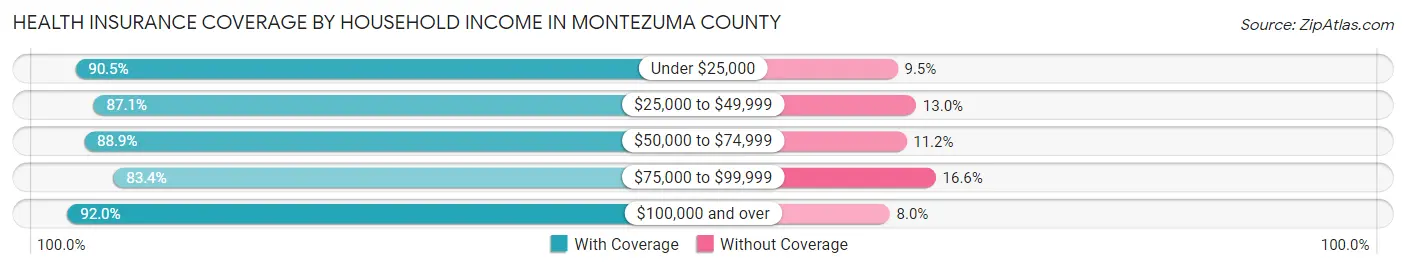
| Household Income | With Coverage | Without Coverage |
| Under $25,000 | 2,657 (90.5%) | 279 (9.5%) |
| $25,000 to $49,999 | 4,503 (87.1%) | 670 (13.0%) |
| $50,000 to $74,999 | 5,649 (88.8%) | 709 (11.2%) |
| $75,000 to $99,999 | 3,196 (83.4%) | 638 (16.6%) |
| $100,000 and over | 6,826 (92.0%) | 595 (8.0%) |
Public vs Private Health Insurance Coverage by Age in Montezuma County
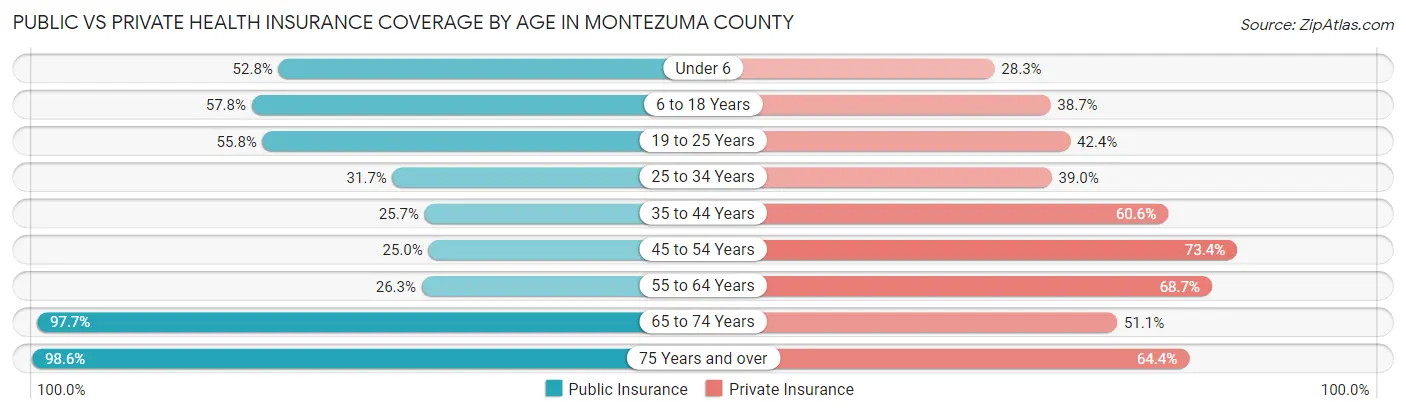
| Age Bracket | Public Insurance | Private Insurance |
| Under 6 | 856 (52.8%) | 459 (28.3%) |
| 6 to 18 Years | 2,448 (57.8%) | 1,639 (38.7%) |
| 19 to 25 Years | 956 (55.8%) | 726 (42.4%) |
| 25 to 34 Years | 836 (31.7%) | 1,028 (39.0%) |
| 35 to 44 Years | 788 (25.7%) | 1,856 (60.6%) |
| 45 to 54 Years | 681 (25.0%) | 1,997 (73.4%) |
| 55 to 64 Years | 1,014 (26.3%) | 2,650 (68.6%) |
| 65 to 74 Years | 3,745 (97.7%) | 1,958 (51.1%) |
| 75 Years and over | 2,152 (98.6%) | 1,406 (64.4%) |
| Total | 13,476 (52.1%) | 13,719 (53.0%) |
Disability Status by Sex by Age in Montezuma County
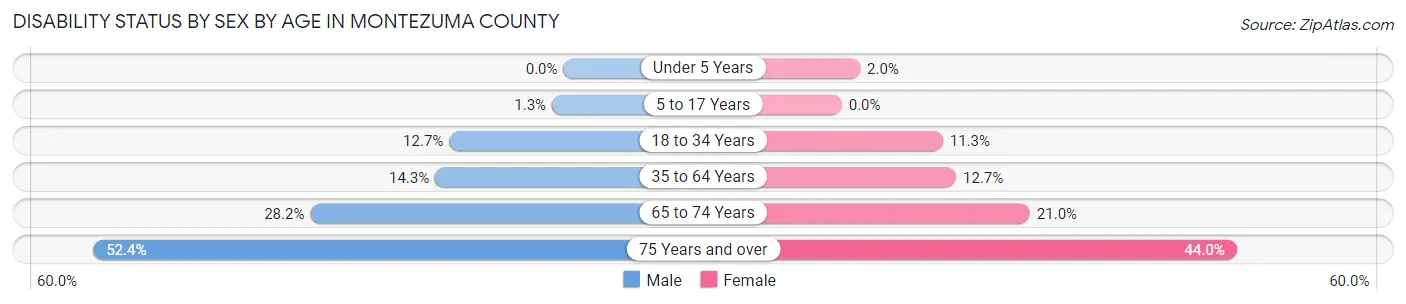
| Age Bracket | Male | Female |
| Under 5 Years | 0 (0.0%) | 11 (2.0%) |
| 5 to 17 Years | 28 (1.3%) | 0 (0.0%) |
| 18 to 34 Years | 336 (12.7%) | 232 (11.3%) |
| 35 to 64 Years | 642 (14.3%) | 656 (12.7%) |
| 65 to 74 Years | 537 (28.2%) | 404 (20.9%) |
| 75 Years and over | 535 (52.3%) | 510 (44.0%) |
Disability Class by Sex by Age in Montezuma County
Disability Class: Hearing Difficulty
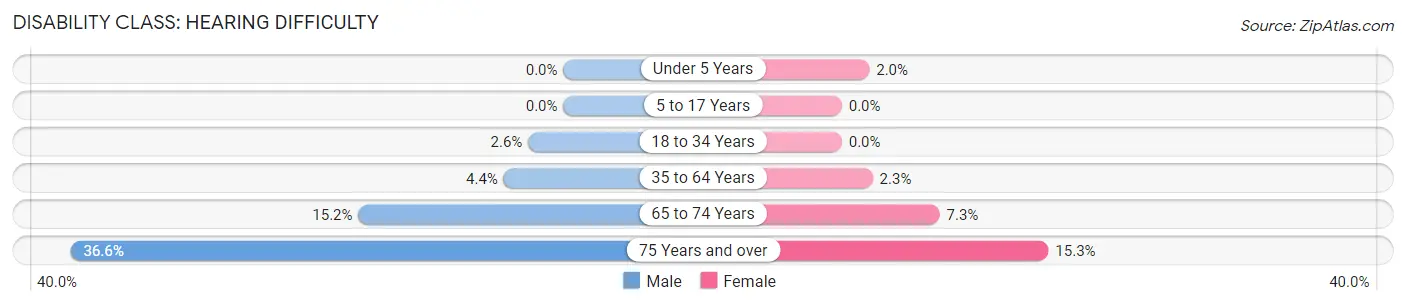
| Age Bracket | Male | Female |
| Under 5 Years | 0 (0.0%) | 11 (2.0%) |
| 5 to 17 Years | 0 (0.0%) | 0 (0.0%) |
| 18 to 34 Years | 69 (2.6%) | 0 (0.0%) |
| 35 to 64 Years | 199 (4.4%) | 118 (2.3%) |
| 65 to 74 Years | 290 (15.2%) | 140 (7.3%) |
| 75 Years and over | 374 (36.6%) | 178 (15.3%) |
Disability Class: Vision Difficulty
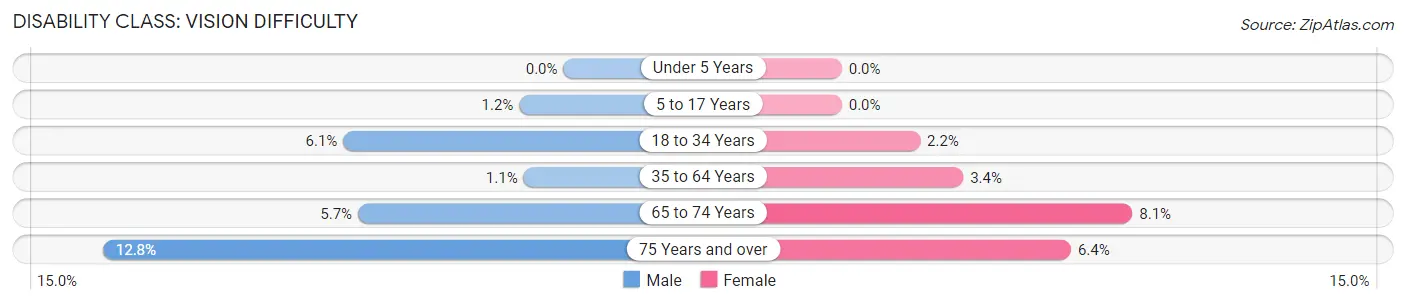
| Age Bracket | Male | Female |
| Under 5 Years | 0 (0.0%) | 0 (0.0%) |
| 5 to 17 Years | 27 (1.2%) | 0 (0.0%) |
| 18 to 34 Years | 162 (6.1%) | 45 (2.2%) |
| 35 to 64 Years | 50 (1.1%) | 174 (3.4%) |
| 65 to 74 Years | 109 (5.7%) | 156 (8.1%) |
| 75 Years and over | 131 (12.8%) | 74 (6.4%) |
Disability Class: Cognitive Difficulty
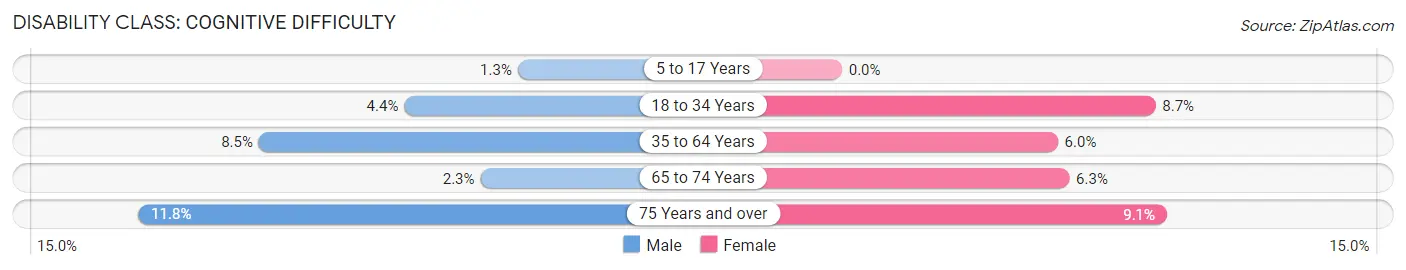
| Age Bracket | Male | Female |
| 5 to 17 Years | 28 (1.3%) | 0 (0.0%) |
| 18 to 34 Years | 117 (4.4%) | 180 (8.7%) |
| 35 to 64 Years | 381 (8.5%) | 310 (6.0%) |
| 65 to 74 Years | 44 (2.3%) | 122 (6.3%) |
| 75 Years and over | 121 (11.8%) | 105 (9.0%) |
Disability Class: Ambulatory Difficulty
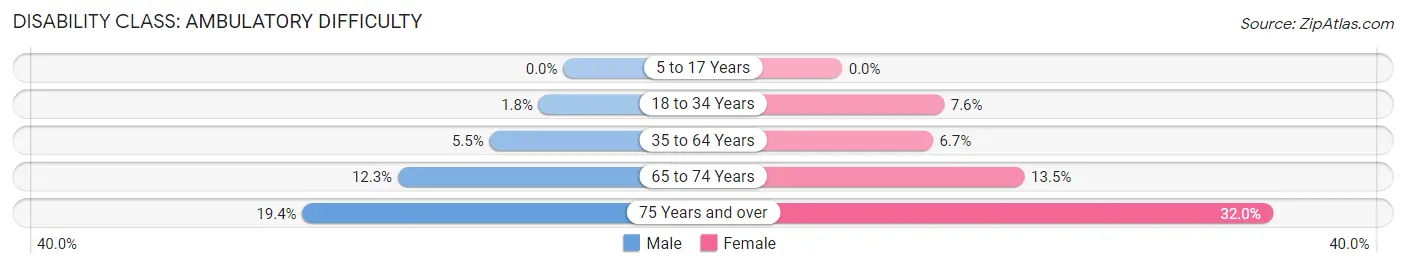
| Age Bracket | Male | Female |
| 5 to 17 Years | 0 (0.0%) | 0 (0.0%) |
| 18 to 34 Years | 48 (1.8%) | 156 (7.6%) |
| 35 to 64 Years | 246 (5.5%) | 347 (6.7%) |
| 65 to 74 Years | 234 (12.3%) | 261 (13.5%) |
| 75 Years and over | 198 (19.4%) | 371 (32.0%) |
Disability Class: Self-Care Difficulty
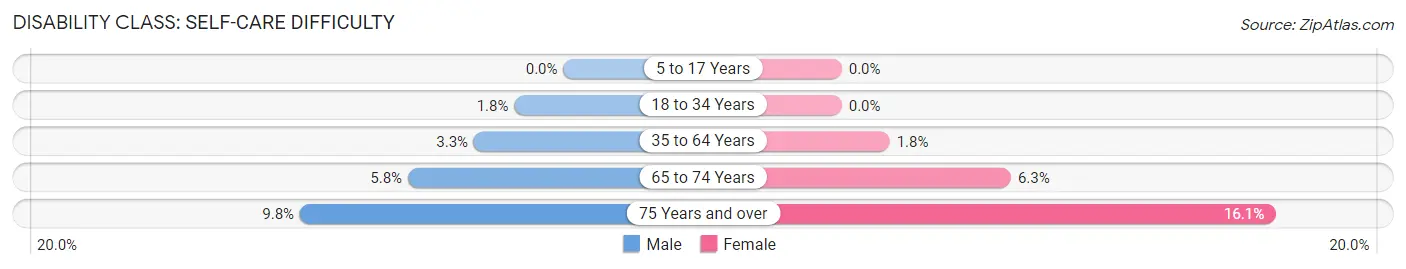
| Age Bracket | Male | Female |
| 5 to 17 Years | 0 (0.0%) | 0 (0.0%) |
| 18 to 34 Years | 48 (1.8%) | 0 (0.0%) |
| 35 to 64 Years | 149 (3.3%) | 92 (1.8%) |
| 65 to 74 Years | 110 (5.8%) | 121 (6.3%) |
| 75 Years and over | 100 (9.8%) | 187 (16.1%) |
Technology Access in Montezuma County
Computing Device Access in Montezuma County
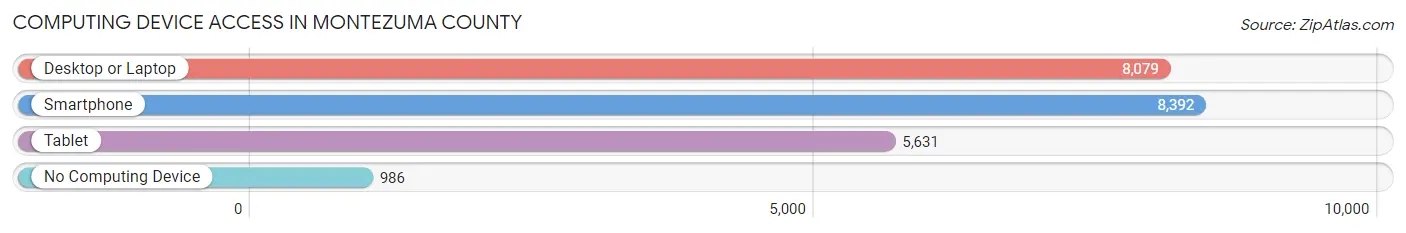
| Device Type | # Households | % Households |
| Desktop or Laptop | 8,079 | 76.8% |
| Smartphone | 8,392 | 79.8% |
| Tablet | 5,631 | 53.5% |
| No Computing Device | 986 | 9.4% |
| Total | 10,520 | 100.0% |
Internet Access in Montezuma County
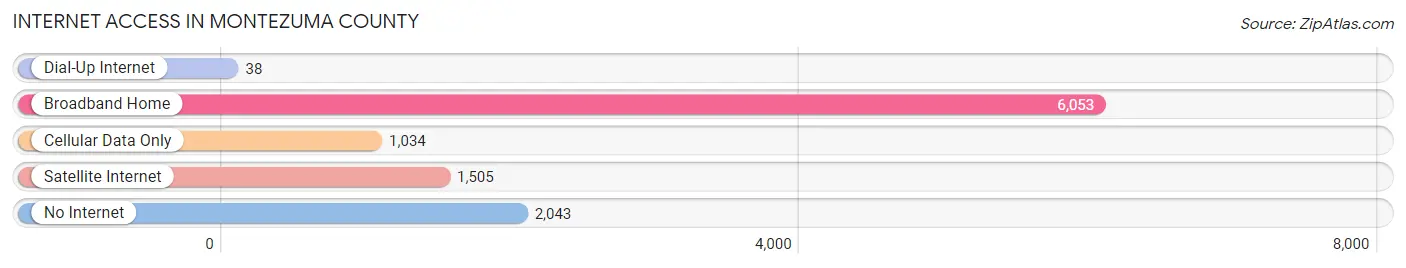
| Internet Type | # Households | % Households |
| Dial-Up Internet | 38 | 0.4% |
| Broadband Home | 6,053 | 57.5% |
| Cellular Data Only | 1,034 | 9.8% |
| Satellite Internet | 1,505 | 14.3% |
| No Internet | 2,043 | 19.4% |
| Total | 10,520 | 100.0% |
Montezuma County Summary
Montezuma County is located in the southwestern corner of Colorado, and is bordered by La Plata County to the north, Dolores County to the east, San Juan County to the south, and Arizona and New Mexico to the west. The county seat is Cortez, and the county is named after the Aztec emperor Montezuma. The county has a total area of 3,370 square miles, and a population of 25,535 as of the 2010 census.
Geography
Montezuma County is located in the Four Corners region of the United States, and is part of the Colorado Plateau. The county is characterized by high desert terrain, with elevations ranging from 5,000 to 8,000 feet. The county is home to Mesa Verde National Park, which is located in the southwestern corner of the county. The park is home to the ancient Puebloan cliff dwellings, and is a popular tourist destination. The county is also home to the Ute Mountain Ute Tribal Park, which is located on the Ute Mountain Ute Reservation. The county is also home to the Canyons of the Ancients National Monument, which is located in the southwestern corner of the county.
The county is home to several rivers, including the Dolores River, the San Juan River, and the Mancos River. The county is also home to several reservoirs, including McPhee Reservoir, Navajo Reservoir, and Lemon Reservoir.
Economy
The economy of Montezuma County is largely based on agriculture and tourism. The county is home to several large farms, including the Montezuma Valley Farms, which is the largest farm in the county. The county is also home to several wineries, including the Montezuma Winery and the Dolores River Winery.
Tourism is a major part of the economy of Montezuma County. The county is home to Mesa Verde National Park, which is a popular tourist destination. The county is also home to the Ute Mountain Ute Tribal Park, which is located on the Ute Mountain Ute Reservation. The county is also home to the Canyons of the Ancients National Monument, which is located in the southwestern corner of the county.
Demographics
As of the 2010 census, the population of Montezuma County was 25,535. The racial makeup of the county was 73.3% White, 0.7% African American, 1.3% Native American, 0.3% Asian, 0.1% Pacific Islander, 21.2% from other races, and 3.3% from two or more races. Hispanic or Latino of any race were 43.2% of the population.
The median income for a household in the county was $37,945, and the median income for a family was $44,945. The per capita income for the county was $19,945. About 16.2% of families and 20.2% of the population were below the poverty line, including 28.2% of those under age 18 and 10.2% of those age 65 or over.
Montezuma County is home to several Native American tribes, including the Ute Mountain Ute Tribe, the Southern Ute Indian Tribe, and the Navajo Nation. The county is also home to several Hispanic and Latino communities, including the Mexican-American community.
Montezuma County is a rural county, and is home to several small towns and villages. The county seat is Cortez, which is the largest town in the county. Other towns in the county include Dolores, Mancos, and Towaoc.
Common Questions
What is the Total Population of Montezuma County?
Total Population of Montezuma County is 26,070.
What is the Total Male Population of Montezuma County?
Total Male Population of Montezuma County is 13,026.
What is the Total Female Population of Montezuma County?
Total Female Population of Montezuma County is 13,044.
What is the Ratio of Males per 100 Females in Montezuma County?
There are 99.86 Males per 100 Females in Montezuma County.
What is the Ratio of Females per 100 Males in Montezuma County?
There are 100.14 Females per 100 Males in Montezuma County.
What is the Median Population Age in Montezuma County?
Median Population Age in Montezuma County is 43.7 Years.
What is the Average Family Size in Montezuma County
Average Family Size in Montezuma County is 3.0 People.
What is the Average Household Size in Montezuma County
Average Household Size in Montezuma County is 2.5 People.
What is Per Capita Income in Montezuma County?
Per Capita income in Montezuma County is $31,044.
What is the Median Family Income in Montezuma County?
Median Family Income in Montezuma County is $72,887.
What is the Median Household income in Montezuma County?
Median Household Income in Montezuma County is $61,377.
What is Income or Wage Gap in Montezuma County?
Income or Wage Gap in Montezuma County is 16.5%.
Women in Montezuma County earn 83.5 cents for every dollar earned by a man.
What is Inequality or Gini Index in Montezuma County?
Inequality or Gini Index in Montezuma County is 0.42.
How Large is the Labor Force in Montezuma County?
There are 11,377 People in the Labor Forcein in Montezuma County.
What is the Percentage of People in the Labor Force in Montezuma County?
53.8% of People are in the Labor Force in Montezuma County.
What is the Unemployment Rate in Montezuma County?
Unemployment Rate in Montezuma County is 4.4%.