Larimer County, CO
Larimer County Map
Larimer County Overview
359,363
TOTAL POPULATION
180,193
MALE POPULATION
179,170
FEMALE POPULATION
100.57
MALES / 100 FEMALES
99.43
FEMALES / 100 MALES
36.3
MEDIAN AGE
2.8
AVG FAMILY SIZE
2.4
AVG HOUSEHOLD SIZE
$46,676
PER CAPITA INCOME
$112,985
AVG FAMILY INCOME
$87,199
AVG HOUSEHOLD INCOME
36.9%
WAGE / INCOME GAP [ % ]
63.1¢/ $1
WAGE / INCOME GAP [ $ ]
$11,021
FAMILY INCOME DEFICIT
0.45
INEQUALITY / GINI INDEX
201,845
LABOR FORCE [ PEOPLE ]
67.3%
PERCENT IN LABOR FORCE
4.6%
UNEMPLOYMENT RATE
Larimer County Area Codes
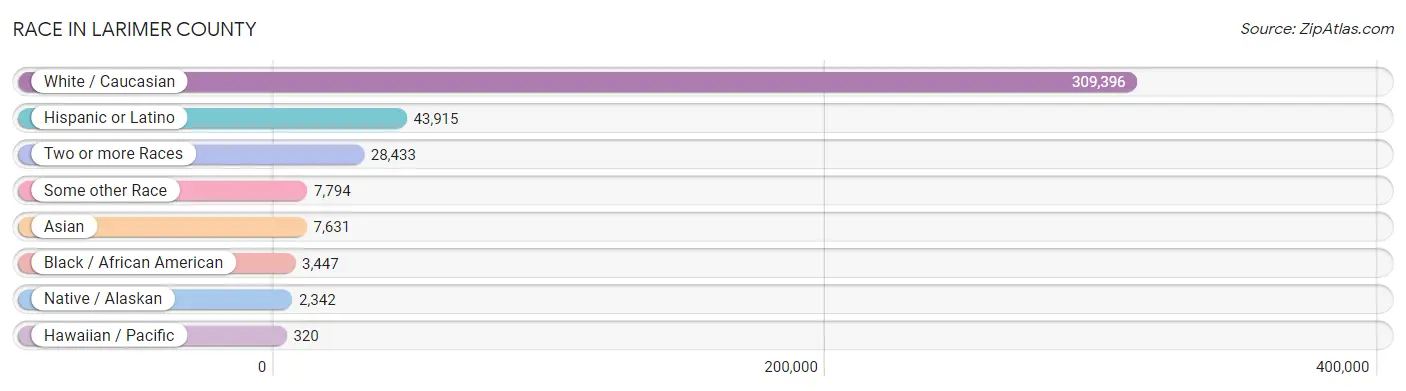
Race in Larimer County
The most populous races in Larimer County are White / Caucasian (309,396 | 86.1%), Hispanic or Latino (43,915 | 12.2%), and Two or more Races (28,433 | 7.9%).
| Race | # Population | % Population |
| Asian | 7,631 | 2.1% |
| Black / African American | 3,447 | 1.0% |
| Hawaiian / Pacific | 320 | 0.1% |
| Hispanic or Latino | 43,915 | 12.2% |
| Native / Alaskan | 2,342 | 0.6% |
| White / Caucasian | 309,396 | 86.1% |
| Two or more Races | 28,433 | 7.9% |
| Some other Race | 7,794 | 2.2% |
| Total | 359,363 | 100.0% |
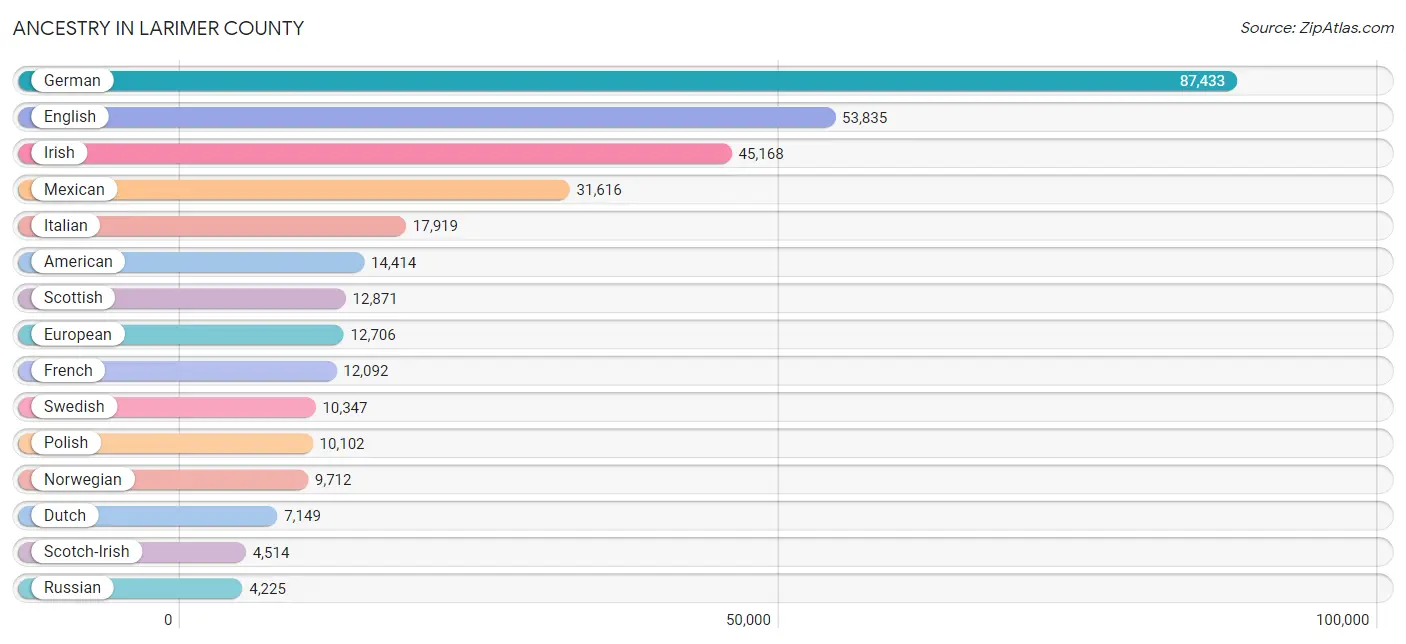
Ancestry in Larimer County
The most populous ancestries reported in Larimer County are German (87,433 | 24.3%), English (53,835 | 15.0%), Irish (45,168 | 12.6%), Mexican (31,616 | 8.8%), and Italian (17,919 | 5.0%), together accounting for 65.7% of all Larimer County residents.
| Ancestry | # Population | % Population |
| Afghan | 96 | 0.0% |
| African | 459 | 0.1% |
| Alaska Native | 38 | 0.0% |
| Alaskan Athabascan | 87 | 0.0% |
| Albanian | 23 | 0.0% |
| Aleut | 12 | 0.0% |
| Alsatian | 89 | 0.0% |
| American | 14,414 | 4.0% |
| Apache | 490 | 0.1% |
| Arab | 1,794 | 0.5% |
| Argentinean | 151 | 0.0% |
| Armenian | 229 | 0.1% |
| Assyrian / Chaldean / Syriac | 8 | 0.0% |
| Australian | 197 | 0.1% |
| Austrian | 1,129 | 0.3% |
| Bangladeshi | 10 | 0.0% |
| Basque | 214 | 0.1% |
| Belgian | 675 | 0.2% |
| Bhutanese | 1,499 | 0.4% |
| Blackfeet | 27 | 0.0% |
| Bolivian | 90 | 0.0% |
| Brazilian | 702 | 0.2% |
| British | 2,707 | 0.7% |
| Bulgarian | 57 | 0.0% |
| Burmese | 1,753 | 0.5% |
| Cajun | 36 | 0.0% |
| Canadian | 987 | 0.3% |
| Cape Verdean | 266 | 0.1% |
| Carpatho Rusyn | 5 | 0.0% |
| Celtic | 114 | 0.0% |
| Central American | 1,921 | 0.5% |
| Central American Indian | 117 | 0.0% |
| Cherokee | 1,319 | 0.4% |
| Cheyenne | 15 | 0.0% |
| Chickasaw | 90 | 0.0% |
| Chilean | 149 | 0.0% |
| Chippewa | 120 | 0.0% |
| Choctaw | 164 | 0.1% |
| Colombian | 974 | 0.3% |
| Colville | 9 | 0.0% |
| Comanche | 11 | 0.0% |
| Costa Rican | 474 | 0.1% |
| Creek | 76 | 0.0% |
| Croatian | 581 | 0.2% |
| Crow | 37 | 0.0% |
| Cuban | 648 | 0.2% |
| Czech | 2,977 | 0.8% |
| Czechoslovakian | 580 | 0.2% |
| Danish | 3,428 | 0.9% |
| Delaware | 24 | 0.0% |
| Dominican | 199 | 0.1% |
| Dutch | 7,149 | 2.0% |
| Eastern European | 1,561 | 0.4% |
| Ecuadorian | 321 | 0.1% |
| Egyptian | 136 | 0.0% |
| English | 53,835 | 15.0% |
| Estonian | 16 | 0.0% |
| Ethiopian | 262 | 0.1% |
| European | 12,706 | 3.5% |
| Fijian | 14 | 0.0% |
| Filipino | 141 | 0.0% |
| Finnish | 1,056 | 0.3% |
| French | 12,092 | 3.4% |
| French American Indian | 10 | 0.0% |
| French Canadian | 1,709 | 0.5% |
| German | 87,433 | 24.3% |
| German Russian | 341 | 0.1% |
| Ghanaian | 19 | 0.0% |
| Greek | 1,372 | 0.4% |
| Guamanian / Chamorro | 77 | 0.0% |
| Guatemalan | 291 | 0.1% |
| Guyanese | 7 | 0.0% |
| Haitian | 68 | 0.0% |
| Honduran | 182 | 0.1% |
| Hopi | 30 | 0.0% |
| Hungarian | 1,246 | 0.4% |
| Icelander | 95 | 0.0% |
| Indian (Asian) | 2,699 | 0.7% |
| Indonesian | 53 | 0.0% |
| Iranian | 316 | 0.1% |
| Iraqi | 44 | 0.0% |
| Irish | 45,168 | 12.6% |
| Iroquois | 68 | 0.0% |
| Israeli | 123 | 0.0% |
| Italian | 17,919 | 5.0% |
| Jamaican | 99 | 0.0% |
| Japanese | 109 | 0.0% |
| Jordanian | 26 | 0.0% |
| Kenyan | 27 | 0.0% |
| Korean | 1,424 | 0.4% |
| Laotian | 205 | 0.1% |
| Latvian | 44 | 0.0% |
| Lebanese | 389 | 0.1% |
| Lithuanian | 1,177 | 0.3% |
| Lumbee | 9 | 0.0% |
| Luxembourger | 108 | 0.0% |
| Macedonian | 27 | 0.0% |
| Maltese | 32 | 0.0% |
| Menominee | 2 | 0.0% |
| Mexican | 31,616 | 8.8% |
| Mexican American Indian | 422 | 0.1% |
| Mongolian | 134 | 0.0% |
| Moroccan | 6 | 0.0% |
| Native Hawaiian | 475 | 0.1% |
| Navajo | 632 | 0.2% |
| New Zealander | 59 | 0.0% |
| Nicaraguan | 98 | 0.0% |
| Nigerian | 84 | 0.0% |
| Northern European | 1,267 | 0.4% |
| Norwegian | 9,712 | 2.7% |
| Osage | 13 | 0.0% |
| Ottawa | 72 | 0.0% |
| Paiute | 3 | 0.0% |
| Pakistani | 337 | 0.1% |
| Palestinian | 29 | 0.0% |
| Panamanian | 307 | 0.1% |
| Pennsylvania German | 90 | 0.0% |
| Peruvian | 329 | 0.1% |
| Polish | 10,102 | 2.8% |
| Portuguese | 982 | 0.3% |
| Potawatomi | 45 | 0.0% |
| Pueblo | 78 | 0.0% |
| Puerto Rican | 1,683 | 0.5% |
| Romanian | 252 | 0.1% |
| Russian | 4,225 | 1.2% |
| Salvadoran | 528 | 0.2% |
| Samoan | 46 | 0.0% |
| Scandinavian | 2,473 | 0.7% |
| Scotch-Irish | 4,514 | 1.3% |
| Scottish | 12,871 | 3.6% |
| Seminole | 52 | 0.0% |
| Serbian | 174 | 0.1% |
| Shoshone | 88 | 0.0% |
| Sioux | 416 | 0.1% |
| Slavic | 420 | 0.1% |
| Slovak | 504 | 0.1% |
| Slovene | 403 | 0.1% |
| South African | 132 | 0.0% |
| South American | 2,581 | 0.7% |
| South American Indian | 31 | 0.0% |
| Spaniard | 1,606 | 0.4% |
| Spanish | 2,135 | 0.6% |
| Spanish American | 15 | 0.0% |
| Spanish American Indian | 7 | 0.0% |
| Sri Lankan | 949 | 0.3% |
| Subsaharan African | 1,296 | 0.4% |
| Swedish | 10,347 | 2.9% |
| Swiss | 2,075 | 0.6% |
| Syrian | 190 | 0.1% |
| Thai | 2,374 | 0.7% |
| Tongan | 14 | 0.0% |
| Trinidadian and Tobagonian | 35 | 0.0% |
| Turkish | 16 | 0.0% |
| Ugandan | 43 | 0.0% |
| Ukrainian | 1,428 | 0.4% |
| Uruguayan | 23 | 0.0% |
| Ute | 86 | 0.0% |
| Venezuelan | 544 | 0.2% |
| Welsh | 3,869 | 1.1% |
| West Indian | 24 | 0.0% |
| Yaqui | 36 | 0.0% |
| Yugoslavian | 120 | 0.0% |
| Yup'ik | 24 | 0.0% | View All 163 Rows |
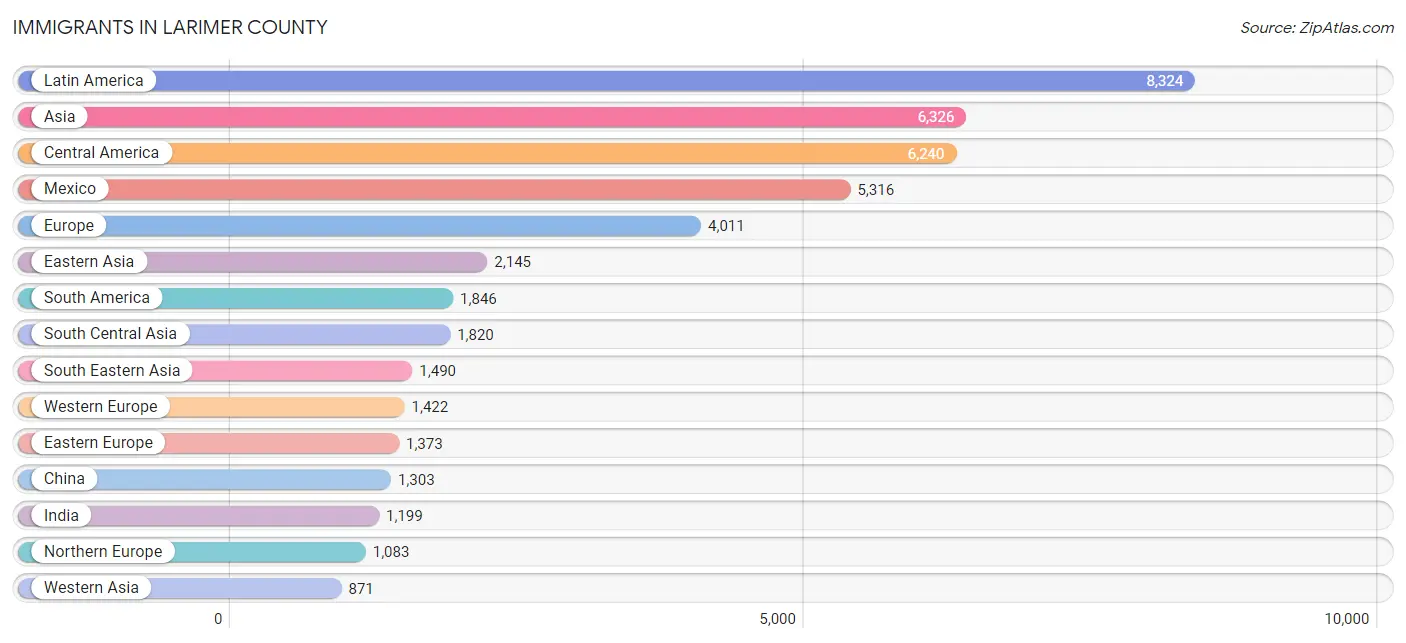
Immigrants in Larimer County
The most numerous immigrant groups reported in Larimer County came from Latin America (8,324 | 2.3%), Asia (6,326 | 1.8%), Central America (6,240 | 1.7%), Mexico (5,316 | 1.5%), and Europe (4,011 | 1.1%), together accounting for 8.4% of all Larimer County residents.
| Immigration Origin | # Population | % Population |
| Afghanistan | 94 | 0.0% |
| Africa | 812 | 0.2% |
| Albania | 13 | 0.0% |
| Argentina | 83 | 0.0% |
| Asia | 6,326 | 1.8% |
| Australia | 257 | 0.1% |
| Austria | 50 | 0.0% |
| Bangladesh | 33 | 0.0% |
| Belarus | 44 | 0.0% |
| Belgium | 99 | 0.0% |
| Belize | 24 | 0.0% |
| Bolivia | 82 | 0.0% |
| Bosnia and Herzegovina | 7 | 0.0% |
| Brazil | 590 | 0.2% |
| Bulgaria | 7 | 0.0% |
| Cambodia | 98 | 0.0% |
| Canada | 619 | 0.2% |
| Caribbean | 238 | 0.1% |
| Central America | 6,240 | 1.7% |
| Chile | 96 | 0.0% |
| China | 1,303 | 0.4% |
| Colombia | 290 | 0.1% |
| Costa Rica | 170 | 0.1% |
| Croatia | 13 | 0.0% |
| Cuba | 33 | 0.0% |
| Czechoslovakia | 96 | 0.0% |
| Denmark | 87 | 0.0% |
| Dominican Republic | 91 | 0.0% |
| Eastern Africa | 347 | 0.1% |
| Eastern Asia | 2,145 | 0.6% |
| Eastern Europe | 1,373 | 0.4% |
| Ecuador | 257 | 0.1% |
| Egypt | 49 | 0.0% |
| El Salvador | 199 | 0.1% |
| England | 427 | 0.1% |
| Eritrea | 18 | 0.0% |
| Ethiopia | 251 | 0.1% |
| Europe | 4,011 | 1.1% |
| France | 371 | 0.1% |
| Germany | 697 | 0.2% |
| Ghana | 91 | 0.0% |
| Greece | 27 | 0.0% |
| Guatemala | 306 | 0.1% |
| Guyana | 7 | 0.0% |
| Haiti | 68 | 0.0% |
| Honduras | 33 | 0.0% |
| Hungary | 124 | 0.0% |
| India | 1,199 | 0.3% |
| Indonesia | 83 | 0.0% |
| Iran | 255 | 0.1% |
| Iraq | 73 | 0.0% |
| Ireland | 70 | 0.0% |
| Israel | 31 | 0.0% |
| Italy | 77 | 0.0% |
| Japan | 182 | 0.1% |
| Jordan | 39 | 0.0% |
| Kazakhstan | 23 | 0.0% |
| Kenya | 35 | 0.0% |
| Korea | 660 | 0.2% |
| Kuwait | 240 | 0.1% |
| Latin America | 8,324 | 2.3% |
| Latvia | 22 | 0.0% |
| Lebanon | 61 | 0.0% |
| Lithuania | 39 | 0.0% |
| Malaysia | 139 | 0.0% |
| Mexico | 5,316 | 1.5% |
| Middle Africa | 29 | 0.0% |
| Moldova | 204 | 0.1% |
| Nepal | 156 | 0.0% |
| Netherlands | 127 | 0.0% |
| Nicaragua | 58 | 0.0% |
| Northern Africa | 73 | 0.0% |
| Northern Europe | 1,083 | 0.3% |
| Norway | 7 | 0.0% |
| Oceania | 310 | 0.1% |
| Pakistan | 40 | 0.0% |
| Panama | 134 | 0.0% |
| Peru | 78 | 0.0% |
| Philippines | 415 | 0.1% |
| Poland | 127 | 0.0% |
| Portugal | 14 | 0.0% |
| Romania | 9 | 0.0% |
| Russia | 320 | 0.1% |
| Saudi Arabia | 15 | 0.0% |
| Scotland | 66 | 0.0% |
| Serbia | 23 | 0.0% |
| Singapore | 43 | 0.0% |
| South Africa | 161 | 0.0% |
| South America | 1,846 | 0.5% |
| South Central Asia | 1,820 | 0.5% |
| South Eastern Asia | 1,490 | 0.4% |
| Southern Europe | 133 | 0.0% |
| Spain | 15 | 0.0% |
| Sri Lanka | 14 | 0.0% |
| Sudan | 15 | 0.0% |
| Sweden | 51 | 0.0% |
| Switzerland | 78 | 0.0% |
| Taiwan | 172 | 0.1% |
| Thailand | 157 | 0.0% |
| Trinidad and Tobago | 46 | 0.0% |
| Turkey | 75 | 0.0% |
| Uganda | 43 | 0.0% |
| Ukraine | 278 | 0.1% |
| Uruguay | 6 | 0.0% |
| Uzbekistan | 6 | 0.0% |
| Venezuela | 357 | 0.1% |
| Vietnam | 512 | 0.1% |
| Western Africa | 188 | 0.1% |
| Western Asia | 871 | 0.2% |
| Western Europe | 1,422 | 0.4% | View All 110 Rows |
Sex and Age in Larimer County
Sex and Age in Larimer County
The most populous age groups in Larimer County are 20 to 24 Years (19,345 | 10.7%) for men and 20 to 24 Years (18,789 | 10.5%) for women.

| Age Bracket | Male | Female |
| Under 5 Years | 8,364 (4.6%) | 7,989 (4.5%) |
| 5 to 9 Years | 9,318 (5.2%) | 8,745 (4.9%) |
| 10 to 14 Years | 10,558 (5.9%) | 10,239 (5.7%) |
| 15 to 19 Years | 13,348 (7.4%) | 13,534 (7.5%) |
| 20 to 24 Years | 19,345 (10.7%) | 18,789 (10.5%) |
| 25 to 29 Years | 14,904 (8.3%) | 13,263 (7.4%) |
| 30 to 34 Years | 12,924 (7.2%) | 11,597 (6.5%) |
| 35 to 39 Years | 12,197 (6.8%) | 11,006 (6.1%) |
| 40 to 44 Years | 11,395 (6.3%) | 11,062 (6.2%) |
| 45 to 49 Years | 10,425 (5.8%) | 9,511 (5.3%) |
| 50 to 54 Years | 9,673 (5.4%) | 9,395 (5.2%) |
| 55 to 59 Years | 10,292 (5.7%) | 11,183 (6.2%) |
| 60 to 64 Years | 10,274 (5.7%) | 11,013 (6.1%) |
| 65 to 69 Years | 9,871 (5.5%) | 10,769 (6.0%) |
| 70 to 74 Years | 7,782 (4.3%) | 8,303 (4.6%) |
| 75 to 79 Years | 4,720 (2.6%) | 5,417 (3.0%) |
| 80 to 84 Years | 2,292 (1.3%) | 3,208 (1.8%) |
| 85 Years and over | 2,511 (1.4%) | 4,147 (2.3%) |
| Total | 180,193 (100.0%) | 179,170 (100.0%) |
Families and Households in Larimer County
Median Family Size in Larimer County
The median family size in Larimer County is 2.84 persons per family, with married-couple families (75,347 | 83.4%) accounting for the largest median family size of 2.88 persons per family. On the other hand, single male/father families (5,203 | 5.8%) represent the smallest median family size with 2.39 persons per family.
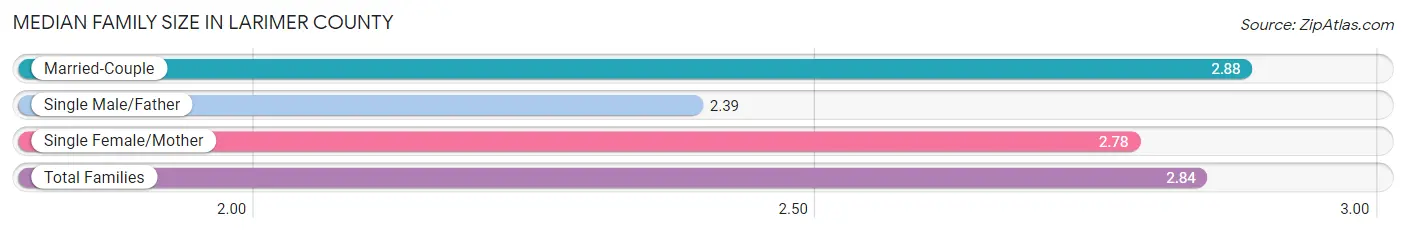
| Family Type | # Families | Family Size |
| Married-Couple | 75,347 (83.4%) | 2.88 |
| Single Male/Father | 5,203 (5.8%) | 2.39 |
| Single Female/Mother | 9,792 (10.8%) | 2.78 |
| Total Families | 90,342 (100.0%) | 2.84 |
Median Household Size in Larimer County
The median household size in Larimer County is 2.35 persons per household, with single female/mother households (9,792 | 6.6%) accounting for the largest median household size of 3.04 persons per household. non-family households (58,509 | 39.3%) represent the smallest median household size with 1.47 persons per household.
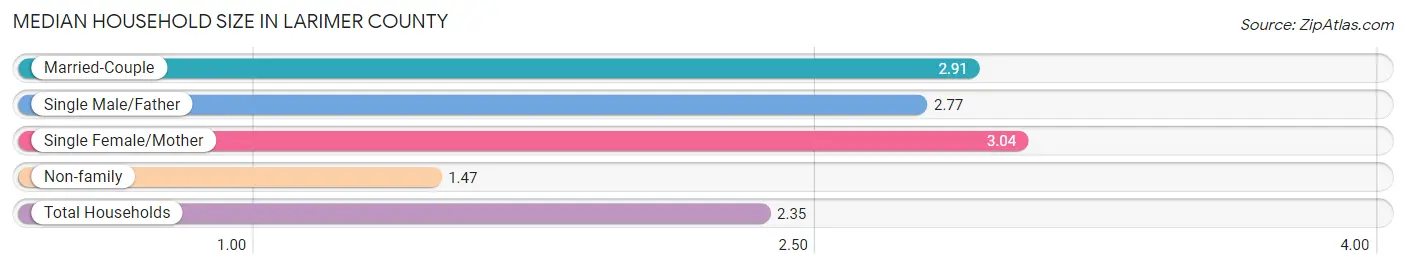
| Household Type | # Households | Household Size |
| Married-Couple | 75,347 (50.6%) | 2.91 |
| Single Male/Father | 5,203 (3.5%) | 2.77 |
| Single Female/Mother | 9,792 (6.6%) | 3.04 |
| Non-family | 58,509 (39.3%) | 1.47 |
| Total Households | 148,851 (100.0%) | 2.35 |
Household Size by Marriage Status in Larimer County
Out of a total of 148,851 households in Larimer County, 90,342 (60.7%) are family households, while 58,509 (39.3%) are nonfamily households. The most numerous type of family households are 2-person households, comprising 44,471, and the most common type of nonfamily households are 1-person households, comprising 36,520.
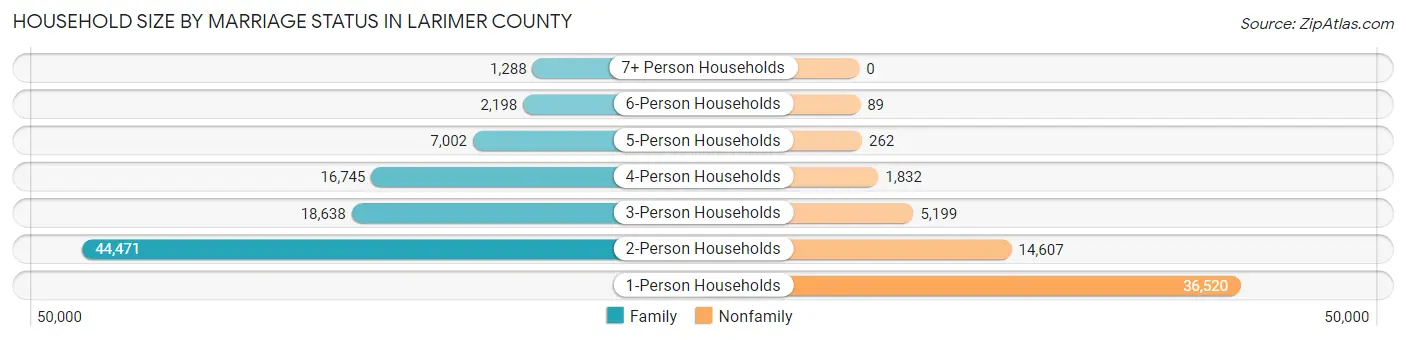
| Household Size | Family Households | Nonfamily Households |
| 1-Person Households | - | 36,520 (24.5%) |
| 2-Person Households | 44,471 (29.9%) | 14,607 (9.8%) |
| 3-Person Households | 18,638 (12.5%) | 5,199 (3.5%) |
| 4-Person Households | 16,745 (11.3%) | 1,832 (1.2%) |
| 5-Person Households | 7,002 (4.7%) | 262 (0.2%) |
| 6-Person Households | 2,198 (1.5%) | 89 (0.1%) |
| 7+ Person Households | 1,288 (0.9%) | 0 (0.0%) |
| Total | 90,342 (60.7%) | 58,509 (39.3%) |
Female Fertility in Larimer County
Fertility by Age in Larimer County
Average fertility rate in Larimer County is 47.0 births per 1,000 women. Women in the age bracket of 20 to 34 years have the highest fertility rate with 63.0 births per 1,000 women. Women in the age bracket of 20 to 34 years acount for 63.4% of all women with births.
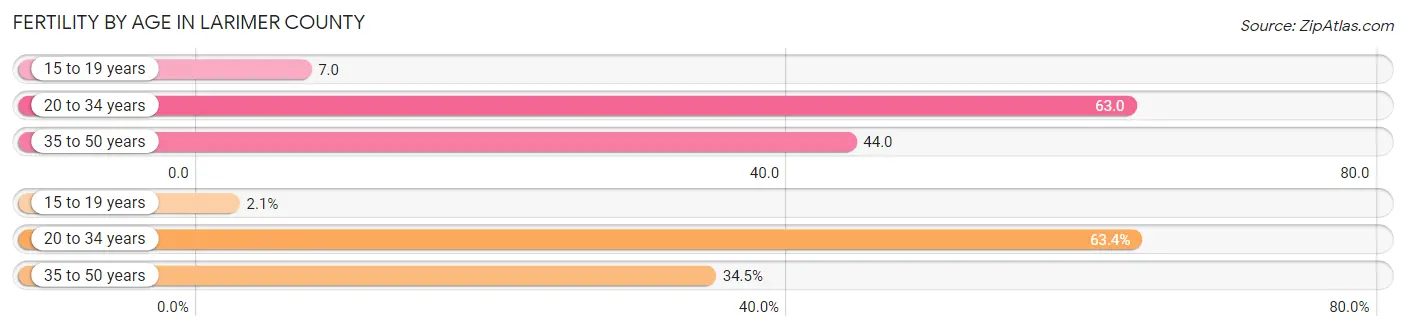
| Age Bracket | Women with Births | Births / 1,000 Women |
| 15 to 19 years | 92 (2.1%) | 7.0 |
| 20 to 34 years | 2,730 (63.4%) | 63.0 |
| 35 to 50 years | 1,484 (34.5%) | 44.0 |
| Total | 4,306 (100.0%) | 47.0 |
Fertility by Age by Marriage Status in Larimer County
82.2% of women with births (4,306) in Larimer County are married. The highest percentage of unmarried women with births falls into 15 to 19 years age bracket with 78.3% of them unmarried at the time of birth, while the lowest percentage of unmarried women with births belong to 35 to 50 years age bracket with 13.4% of them unmarried.
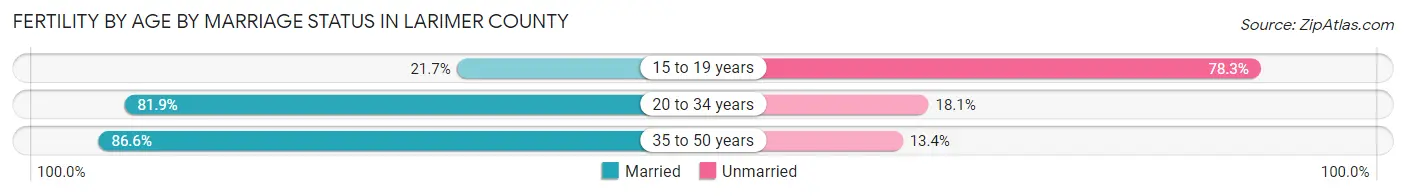
| Age Bracket | Married | Unmarried |
| 15 to 19 years | 20 (21.7%) | 72 (78.3%) |
| 20 to 34 years | 2,236 (81.9%) | 494 (18.1%) |
| 35 to 50 years | 1,285 (86.6%) | 199 (13.4%) |
| Total | 3,540 (82.2%) | 766 (17.8%) |
Fertility by Education in Larimer County
Average fertility rate in Larimer County is 47.0 births per 1,000 women. Women with the education attainment of graduate degree have the highest fertility rate of 79.0 births per 1,000 women, while women with the education attainment of less than high school have the lowest fertility at 26.0 births per 1,000 women. Women with the education attainment of bachelor's degree represent 30.9% of all women with births.
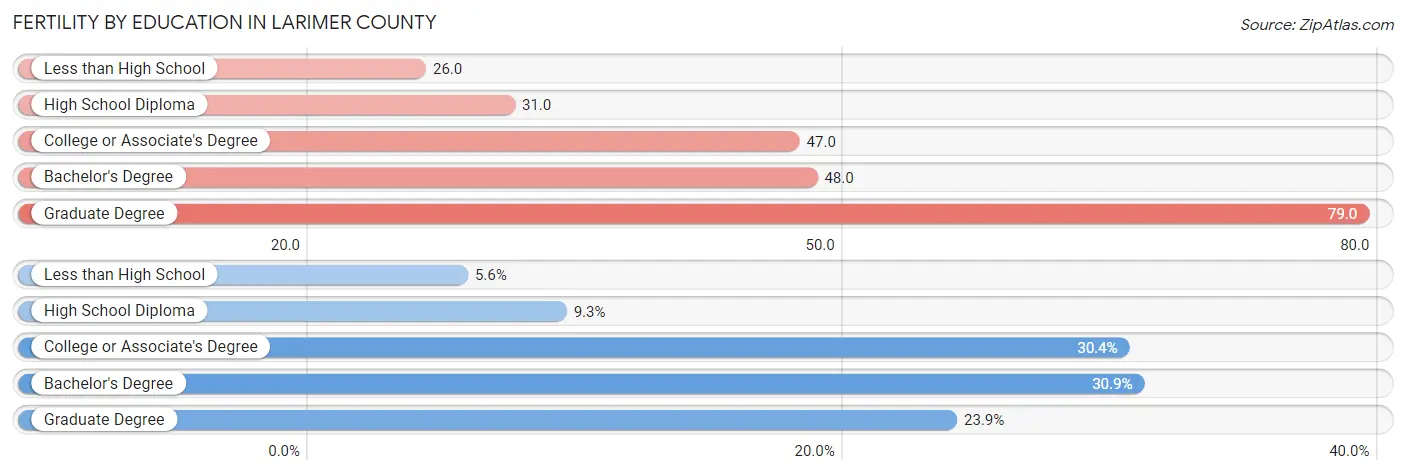
| Educational Attainment | Women with Births | Births / 1,000 Women |
| Less than High School | 240 (5.6%) | 26.0 |
| High School Diploma | 399 (9.3%) | 31.0 |
| College or Associate's Degree | 1,307 (30.3%) | 47.0 |
| Bachelor's Degree | 1,331 (30.9%) | 48.0 |
| Graduate Degree | 1,029 (23.9%) | 79.0 |
| Total | 4,306 (100.0%) | 47.0 |
Fertility by Education by Marriage Status in Larimer County
17.8% of women with births in Larimer County are unmarried. Women with the educational attainment of bachelor's degree are most likely to be married with 94.3% of them married at childbirth, while women with the educational attainment of high school diploma are least likely to be married with 40.1% of them unmarried at childbirth.
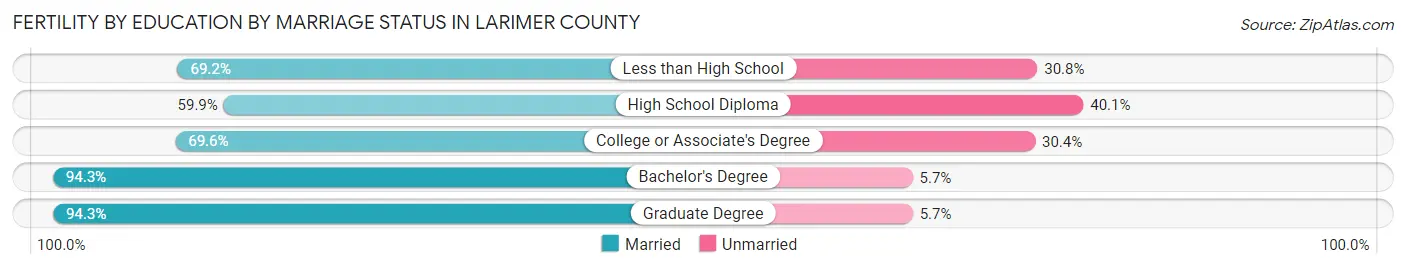
| Educational Attainment | Married | Unmarried |
| Less than High School | 166 (69.2%) | 74 (30.8%) |
| High School Diploma | 239 (59.9%) | 160 (40.1%) |
| College or Associate's Degree | 910 (69.6%) | 397 (30.4%) |
| Bachelor's Degree | 1,255 (94.3%) | 76 (5.7%) |
| Graduate Degree | 970 (94.3%) | 59 (5.7%) |
| Total | 3,540 (82.2%) | 766 (17.8%) |
Income in Larimer County
Income Overview in Larimer County
Per Capita Income in Larimer County is $46,676, while median incomes of families and households are $112,985 and $87,199 respectively.
| Characteristic | Number | Measure |
| Per Capita Income | 359,363 | $46,676 |
| Median Family Income | 90,342 | $112,985 |
| Mean Family Income | 90,342 | $140,171 |
| Median Household Income | 148,851 | $87,199 |
| Mean Household Income | 148,851 | $113,592 |
| Income Deficit | 90,342 | $11,021 |
| Wage / Income Gap (%) | 359,363 | 36.94% |
| Wage / Income Gap ($) | 359,363 | 63.06¢ per $1 |
| Gini / Inequality Index | 359,363 | 0.45 |
Earnings by Sex in Larimer County
Average Earnings in Larimer County are $42,552, $53,562 for men and $33,776 for women, a difference of 36.9%.
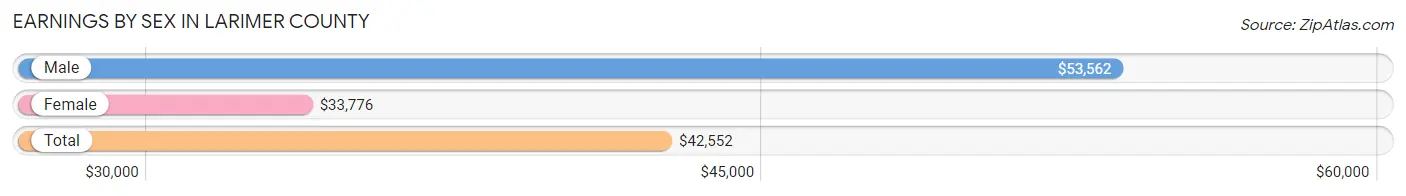
| Sex | Number | Average Earnings |
| Male | 115,700 (53.5%) | $53,562 |
| Female | 100,527 (46.5%) | $33,776 |
| Total | 216,227 (100.0%) | $42,552 |
Earnings by Sex by Income Bracket in Larimer County
The most common earnings brackets in Larimer County are $100,000+ for men (26,707 | 23.1%) and $100,000+ for women (9,188 | 9.1%).
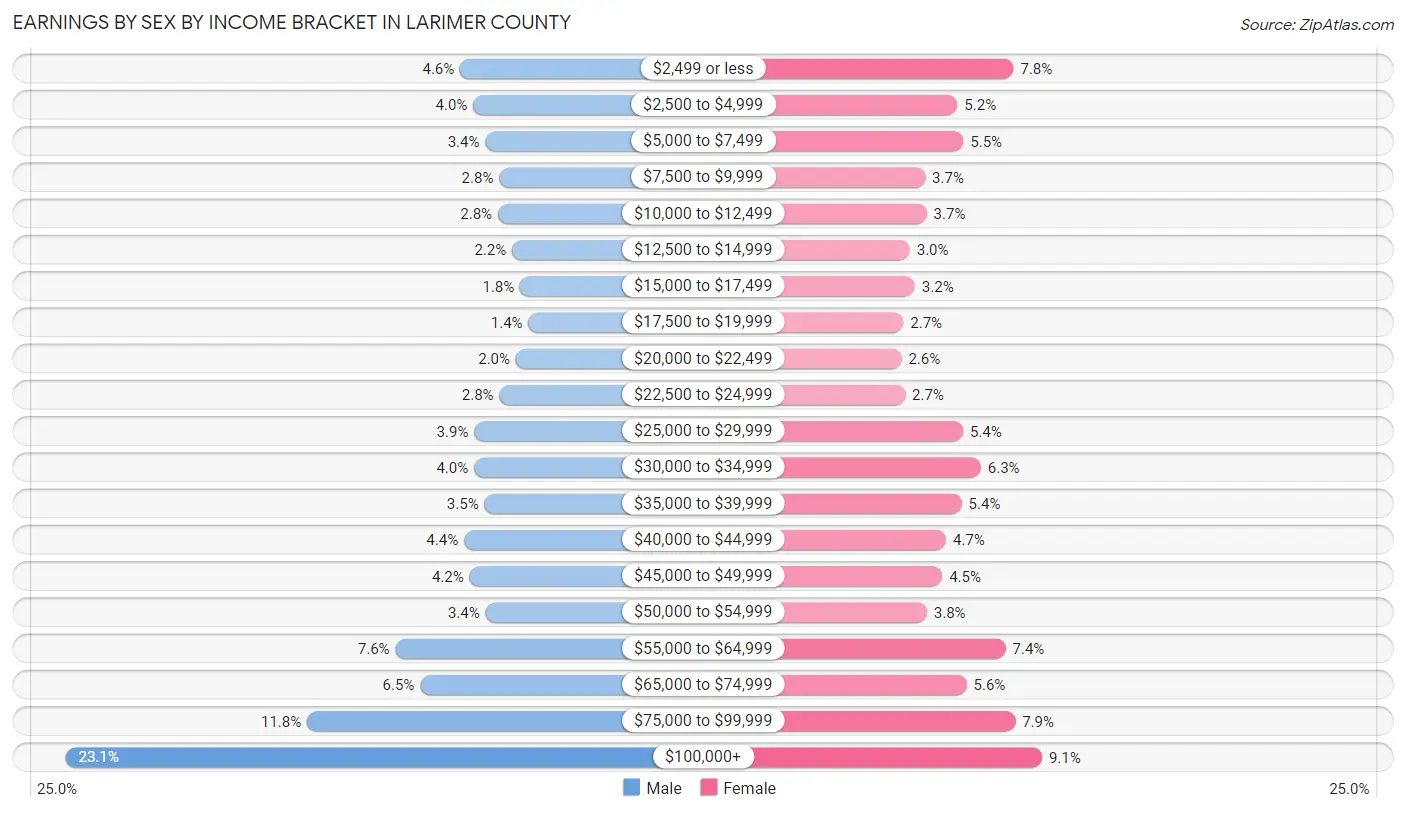
| Income | Male | Female |
| $2,499 or less | 5,318 (4.6%) | 7,856 (7.8%) |
| $2,500 to $4,999 | 4,619 (4.0%) | 5,206 (5.2%) |
| $5,000 to $7,499 | 3,959 (3.4%) | 5,493 (5.5%) |
| $7,500 to $9,999 | 3,206 (2.8%) | 3,686 (3.7%) |
| $10,000 to $12,499 | 3,270 (2.8%) | 3,758 (3.7%) |
| $12,500 to $14,999 | 2,508 (2.2%) | 2,970 (2.9%) |
| $15,000 to $17,499 | 2,068 (1.8%) | 3,210 (3.2%) |
| $17,500 to $19,999 | 1,615 (1.4%) | 2,666 (2.6%) |
| $20,000 to $22,499 | 2,300 (2.0%) | 2,575 (2.6%) |
| $22,500 to $24,999 | 3,189 (2.8%) | 2,749 (2.7%) |
| $25,000 to $29,999 | 4,553 (3.9%) | 5,464 (5.4%) |
| $30,000 to $34,999 | 4,572 (4.0%) | 6,316 (6.3%) |
| $35,000 to $39,999 | 4,006 (3.5%) | 5,407 (5.4%) |
| $40,000 to $44,999 | 5,109 (4.4%) | 4,673 (4.6%) |
| $45,000 to $49,999 | 4,817 (4.2%) | 4,496 (4.5%) |
| $50,000 to $54,999 | 3,948 (3.4%) | 3,770 (3.7%) |
| $55,000 to $64,999 | 8,825 (7.6%) | 7,478 (7.4%) |
| $65,000 to $74,999 | 7,491 (6.5%) | 5,637 (5.6%) |
| $75,000 to $99,999 | 13,620 (11.8%) | 7,929 (7.9%) |
| $100,000+ | 26,707 (23.1%) | 9,188 (9.1%) |
| Total | 115,700 (100.0%) | 100,527 (100.0%) |
Earnings by Sex by Educational Attainment in Larimer County
Average earnings in Larimer County are $66,491 for men and $44,098 for women, a difference of 33.7%. Men with an educational attainment of graduate degree enjoy the highest average annual earnings of $101,405, while those with less than high school education earn the least with $43,157. Women with an educational attainment of graduate degree earn the most with the average annual earnings of $64,257, while those with less than high school education have the smallest earnings of $20,697.
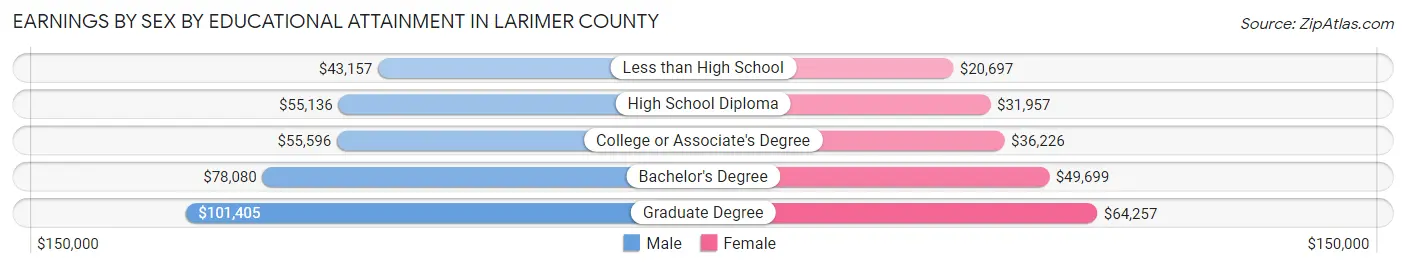
| Educational Attainment | Male Income | Female Income |
| Less than High School | $43,157 | $20,697 |
| High School Diploma | $55,136 | $31,957 |
| College or Associate's Degree | $55,596 | $36,226 |
| Bachelor's Degree | $78,080 | $49,699 |
| Graduate Degree | $101,405 | $64,257 |
| Total | $66,491 | $44,098 |
Family Income in Larimer County
Family Income Brackets in Larimer County
According to the Larimer County family income data, there are 21,501 families falling into the $100,000 to $149,999 income range, which is the most common income bracket and makes up 23.8% of all families. Conversely, the $10,000 to $14,999 income bracket is the least frequent group with only 723 families (0.8%) belonging to this category.
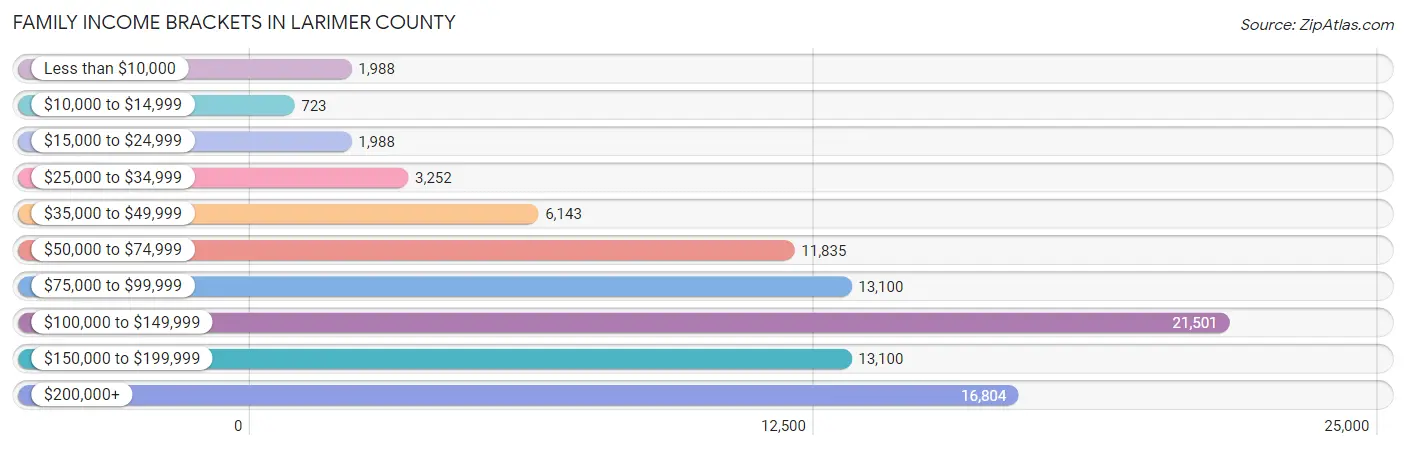
| Income Bracket | # Families | % Families |
| Less than $10,000 | 1,988 | 2.2% |
| $10,000 to $14,999 | 723 | 0.8% |
| $15,000 to $24,999 | 1,988 | 2.2% |
| $25,000 to $34,999 | 3,252 | 3.6% |
| $35,000 to $49,999 | 6,143 | 6.8% |
| $50,000 to $74,999 | 11,835 | 13.1% |
| $75,000 to $99,999 | 13,100 | 14.5% |
| $100,000 to $149,999 | 21,501 | 23.8% |
| $150,000 to $199,999 | 13,100 | 14.5% |
| $200,000+ | 16,804 | 18.6% |
Family Income by Famaliy Size in Larimer County
7+ person families (1,091 | 1.2%) account for the highest median family income in Larimer County with $188,125 per family, while 2-person families (47,844 | 53.0%) have the highest median income of $48,266 per family member.
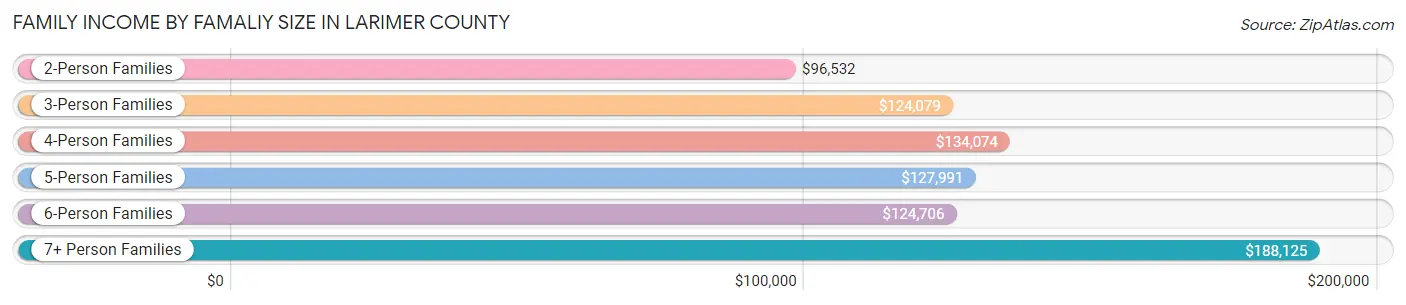
| Income Bracket | # Families | Median Income |
| 2-Person Families | 47,844 (53.0%) | $96,532 |
| 3-Person Families | 17,301 (19.2%) | $124,079 |
| 4-Person Families | 15,530 (17.2%) | $134,074 |
| 5-Person Families | 6,550 (7.2%) | $127,991 |
| 6-Person Families | 2,026 (2.2%) | $124,706 |
| 7+ Person Families | 1,091 (1.2%) | $188,125 |
| Total | 90,342 (100.0%) | $112,985 |
Family Income by Number of Earners in Larimer County
The median family income in Larimer County is $112,985, with families comprising 3+ earners (9,754) having the highest median family income of $159,783, while families with no earners (13,468) have the lowest median family income of $75,302, accounting for 10.8% and 14.9% of families, respectively.
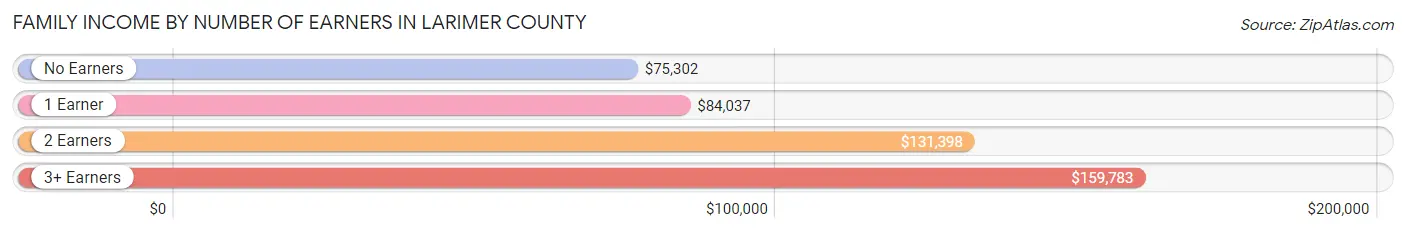
| Number of Earners | # Families | Median Income |
| No Earners | 13,468 (14.9%) | $75,302 |
| 1 Earner | 24,928 (27.6%) | $84,037 |
| 2 Earners | 42,192 (46.7%) | $131,398 |
| 3+ Earners | 9,754 (10.8%) | $159,783 |
| Total | 90,342 (100.0%) | $112,985 |
Household Income in Larimer County
Household Income Brackets in Larimer County
With 28,728 households falling in the category, the $100,000 to $149,999 income range is the most frequent in Larimer County, accounting for 19.3% of all households. In contrast, only 4,019 households (2.7%) fall into the $10,000 to $14,999 income bracket, making it the least populous group.
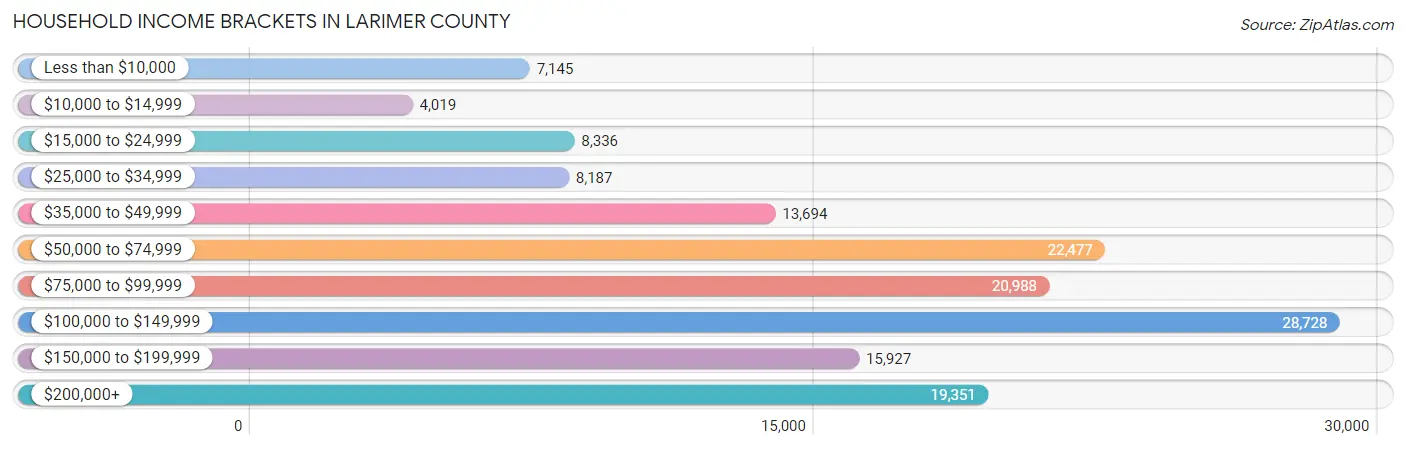
| Income Bracket | # Households | % Households |
| Less than $10,000 | 7,145 | 4.8% |
| $10,000 to $14,999 | 4,019 | 2.7% |
| $15,000 to $24,999 | 8,336 | 5.6% |
| $25,000 to $34,999 | 8,187 | 5.5% |
| $35,000 to $49,999 | 13,694 | 9.2% |
| $50,000 to $74,999 | 22,477 | 15.1% |
| $75,000 to $99,999 | 20,988 | 14.1% |
| $100,000 to $149,999 | 28,728 | 19.3% |
| $150,000 to $199,999 | 15,927 | 10.7% |
| $200,000+ | 19,351 | 13.0% |
Household Income by Householder Age in Larimer County
The median household income in Larimer County is $87,199, with the highest median household income of $113,574 found in the 45 to 64 years age bracket for the primary householder. A total of 46,429 households (31.2%) fall into this category. Meanwhile, the 15 to 24 years age bracket for the primary householder has the lowest median household income of $36,711, with 15,341 households (10.3%) in this group.
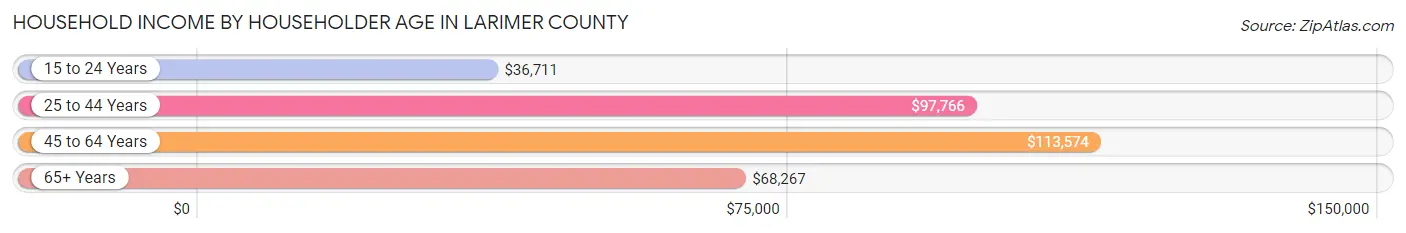
| Income Bracket | # Households | Median Income |
| 15 to 24 Years | 15,341 (10.3%) | $36,711 |
| 25 to 44 Years | 49,735 (33.4%) | $97,766 |
| 45 to 64 Years | 46,429 (31.2%) | $113,574 |
| 65+ Years | 37,346 (25.1%) | $68,267 |
| Total | 148,851 (100.0%) | $87,199 |
Poverty in Larimer County
Income Below Poverty by Sex and Age in Larimer County
With 10.5% poverty level for males and 12.4% for females among the residents of Larimer County, 18 to 24 year old males and 18 to 24 year old females are the most vulnerable to poverty, with 7,983 males (34.6%) and 9,557 females (41.7%) in their respective age groups living below the poverty level.
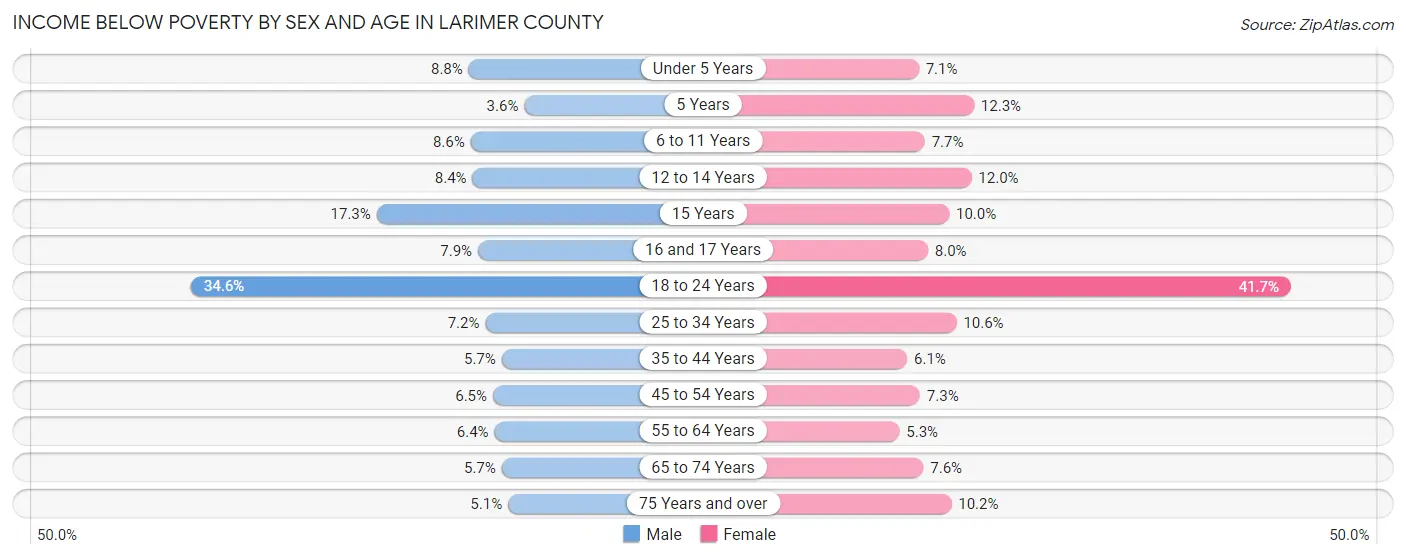
| Age Bracket | Male | Female |
| Under 5 Years | 723 (8.8%) | 567 (7.1%) |
| 5 Years | 73 (3.6%) | 241 (12.3%) |
| 6 to 11 Years | 938 (8.6%) | 825 (7.7%) |
| 12 to 14 Years | 566 (8.4%) | 718 (12.0%) |
| 15 Years | 411 (17.3%) | 185 (10.0%) |
| 16 and 17 Years | 310 (7.9%) | 339 (8.0%) |
| 18 to 24 Years | 7,983 (34.6%) | 9,557 (41.7%) |
| 25 to 34 Years | 1,990 (7.2%) | 2,633 (10.6%) |
| 35 to 44 Years | 1,337 (5.7%) | 1,332 (6.1%) |
| 45 to 54 Years | 1,309 (6.5%) | 1,368 (7.2%) |
| 55 to 64 Years | 1,312 (6.4%) | 1,185 (5.3%) |
| 65 to 74 Years | 1,004 (5.7%) | 1,435 (7.6%) |
| 75 Years and over | 474 (5.1%) | 1,242 (10.2%) |
| Total | 18,430 (10.5%) | 21,627 (12.4%) |
Income Above Poverty by Sex and Age in Larimer County
According to the poverty statistics in Larimer County, males aged 5 years and females aged 55 to 64 years are the age groups that are most secure financially, with 96.4% of males and 94.7% of females in these age groups living above the poverty line.
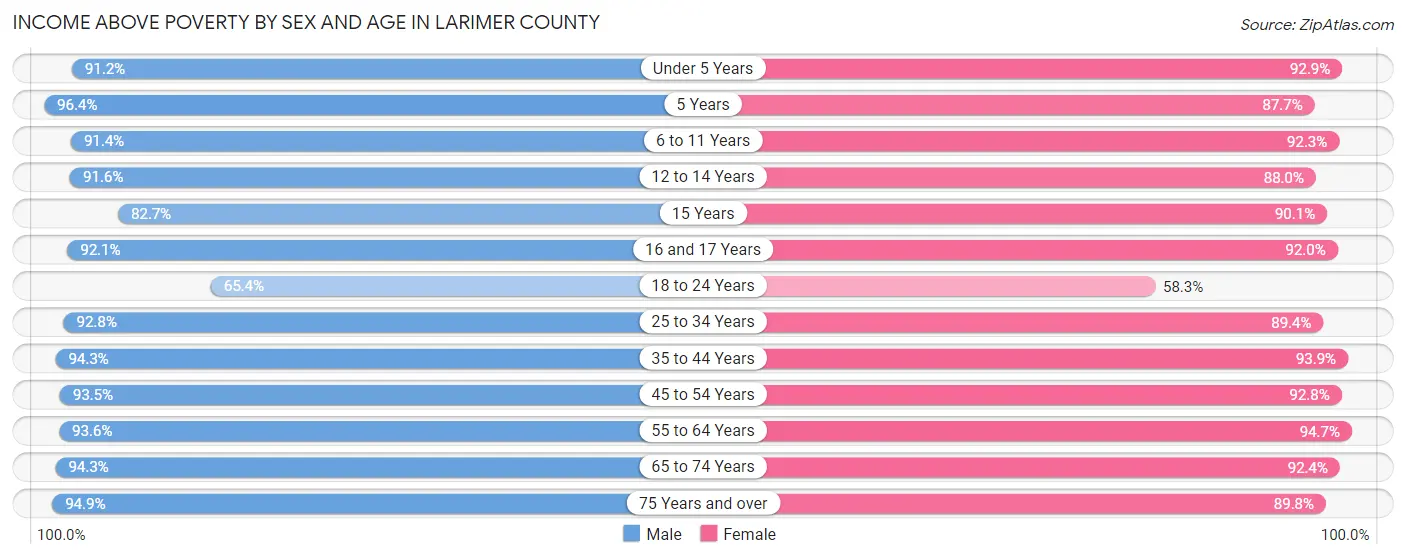
| Age Bracket | Male | Female |
| Under 5 Years | 7,501 (91.2%) | 7,372 (92.9%) |
| 5 Years | 1,937 (96.4%) | 1,724 (87.7%) |
| 6 to 11 Years | 9,960 (91.4%) | 9,891 (92.3%) |
| 12 to 14 Years | 6,143 (91.6%) | 5,248 (88.0%) |
| 15 Years | 1,960 (82.7%) | 1,674 (90.0%) |
| 16 and 17 Years | 3,598 (92.1%) | 3,902 (92.0%) |
| 18 to 24 Years | 15,118 (65.4%) | 13,380 (58.3%) |
| 25 to 34 Years | 25,478 (92.8%) | 22,112 (89.4%) |
| 35 to 44 Years | 22,011 (94.3%) | 20,631 (93.9%) |
| 45 to 54 Years | 18,712 (93.5%) | 17,491 (92.7%) |
| 55 to 64 Years | 19,180 (93.6%) | 20,994 (94.7%) |
| 65 to 74 Years | 16,531 (94.3%) | 17,529 (92.4%) |
| 75 Years and over | 8,745 (94.9%) | 10,982 (89.8%) |
| Total | 156,874 (89.5%) | 152,930 (87.6%) |
Income Below Poverty Among Married-Couple Families in Larimer County
The poverty statistics for married-couple families in Larimer County show that 2.6% or 1,965 of the total 75,347 families live below the poverty line. Families with 3 or 4 children have the highest poverty rate of 7.0%, comprising of 368 families. On the other hand, families with 5 or more children have the lowest poverty rate of 2.1%, which includes 13 families.
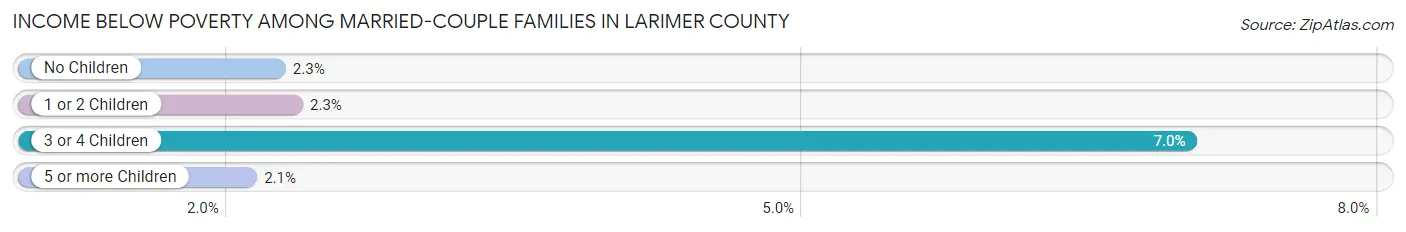
| Children | Above Poverty | Below Poverty |
| No Children | 45,512 (97.8%) | 1,047 (2.2%) |
| 1 or 2 Children | 22,380 (97.7%) | 537 (2.3%) |
| 3 or 4 Children | 4,885 (93.0%) | 368 (7.0%) |
| 5 or more Children | 605 (97.9%) | 13 (2.1%) |
| Total | 73,382 (97.4%) | 1,965 (2.6%) |
Income Below Poverty Among Single-Parent Households in Larimer County
According to the poverty data in Larimer County, 16.5% or 860 single-father households and 16.6% or 1,626 single-mother households are living below the poverty line. Among single-father households, those with 1 or 2 children have the highest poverty rate, with 668 households (24.5%) experiencing poverty. Likewise, among single-mother households, those with 5 or more children have the highest poverty rate, with 16 households (44.4%) falling below the poverty line.
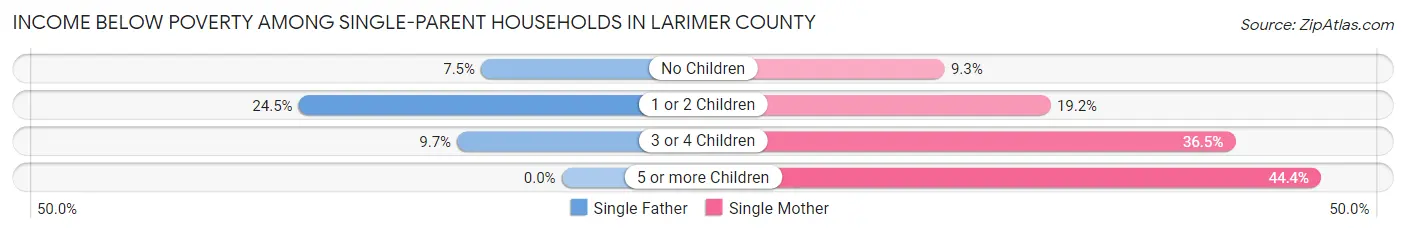
| Children | Single Father | Single Mother |
| No Children | 166 (7.5%) | 388 (9.3%) |
| 1 or 2 Children | 668 (24.5%) | 914 (19.2%) |
| 3 or 4 Children | 26 (9.7%) | 308 (36.4%) |
| 5 or more Children | 0 (0.0%) | 16 (44.4%) |
| Total | 860 (16.5%) | 1,626 (16.6%) |
Income Below Poverty Among Married-Couple vs Single-Parent Households in Larimer County
The poverty data for Larimer County shows that 1,965 of the married-couple family households (2.6%) and 2,486 of the single-parent households (16.6%) are living below the poverty level. Within the married-couple family households, those with 3 or 4 children have the highest poverty rate, with 368 households (7.0%) falling below the poverty line. Among the single-parent households, those with 5 or more children have the highest poverty rate, with 16 household (44.4%) living below poverty.
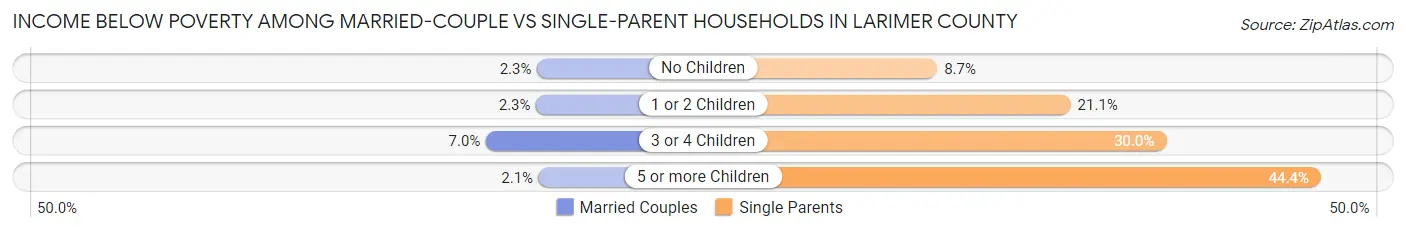
| Children | Married-Couple Families | Single-Parent Households |
| No Children | 1,047 (2.2%) | 554 (8.7%) |
| 1 or 2 Children | 537 (2.3%) | 1,582 (21.1%) |
| 3 or 4 Children | 368 (7.0%) | 334 (30.0%) |
| 5 or more Children | 13 (2.1%) | 16 (44.4%) |
| Total | 1,965 (2.6%) | 2,486 (16.6%) |
Employment Characteristics in Larimer County
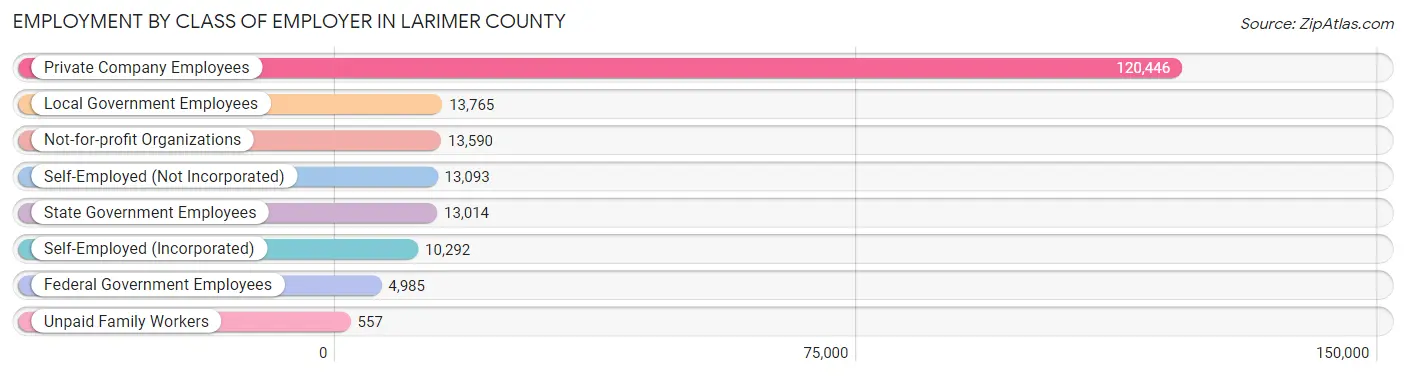
Employment by Class of Employer in Larimer County
Among the 189,742 employed individuals in Larimer County, private company employees (120,446 | 63.5%), local government employees (13,765 | 7.2%), and not-for-profit organizations (13,590 | 7.2%) make up the most common classes of employment.
| Employer Class | # Employees | % Employees |
| Private Company Employees | 120,446 | 63.5% |
| Self-Employed (Incorporated) | 10,292 | 5.4% |
| Self-Employed (Not Incorporated) | 13,093 | 6.9% |
| Not-for-profit Organizations | 13,590 | 7.2% |
| Local Government Employees | 13,765 | 7.2% |
| State Government Employees | 13,014 | 6.9% |
| Federal Government Employees | 4,985 | 2.6% |
| Unpaid Family Workers | 557 | 0.3% |
| Total | 189,742 | 100.0% |
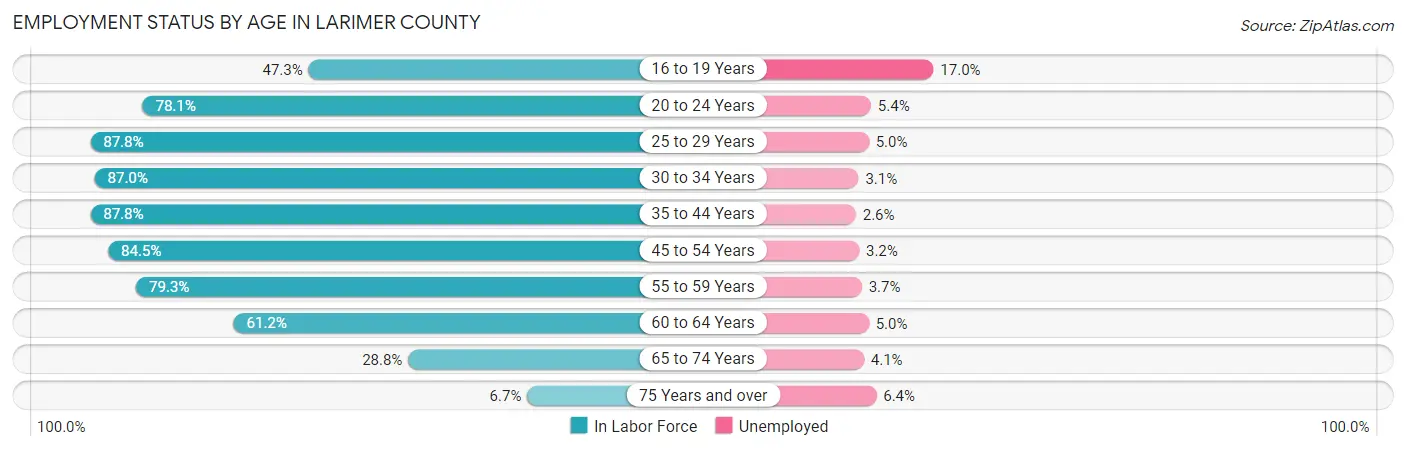
Employment Status by Age in Larimer County
According to the labor force statistics for Larimer County, out of the total population over 16 years of age (299,918), 67.3% or 201,845 individuals are in the labor force, with 4.6% or 9,285 of them unemployed. The age group with the highest labor force participation rate is 25 to 29 years, with 87.8% or 24,731 individuals in the labor force. Within the labor force, the 16 to 19 years age range has the highest percentage of unemployed individuals, with 17.0% or 1,821 of them being unemployed.
| Age Bracket | In Labor Force | Unemployed |
| 16 to 19 Years | 10,713 (47.3%) | 1,821 (17.0%) |
| 20 to 24 Years | 29,783 (78.1%) | 1,608 (5.4%) |
| 25 to 29 Years | 24,731 (87.8%) | 1,237 (5.0%) |
| 30 to 34 Years | 21,333 (87.0%) | 661 (3.1%) |
| 35 to 44 Years | 40,089 (87.8%) | 1,042 (2.6%) |
| 45 to 54 Years | 32,958 (84.5%) | 1,055 (3.2%) |
| 55 to 59 Years | 17,030 (79.3%) | 630 (3.7%) |
| 60 to 64 Years | 13,028 (61.2%) | 651 (5.0%) |
| 65 to 74 Years | 10,577 (28.8%) | 434 (4.1%) |
| 75 Years and over | 1,494 (6.7%) | 96 (6.4%) |
| Total | 201,845 (67.3%) | 9,285 (4.6%) |
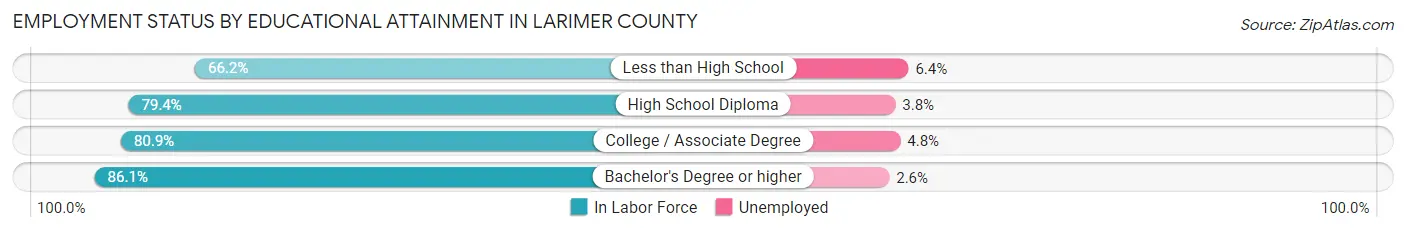
Employment Status by Educational Attainment in Larimer County
According to labor force statistics for Larimer County, 82.8% of individuals (149,134) out of the total population between 25 and 64 years of age (180,114) are in the labor force, with 3.5% or 5,220 of them being unemployed. The group with the highest labor force participation rate are those with the educational attainment of bachelor's degree or higher, with 86.1% or 80,882 individuals in the labor force. Within the labor force, individuals with less than high school education have the highest percentage of unemployment, with 6.4% or 278 of them being unemployed.
| Educational Attainment | In Labor Force | Unemployed |
| Less than High School | 4,348 (66.2%) | 420 (6.4%) |
| High School Diploma | 22,234 (79.4%) | 1,064 (3.8%) |
| College / Associate Degree | 41,748 (80.9%) | 2,477 (4.8%) |
| Bachelor's Degree or higher | 80,882 (86.1%) | 2,442 (2.6%) |
| Total | 149,134 (82.8%) | 6,304 (3.5%) |
Employment Occupations by Sex in Larimer County
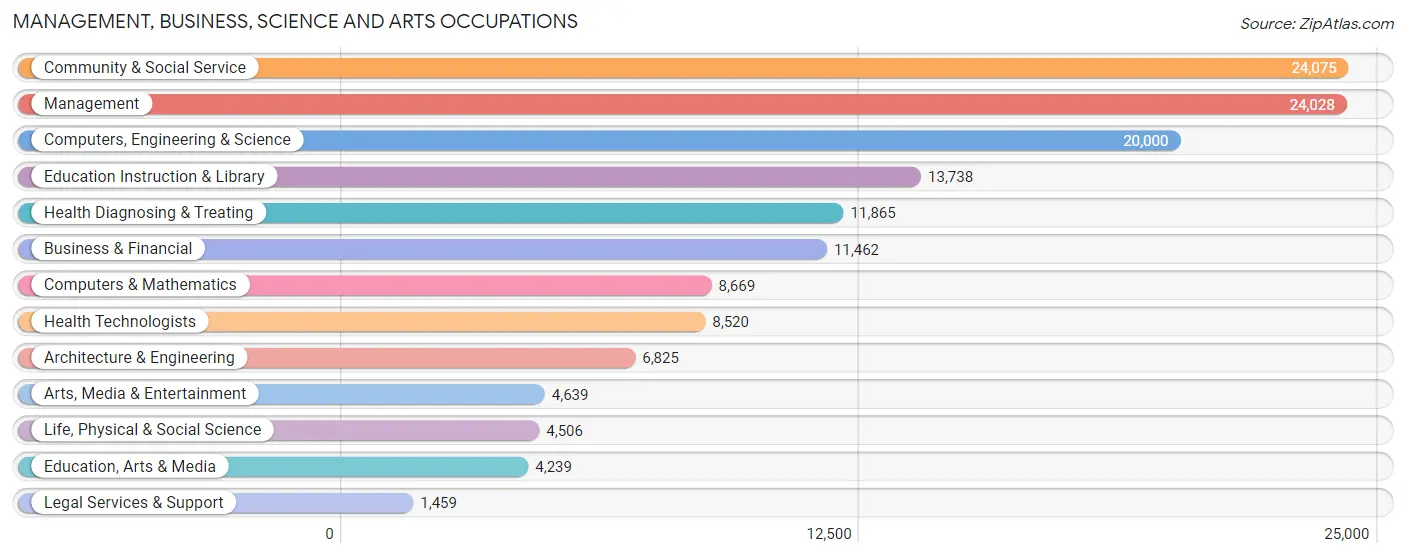
Management, Business, Science and Arts Occupations
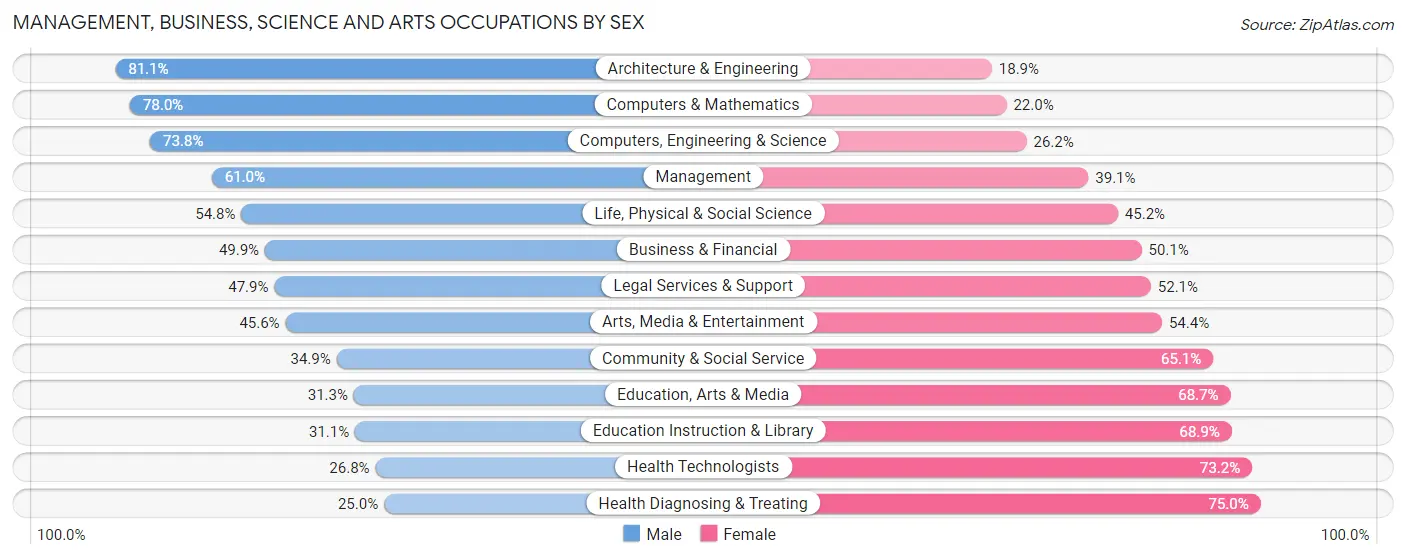
The most common Management, Business, Science and Arts occupations in Larimer County are Community & Social Service (24,075 | 12.6%), Management (24,028 | 12.5%), Computers, Engineering & Science (20,000 | 10.4%), Education Instruction & Library (13,738 | 7.2%), and Health Diagnosing & Treating (11,865 | 6.2%).
Management, Business, Science and Arts Occupations by Sex
Within the Management, Business, Science and Arts occupations in Larimer County, the most male-oriented occupations are Architecture & Engineering (81.1%), Computers & Mathematics (78.0%), and Computers, Engineering & Science (73.8%), while the most female-oriented occupations are Health Diagnosing & Treating (75.0%), Health Technologists (73.2%), and Education Instruction & Library (68.9%).
| Occupation | Male | Female |
| Management | 14,645 (61.0%) | 9,383 (39.1%) |
| Business & Financial | 5,715 (49.9%) | 5,747 (50.1%) |
| Computers, Engineering & Science | 14,767 (73.8%) | 5,233 (26.2%) |
| Computers & Mathematics | 6,764 (78.0%) | 1,905 (22.0%) |
| Architecture & Engineering | 5,534 (81.1%) | 1,291 (18.9%) |
| Life, Physical & Social Science | 2,469 (54.8%) | 2,037 (45.2%) |
| Community & Social Service | 8,410 (34.9%) | 15,665 (65.1%) |
| Education, Arts & Media | 1,328 (31.3%) | 2,911 (68.7%) |
| Legal Services & Support | 699 (47.9%) | 760 (52.1%) |
| Education Instruction & Library | 4,268 (31.1%) | 9,470 (68.9%) |
| Arts, Media & Entertainment | 2,115 (45.6%) | 2,524 (54.4%) |
| Health Diagnosing & Treating | 2,970 (25.0%) | 8,895 (75.0%) |
| Health Technologists | 2,285 (26.8%) | 6,235 (73.2%) |
| Total (Category) | 46,507 (50.9%) | 44,923 (49.1%) |
| Total (Overall) | 103,067 (53.7%) | 88,750 (46.3%) |
Services Occupations
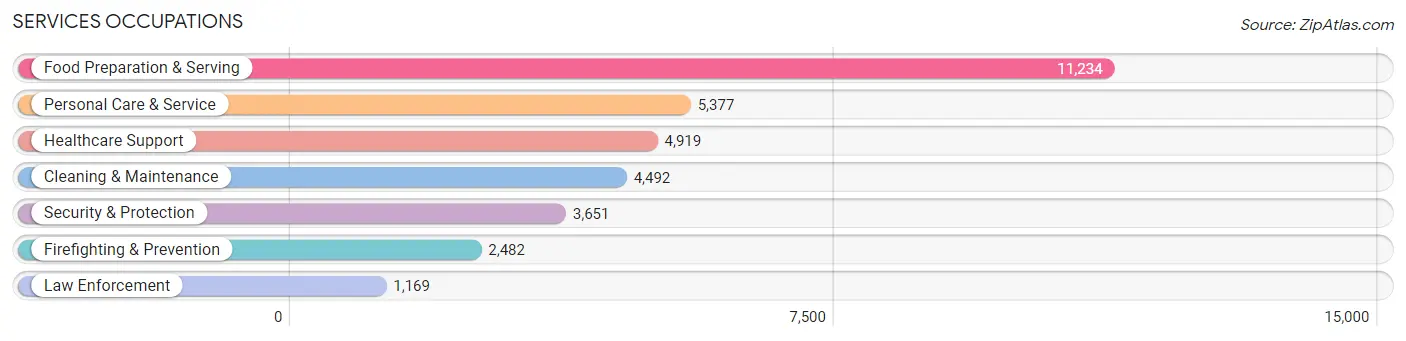
The most common Services occupations in Larimer County are Food Preparation & Serving (11,234 | 5.9%), Personal Care & Service (5,377 | 2.8%), Healthcare Support (4,919 | 2.6%), Cleaning & Maintenance (4,492 | 2.3%), and Security & Protection (3,651 | 1.9%).
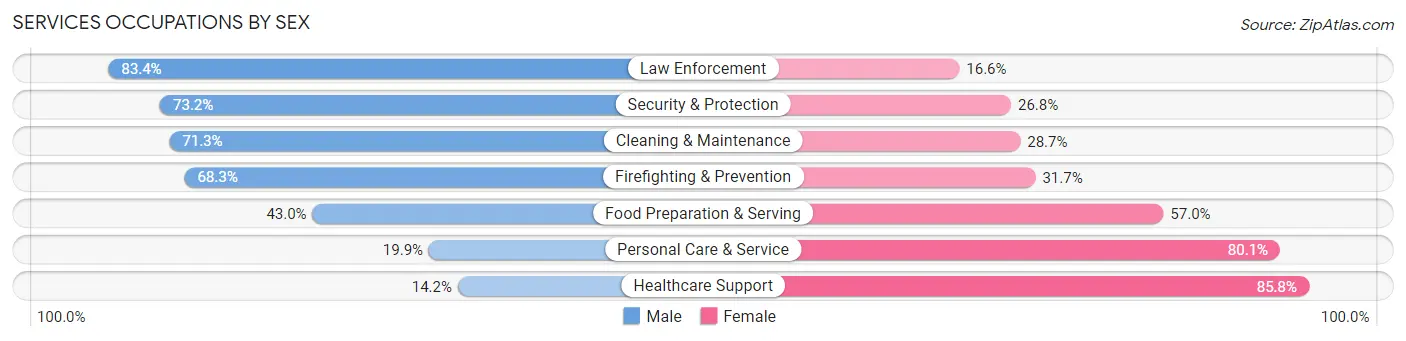
Services Occupations by Sex
Within the Services occupations in Larimer County, the most male-oriented occupations are Law Enforcement (83.4%), Security & Protection (73.2%), and Cleaning & Maintenance (71.3%), while the most female-oriented occupations are Healthcare Support (85.8%), Personal Care & Service (80.1%), and Food Preparation & Serving (57.0%).
| Occupation | Male | Female |
| Healthcare Support | 699 (14.2%) | 4,220 (85.8%) |
| Security & Protection | 2,671 (73.2%) | 980 (26.8%) |
| Firefighting & Prevention | 1,696 (68.3%) | 786 (31.7%) |
| Law Enforcement | 975 (83.4%) | 194 (16.6%) |
| Food Preparation & Serving | 4,831 (43.0%) | 6,403 (57.0%) |
| Cleaning & Maintenance | 3,204 (71.3%) | 1,288 (28.7%) |
| Personal Care & Service | 1,072 (19.9%) | 4,305 (80.1%) |
| Total (Category) | 12,477 (42.0%) | 17,196 (58.0%) |
| Total (Overall) | 103,067 (53.7%) | 88,750 (46.3%) |
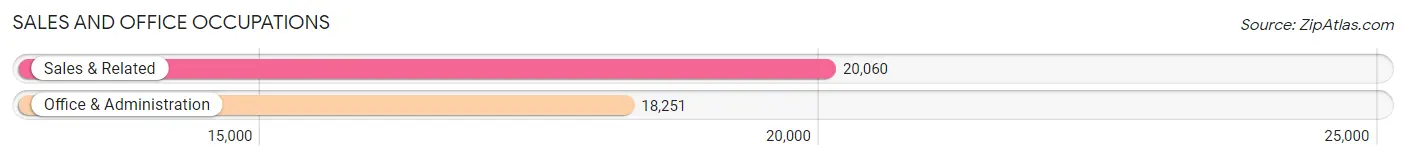
Sales and Office Occupations
The most common Sales and Office occupations in Larimer County are Sales & Related (20,060 | 10.5%), and Office & Administration (18,251 | 9.5%).
Sales and Office Occupations by Sex

| Occupation | Male | Female |
| Sales & Related | 10,697 (53.3%) | 9,363 (46.7%) |
| Office & Administration | 5,187 (28.4%) | 13,064 (71.6%) |
| Total (Category) | 15,884 (41.5%) | 22,427 (58.5%) |
| Total (Overall) | 103,067 (53.7%) | 88,750 (46.3%) |
Natural Resources, Construction and Maintenance Occupations
The most common Natural Resources, Construction and Maintenance occupations in Larimer County are Construction & Extraction (8,403 | 4.4%), Installation, Maintenance & Repair (5,888 | 3.1%), and Farming, Fishing & Forestry (871 | 0.4%).

Natural Resources, Construction and Maintenance Occupations by Sex
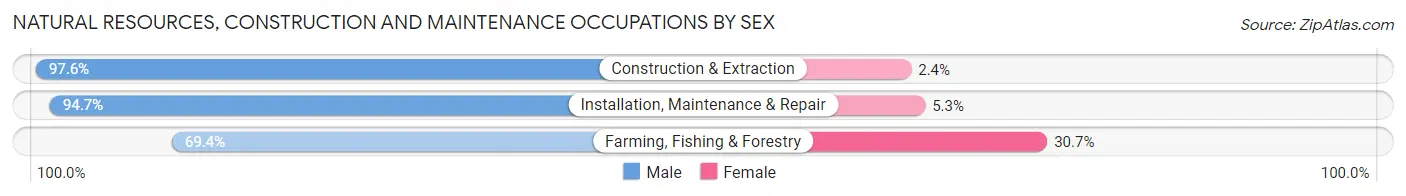
| Occupation | Male | Female |
| Farming, Fishing & Forestry | 604 (69.4%) | 267 (30.6%) |
| Construction & Extraction | 8,205 (97.6%) | 198 (2.4%) |
| Installation, Maintenance & Repair | 5,578 (94.7%) | 310 (5.3%) |
| Total (Category) | 14,387 (94.9%) | 775 (5.1%) |
| Total (Overall) | 103,067 (53.7%) | 88,750 (46.3%) |
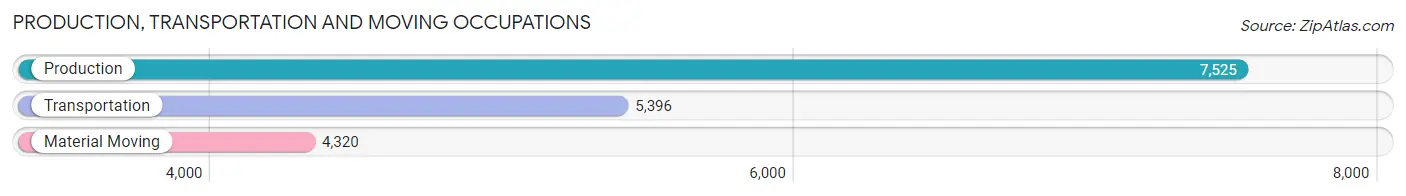
Production, Transportation and Moving Occupations
The most common Production, Transportation and Moving occupations in Larimer County are Production (7,525 | 3.9%), Transportation (5,396 | 2.8%), and Material Moving (4,320 | 2.2%).
Production, Transportation and Moving Occupations by Sex
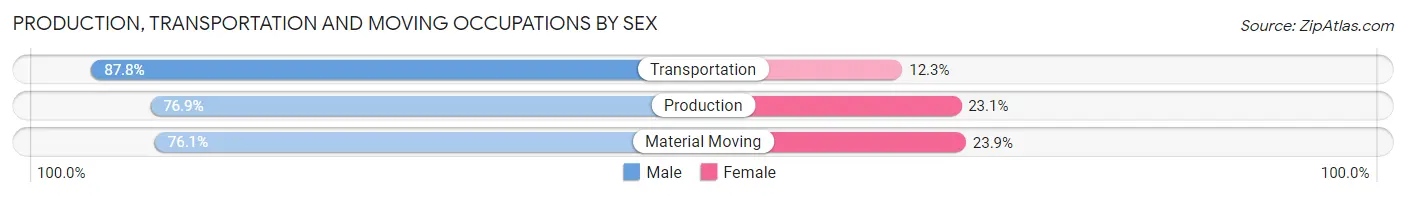
| Occupation | Male | Female |
| Production | 5,790 (76.9%) | 1,735 (23.1%) |
| Transportation | 4,735 (87.7%) | 661 (12.2%) |
| Material Moving | 3,287 (76.1%) | 1,033 (23.9%) |
| Total (Category) | 13,812 (80.1%) | 3,429 (19.9%) |
| Total (Overall) | 103,067 (53.7%) | 88,750 (46.3%) |
Employment Industries by Sex in Larimer County
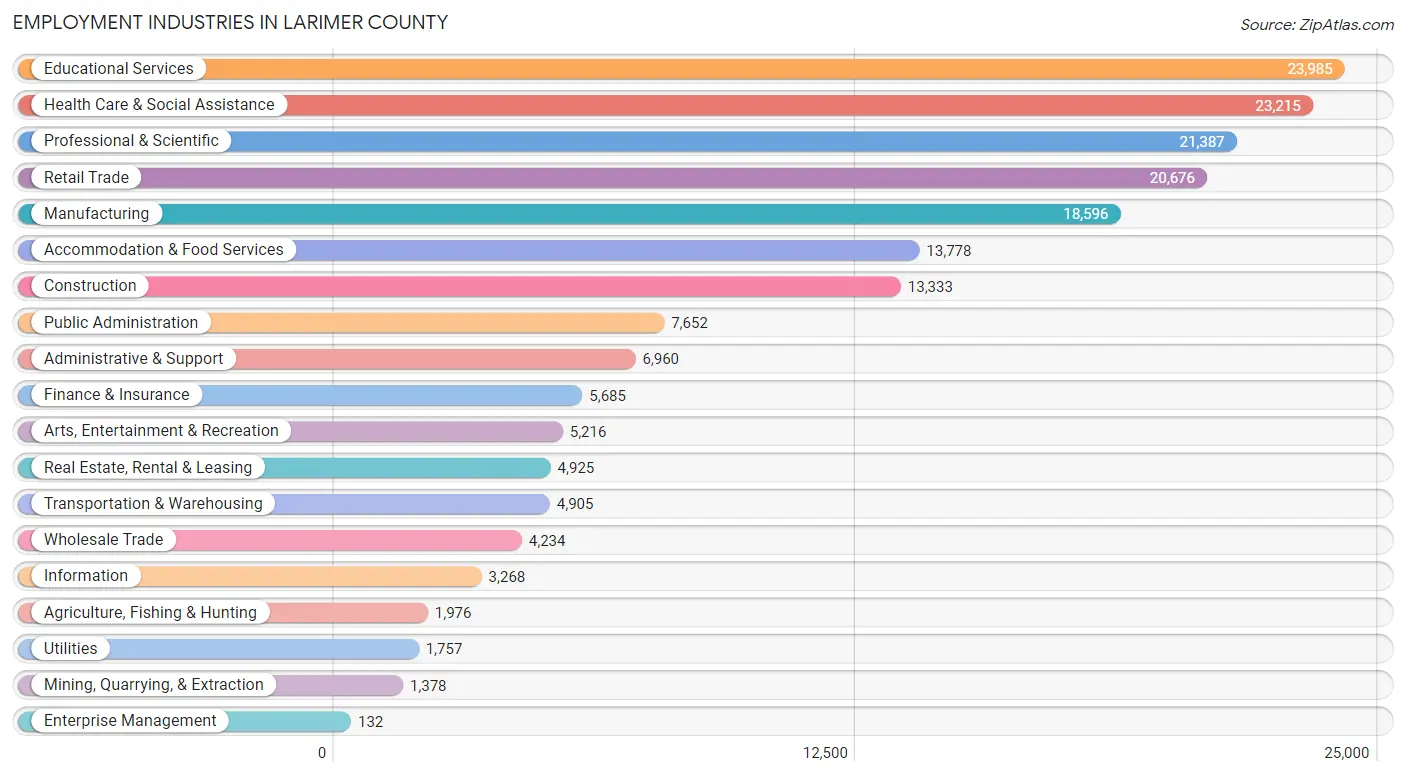
Employment Industries in Larimer County
The major employment industries in Larimer County include Educational Services (23,985 | 12.5%), Health Care & Social Assistance (23,215 | 12.1%), Professional & Scientific (21,387 | 11.2%), Retail Trade (20,676 | 10.8%), and Manufacturing (18,596 | 9.7%).
Employment Industries by Sex in Larimer County
The Larimer County industries that see more men than women are Mining, Quarrying, & Extraction (94.7%), Construction (86.9%), and Utilities (82.5%), whereas the industries that tend to have a higher number of women are Health Care & Social Assistance (76.8%), Enterprise Management (66.7%), and Educational Services (63.3%).
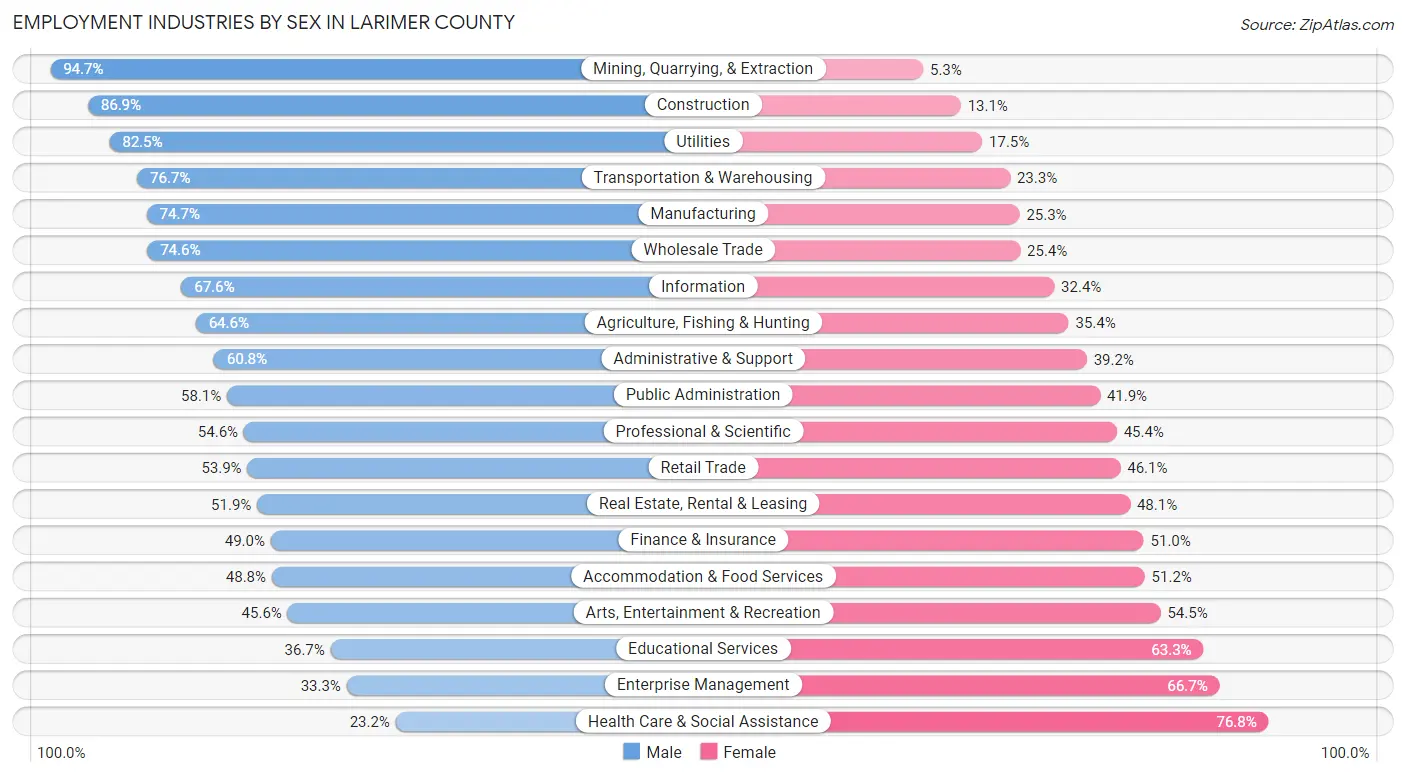
| Industry | Male | Female |
| Agriculture, Fishing & Hunting | 1,276 (64.6%) | 700 (35.4%) |
| Mining, Quarrying, & Extraction | 1,305 (94.7%) | 73 (5.3%) |
| Construction | 11,587 (86.9%) | 1,746 (13.1%) |
| Manufacturing | 13,899 (74.7%) | 4,697 (25.3%) |
| Wholesale Trade | 3,159 (74.6%) | 1,075 (25.4%) |
| Retail Trade | 11,139 (53.9%) | 9,537 (46.1%) |
| Transportation & Warehousing | 3,762 (76.7%) | 1,143 (23.3%) |
| Utilities | 1,449 (82.5%) | 308 (17.5%) |
| Information | 2,208 (67.6%) | 1,060 (32.4%) |
| Finance & Insurance | 2,788 (49.0%) | 2,897 (51.0%) |
| Real Estate, Rental & Leasing | 2,554 (51.9%) | 2,371 (48.1%) |
| Professional & Scientific | 11,680 (54.6%) | 9,707 (45.4%) |
| Enterprise Management | 44 (33.3%) | 88 (66.7%) |
| Administrative & Support | 4,233 (60.8%) | 2,727 (39.2%) |
| Educational Services | 8,792 (36.7%) | 15,193 (63.3%) |
| Health Care & Social Assistance | 5,384 (23.2%) | 17,831 (76.8%) |
| Arts, Entertainment & Recreation | 2,376 (45.6%) | 2,840 (54.4%) |
| Accommodation & Food Services | 6,727 (48.8%) | 7,051 (51.2%) |
| Public Administration | 4,444 (58.1%) | 3,208 (41.9%) |
| Total | 103,067 (53.7%) | 88,750 (46.3%) |
Education in Larimer County
School Enrollment in Larimer County
The most common levels of schooling among the 98,183 students in Larimer County are college / undergraduate (34,839 | 35.5%), high school (16,744 | 17.1%), and middle school (15,770 | 16.1%).
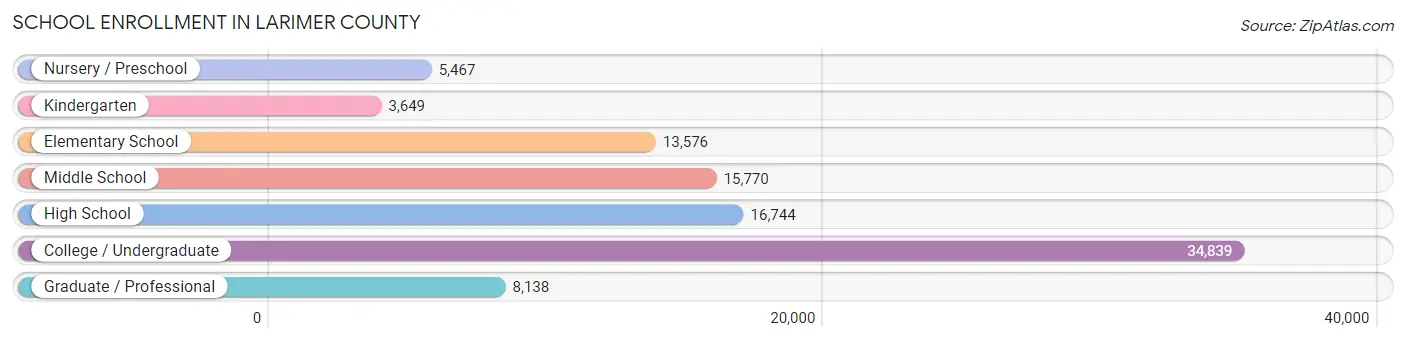
| School Level | # Students | % Students |
| Nursery / Preschool | 5,467 | 5.6% |
| Kindergarten | 3,649 | 3.7% |
| Elementary School | 13,576 | 13.8% |
| Middle School | 15,770 | 16.1% |
| High School | 16,744 | 17.1% |
| College / Undergraduate | 34,839 | 35.5% |
| Graduate / Professional | 8,138 | 8.3% |
| Total | 98,183 | 100.0% |
School Enrollment by Age by Funding Source in Larimer County
Out of a total of 98,183 students who are enrolled in schools in Larimer County, 11,684 (11.9%) attend a private institution, while the remaining 86,499 (88.1%) are enrolled in public schools. The age group of 3 to 4 year olds has the highest likelihood of being enrolled in private schools, with 1,866 (48.4% in the age bracket) enrolled. Conversely, the age group of 20 to 24 year olds has the lowest likelihood of being enrolled in a private school, with 19,816 (96.0% in the age bracket) attending a public institution.
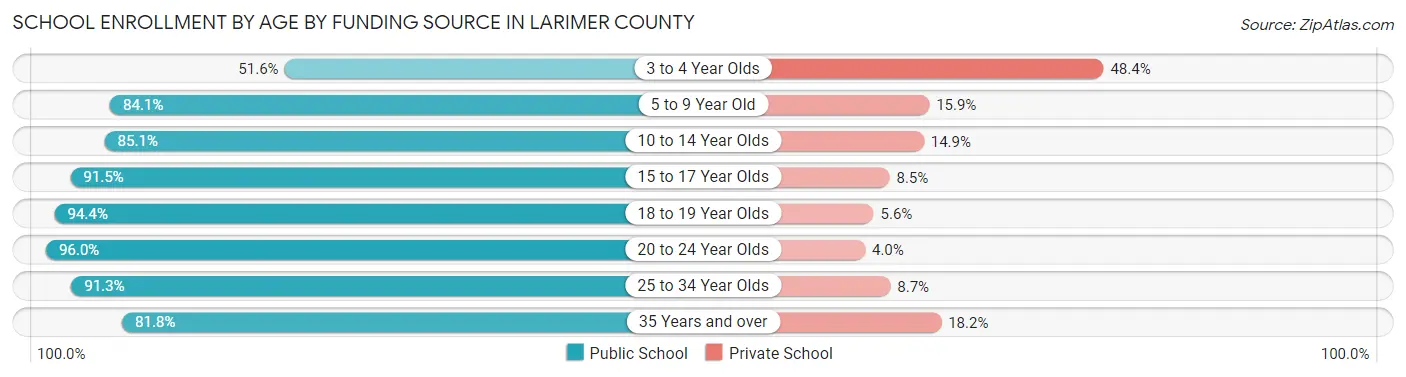
| Age Bracket | Public School | Private School |
| 3 to 4 Year Olds | 1,990 (51.6%) | 1,866 (48.4%) |
| 5 to 9 Year Old | 14,274 (84.1%) | 2,705 (15.9%) |
| 10 to 14 Year Olds | 17,163 (85.1%) | 3,009 (14.9%) |
| 15 to 17 Year Olds | 10,867 (91.5%) | 1,015 (8.5%) |
| 18 to 19 Year Olds | 11,204 (94.4%) | 662 (5.6%) |
| 20 to 24 Year Olds | 19,816 (96.0%) | 821 (4.0%) |
| 25 to 34 Year Olds | 7,322 (91.3%) | 698 (8.7%) |
| 35 Years and over | 3,904 (81.8%) | 867 (18.2%) |
| Total | 86,499 (88.1%) | 11,684 (11.9%) |
Educational Attainment by Field of Study in Larimer County
Business (20,590 | 15.4%), bio, nature & agricultural (15,428 | 11.5%), engineering (12,389 | 9.2%), education (11,505 | 8.6%), and science & technology (11,255 | 8.4%) are the most common fields of study among 133,890 individuals in Larimer County who have obtained a bachelor's degree or higher.
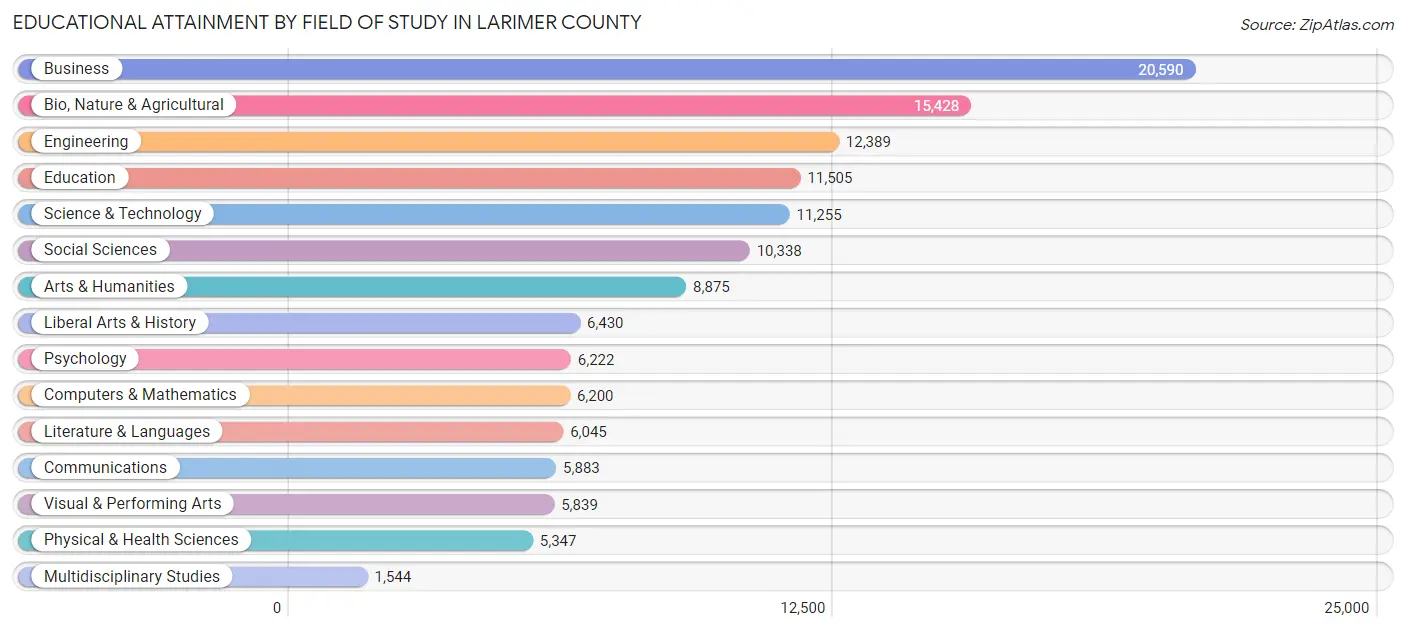
| Field of Study | # Graduates | % Graduates |
| Computers & Mathematics | 6,200 | 4.6% |
| Bio, Nature & Agricultural | 15,428 | 11.5% |
| Physical & Health Sciences | 5,347 | 4.0% |
| Psychology | 6,222 | 4.6% |
| Social Sciences | 10,338 | 7.7% |
| Engineering | 12,389 | 9.2% |
| Multidisciplinary Studies | 1,544 | 1.1% |
| Science & Technology | 11,255 | 8.4% |
| Business | 20,590 | 15.4% |
| Education | 11,505 | 8.6% |
| Literature & Languages | 6,045 | 4.5% |
| Liberal Arts & History | 6,430 | 4.8% |
| Visual & Performing Arts | 5,839 | 4.4% |
| Communications | 5,883 | 4.4% |
| Arts & Humanities | 8,875 | 6.6% |
| Total | 133,890 | 100.0% |
Transportation & Commute in Larimer County
Vehicle Availability by Sex in Larimer County
The most prevalent vehicle ownership categories in Larimer County are males with 2 vehicles (44,087, accounting for 43.5%) and females with 2 vehicles (36,512, making up 51.3%).
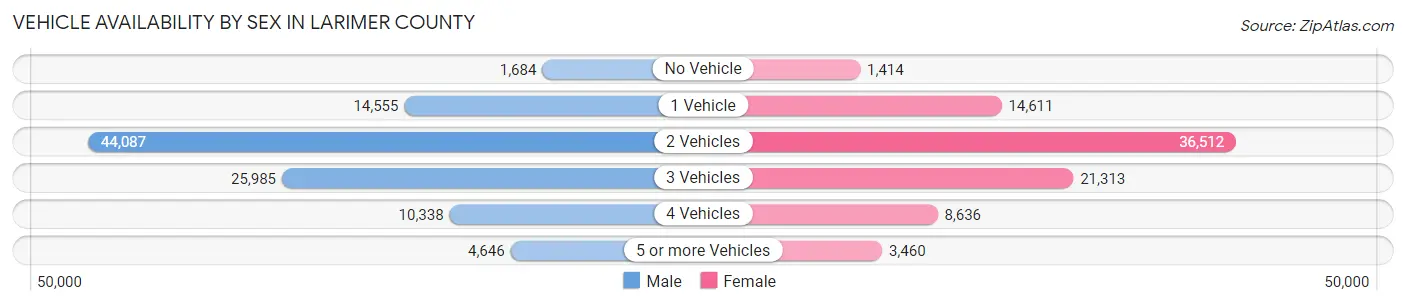
| Vehicles Available | Male | Female |
| No Vehicle | 1,684 (1.7%) | 1,414 (1.7%) |
| 1 Vehicle | 14,555 (14.4%) | 14,611 (17.0%) |
| 2 Vehicles | 44,087 (43.5%) | 36,512 (42.5%) |
| 3 Vehicles | 25,985 (25.7%) | 21,313 (24.8%) |
| 4 Vehicles | 10,338 (10.2%) | 8,636 (10.1%) |
| 5 or more Vehicles | 4,646 (4.6%) | 3,460 (4.0%) |
| Total | 101,295 (100.0%) | 85,946 (100.0%) |
Commute Time in Larimer County
The most frequently occuring commute durations in Larimer County are 15 to 19 minutes (29,528 commuters, 18.8%), 10 to 14 minutes (27,578 commuters, 17.6%), and 20 to 24 minutes (24,627 commuters, 15.7%).
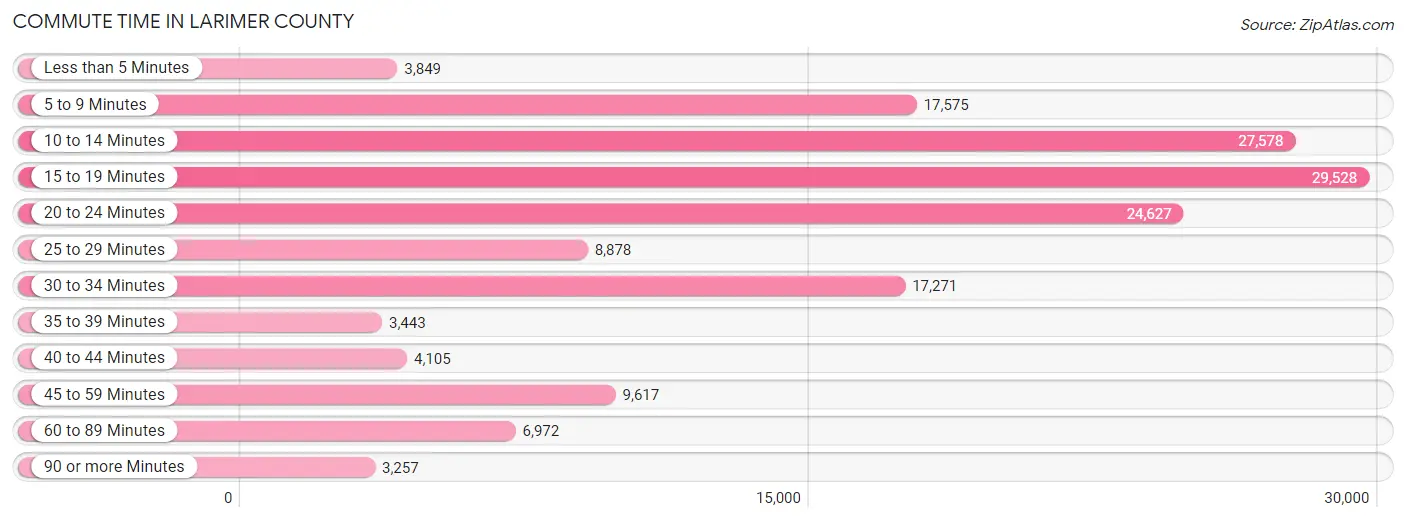
| Commute Time | # Commuters | % Commuters |
| Less than 5 Minutes | 3,849 | 2.5% |
| 5 to 9 Minutes | 17,575 | 11.2% |
| 10 to 14 Minutes | 27,578 | 17.6% |
| 15 to 19 Minutes | 29,528 | 18.8% |
| 20 to 24 Minutes | 24,627 | 15.7% |
| 25 to 29 Minutes | 8,878 | 5.7% |
| 30 to 34 Minutes | 17,271 | 11.0% |
| 35 to 39 Minutes | 3,443 | 2.2% |
| 40 to 44 Minutes | 4,105 | 2.6% |
| 45 to 59 Minutes | 9,617 | 6.1% |
| 60 to 89 Minutes | 6,972 | 4.4% |
| 90 or more Minutes | 3,257 | 2.1% |
Commute Time by Sex in Larimer County
The most common commute times in Larimer County are 15 to 19 minutes (15,701 commuters, 18.3%) for males and 10 to 14 minutes (13,995 commuters, 19.7%) for females.
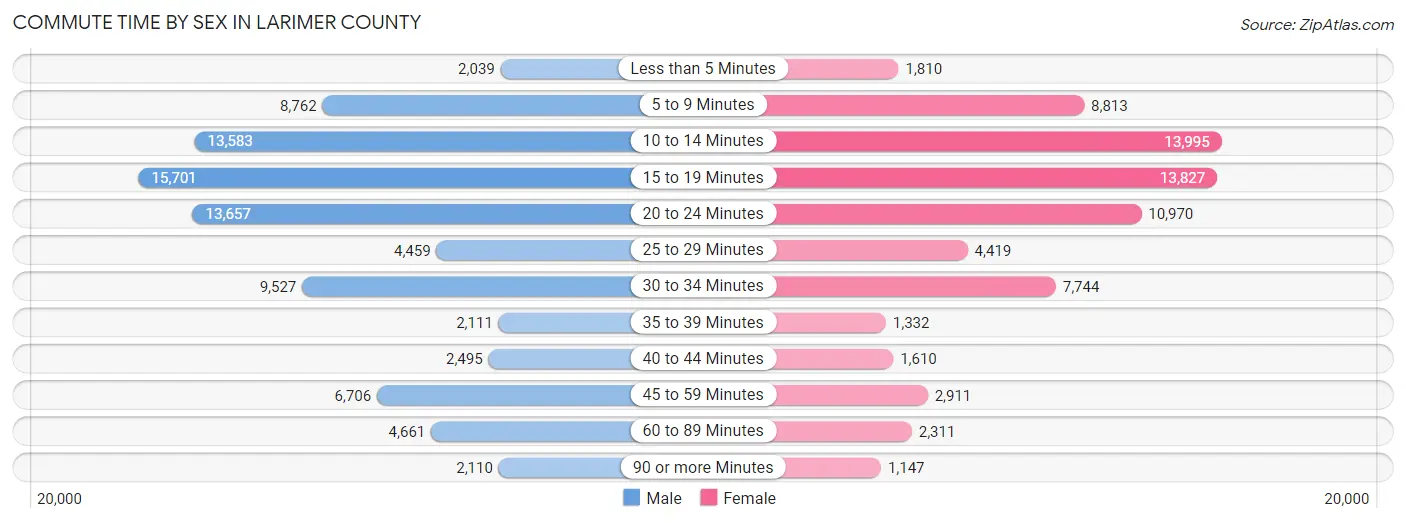
| Commute Time | Male | Female |
| Less than 5 Minutes | 2,039 (2.4%) | 1,810 (2.5%) |
| 5 to 9 Minutes | 8,762 (10.2%) | 8,813 (12.4%) |
| 10 to 14 Minutes | 13,583 (15.8%) | 13,995 (19.7%) |
| 15 to 19 Minutes | 15,701 (18.3%) | 13,827 (19.5%) |
| 20 to 24 Minutes | 13,657 (15.9%) | 10,970 (15.5%) |
| 25 to 29 Minutes | 4,459 (5.2%) | 4,419 (6.2%) |
| 30 to 34 Minutes | 9,527 (11.1%) | 7,744 (10.9%) |
| 35 to 39 Minutes | 2,111 (2.5%) | 1,332 (1.9%) |
| 40 to 44 Minutes | 2,495 (2.9%) | 1,610 (2.3%) |
| 45 to 59 Minutes | 6,706 (7.8%) | 2,911 (4.1%) |
| 60 to 89 Minutes | 4,661 (5.4%) | 2,311 (3.3%) |
| 90 or more Minutes | 2,110 (2.5%) | 1,147 (1.6%) |
Time of Departure to Work by Sex in Larimer County
The most frequent times of departure to work in Larimer County are 7:00 AM to 7:29 AM (12,146, 14.1%) for males and 7:30 AM to 7:59 AM (11,487, 16.2%) for females.

| Time of Departure | Male | Female |
| 12:00 AM to 4:59 AM | 4,504 (5.2%) | 1,722 (2.4%) |
| 5:00 AM to 5:29 AM | 3,311 (3.9%) | 1,555 (2.2%) |
| 5:30 AM to 5:59 AM | 4,360 (5.1%) | 2,373 (3.4%) |
| 6:00 AM to 6:29 AM | 7,692 (9.0%) | 3,534 (5.0%) |
| 6:30 AM to 6:59 AM | 8,700 (10.1%) | 6,008 (8.5%) |
| 7:00 AM to 7:29 AM | 12,146 (14.1%) | 10,127 (14.3%) |
| 7:30 AM to 7:59 AM | 10,752 (12.5%) | 11,487 (16.2%) |
| 8:00 AM to 8:29 AM | 10,768 (12.6%) | 9,219 (13.0%) |
| 8:30 AM to 8:59 AM | 4,707 (5.5%) | 5,455 (7.7%) |
| 9:00 AM to 9:59 AM | 5,647 (6.6%) | 5,927 (8.4%) |
| 10:00 AM to 10:59 AM | 1,967 (2.3%) | 2,698 (3.8%) |
| 11:00 AM to 11:59 AM | 1,252 (1.5%) | 1,308 (1.8%) |
| 12:00 PM to 3:59 PM | 4,345 (5.1%) | 4,891 (6.9%) |
| 4:00 PM to 11:59 PM | 5,660 (6.6%) | 4,585 (6.5%) |
| Total | 85,811 (100.0%) | 70,889 (100.0%) |
Housing Occupancy in Larimer County
Occupancy by Ownership in Larimer County
Of the total 148,851 dwellings in Larimer County, owner-occupied units account for 96,055 (64.5%), while renter-occupied units make up 52,796 (35.5%).
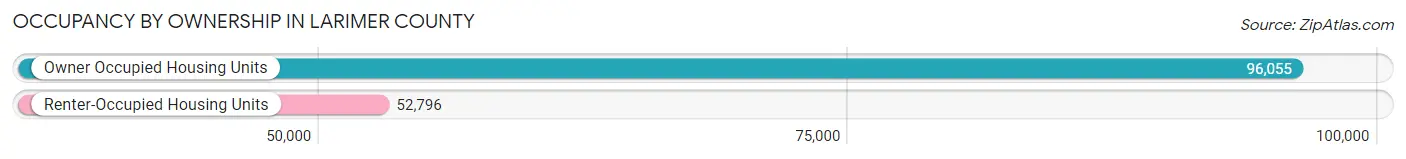
| Occupancy | # Housing Units | % Housing Units |
| Owner Occupied Housing Units | 96,055 | 64.5% |
| Renter-Occupied Housing Units | 52,796 | 35.5% |
| Total Occupied Housing Units | 148,851 | 100.0% |
Occupancy by Household Size in Larimer County
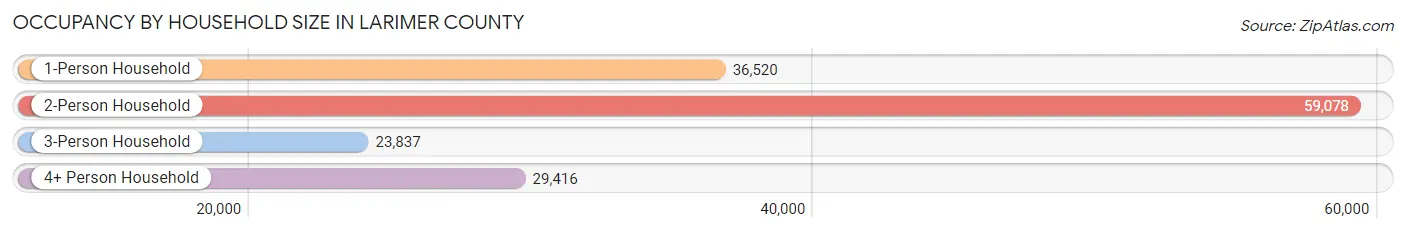
| Household Size | # Housing Units | % Housing Units |
| 1-Person Household | 36,520 | 24.5% |
| 2-Person Household | 59,078 | 39.7% |
| 3-Person Household | 23,837 | 16.0% |
| 4+ Person Household | 29,416 | 19.8% |
| Total Housing Units | 148,851 | 100.0% |
Occupancy by Ownership by Household Size in Larimer County
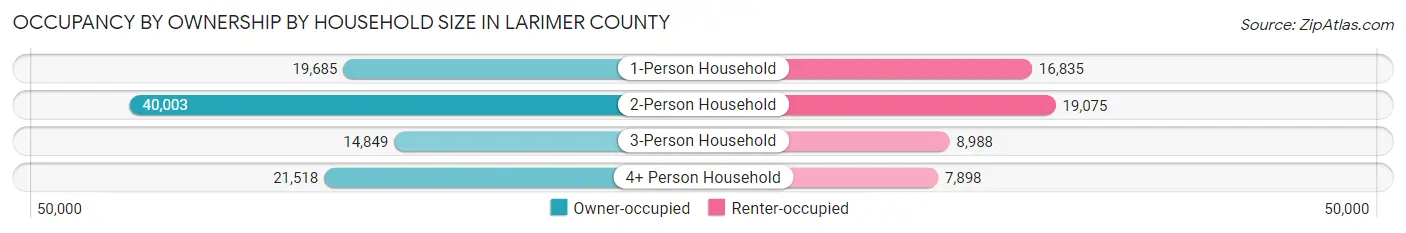
| Household Size | Owner-occupied | Renter-occupied |
| 1-Person Household | 19,685 (53.9%) | 16,835 (46.1%) |
| 2-Person Household | 40,003 (67.7%) | 19,075 (32.3%) |
| 3-Person Household | 14,849 (62.3%) | 8,988 (37.7%) |
| 4+ Person Household | 21,518 (73.2%) | 7,898 (26.9%) |
| Total Housing Units | 96,055 (64.5%) | 52,796 (35.5%) |
Occupancy by Educational Attainment in Larimer County
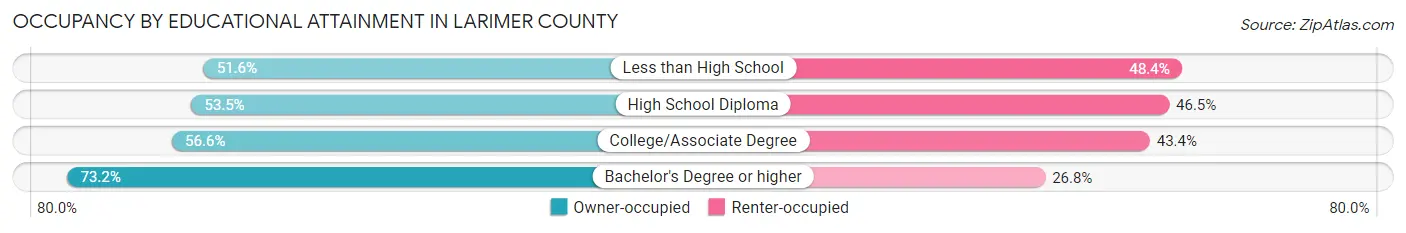
| Household Size | Owner-occupied | Renter-occupied |
| Less than High School | 2,361 (51.6%) | 2,217 (48.4%) |
| High School Diploma | 11,529 (53.5%) | 10,004 (46.5%) |
| College/Associate Degree | 26,167 (56.6%) | 20,067 (43.4%) |
| Bachelor's Degree or higher | 55,998 (73.2%) | 20,508 (26.8%) |
Occupancy by Age of Householder in Larimer County
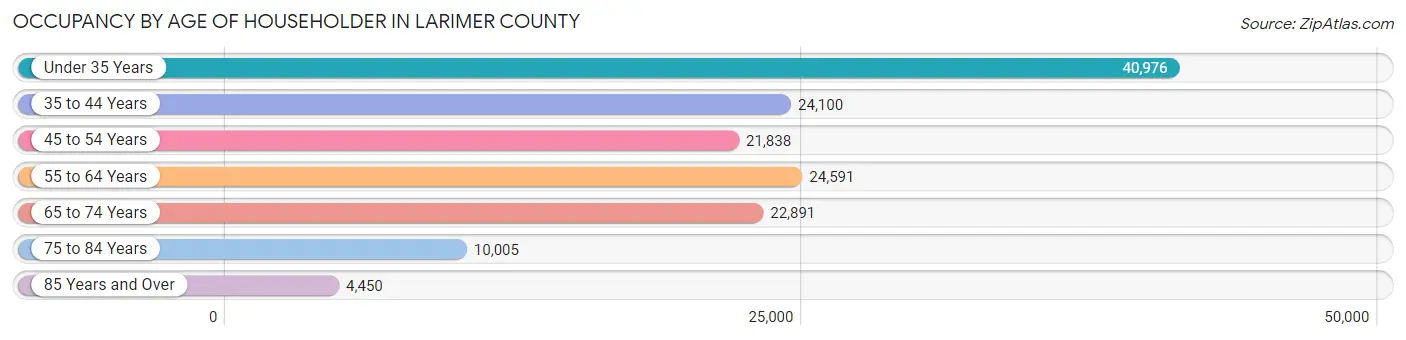
| Age Bracket | # Households | % Households |
| Under 35 Years | 40,976 | 27.5% |
| 35 to 44 Years | 24,100 | 16.2% |
| 45 to 54 Years | 21,838 | 14.7% |
| 55 to 64 Years | 24,591 | 16.5% |
| 65 to 74 Years | 22,891 | 15.4% |
| 75 to 84 Years | 10,005 | 6.7% |
| 85 Years and Over | 4,450 | 3.0% |
| Total | 148,851 | 100.0% |
Housing Finances in Larimer County
Median Income by Occupancy in Larimer County
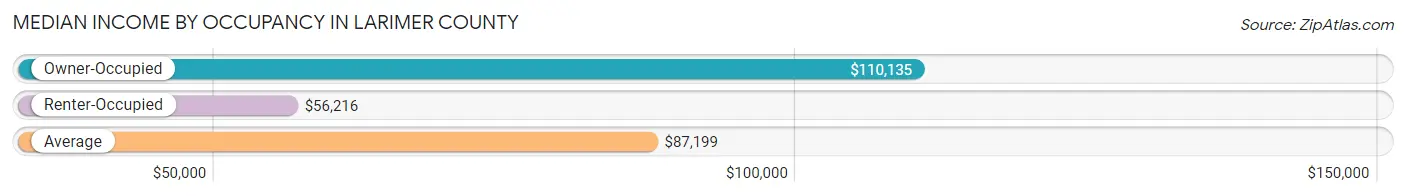
| Occupancy Type | # Households | Median Income |
| Owner-Occupied | 96,055 (64.5%) | $110,135 |
| Renter-Occupied | 52,796 (35.5%) | $56,216 |
| Average | 148,851 (100.0%) | $87,199 |
Occupancy by Householder Income Bracket in Larimer County
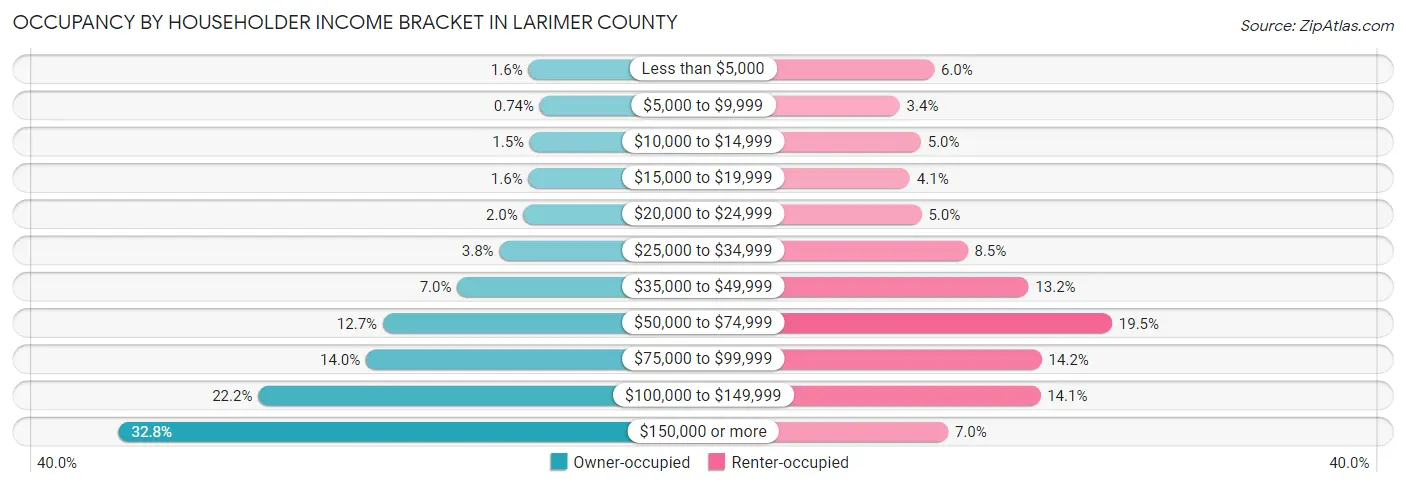
| Income Bracket | Owner-occupied | Renter-occupied |
| Less than $5,000 | 1,550 (1.6%) | 3,159 (6.0%) |
| $5,000 to $9,999 | 711 (0.7%) | 1,775 (3.4%) |
| $10,000 to $14,999 | 1,437 (1.5%) | 2,626 (5.0%) |
| $15,000 to $19,999 | 1,550 (1.6%) | 2,185 (4.1%) |
| $20,000 to $24,999 | 1,898 (2.0%) | 2,650 (5.0%) |
| $25,000 to $34,999 | 3,669 (3.8%) | 4,506 (8.5%) |
| $35,000 to $49,999 | 6,750 (7.0%) | 6,954 (13.2%) |
| $50,000 to $74,999 | 12,196 (12.7%) | 10,313 (19.5%) |
| $75,000 to $99,999 | 13,430 (14.0%) | 7,485 (14.2%) |
| $100,000 to $149,999 | 21,327 (22.2%) | 7,428 (14.1%) |
| $150,000 or more | 31,537 (32.8%) | 3,715 (7.0%) |
| Total | 96,055 (100.0%) | 52,796 (100.0%) |
Monthly Housing Cost Tiers in Larimer County
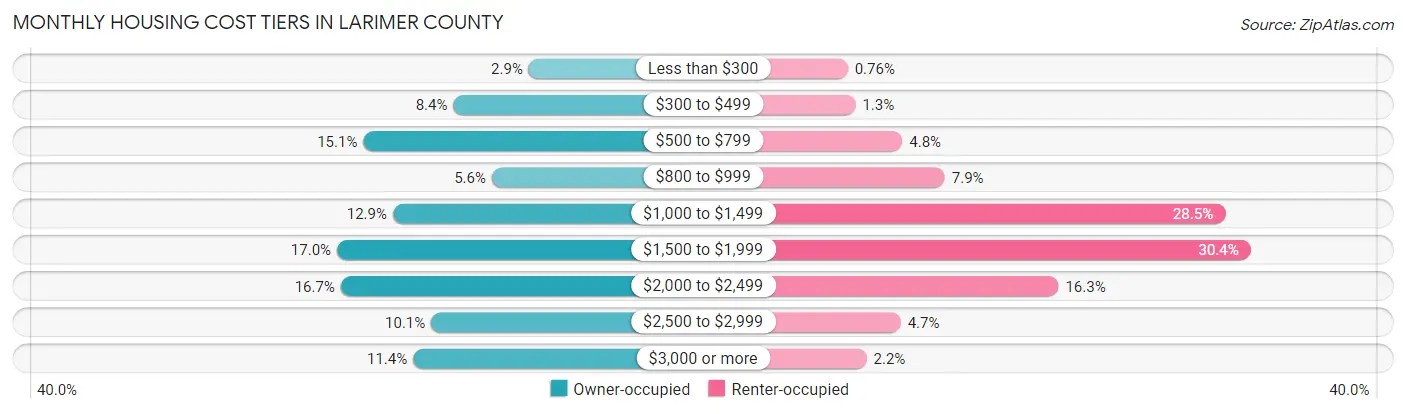
| Monthly Cost | Owner-occupied | Renter-occupied |
| Less than $300 | 2,755 (2.9%) | 401 (0.8%) |
| $300 to $499 | 8,097 (8.4%) | 702 (1.3%) |
| $500 to $799 | 14,463 (15.1%) | 2,522 (4.8%) |
| $800 to $999 | 5,373 (5.6%) | 4,176 (7.9%) |
| $1,000 to $1,499 | 12,373 (12.9%) | 15,067 (28.5%) |
| $1,500 to $1,999 | 16,326 (17.0%) | 16,066 (30.4%) |
| $2,000 to $2,499 | 16,065 (16.7%) | 8,596 (16.3%) |
| $2,500 to $2,999 | 9,660 (10.1%) | 2,460 (4.7%) |
| $3,000 or more | 10,943 (11.4%) | 1,133 (2.1%) |
| Total | 96,055 (100.0%) | 52,796 (100.0%) |
Physical Housing Characteristics in Larimer County
Housing Structures in Larimer County
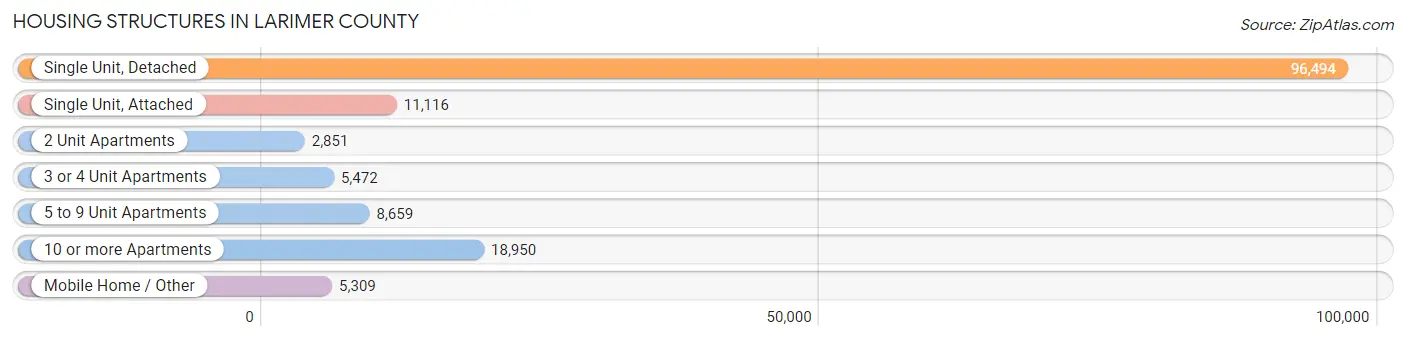
| Structure Type | # Housing Units | % Housing Units |
| Single Unit, Detached | 96,494 | 64.8% |
| Single Unit, Attached | 11,116 | 7.5% |
| 2 Unit Apartments | 2,851 | 1.9% |
| 3 or 4 Unit Apartments | 5,472 | 3.7% |
| 5 to 9 Unit Apartments | 8,659 | 5.8% |
| 10 or more Apartments | 18,950 | 12.7% |
| Mobile Home / Other | 5,309 | 3.6% |
| Total | 148,851 | 100.0% |
Housing Structures by Occupancy in Larimer County
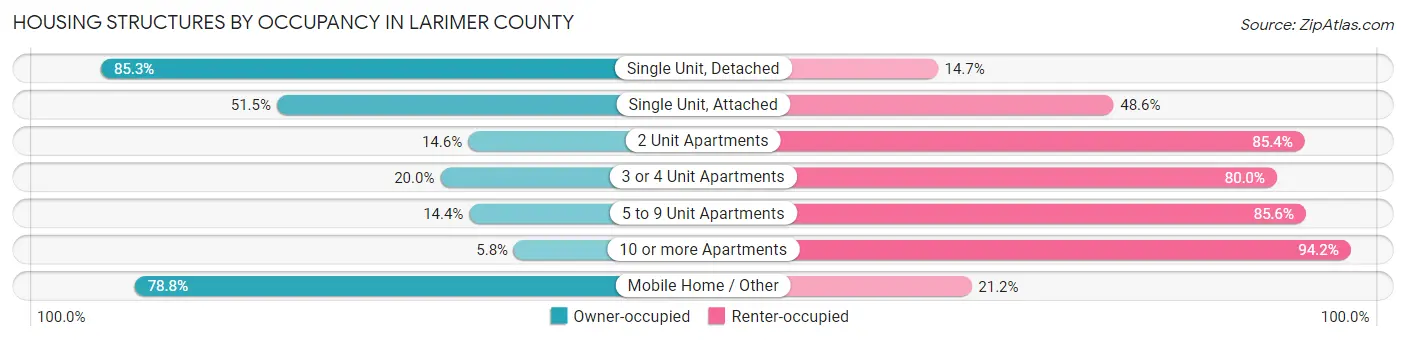
| Structure Type | Owner-occupied | Renter-occupied |
| Single Unit, Detached | 82,301 (85.3%) | 14,193 (14.7%) |
| Single Unit, Attached | 5,719 (51.4%) | 5,397 (48.5%) |
| 2 Unit Apartments | 417 (14.6%) | 2,434 (85.4%) |
| 3 or 4 Unit Apartments | 1,093 (20.0%) | 4,379 (80.0%) |
| 5 to 9 Unit Apartments | 1,247 (14.4%) | 7,412 (85.6%) |
| 10 or more Apartments | 1,095 (5.8%) | 17,855 (94.2%) |
| Mobile Home / Other | 4,183 (78.8%) | 1,126 (21.2%) |
| Total | 96,055 (64.5%) | 52,796 (35.5%) |
Housing Structures by Number of Rooms in Larimer County
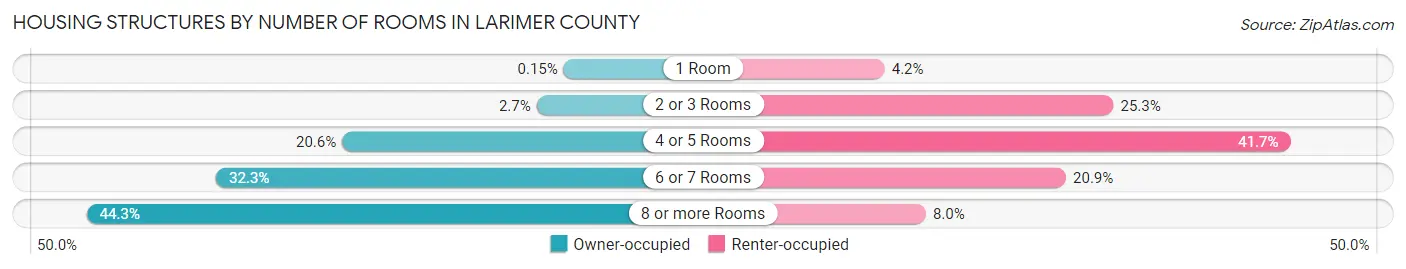
| Number of Rooms | Owner-occupied | Renter-occupied |
| 1 Room | 141 (0.2%) | 2,193 (4.2%) |
| 2 or 3 Rooms | 2,545 (2.6%) | 13,362 (25.3%) |
| 4 or 5 Rooms | 19,826 (20.6%) | 21,990 (41.6%) |
| 6 or 7 Rooms | 31,019 (32.3%) | 11,047 (20.9%) |
| 8 or more Rooms | 42,524 (44.3%) | 4,204 (8.0%) |
| Total | 96,055 (100.0%) | 52,796 (100.0%) |
Housing Structure by Heating Type in Larimer County

| Heating Type | Owner-occupied | Renter-occupied |
| Utility Gas | 75,428 (78.5%) | 29,294 (55.5%) |
| Bottled, Tank, or LP Gas | 5,006 (5.2%) | 1,102 (2.1%) |
| Electricity | 13,262 (13.8%) | 21,227 (40.2%) |
| Fuel Oil or Kerosene | 126 (0.1%) | 53 (0.1%) |
| Coal or Coke | 5 (0.0%) | 0 (0.0%) |
| All other Fuels | 2,064 (2.1%) | 522 (1.0%) |
| No Fuel Used | 164 (0.2%) | 598 (1.1%) |
| Total | 96,055 (100.0%) | 52,796 (100.0%) |
Household Vehicle Usage in Larimer County
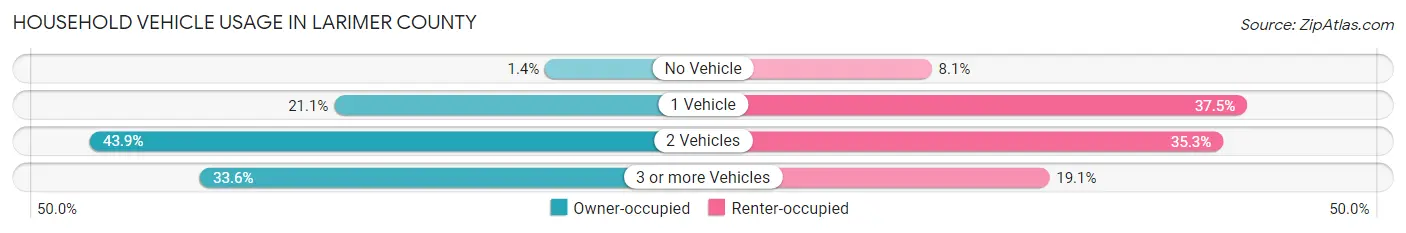
| Vehicles per Household | Owner-occupied | Renter-occupied |
| No Vehicle | 1,350 (1.4%) | 4,270 (8.1%) |
| 1 Vehicle | 20,263 (21.1%) | 19,815 (37.5%) |
| 2 Vehicles | 42,154 (43.9%) | 18,638 (35.3%) |
| 3 or more Vehicles | 32,288 (33.6%) | 10,073 (19.1%) |
| Total | 96,055 (100.0%) | 52,796 (100.0%) |
Real Estate & Mortgages in Larimer County
Real Estate and Mortgage Overview in Larimer County
| Characteristic | Without Mortgage | With Mortgage |
| Housing Units | 30,709 | 65,346 |
| Median Property Value | $470,000 | $495,200 |
| Median Household Income | $81,542 | $24,560 |
| Monthly Housing Costs | $589 | $10,861 |
| Real Estate Taxes | $2,432 | $769 |
Property Value by Mortgage Status in Larimer County
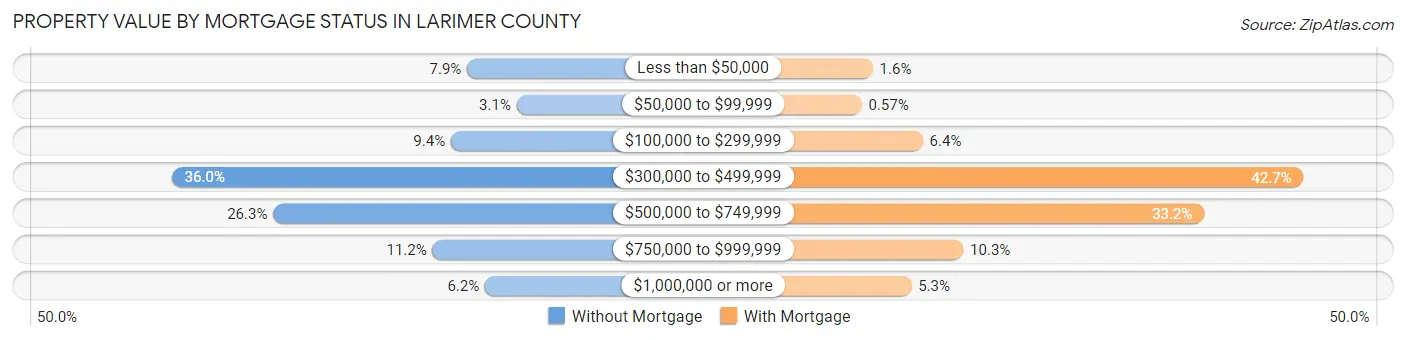
| Property Value | Without Mortgage | With Mortgage |
| Less than $50,000 | 2,411 (7.9%) | 1,062 (1.6%) |
| $50,000 to $99,999 | 961 (3.1%) | 372 (0.6%) |
| $100,000 to $299,999 | 2,883 (9.4%) | 4,174 (6.4%) |
| $300,000 to $499,999 | 11,056 (36.0%) | 27,881 (42.7%) |
| $500,000 to $749,999 | 8,084 (26.3%) | 21,696 (33.2%) |
| $750,000 to $999,999 | 3,425 (11.2%) | 6,695 (10.2%) |
| $1,000,000 or more | 1,889 (6.1%) | 3,466 (5.3%) |
| Total | 30,709 (100.0%) | 65,346 (100.0%) |
Household Income by Mortgage Status in Larimer County
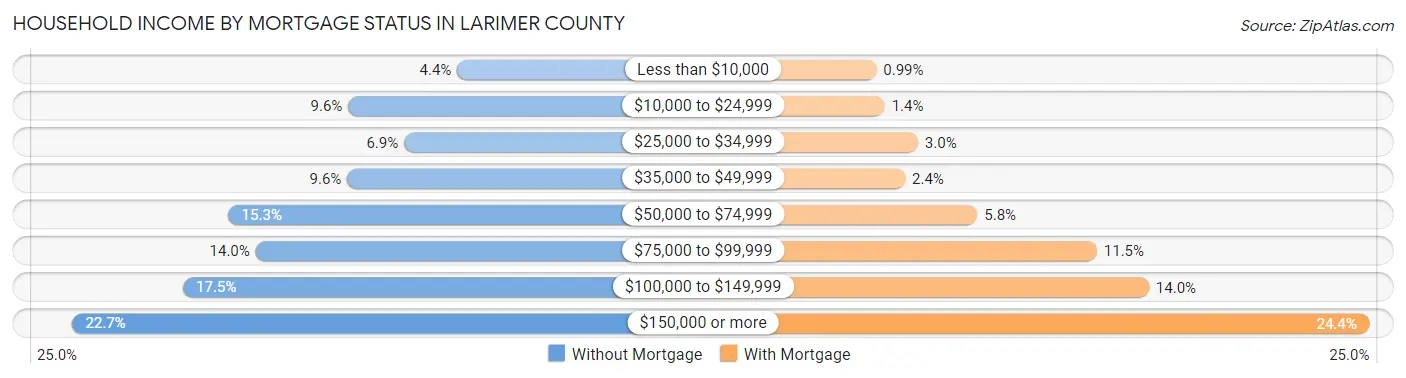
| Household Income | Without Mortgage | With Mortgage |
| Less than $10,000 | 1,350 (4.4%) | 646 (1.0%) |
| $10,000 to $24,999 | 2,945 (9.6%) | 911 (1.4%) |
| $25,000 to $34,999 | 2,129 (6.9%) | 1,940 (3.0%) |
| $35,000 to $49,999 | 2,961 (9.6%) | 1,540 (2.4%) |
| $50,000 to $74,999 | 4,691 (15.3%) | 3,789 (5.8%) |
| $75,000 to $99,999 | 4,298 (14.0%) | 7,505 (11.5%) |
| $100,000 to $149,999 | 5,358 (17.4%) | 9,132 (14.0%) |
| $150,000 or more | 6,977 (22.7%) | 15,969 (24.4%) |
| Total | 30,709 (100.0%) | 65,346 (100.0%) |
Property Value to Household Income Ratio in Larimer County
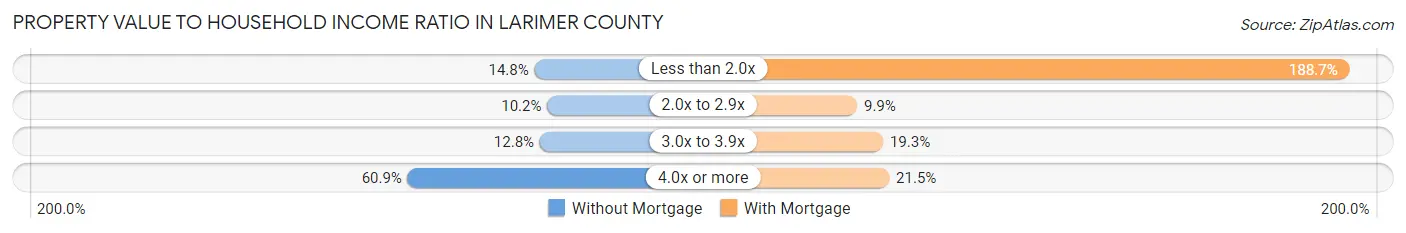
| Value-to-Income Ratio | Without Mortgage | With Mortgage |
| Less than 2.0x | 4,537 (14.8%) | 123,327 (188.7%) |
| 2.0x to 2.9x | 3,118 (10.2%) | 6,434 (9.9%) |
| 3.0x to 3.9x | 3,937 (12.8%) | 12,593 (19.3%) |
| 4.0x or more | 18,686 (60.9%) | 14,059 (21.5%) |
| Total | 30,709 (100.0%) | 65,346 (100.0%) |
Real Estate Taxes by Mortgage Status in Larimer County
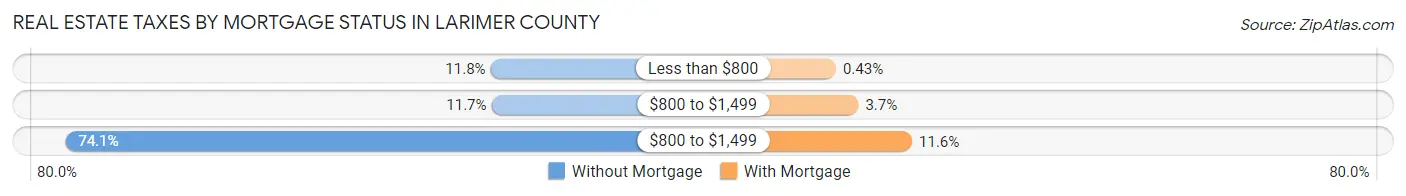
| Property Taxes | Without Mortgage | With Mortgage |
| Less than $800 | 3,621 (11.8%) | 282 (0.4%) |
| $800 to $1,499 | 3,577 (11.7%) | 2,431 (3.7%) |
| $800 to $1,499 | 22,739 (74.1%) | 7,549 (11.6%) |
| Total | 30,709 (100.0%) | 65,346 (100.0%) |
Health & Disability in Larimer County
Health Insurance Coverage by Age in Larimer County
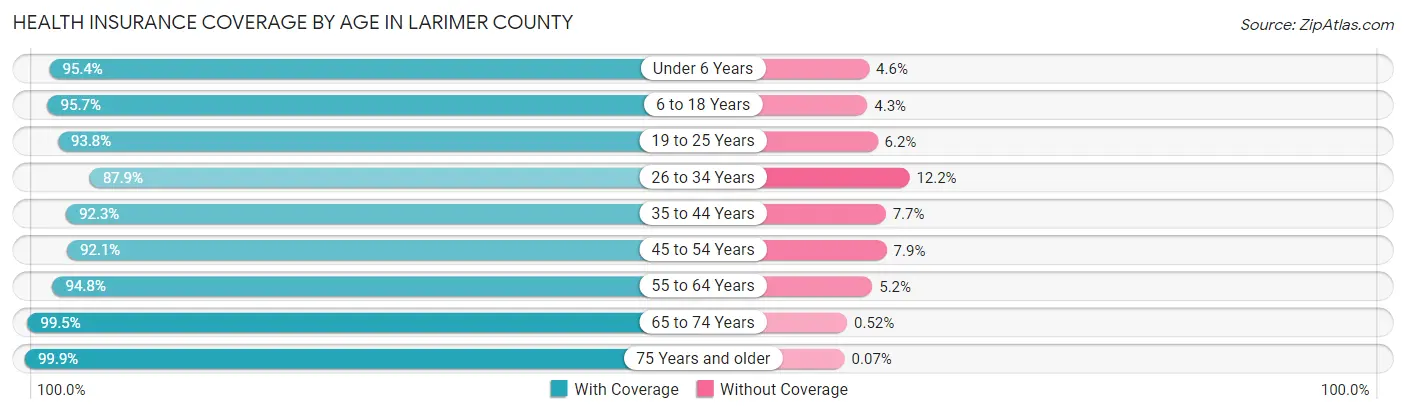
| Age Bracket | With Coverage | Without Coverage |
| Under 6 Years | 19,420 (95.4%) | 945 (4.6%) |
| 6 to 18 Years | 51,430 (95.7%) | 2,311 (4.3%) |
| 19 to 25 Years | 48,521 (93.8%) | 3,210 (6.2%) |
| 26 to 34 Years | 40,503 (87.8%) | 5,604 (12.1%) |
| 35 to 44 Years | 41,666 (92.3%) | 3,486 (7.7%) |
| 45 to 54 Years | 35,805 (92.1%) | 3,073 (7.9%) |
| 55 to 64 Years | 40,377 (94.8%) | 2,222 (5.2%) |
| 65 to 74 Years | 36,315 (99.5%) | 190 (0.5%) |
| 75 Years and older | 21,429 (99.9%) | 14 (0.1%) |
| Total | 335,466 (94.1%) | 21,055 (5.9%) |
Health Insurance Coverage by Citizenship Status in Larimer County
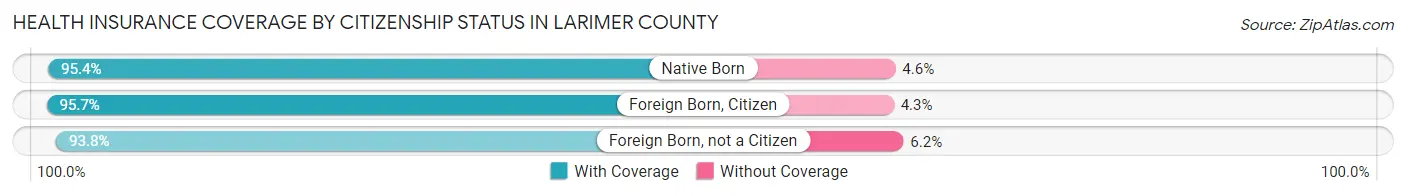
| Citizenship Status | With Coverage | Without Coverage |
| Native Born | 19,420 (95.4%) | 945 (4.6%) |
| Foreign Born, Citizen | 51,430 (95.7%) | 2,311 (4.3%) |
| Foreign Born, not a Citizen | 48,521 (93.8%) | 3,210 (6.2%) |
Health Insurance Coverage by Household Income in Larimer County
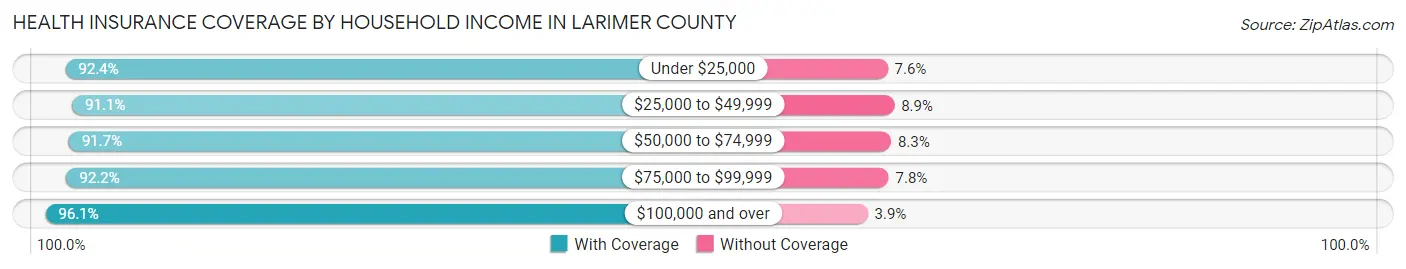
| Household Income | With Coverage | Without Coverage |
| Under $25,000 | 28,858 (92.4%) | 2,388 (7.6%) |
| $25,000 to $49,999 | 37,205 (91.1%) | 3,631 (8.9%) |
| $50,000 to $74,999 | 44,108 (91.7%) | 3,983 (8.3%) |
| $75,000 to $99,999 | 44,690 (92.2%) | 3,798 (7.8%) |
| $100,000 and over | 172,716 (96.1%) | 7,006 (3.9%) |
Public vs Private Health Insurance Coverage by Age in Larimer County
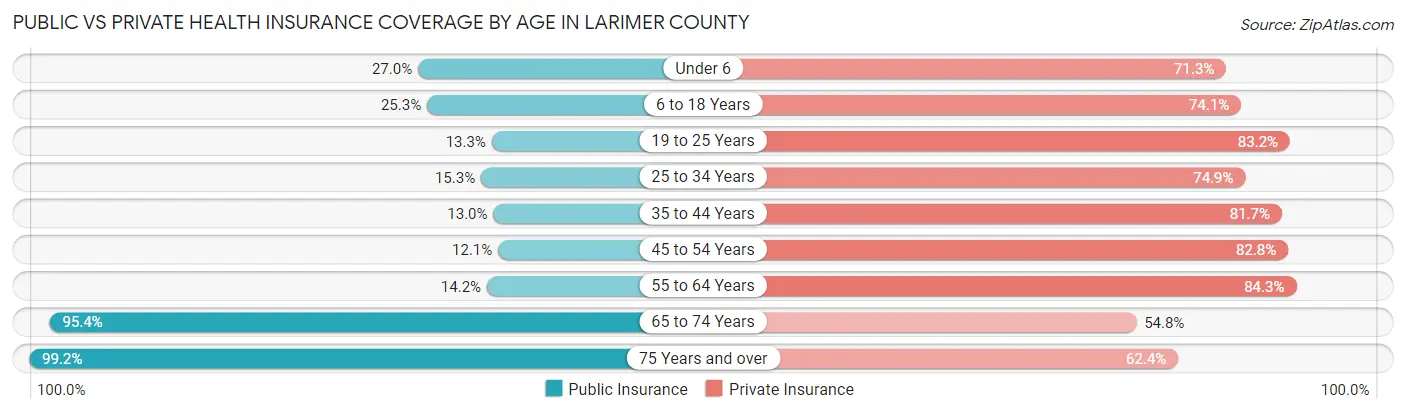
| Age Bracket | Public Insurance | Private Insurance |
| Under 6 | 5,494 (27.0%) | 14,528 (71.3%) |
| 6 to 18 Years | 13,603 (25.3%) | 39,833 (74.1%) |
| 19 to 25 Years | 6,882 (13.3%) | 43,023 (83.2%) |
| 25 to 34 Years | 7,052 (15.3%) | 34,536 (74.9%) |
| 35 to 44 Years | 5,865 (13.0%) | 36,869 (81.7%) |
| 45 to 54 Years | 4,707 (12.1%) | 32,207 (82.8%) |
| 55 to 64 Years | 6,043 (14.2%) | 35,927 (84.3%) |
| 65 to 74 Years | 34,817 (95.4%) | 20,016 (54.8%) |
| 75 Years and over | 21,265 (99.2%) | 13,386 (62.4%) |
| Total | 105,728 (29.7%) | 270,325 (75.8%) |
Disability Status by Sex by Age in Larimer County
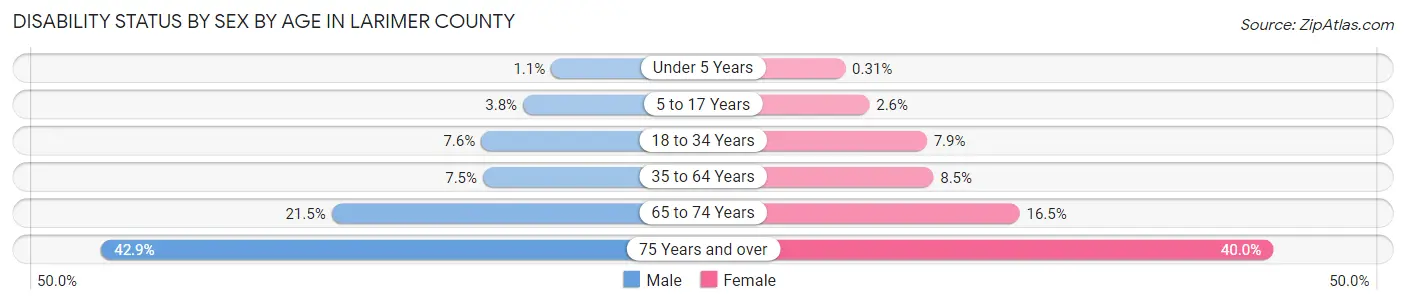
| Age Bracket | Male | Female |
| Under 5 Years | 95 (1.1%) | 25 (0.3%) |
| 5 to 17 Years | 982 (3.7%) | 639 (2.5%) |
| 18 to 34 Years | 4,079 (7.6%) | 4,013 (7.9%) |
| 35 to 64 Years | 4,753 (7.5%) | 5,352 (8.5%) |
| 65 to 74 Years | 3,774 (21.5%) | 3,130 (16.5%) |
| 75 Years and over | 3,953 (42.9%) | 4,892 (40.0%) |
Disability Class by Sex by Age in Larimer County
Disability Class: Hearing Difficulty
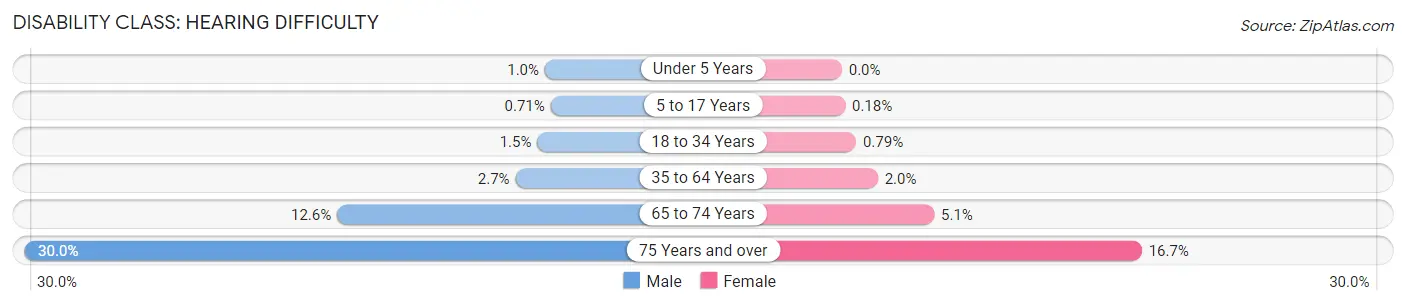
| Age Bracket | Male | Female |
| Under 5 Years | 86 (1.0%) | 0 (0.0%) |
| 5 to 17 Years | 185 (0.7%) | 46 (0.2%) |
| 18 to 34 Years | 776 (1.5%) | 404 (0.8%) |
| 35 to 64 Years | 1,700 (2.7%) | 1,261 (2.0%) |
| 65 to 74 Years | 2,211 (12.6%) | 975 (5.1%) |
| 75 Years and over | 2,763 (30.0%) | 2,042 (16.7%) |
Disability Class: Vision Difficulty
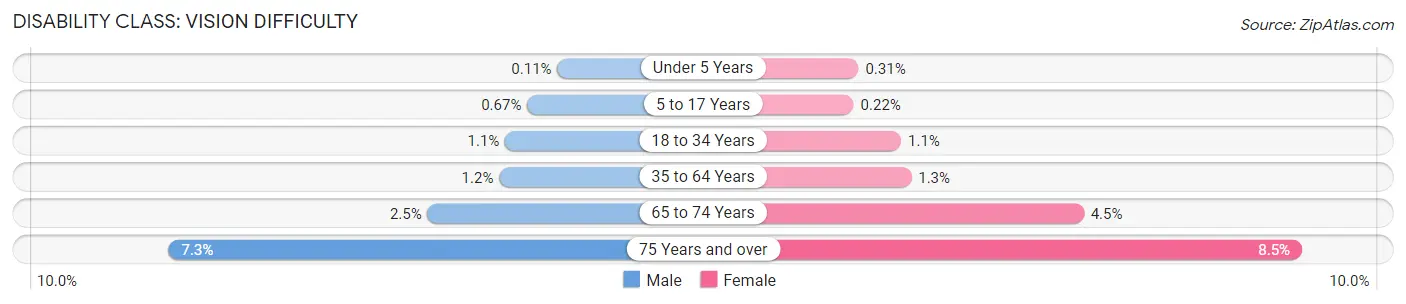
| Age Bracket | Male | Female |
| Under 5 Years | 9 (0.1%) | 25 (0.3%) |
| 5 to 17 Years | 175 (0.7%) | 54 (0.2%) |
| 18 to 34 Years | 579 (1.1%) | 560 (1.1%) |
| 35 to 64 Years | 755 (1.2%) | 812 (1.3%) |
| 65 to 74 Years | 442 (2.5%) | 851 (4.5%) |
| 75 Years and over | 676 (7.3%) | 1,044 (8.5%) |
Disability Class: Cognitive Difficulty
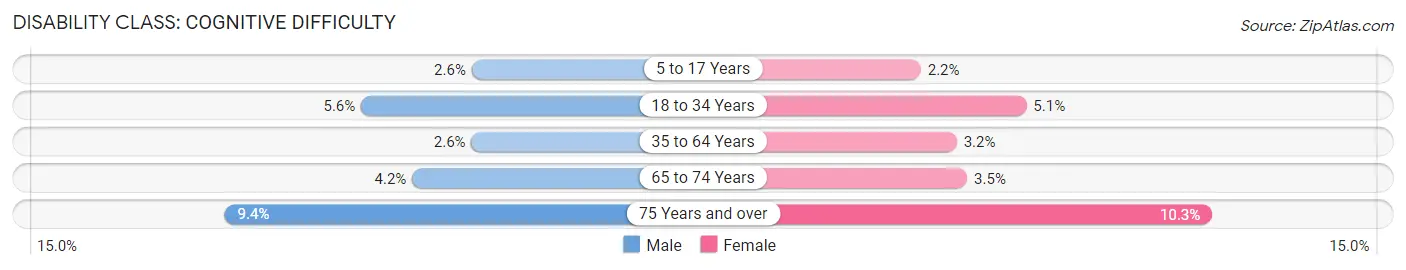
| Age Bracket | Male | Female |
| 5 to 17 Years | 668 (2.5%) | 553 (2.2%) |
| 18 to 34 Years | 3,008 (5.6%) | 2,618 (5.1%) |
| 35 to 64 Years | 1,625 (2.6%) | 2,017 (3.2%) |
| 65 to 74 Years | 738 (4.2%) | 662 (3.5%) |
| 75 Years and over | 869 (9.4%) | 1,260 (10.3%) |
Disability Class: Ambulatory Difficulty
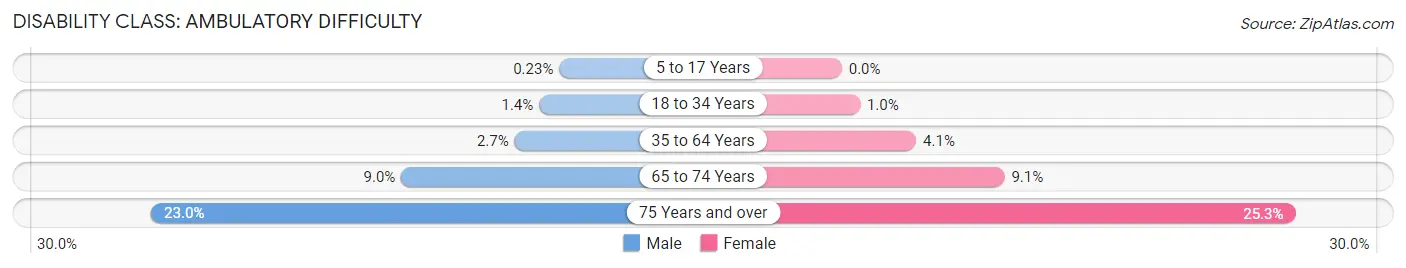
| Age Bracket | Male | Female |
| 5 to 17 Years | 61 (0.2%) | 0 (0.0%) |
| 18 to 34 Years | 719 (1.3%) | 515 (1.0%) |
| 35 to 64 Years | 1,729 (2.7%) | 2,607 (4.1%) |
| 65 to 74 Years | 1,584 (9.0%) | 1,718 (9.1%) |
| 75 Years and over | 2,116 (23.0%) | 3,087 (25.3%) |
Disability Class: Self-Care Difficulty
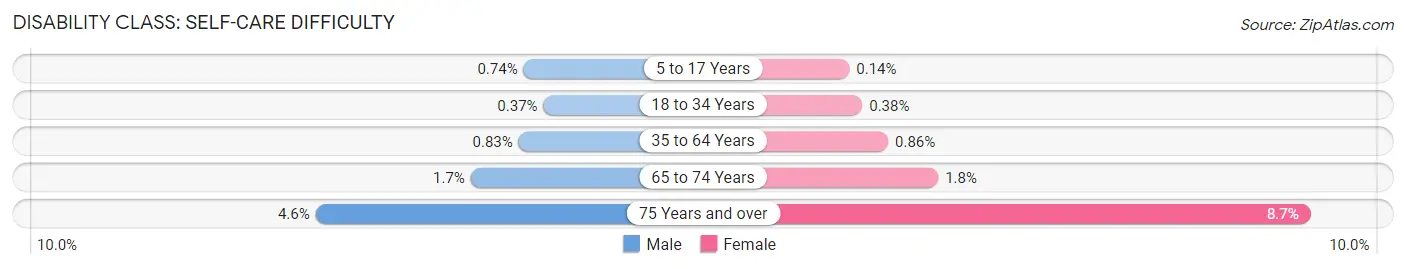
| Age Bracket | Male | Female |
| 5 to 17 Years | 195 (0.7%) | 34 (0.1%) |
| 18 to 34 Years | 196 (0.4%) | 196 (0.4%) |
| 35 to 64 Years | 531 (0.8%) | 542 (0.9%) |
| 65 to 74 Years | 302 (1.7%) | 340 (1.8%) |
| 75 Years and over | 424 (4.6%) | 1,063 (8.7%) |
Technology Access in Larimer County
Computing Device Access in Larimer County
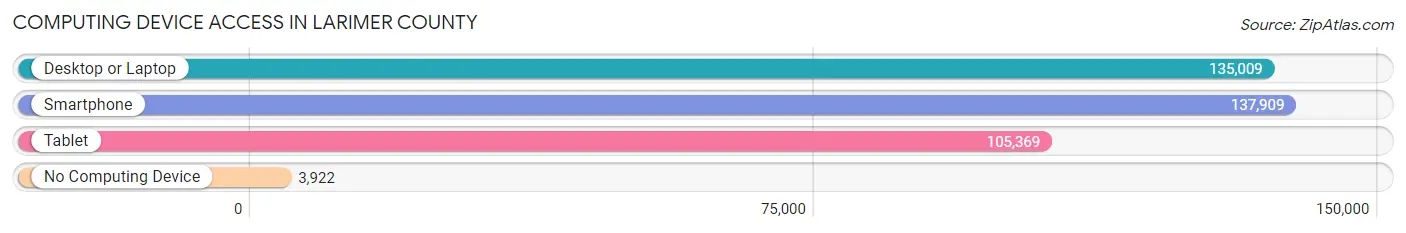
| Device Type | # Households | % Households |
| Desktop or Laptop | 135,009 | 90.7% |
| Smartphone | 137,909 | 92.6% |
| Tablet | 105,369 | 70.8% |
| No Computing Device | 3,922 | 2.6% |
| Total | 148,851 | 100.0% |
Internet Access in Larimer County
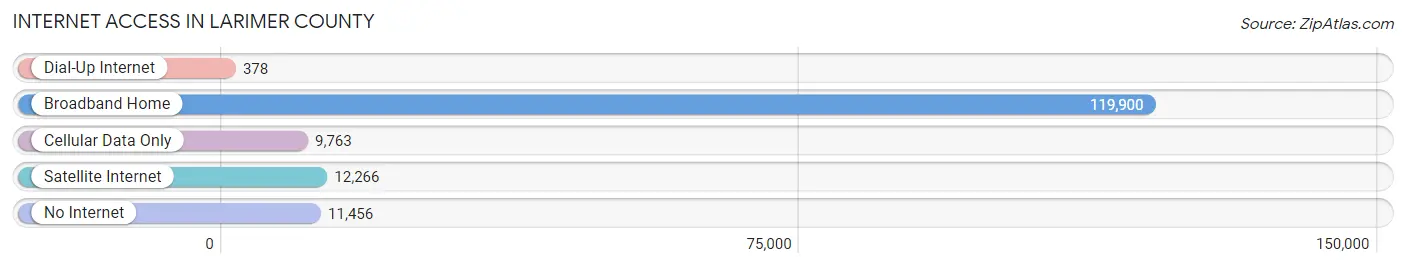
| Internet Type | # Households | % Households |
| Dial-Up Internet | 378 | 0.3% |
| Broadband Home | 119,900 | 80.5% |
| Cellular Data Only | 9,763 | 6.6% |
| Satellite Internet | 12,266 | 8.2% |
| No Internet | 11,456 | 7.7% |
| Total | 148,851 | 100.0% |
Larimer County Summary
Larimer County is located in the north-central region of Colorado, and is one of the 64 counties in the state. It is bordered by Weld County to the north, Boulder County to the east, Jefferson County to the south, and Jackson County to the west. The county seat is Fort Collins, and the county has a population of approximately 350,000 people.
History
Larimer County was established in 1861 as one of the original 17 counties in the Colorado Territory. It was named after William Larimer, Jr., a prominent figure in the early settlement of the area. The county was originally home to the Arapaho and Ute Native American tribes, and was later settled by European immigrants in the mid-1800s. The county was primarily used for ranching and farming, and the first railroad line was built in 1877.
In the early 1900s, the county began to experience rapid growth due to the discovery of oil and gas in the area. This led to the development of several towns, including Fort Collins, Loveland, and Estes Park. The county also experienced a population boom due to the influx of people from the Dust Bowl in the 1930s.
Geography
Larimer County covers an area of 2,640 square miles, making it the seventh largest county in Colorado. The county is located in the Front Range of the Rocky Mountains, and is home to several mountain ranges, including the Mummy Range, the Never Summer Range, and the Medicine Bow Range. The county is also home to several rivers, including the Cache la Poudre River, the Big Thompson River, and the North Platte River.
The county has a diverse landscape, ranging from high mountain peaks to rolling plains. The highest point in the county is Mount McConnel, which has an elevation of 12,943 feet. The lowest point is the South Platte River, which has an elevation of 4,922 feet.
Economy
Larimer County has a diverse economy, with a mix of agriculture, manufacturing, and service industries. The county is home to several large employers, including Hewlett-Packard, Anheuser-Busch, and Agilent Technologies. The county is also home to several universities, including Colorado State University, the University of Northern Colorado, and Front Range Community College.
Agriculture is an important part of the county’s economy, and the county is home to several large farms and ranches. The county is also home to several wineries, breweries, and distilleries.
Demographics
As of the 2010 census, Larimer County had a population of 299,630 people. The population is fairly diverse, with the largest ethnic groups being White (83.3%), Hispanic or Latino (10.2%), and Asian (3.2%). The median household income in the county is $60,845, and the median home value is $269,400.
The county is home to several large cities, including Fort Collins, Loveland, and Estes Park. The county also has several smaller towns, including Berthoud, Wellington, and Windsor. The county is served by several school districts, including the Poudre School District, Thompson School District, and Estes Park School District.
Common Questions
What is the Total Population of Larimer County?
Total Population of Larimer County is 359,363.
What is the Total Male Population of Larimer County?
Total Male Population of Larimer County is 180,193.
What is the Total Female Population of Larimer County?
Total Female Population of Larimer County is 179,170.
What is the Ratio of Males per 100 Females in Larimer County?
There are 100.57 Males per 100 Females in Larimer County.
What is the Ratio of Females per 100 Males in Larimer County?
There are 99.43 Females per 100 Males in Larimer County.
What is the Median Population Age in Larimer County?
Median Population Age in Larimer County is 36.3 Years.
What is the Average Family Size in Larimer County
Average Family Size in Larimer County is 2.8 People.
What is the Average Household Size in Larimer County
Average Household Size in Larimer County is 2.4 People.
What is Per Capita Income in Larimer County?
Per Capita income in Larimer County is $46,676.
What is the Median Family Income in Larimer County?
Median Family Income in Larimer County is $112,985.
What is the Median Household income in Larimer County?
Median Household Income in Larimer County is $87,199.
What is Income or Wage Gap in Larimer County?
Income or Wage Gap in Larimer County is 36.9%.
Women in Larimer County earn 63.1 cents for every dollar earned by a man.
What is Family Income Deficit in Larimer County?
Family Income Deficit in Larimer County is $11,021.
Families that are below poverty line in Larimer County earn $11,021 less on average than the poverty threshold level.
What is Inequality or Gini Index in Larimer County?
Inequality or Gini Index in Larimer County is 0.45.
How Large is the Labor Force in Larimer County?
There are 201,845 People in the Labor Forcein in Larimer County.
What is the Percentage of People in the Labor Force in Larimer County?
67.3% of People are in the Labor Force in Larimer County.
What is the Unemployment Rate in Larimer County?
Unemployment Rate in Larimer County is 4.6%.